Inforiver

Upcoming webinar on 'Inforiver Charts : The fastest way to deliver stories in Power BI', Aug 29th , Monday, 10.30 AM CST.    Register Now

Upcoming webinar on 'Inforiver Charts : The fastest way to deliver stories in Power BI', Aug 29th , Monday, 10.30 AM CST.    Register Now

Storytelling Chart

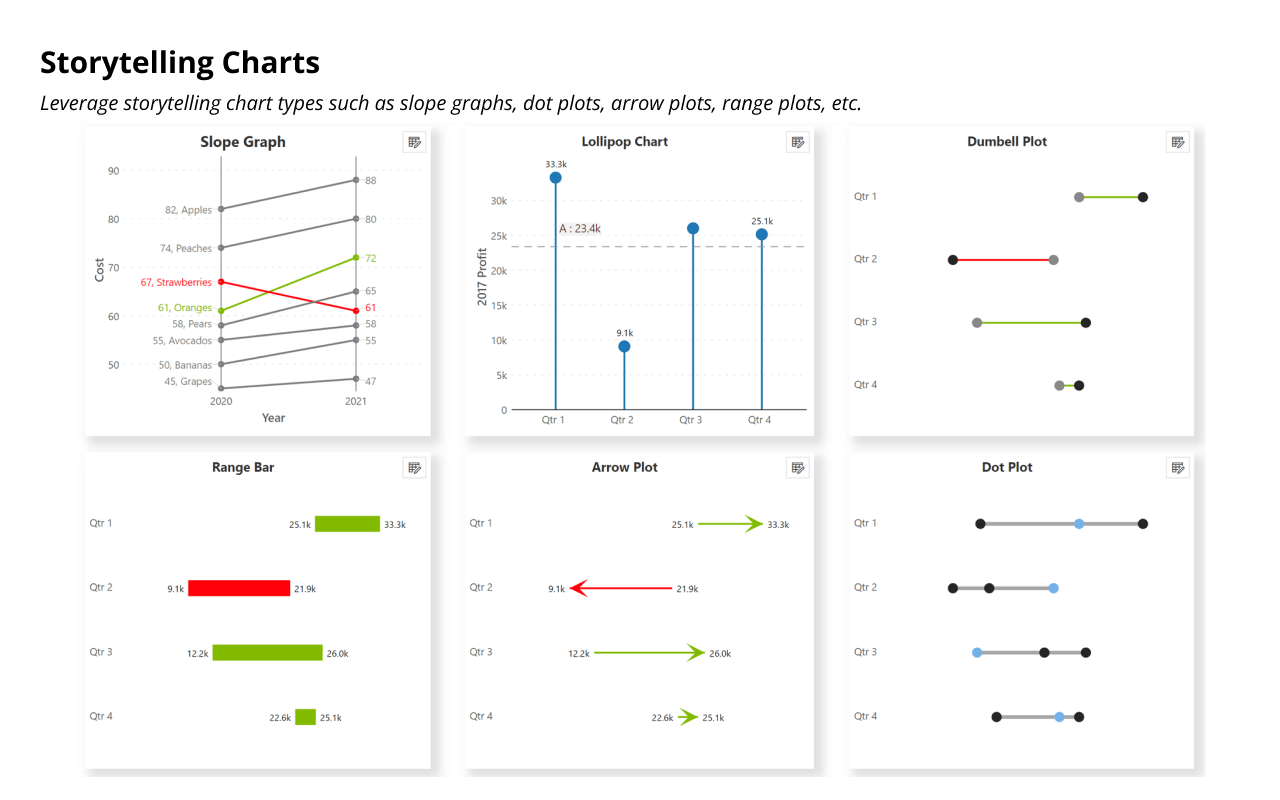
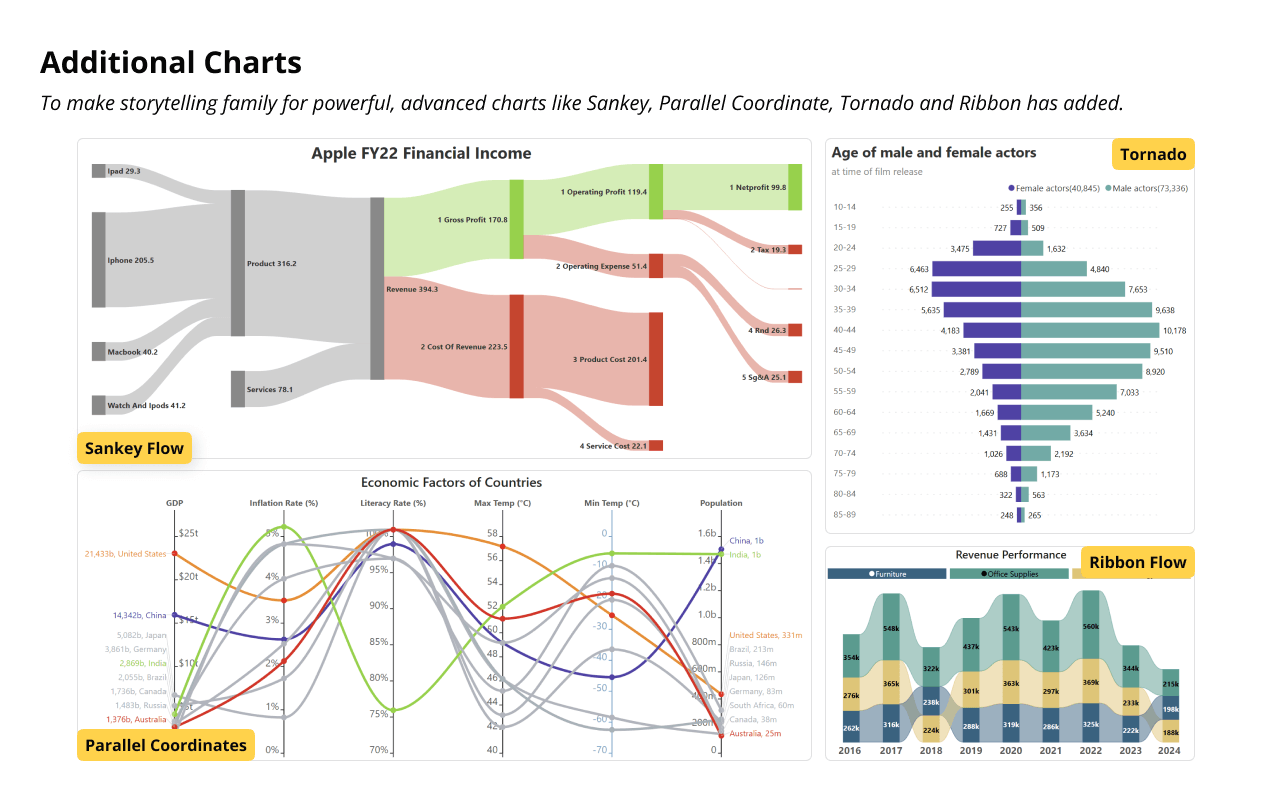
Inforiver Analytics+ Storytelling Chart is a powerful custom visual suite for Power BI, designed to help you create compelling, media-ready charts with ease. It includes a rich collection of over 15 chart types, such as dot plots, arrow plots, lollipop charts, range bars, ribbons, Sankey diagrams, slope charts, parallel coordinates, tornado charts, and more.

With advanced customization features like conditional formatting, trellis views, analytics tools, filter context, and annotations, ensuring you get the best insights from your data.

Learn more about what Inforiver Analytics+ Storytelling Suite can do.
Download PBIX
Dumbell Column/Bar
Dot Plot Column/Bar
Range Plot Column/Bar
Arrow Plot Column/Bar
Ribbon Chart
Slope Graph
Parallel Coordinates
Lollipop Plot
Tornado Chart
Sankey Flow
iframe preview
View interactive content

Key features

Wide range of chart types

Wide Range of Chart Types

Access 15+ storytelling charts tailored for data visualization.
Orientation

Orientation

Display charts in horizontal or vertical layouts for better readability.
Conditional formatting

Conditional Formatting

Apply different colors to highlight data based on business rules.
Advanced trellis support

Advanced Trellis Support

Create multi-level small multiples with up to three axes.
Built-in Analytics statistics

Built-in Analytics & Statistics

Provide insights with deviation bar, error bars, reference lines and bands.
Data label customization

Data Label Customization

Customize data labels with multiple styling options.
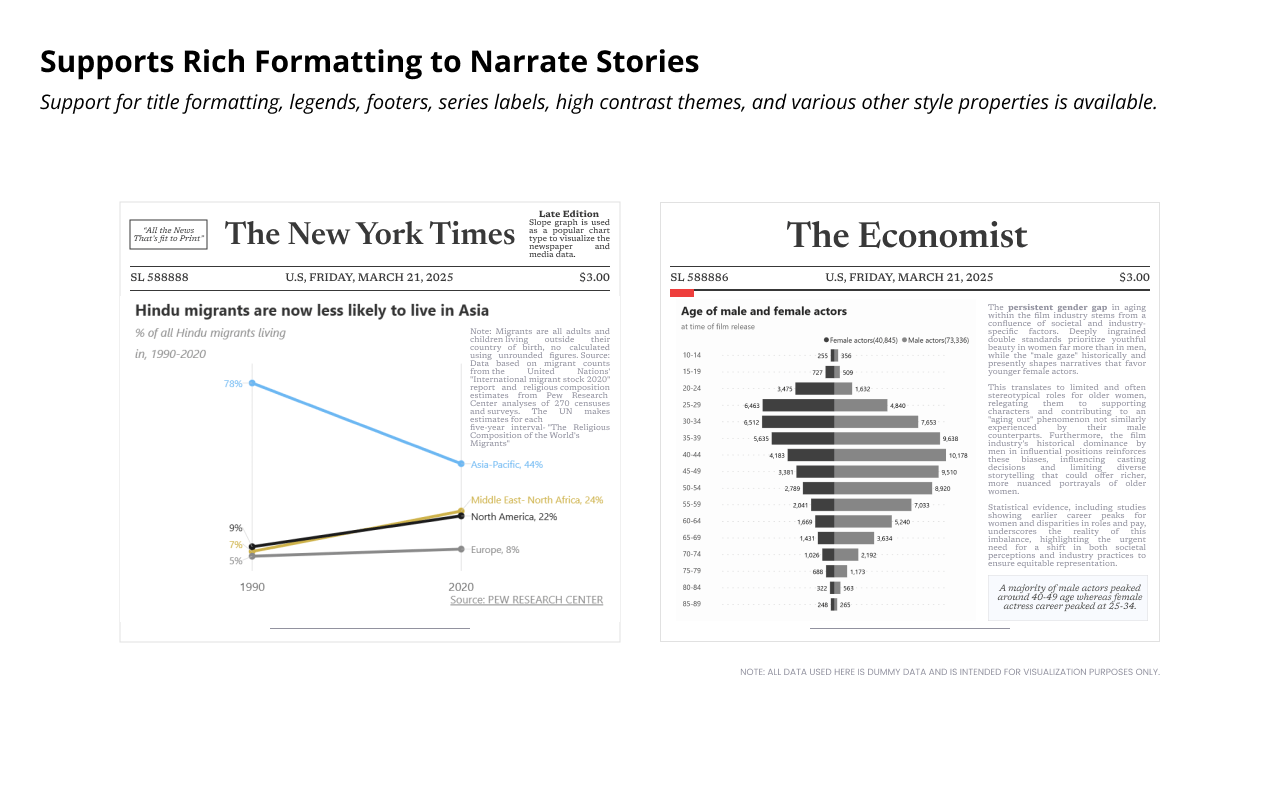
Rich formatting

Rich Formatting

Features include ranking, sorting, legends, number formatting, aggregation, conditional formatting, axis breaks, and pixel-perfect export to PDF.

Ranking

Filter top/bottom N values dynamically, with an option to group the remaining as “Others.”
Dumbell
Dot plot
Range Bar
Arrow plot
Ribbon
Slope Graph
Parallel Coordinates
Lollipop
Tornado
Sankey
A Dumbbell chart is an effective visualization tool used to compare two values, such as Actuals and Plan across a categorical axis like Month. Each category displays two markers connected by a line, resembling a dumbbell, which clearly highlights the difference or change between the two values.
This chart type is particularly useful in performance tracking, forecast vs. actual analysis, and before-and-after comparisons, making it a powerful component in data storytelling within Inforiver
Try for FREE
inforiver-story-telling-chart-dumbell-chart

Key features

orientation

Orientation

Choose between vertical or horizontal orientation to best suit your report layout.
inforiver-storytelling-chart-dumbell-dual-value-comparison

Dual-Value Comparison

Visualize performance dual values such gaps or progress over time.
inforiver-storytelling-chart-dumbell-custom-marker-styling

Rounded Edges

Add a modern and polished look to the connecting lines between markers.
inforiver-story-telling-chart-dumbbell-rounded-edges

Custom Marker Styling

Personalize marker shape, color, and size to enhance clarity
inforiver-story-telling-chart-dumbell-variance

Variance

Highlights the gap or change between the two values.
inforiver-story-telling-chart-dumbell-small-multiples

Trellis Support

Get trellis support with multi-level hierarchy, grid layouts, axis scaling and more.

Resources

A Dot Plot is a minimalist and effective data visualization that uses dots to represent individual data points along a single axis. It is particularly useful for visualizing distribution, frequency, and concentration of values across categories.
This chart type is ideal for comparing multiple values across categories while maintaining a clean, uncluttered visual that emphasizes data density and variation.
Try for FREE
inforiver-story-telling-chart-dot-plot

Key features

inforiver-story-telling-chart-dot-plot-orientation

Orientation

Choose between vertical or horizontal orientation to best suit your report layout.
inforiver-story-telling-chart-dot-plot-marker-and-target-formatting

Marker Customization

Choose from various marker shapes and styles, with full color control for each data series.
inforiver-story-telling-chart-dot-plot-data-labels

Data Labels

Display measure-based labels directly on the plot for enhanced readability
inforiver-story-telling-chart-dot-plot-connector-line

Connector Line

Option to start connector lines from the axis, improving alignment and visual flow.
inforiver-story-telling-chart-dot-plot-conditional-formatting

Conditional Formatting

Apply rule-based or color scale formatting to highlight key data points or thresholds dynamically.
inforiver-story-telling-chart-dot-plot-small-multiples

Trellis Support

Get trellis support with multi-level hierarchy, grid layouts, axis scaling and more.

Resources

A Range Bar chart is a powerful visualization used to depict the variance between two values, such as Sales and COGS, across categories like Country. Unlike time-based charts, range bars focus on the magnitude of difference, making them ideal for illustrating growth, decline, or deviation in performance metrics.
This chart type is especially effective for financial analysis, profitability tracking, and variance reporting, offering a clean and intuitive way to communicate differences between two metrics.
Try for FREE
inforiver-story-telling-chart-range-bar

Key features

inforiver-story-telling-chart-range-plot-orientation

Orientation

Supports both vertical and horizontal layouts for flexible dashboard design.
inforiver-story-telling-chart-range-plot-bar-customization

Bar Customization

Choose from solid, dotted, or dashed bar styles, with optional rounded edges for a softer visual appearance.
inforiver-story-telling-chart-range-plot-variance-fill-patterns-&-coloring

Variance Fill Patterns & Coloring

Select solid, outline, or hatched fill styles to distinguish variance zones, and apply custom colors to represent positive or negative changes.
inforiver-story-telling-chart-range-plot-data-labels

Data Labels

Display measure-based labels directly on the bars for quick interpretation.
inforiver-story-telling-chart-range-plot-annotation

Annotations

Add annotations to provide context, commentary, or highlight key insights.
inforiver-story-telling-chart-range-plot-advanced-analytics

Analytics

Use Analytics options to enable deeper insights, such as thresholds, benchmarks, or trend lines.

Resources

An Arrow Plot is a visual used to represent the direction and magnitude of change between exactly two data points. The direction of the arrow, pointing upward or downward, indicates whether the change is positive or negative, while the length of the arrow reflects the size of that change. The position of each arrow is determined by the absolute values of the data points, ensuring accurate alignment along the axis. This type of chart is particularly effective for quickly conveying both the trend and scale of change in a compact and intuitive format.
Try for FREE
inforiver-story-telling-chart-arrow-plot

Key features

inforiver-story-telling-chart-arrowplot-orientation

Orientation

Supports both horizontal and vertical layouts to suit different reporting needs.
inforiver-story-telling-chart-arrowplot-data-labels

Data Labels

Display category and value labels on the first and last axes.
inforiver-story-telling-chart-arrowplot-conditional-formatting

Conditional Formatting

Apply rule-based or color scale formatting to highlight significant changes or thresholds.
inforiver-story-telling-chart-arrowplot-lollipop-advanced-analytics

Analytics

Use Analytics options to enable deeper insights, such as thresholds, benchmarks, or trend lines.
inforiver-story-telling-chart-arrowplot-legend-formatting

Legend Formatting

Show legend with proper marker styling to make visual clearer.
inforiver-story-telling-chart-arrow-plot-small-multiples

Trellis Support

Get trellis support with multi-level hierarchy, grid layouts, axis scaling and more.

Resources

A Ribbon Chart is a dynamic visualization used to show how the rank or value of different categories changes over time. It is particularly effective when the relative positioning of categories is important, such as tracking market share, sales rankings, or performance tiers.
Unlike stacked charts, ribbon charts do not maintain a fixed order of categories. Instead, they allow the ribbons to flow and shift based on changing values, making it easier to observe rank transitions and volume changes over time.
Try for FREE
inforiver-story-telling-chart-ribbon-chart

Key features

inforiver-story-telling-chart-ribbon-flow-customization

Ribbon Flow Customization

Control the opacity, color, and border of ribbons to enhance visual clarity and storytelling.
inforiver-story-telling-chart-ribbon-styling

Styling

Choose from solid, dotted, or dashed styles and adjust spacing between ribbons for better readability.
inforiver-story-telling-chart-ribbon-axis-configuration

Axes Configuration

Full control over X and Y axis properties, including scaling, labels, and formatting.
inforiver-story-telling-chart-ribbon-data-labels

Data Labels

Apply series-level and measure-level formatting to show precise values or percentages.
inforiver-story-telling-chart-ribbon-conditional-formatting

Conditional Formatting

Highlight key changes using rule-based or color scale formatting to draw attention to trends or thresholds.
inforiver-story-telling-chart-ribbon-legend-&-series-labels

Legend & Series Labels Customization

Customize marker style, alignment, formatting options and display category names for a clean and informative look.

Resources

A Slope Graph (also known as a Slope Chart) is a sleek and effective data visualization designed to show changes between two points, typically across time or between two distinct conditions. It is especially useful for highlighting directional trends, ranking shifts, and performance comparisons in a compact and visually intuitive format.
Try for FREE
inforiver-story-telling-chart-slope-graph

Key features

inforiver-story-telling-chart-slope-graph-trend-coloring

Trend Coloring

Automatically highlight upward and downward trends using customizable colors to emphasize positive or negative changes.
inforiver-story-telling-chart-slope-graph-line-and-marker-customization

Line and Marker Customization

Choose from solid, dotted, or dashed line styles and various marker shapes (circle, square, diamond) to tailor the visual appearance.
inforiver-story-telling-chart-slope-graph-conditional-formatting

Connector Lines, Vertical Axis & Series labels

Clearly connect data points across two categories with vertical axis support and connector lines for easy comparison.
inforiver-story-telling-chart-slope-graph-data-labels

Data Labels

Display measure values and category names directly on the graph for clarity and context.
inforiver-story-telling-chart-slope-graph-conditional-formatting

Conditional Formatting

Apply rule-based or color scale formatting to highlight significant changes or thresholds.
inforiver-story-telling-chart-slope-graph-trellis-small-multiple

Trellis Support

Get trellis support with multi-level hierarchy, grid layouts, axis scaling and more.

Resources

A Parallel Coordinates Chart is a powerful visualization tool designed for exploring and analyzing high-dimensional datasets. Each variable is represented as a vertical axis, and each data point is plotted as a line that intersects each axis at the corresponding value. This format makes it easy to detect patterns, correlations, and outliers across multiple variables simultaneously.
This chart type is ideal for data exploration, multivariate comparisons, and interactive storytelling, offering a compact yet comprehensive view of complex datasets.
Try for FREE
inforiver-story-telling-chart-parallel-coordinates

Key features

inforiver-story-telling-chart-parallel-coordinates-multi-axis-representation

Multi-Axis Representation

Plot each measure on its own vertical axis for simultaneous comparison across multiple variables.
inforiver-story-telling-chart-parallel-coordinates-axis-scaling

Axis Scaling

Choose between individual scaling for customizing each Y-axis (linear or log) or uniform scaling to apply a consistent scale across all measures.
inforiver-story-telling-chart-sankey-data-labels

Data Labels

Display category and value labels on the first and last axes.
inforiver-story-telling-chart-parallel-coordinates-tick-line-customization

Tick Line Customization

Define tick line visibility and length for enhanced axis readability.
inforiver-story-telling-chart-parallel-conditional-formatting

Conditional Formatting

Apply rule-based or color scale formatting to highlight trends, anomalies, or thresholds.
inforiver-story-telling-chart-parallel-coordinates-small-multiples

Trellis Support

Break down the chart with an additional dimension to create small multiples, enabling focused comparisons across subgroups.

Resources

A Lollipop Chart is a sleek variation of a bar chart where each bar is replaced by a line with a dot at the end, resembling a lollipop. This format simplifies data presentation, making it ideal for comparing individual data points, ranking, highlighting outliers, and visualizing survey results.
This chart type is perfect for data storytelling, offering a clean and engaging way to present trends and comparisons with minimal visual clutter.
Try for FREE
inforiver-story-telling-chart-lollipop

Key features

inforiver-story-telling-chart-lollipop-orientation

Orientation

Supports both vertical and horizontal layouts for flexible dashboard design.
inforiver-story-telling-chart-lollipop-axes-configuration

Axes Configuration

Configure both X and Y axis properties for precise formatting.
inforiver-story-telling-chart-lollipop-styling

Styling

Customize line styles and marker shapes. Enable individual marker colors for category-specific styling.
inforiver-story-telling-chart-lollipop-dynamic-deviation

Dynamic Deviation

Plot comparisons between two categories to highlight differences visually.
inforiver-story-telling-chart-lollipop-data-labels

Data Labels

Apply series-level and measure-level formatting for clear value display.
inforiver-story-telling-chart-lollipop-analytics

Analytics

Add reference lines, bands, error bars, total bars, average bars, and trend lines for deeper insights.

Resources

A Tornado Chart is a powerful visualization tool used for side-by-side comparison of two data sets, making it especially effective in sensitivity analysis, risk assessment, and decision-making. It helps stakeholders quickly identify which categories have the greatest impact on outcomes by visualizing the magnitude and direction of change.
This chart type is ideal for comparing actual vs. planned performance, evaluating risk factors, and prioritizing decisions based on impact.
Try for FREE
inforiver-story-telling-chart-tornado

Key features

inforiver-story-telling-chart-tornado-dual-axis-analysis

Dual-Axis Analysis

Supports individual scaling for both axes, enabling precise comparison of two measures.
inforiver-story-telling-chart-tornado-x-axis-centering

Axis Position

Offers Axis positioning options such as left, right, or centered to enhance visual balance and improve interpretability.
inforiver-story-telling-chart-tornado-customization-options

Customization Options

Choose from solid, dotted, or dashed line styles and marker shapes (circle, square, diamond) for tailored visuals.
inforiver-story-telling-chart-tornado-data-labels

Data Label Formatting

Apply measure-specific formatting to display values clearly and consistently.
inforiver-story-telling-chart-tornado-conditional-formatting

Conditional Formatting

Highlight key differences using rule-based or color scale formatting.
inforiver-story-telling-chart-tornado-analytics

Analytics

Add reference lines, trend indicators, and other analytical elements for deeper insights

Resources

A Sankey Chart is a powerful visualization used to illustrate the flow of resources, data, or values between different stages or categories. It is especially effective for visualizing cash flows, revenue distribution, or resource allocation, where the width of the flow represents the magnitude of the transfer.
This chart type is ideal for visualizing complex relationships and quantifying transitions between categories, making it a go-to tool for flow analysis in business, finance, and operations.
Try for FREE
inforiver-story-telling-chart-sankey

Key features

inforiver-story-telling-chart-sankey-orientation

Orientation

Supports both horizontal and vertical layouts to suit different reporting needs.
inforiver-story-telling-chart-sankey-node-alignment-options

Node Alignment Options

Align nodes using Start, End, Center, or Justify for optimal layout control.
inforiver-story-telling-chart-sankey-interactive-flow-highlighting

Interactive Flow Highlighting

Customize hover behavior, including active/inactive flow opacity, to emphasize selected paths.
inforiver-story-telling-chart-sankey-color-customization

Color Customization

Control node and flow colors based on source, target, or gradient, enhancing visual storytelling.
inforiver-story-telling-chart-sankey-data-labels

Data Labels

Show on hover, built in data management options like ignore missing values, show blank labels and negative value handling.
inforiver-story-telling-chart-sankey-node-styling

Node Styling

Adjust node width, spacing, padding, and opacity for a clean and readable layout.

Resources

A Dumbbell chart is an effective visualization tool used to compare two values, such as Actuals and Plan across a categorical axis like Month. Each category displays two markers connected by a line, resembling a dumbbell, which clearly highlights the difference or change between the two values.
This chart type is particularly useful in performance tracking, forecast vs. actual analysis, and before-and-after comparisons, making it a powerful component in data storytelling within Inforiver Analytics+.
Try for FREE

Key features

Multiple chart types

Orientation

Choose between vertical or horizontal orientation to best suit your report layout.
IBCS compliant charts

Dual-Value Comparison

Visualize performance dual values such gaps or progress over time.
Auto sorting

Custom Marker Styling

Personalize marker shape, color, and size to enhance clarity.
Upto 50 measures

Rounded Edges

Add a modern and polished look to the connecting lines between markers.
Referernce line and band

Variance

Highlights the gap or change between the two values.
Deviation line

Trellis Support

Get trellis support with multi-level hierarchy, grid layouts, axis scaling and more.

Resources

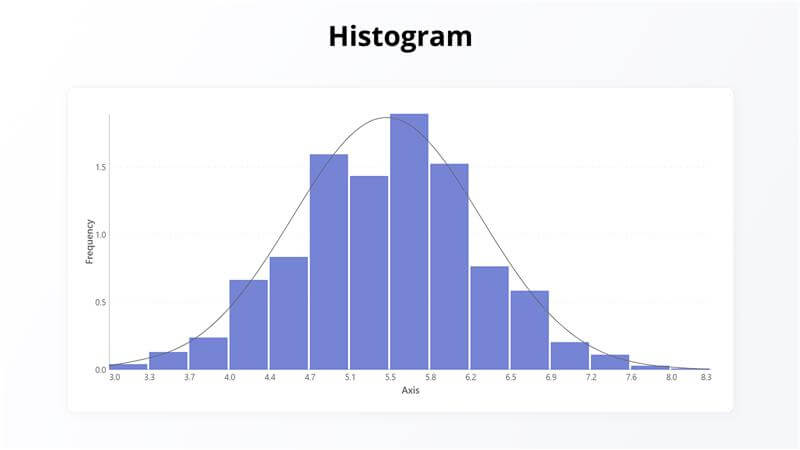
Histogram: A Histogram helps showcase the frequency of data for a continuous axis.
Inforiver Analytics+ Histograms offer three types: simple, cumulative, and stacked. Advanced features include axes binning & grouping, Pareto line, and normal distribution curve.
Try for FREE

Key features

Dynamic Bin Sizing:

Automatically adjusts bin width based on data range or custom user input for more accurate data grouping.

Cumulative Bar

Displays the running total of data points as bars accumulate.

Stacked Histogram

Show the distribution of multiple stacked groups together. Use legend to display different values.
Upto 50 measures

Overflow and Underflow

Group end and start point of axis values with a defined custom value.

Normal Distribution Curve

Analytics series support normal distribution curve to read the symmetry of data.
Deviation line

Bin by size and value

Groups x-axis with number of bins or by value ranges.

Mean and Mode Support

Plot and highlight vertical reference for Mean as average and Mode and maximum point within data.

Resources

Docs
Documentations
Comprehensive guides and techinical specifications
Blogs
Blogs
Latest inisights, product updates, and industry trends
Videos
Videos
Tutorials, features, highlights, and live product demo

Gallery

Show More
Show Less

Featured webinar

popup-popular-charts-for-storytelling

Popular charts for storytelling

Join this webinar for a wide-ranging exploration of different chart types and their uses, their role in effective data stories and a LIVE DEMO in Power BI on creating 50+ chart types with in-built storytelling customizations.
Watch now

Pricing

Get Storytelling chart family

Billed at
$9,995 Unlimited users
Buy storytelling chart family for your entire organization;
Buy now

Get the entire Analytics+ suite

Starts at
$3  /user/month (2 - 999 users)
$2.40  /user/month (1000+ users)
Buy all the 100+ Charts, KPI cards and Tables;
Buy now

Get Waterfall chart Family

Billed at

$9,995

/year
Buy waterfall chart family for your entire organization;
Buy now

Get storytelling chart family

Popular Storytelling Chart in Power BI

Explore all 50+ chart types that you can create in Power BI without using scripting or DAX.​

popular-charts-for-storytelling-mockup

Get Inforiver brochure

Maximize your business potential with Inforiver's paginated reporting, data entry, planning & budgeting capabilities
Download now
Inforiver

Inforiver helps enterprises consolidate planning, reporting & analytics on a single platform (Power BI). The no-code, self-service award-winning platform has been recognized as the industry’s best and is adopted by many Fortune 100 firms.

Inforiver is a product of Lumel, the #1 Power BI AppSource Partner. The firm serves over 3,000 customers worldwide through its portfolio of products offered under the brands Inforiver, EDITable, ValQ, and xViz.

linkedin facebook pinterest youtube rss twitter instagram facebook-blank rss-blank linkedin-blank pinterest youtube twitter instagram