Inforiver

Upcoming webinar on 'Inforiver Charts : The fastest way to deliver stories in Power BI', Aug 29th , Monday, 10.30 AM CST.    Register Now

Gantt Chart

Inforiver Analytics+ Gantt is a powerful, enterprise-grade Gantt visual for Power BI, designed to go beyond traditional project visuals. It offers two dedicated modes: Gantt for Project Management to plan, track, and visualize timelines, and Gantt Resource for detailed resource allocation, availability, and utilization analysis.

Packed with advanced features, the suite supports configurable milestones, task dependencies, conditional formatting, smart analytics, and multi-level timelines. Enjoy hierarchical task views, rich column configurations, flexible timeline granularity, and enhanced interactivity—empowering teams to gain deeper project and resource insights, all within a familiar Power BI environment.

Learn more about what Inforiver Analytics+ Gantt Chart can do.
Download PBIX
iframe preview
View interactive content

Key features

Dual Gantt Modes

Choose between Gantt Mode for Project View and Gantt Resource Mode for Resource.

Milestone Configuration

Support multiple milestones. Highlight key task events with customizable icons – choose from various shapes, colors, or custom images.

Dependency Connectors

Visualize task relationships with flexible connector lines, helping you track dependencies and sequencing with ease.

Advanced Analytics

Leverage reference lines and bands to enhance timeline clarity – use reference lines to mark key dates like “Go-Live” or today’s date, and reference bands to highlight sprints, testing phases, or blackout periods.

Multi-Level Timelines

Show up to 3 level timelines with YQMW order. Enable Gantt chart to offer both high-level context and detailed scheduling in a single view.

Zoom Configuration

Enable smooth zoom-in/out functionality with custom timeline resolution levels for better navigation across large projects.

Smart Alerting

Highlight critical tasks with conditionally formatted grids, custom status flags, and color-coded progress bars to ensure clear visibility and focus.

Planned vs. Actual

Easily compare planned vs. real-time progress with side-by-side scheduled and actual bars, all within the same timeline view – perfect for tracking baselines, identifying delays, and analyzing project performance.

Gallery

Pricing

Get Gantt Chart Family

Billed at
$48,000 Unlimited users
Buy Gantt chart family for your entire organization
Buy now

Get the entire Analytics+ suite

Starts at
$3  /user/month (2 - 999 users)
$2.40  /user/month (1000+ users)
Buy all the 100+ Charts, Gantt, KPI cards 
and Tables
Buy now

Get Waterfall chart Family

Billed at

$9,995

/year
Buy waterfall chart family for your entire organization;
Buy now

Get Inforiver brochure

Maximize your business potential with Inforiver's paginated reporting, data entry, planning & budgeting capabilities
Download now
Inforiver

Inforiver helps enterprises consolidate planning, reporting & analytics on a single platform (Power BI). The no-code, self-service award-winning platform has been recognized as the industry’s best and is adopted by many Fortune 100 firms.

Inforiver is a product of Lumel, the #1 Power BI AppSource Partner. The firm serves over 3,000 customers worldwide through its portfolio of products offered under the brands Inforiver, EDITable, ValQ, and xViz.
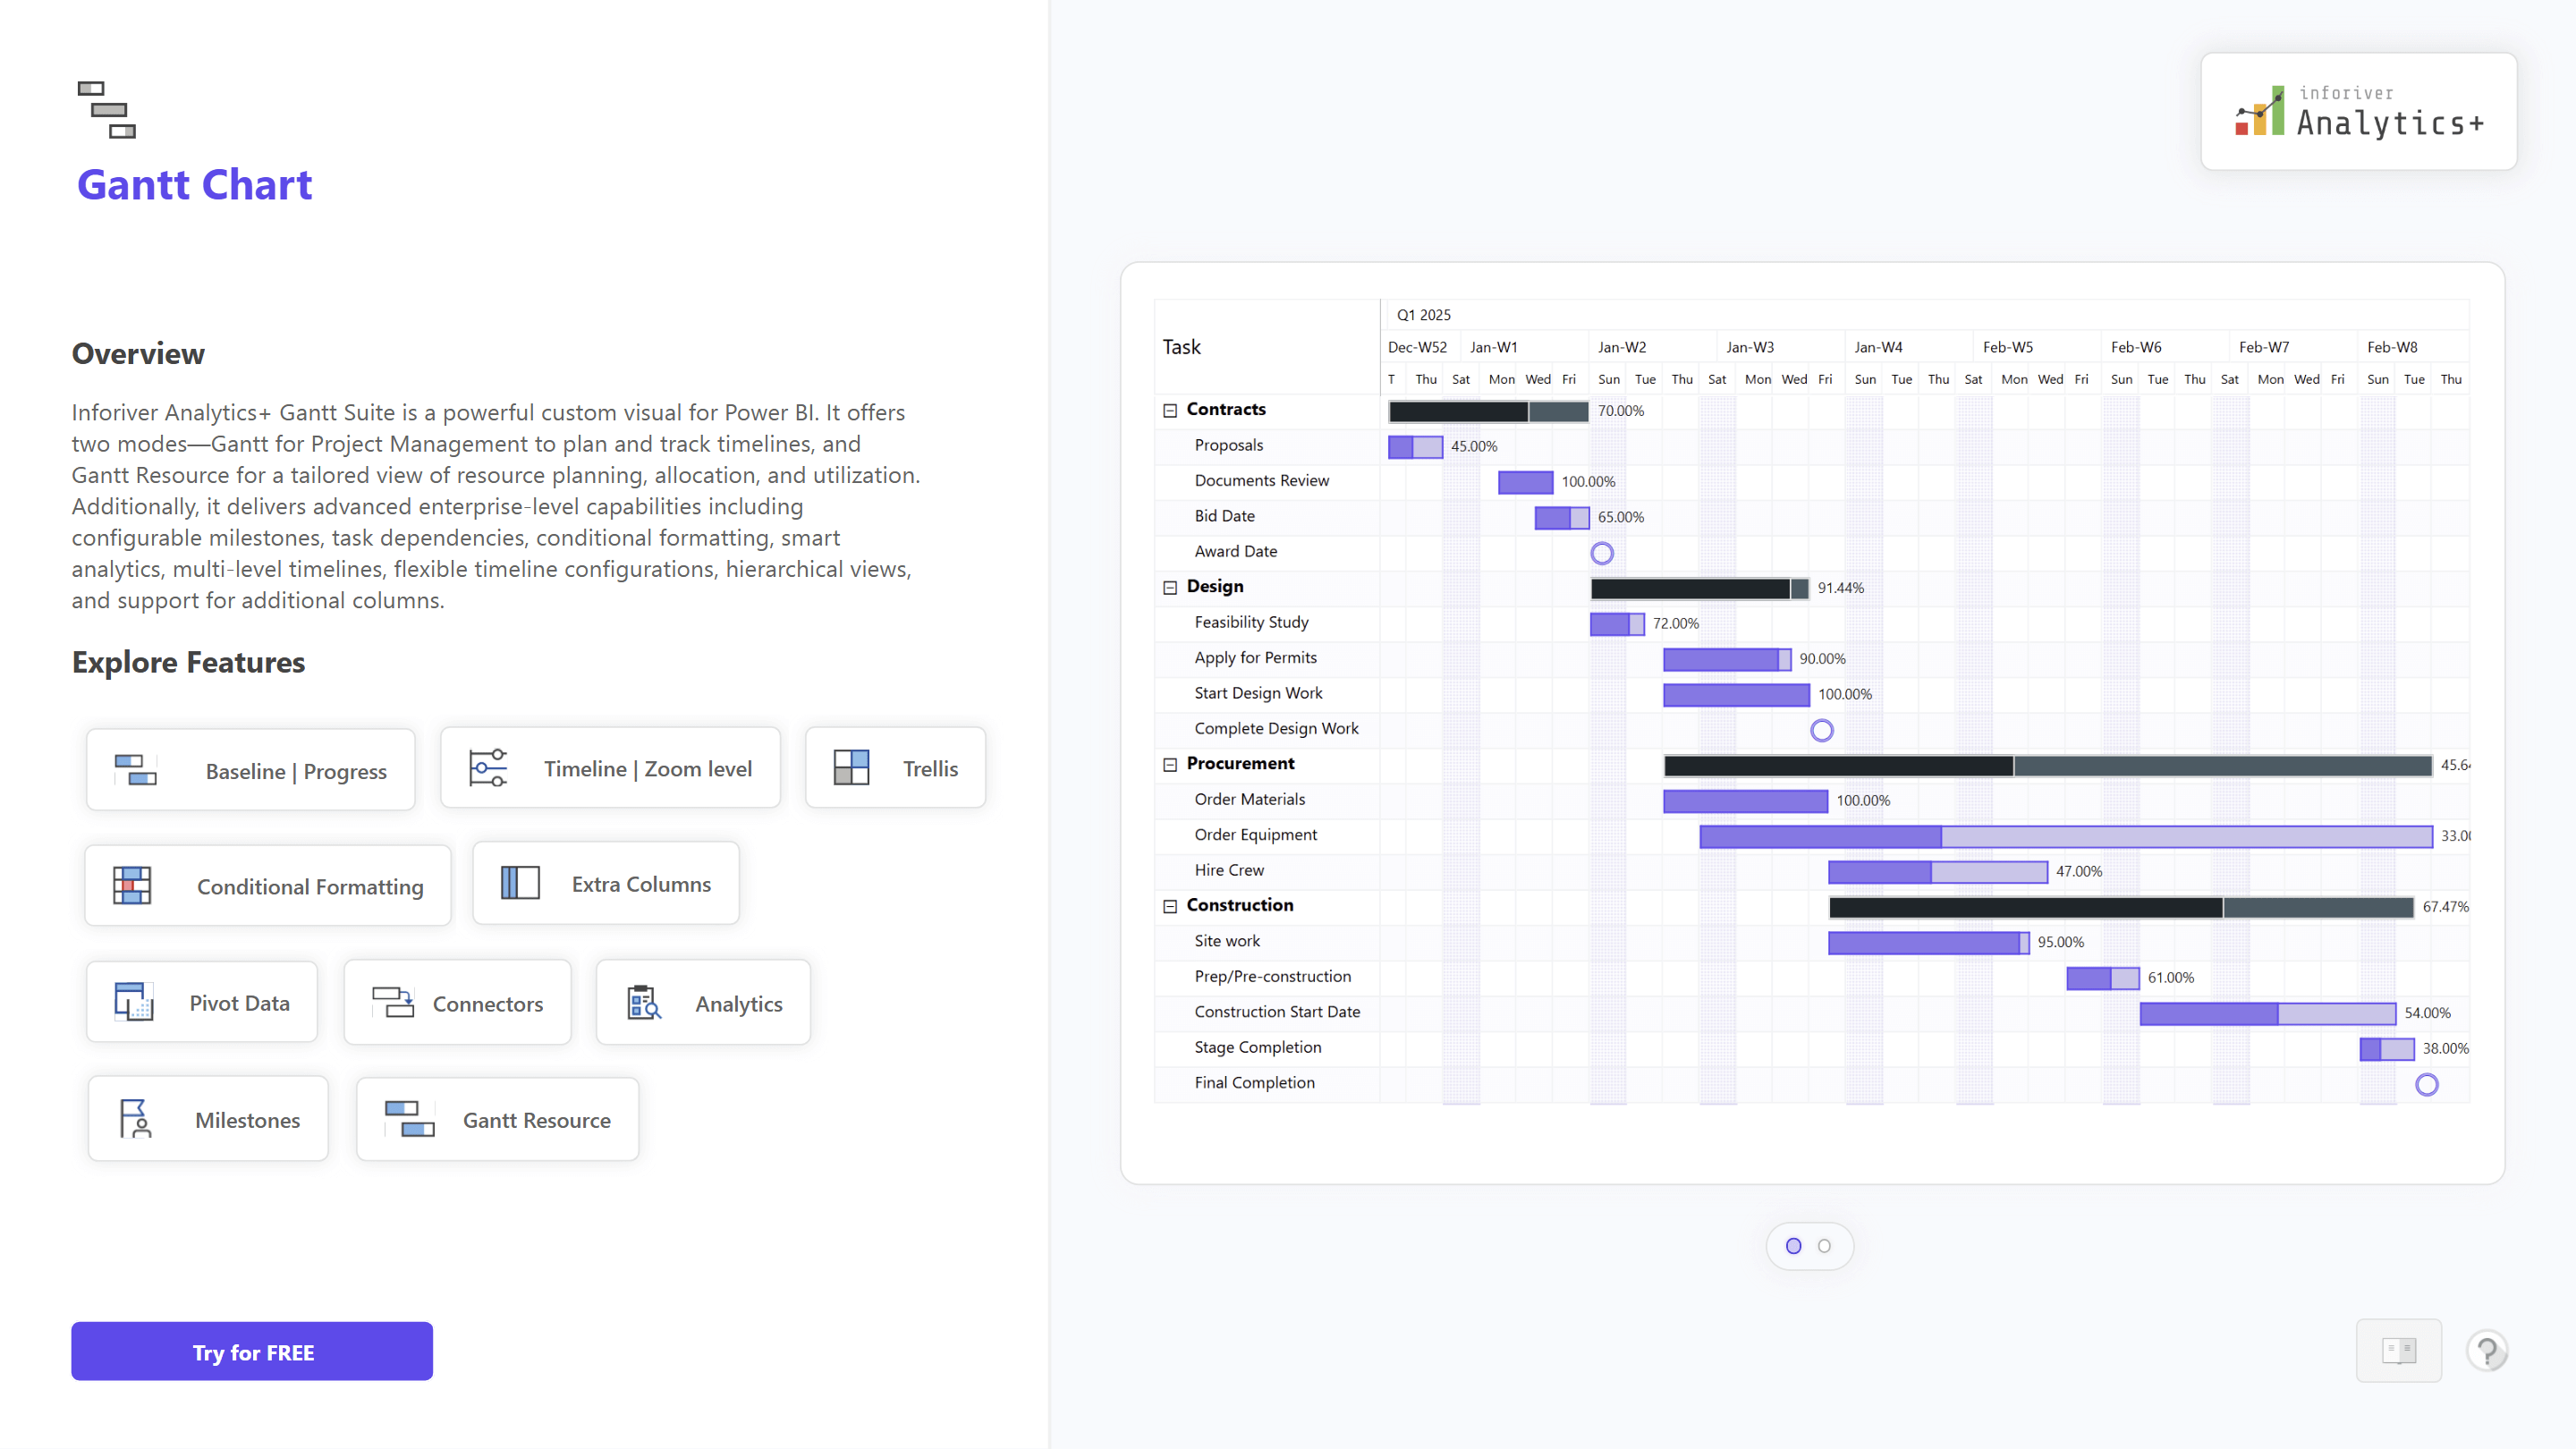
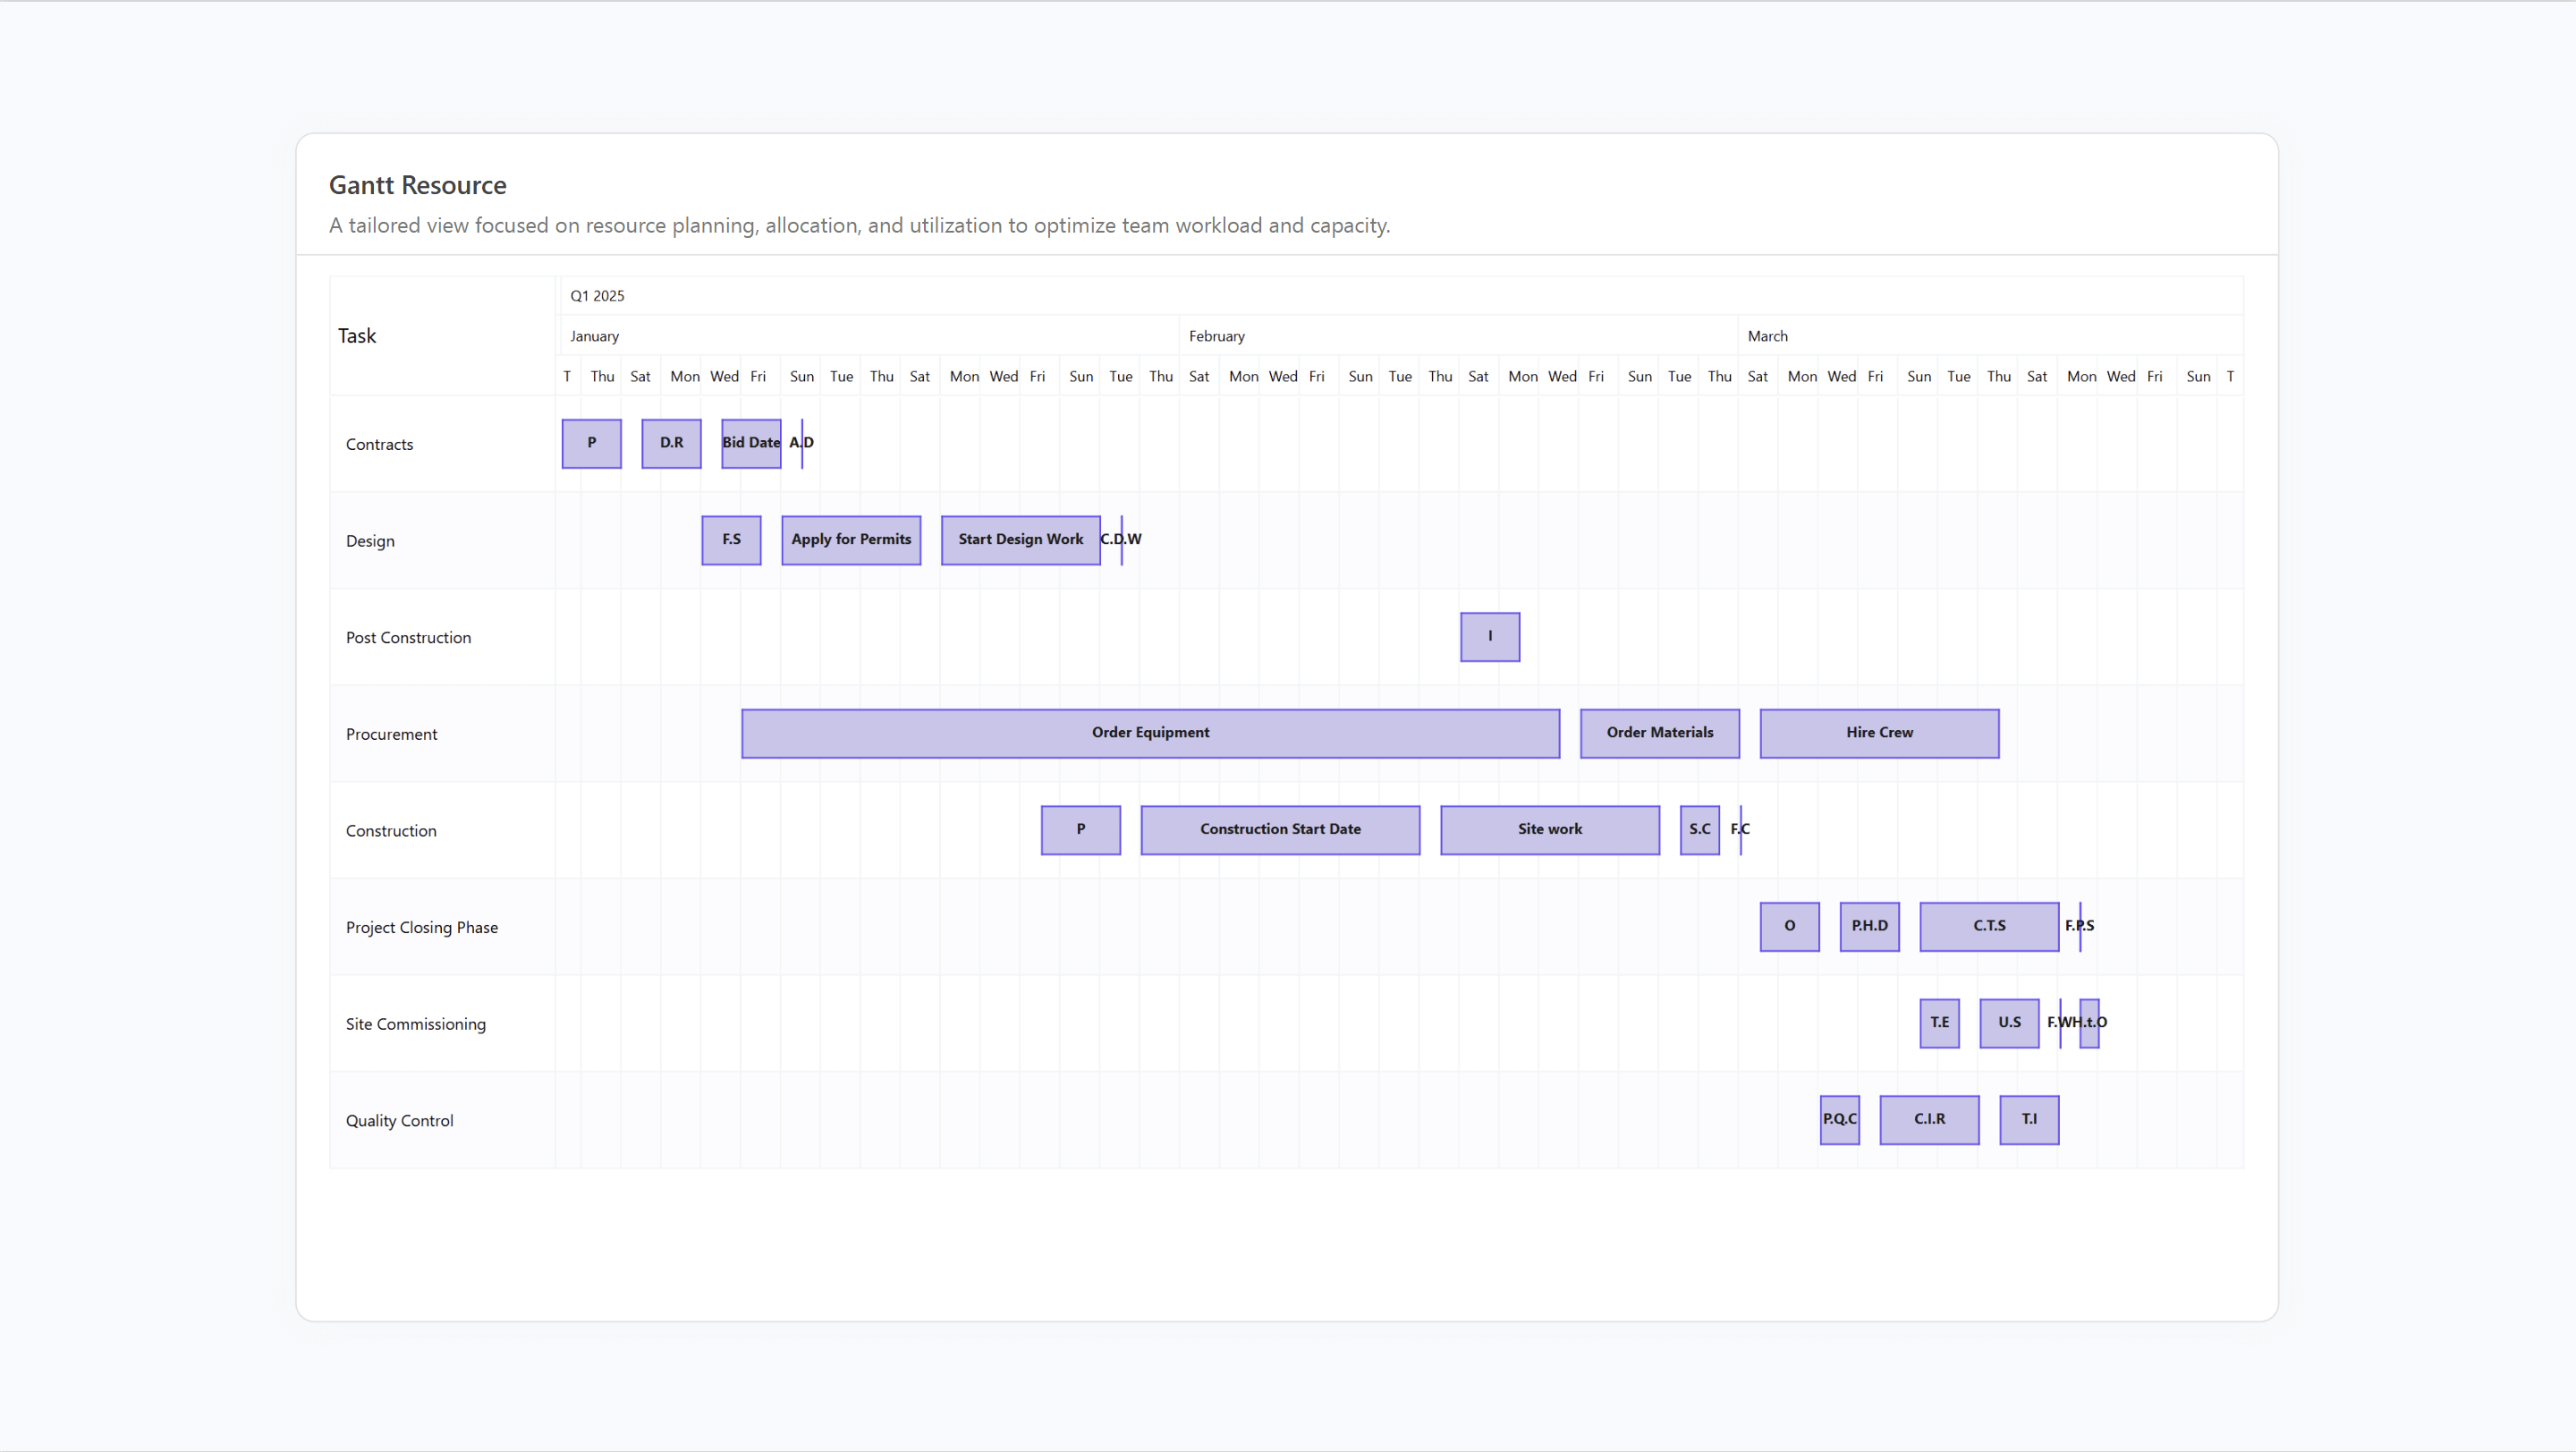
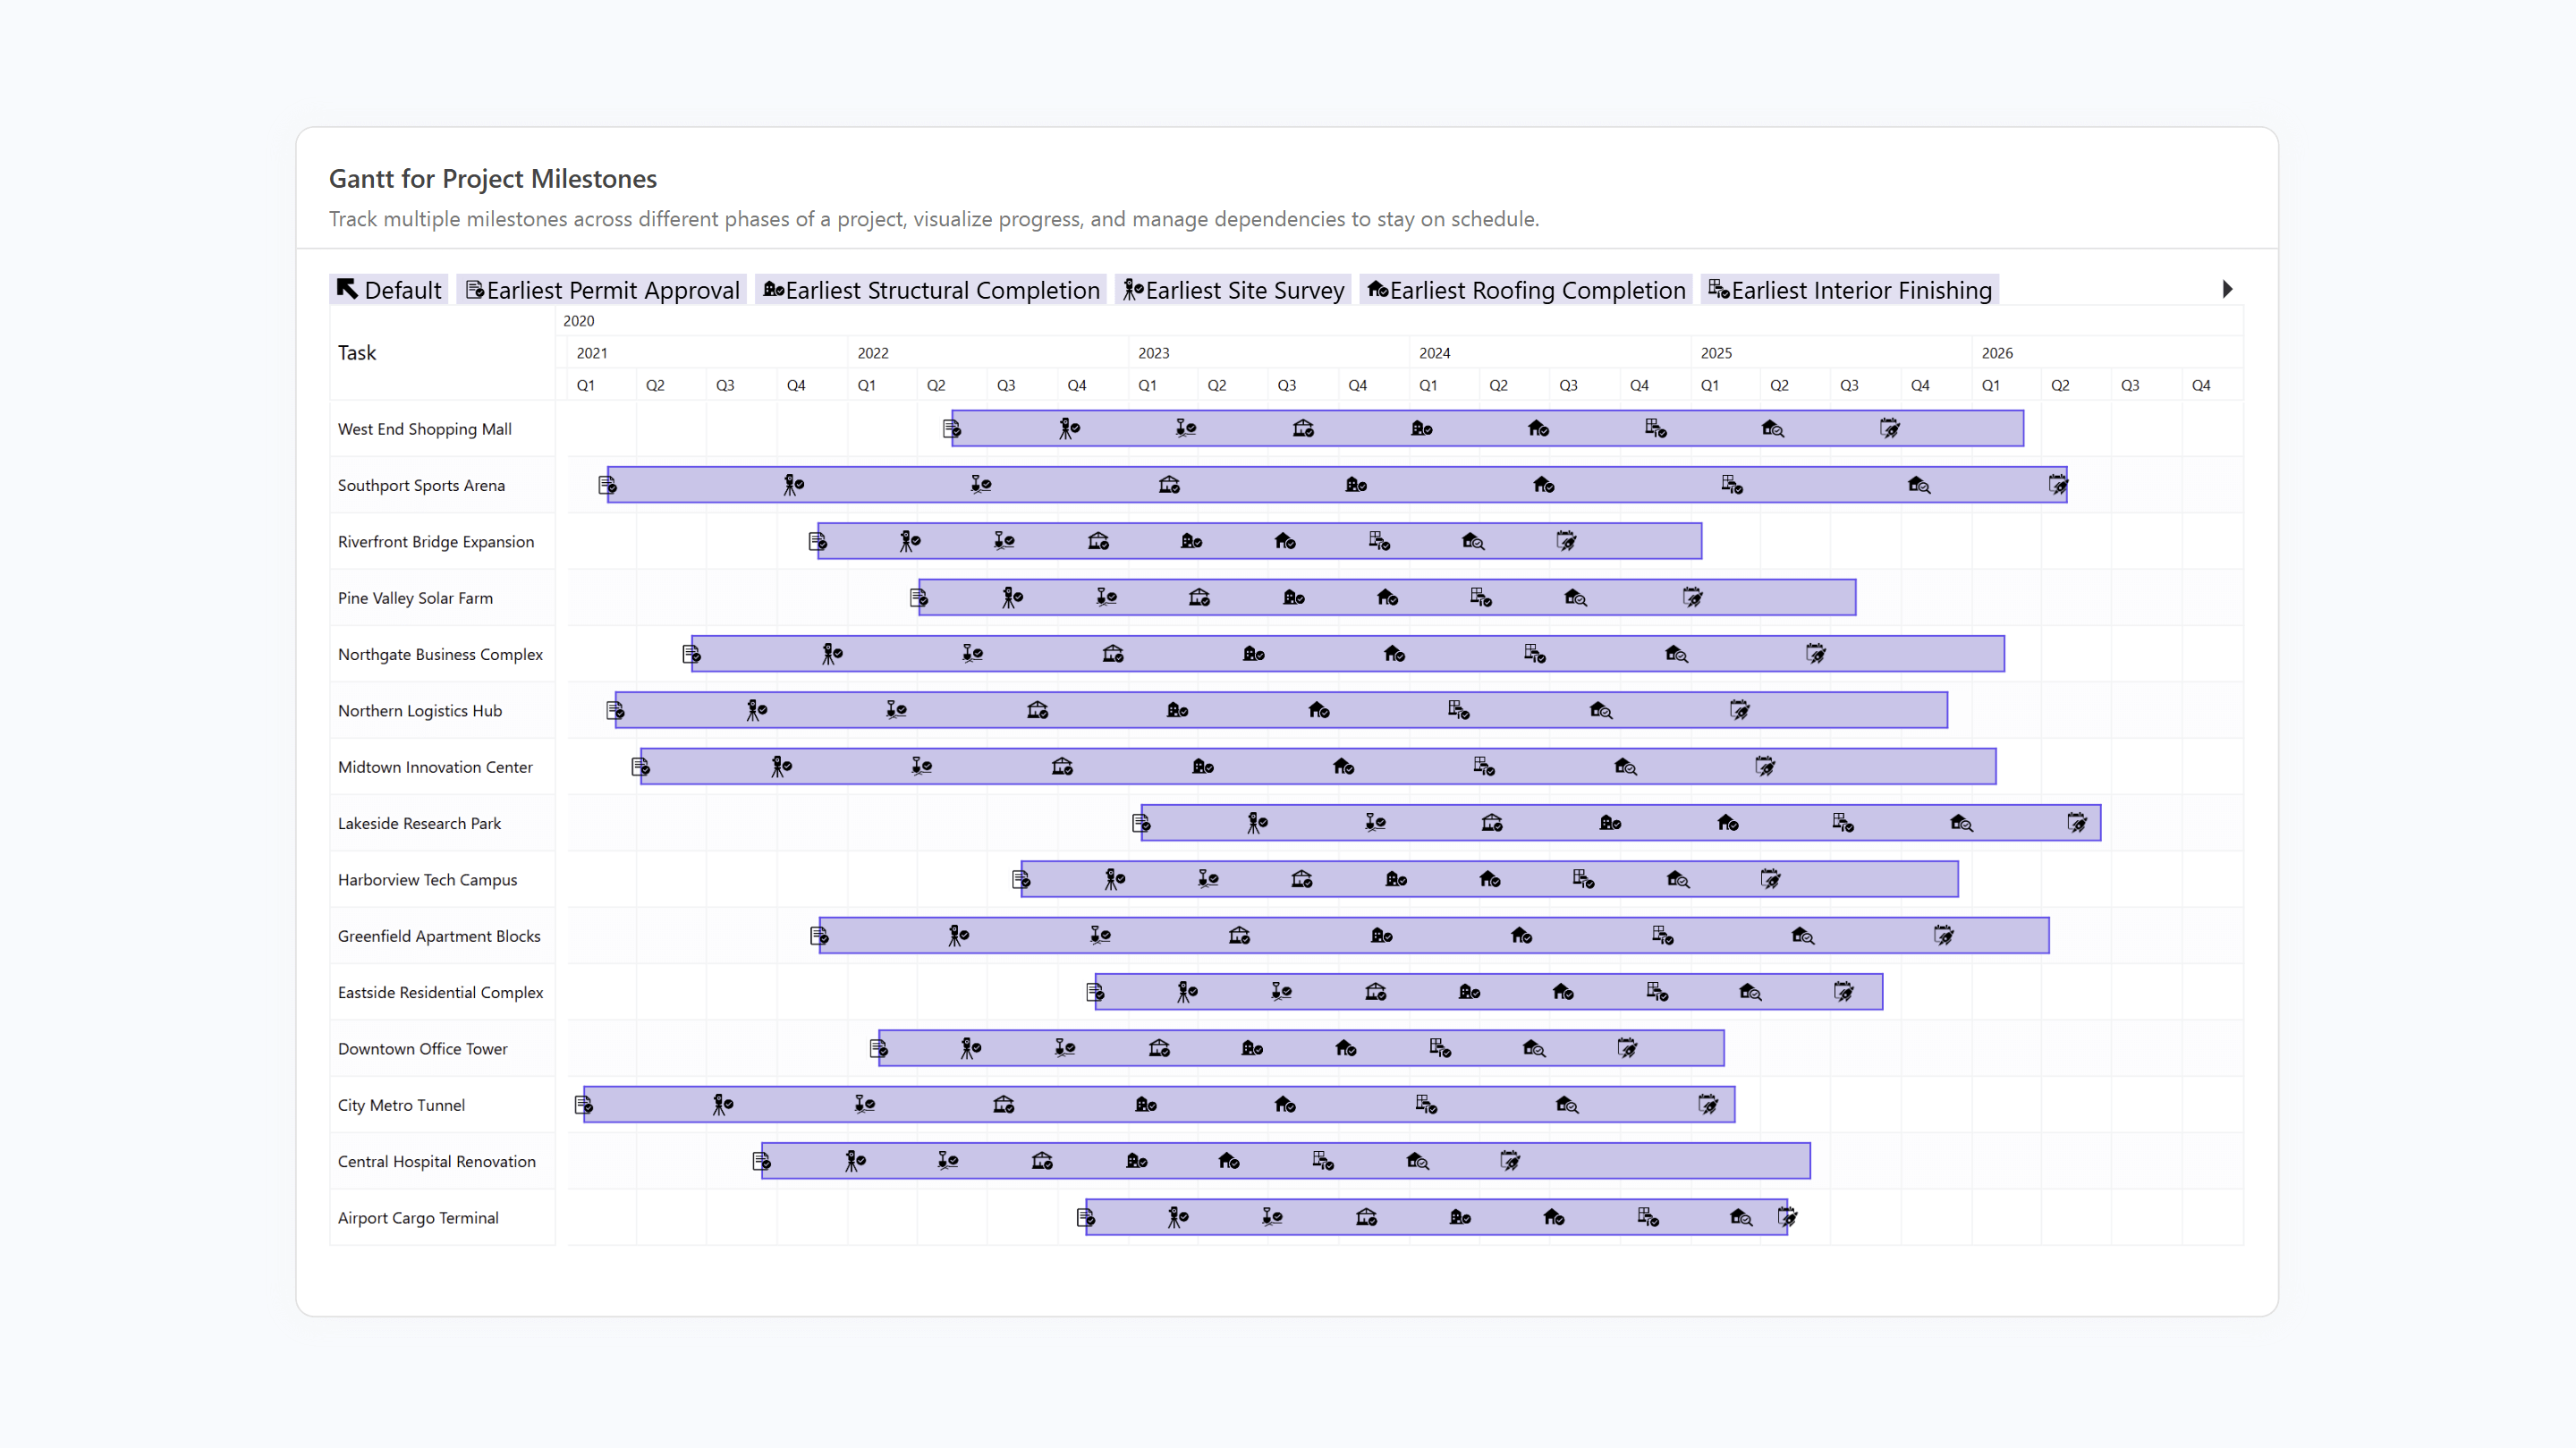
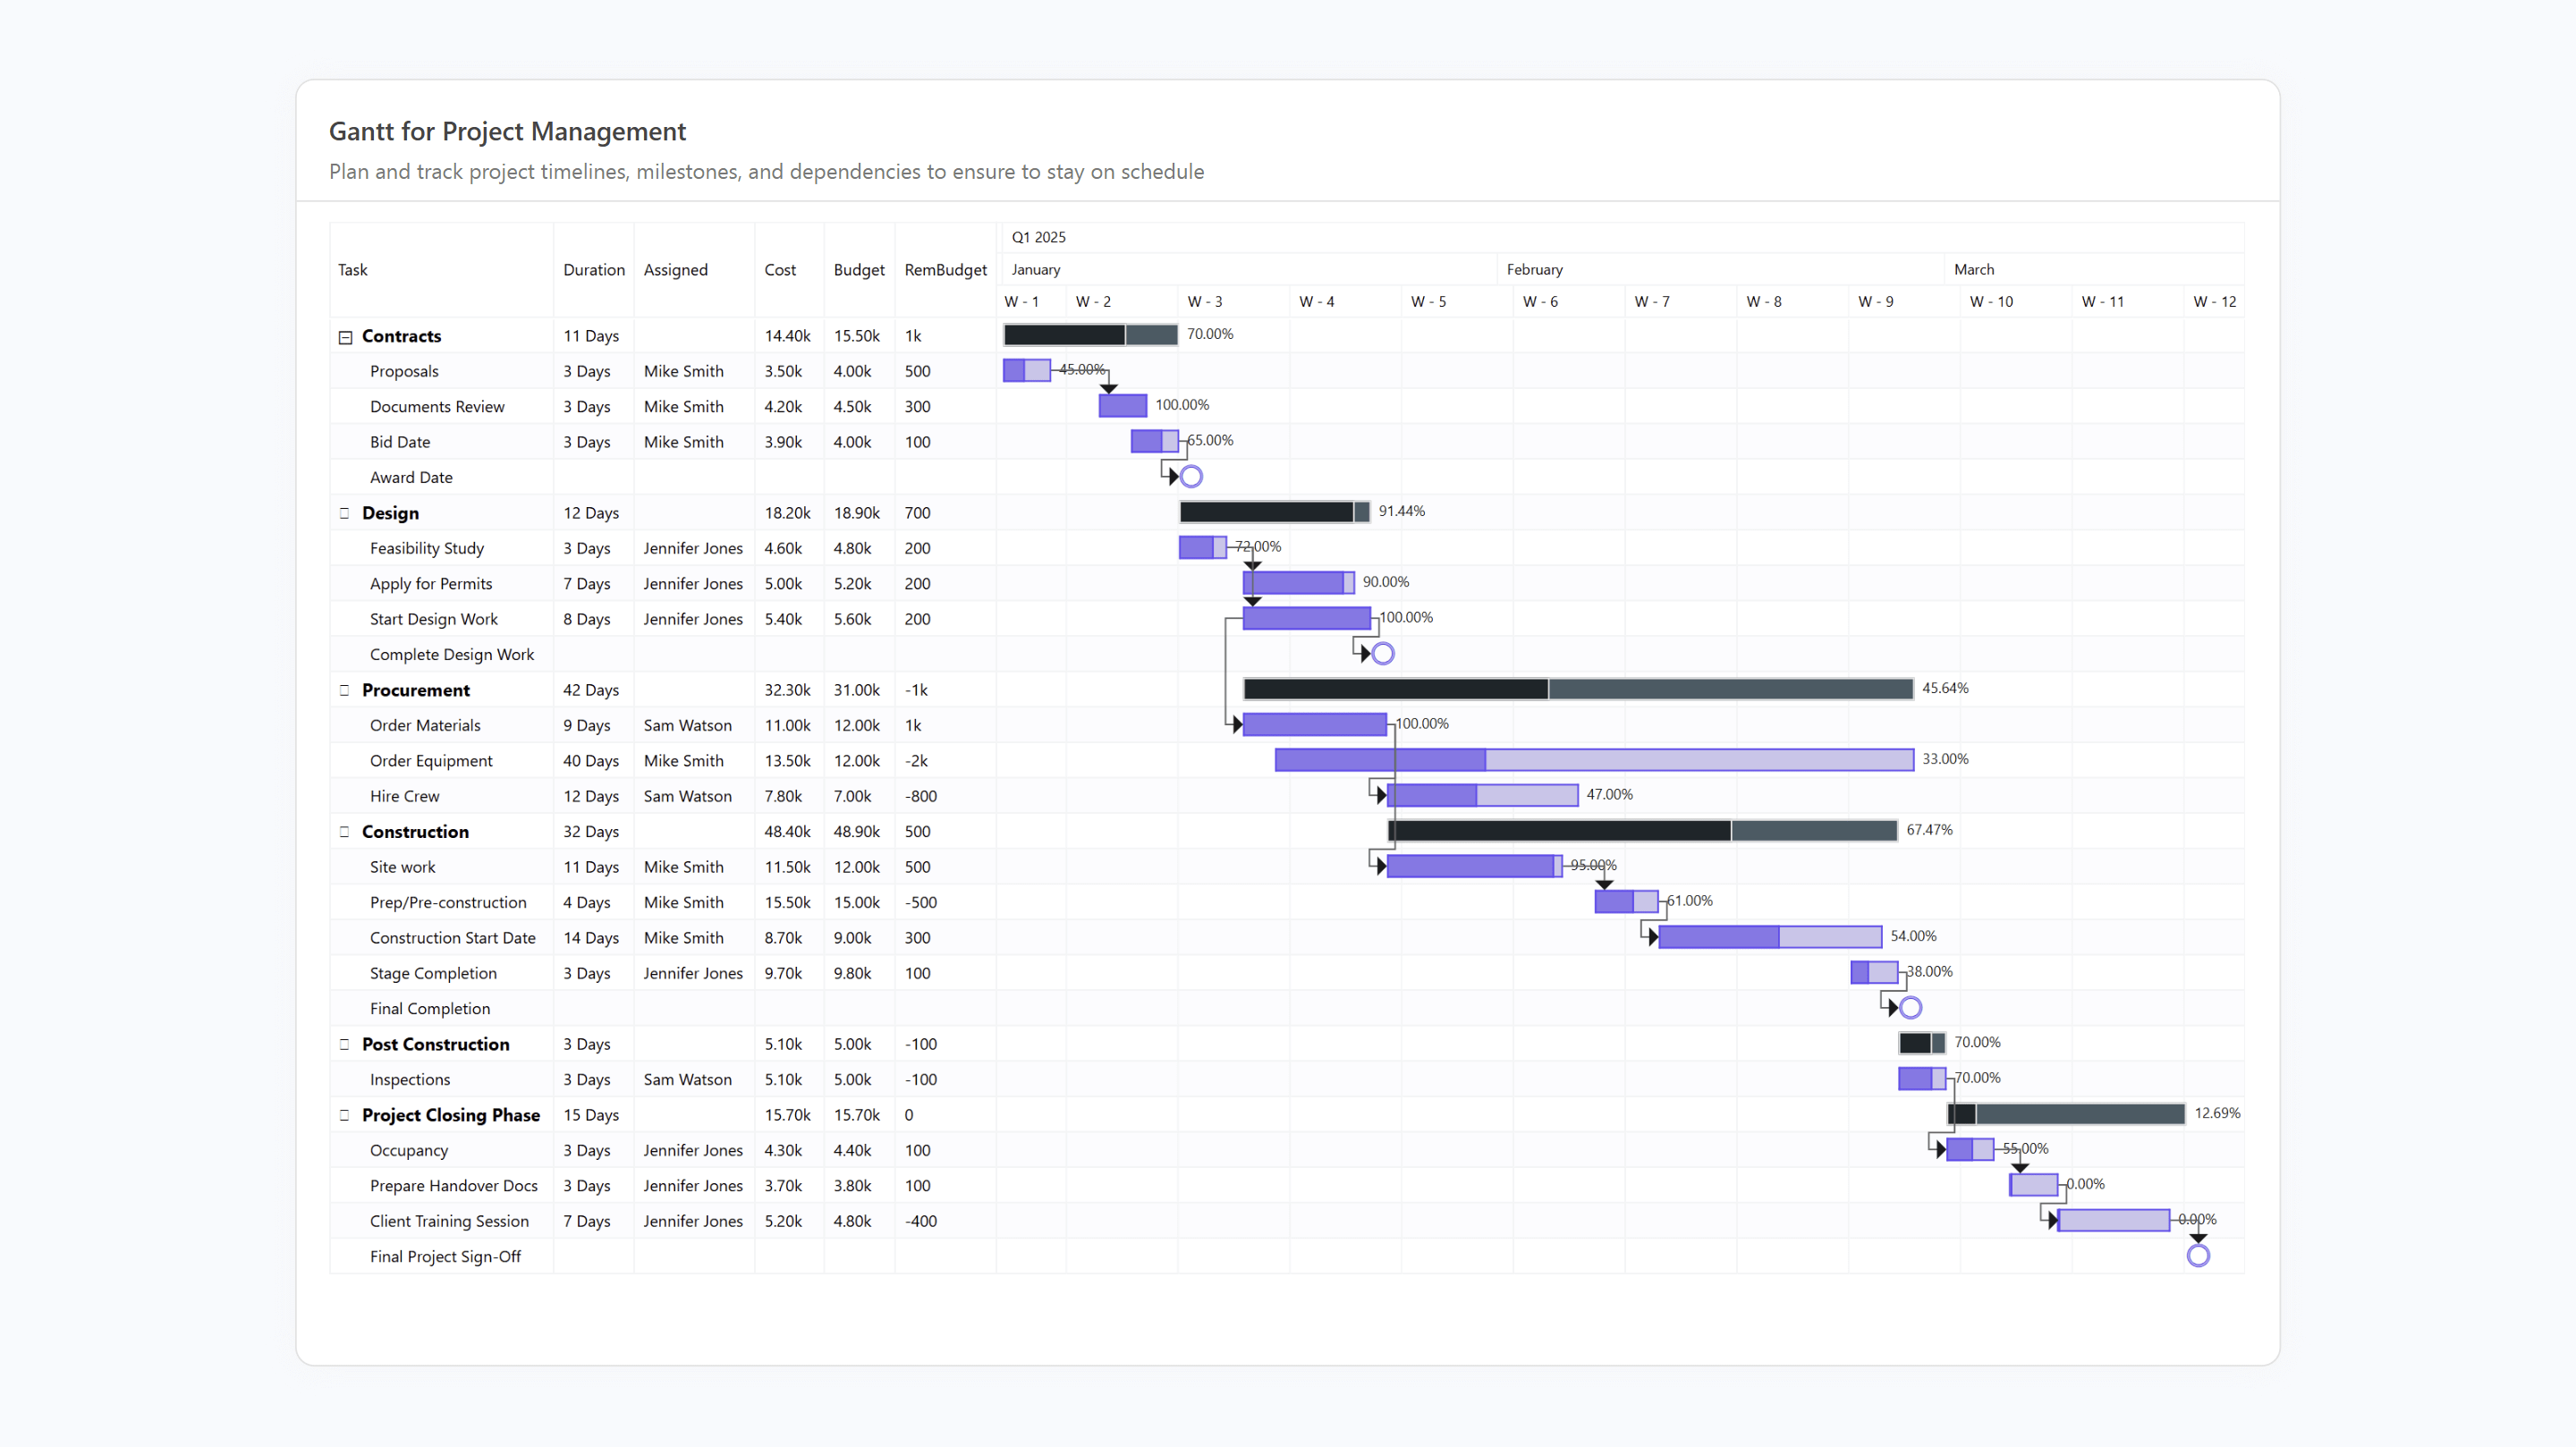
linkedin facebook pinterest youtube rss twitter instagram facebook-blank rss-blank linkedin-blank pinterest youtube twitter instagram