Upcoming webinar on 'Inforiver Charts : The fastest way to deliver stories in Power BI', Aug 29th , Monday, 10.30 AM CST. Register Now
Upcoming webinar on 'Inforiver Charts : The fastest way to deliver stories in Power BI', Aug 29th , Monday, 10.30 AM CST. Register Now
Welcome to the Inforiver Enterprise release updates!
In this interim version 2.8.5, we introduce several enhancements in the data input section, primarily to the filter-based dropdown list, and performance optimizations for writebacks. We have also restructured a few menu items in the admin console for easier navigation. It gives us immense pleasure to consistently provide the updates and improvements you request. Thank you for choosing Inforiver!
The release notes are organized into toolbar segments, providing direct access to each feature. Please feel free to jump straight to the section that interests you.
1.1. Writeback process simplified in Fabric Lakehouse
1.2. Configure request time-out for writeback destination connection
2.1. Data validation check for copy-paste in dropdowns
2.2. Include single select/multi-select data input columns in filter conditions
2.3. Add default values in the single select data input column
2.4. Join multiple tables in a semantic model
2.5. Visual measures extrapolated for new categories
3.1. Rearrangement of menu items
3.2. Enhanced visibility for toast messages
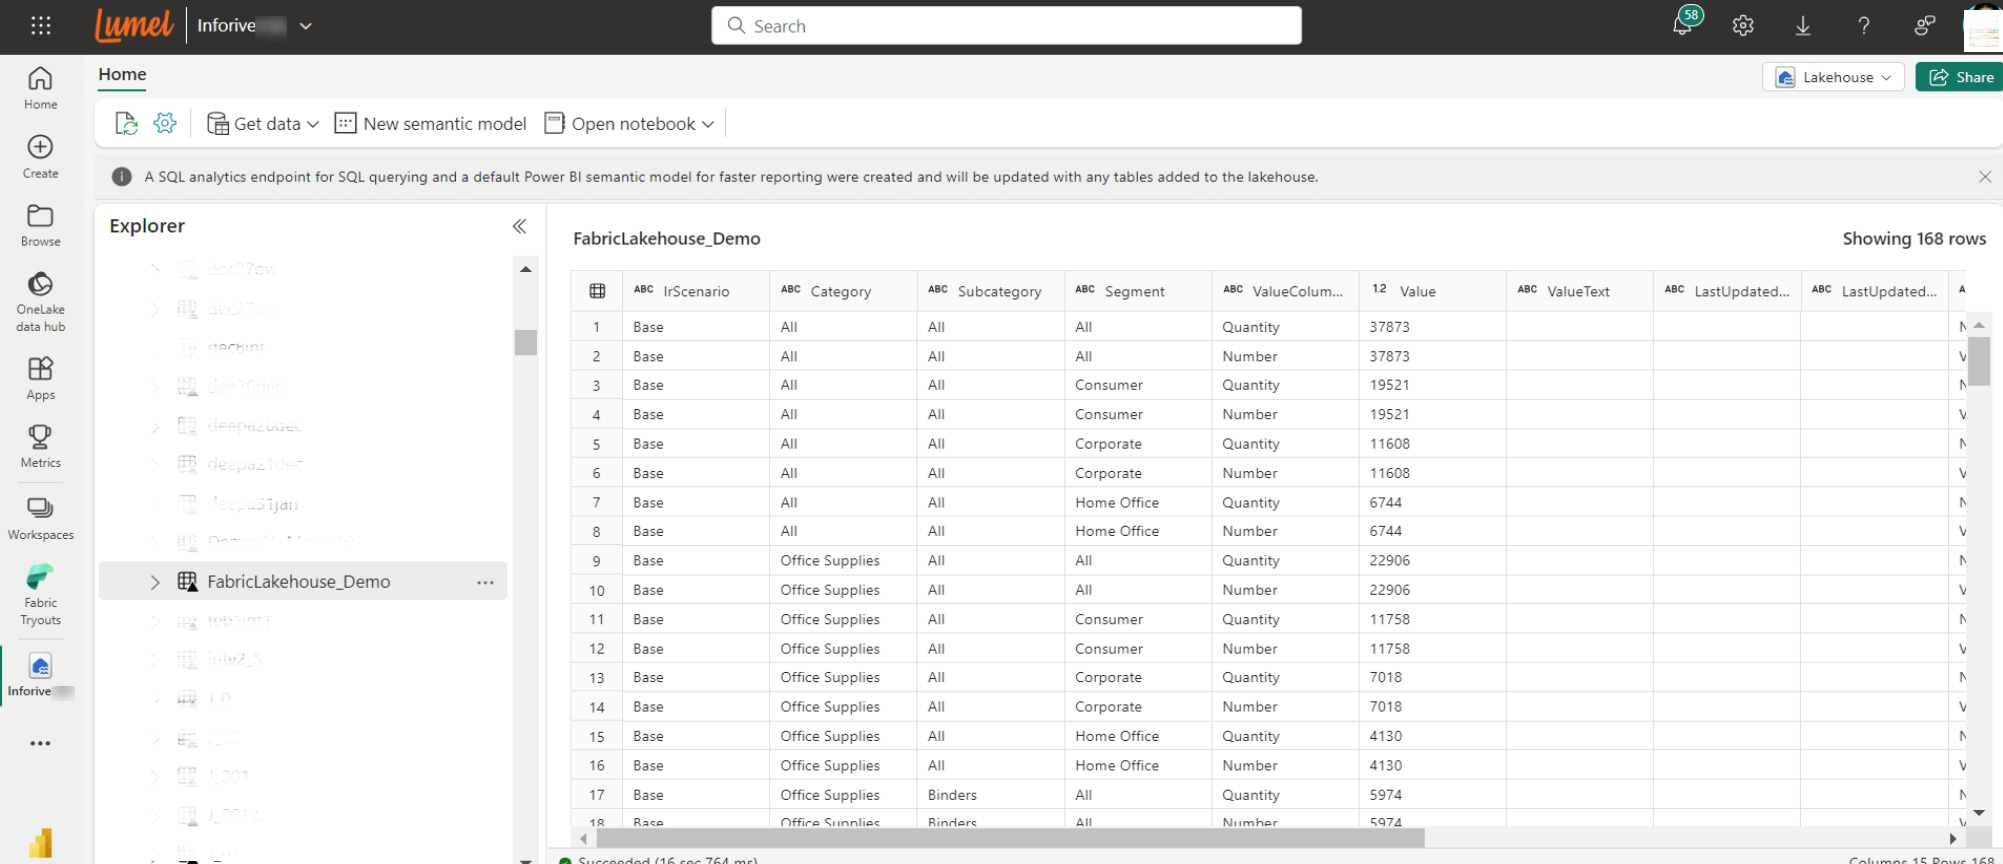
In the latest Inforiver version, we've simplified the writeback process for Fabric Lakehouse destinations.
You can now login with your Microsoft O365 credentials directly to the Lakehouse destination. When writeback is initiated, the delta csv file is uploaded and the writeback table is created automatically at the specified destination.
This eliminates the hassle of manually creating tables from the uploaded CSV files.
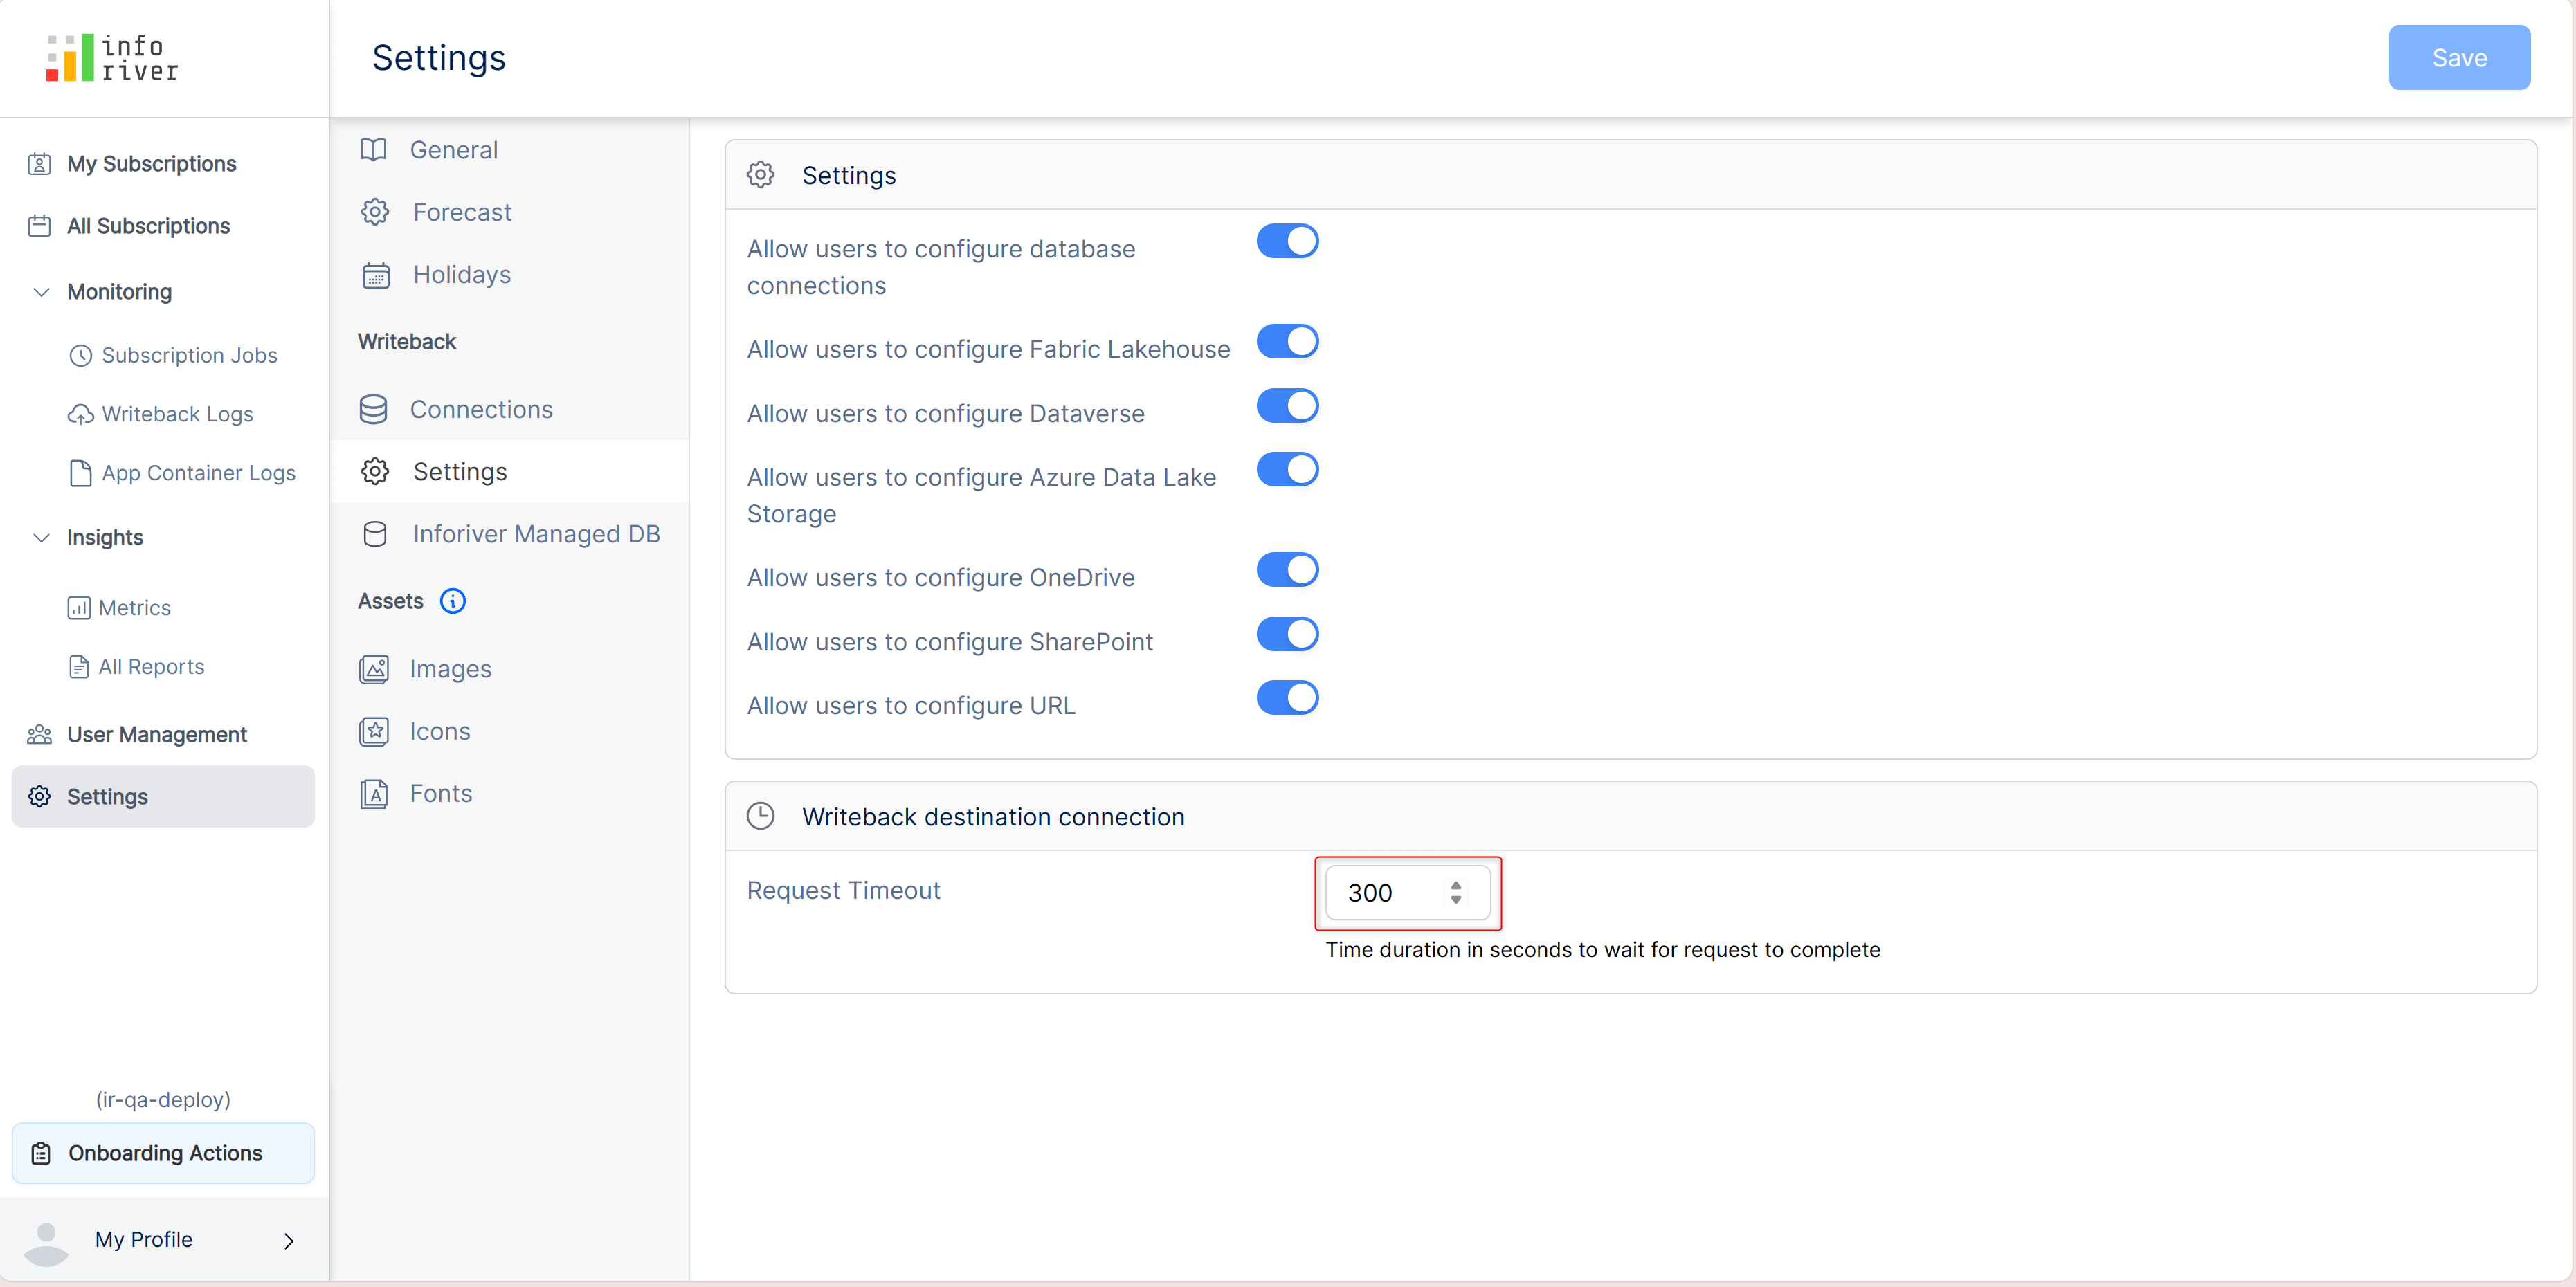
When Inforiver cannot connect to the writeback destination within the specified time limit, it displays a request timeout error. You can now set a custom connection time from the admin console.
In Writeback destination connection settings, you can set the duration of the request time-out. In the example, we have set the request timeout duration to 300 seconds. Inforiver will wait up to 300 seconds for the connection to be established before generating a request time out error.
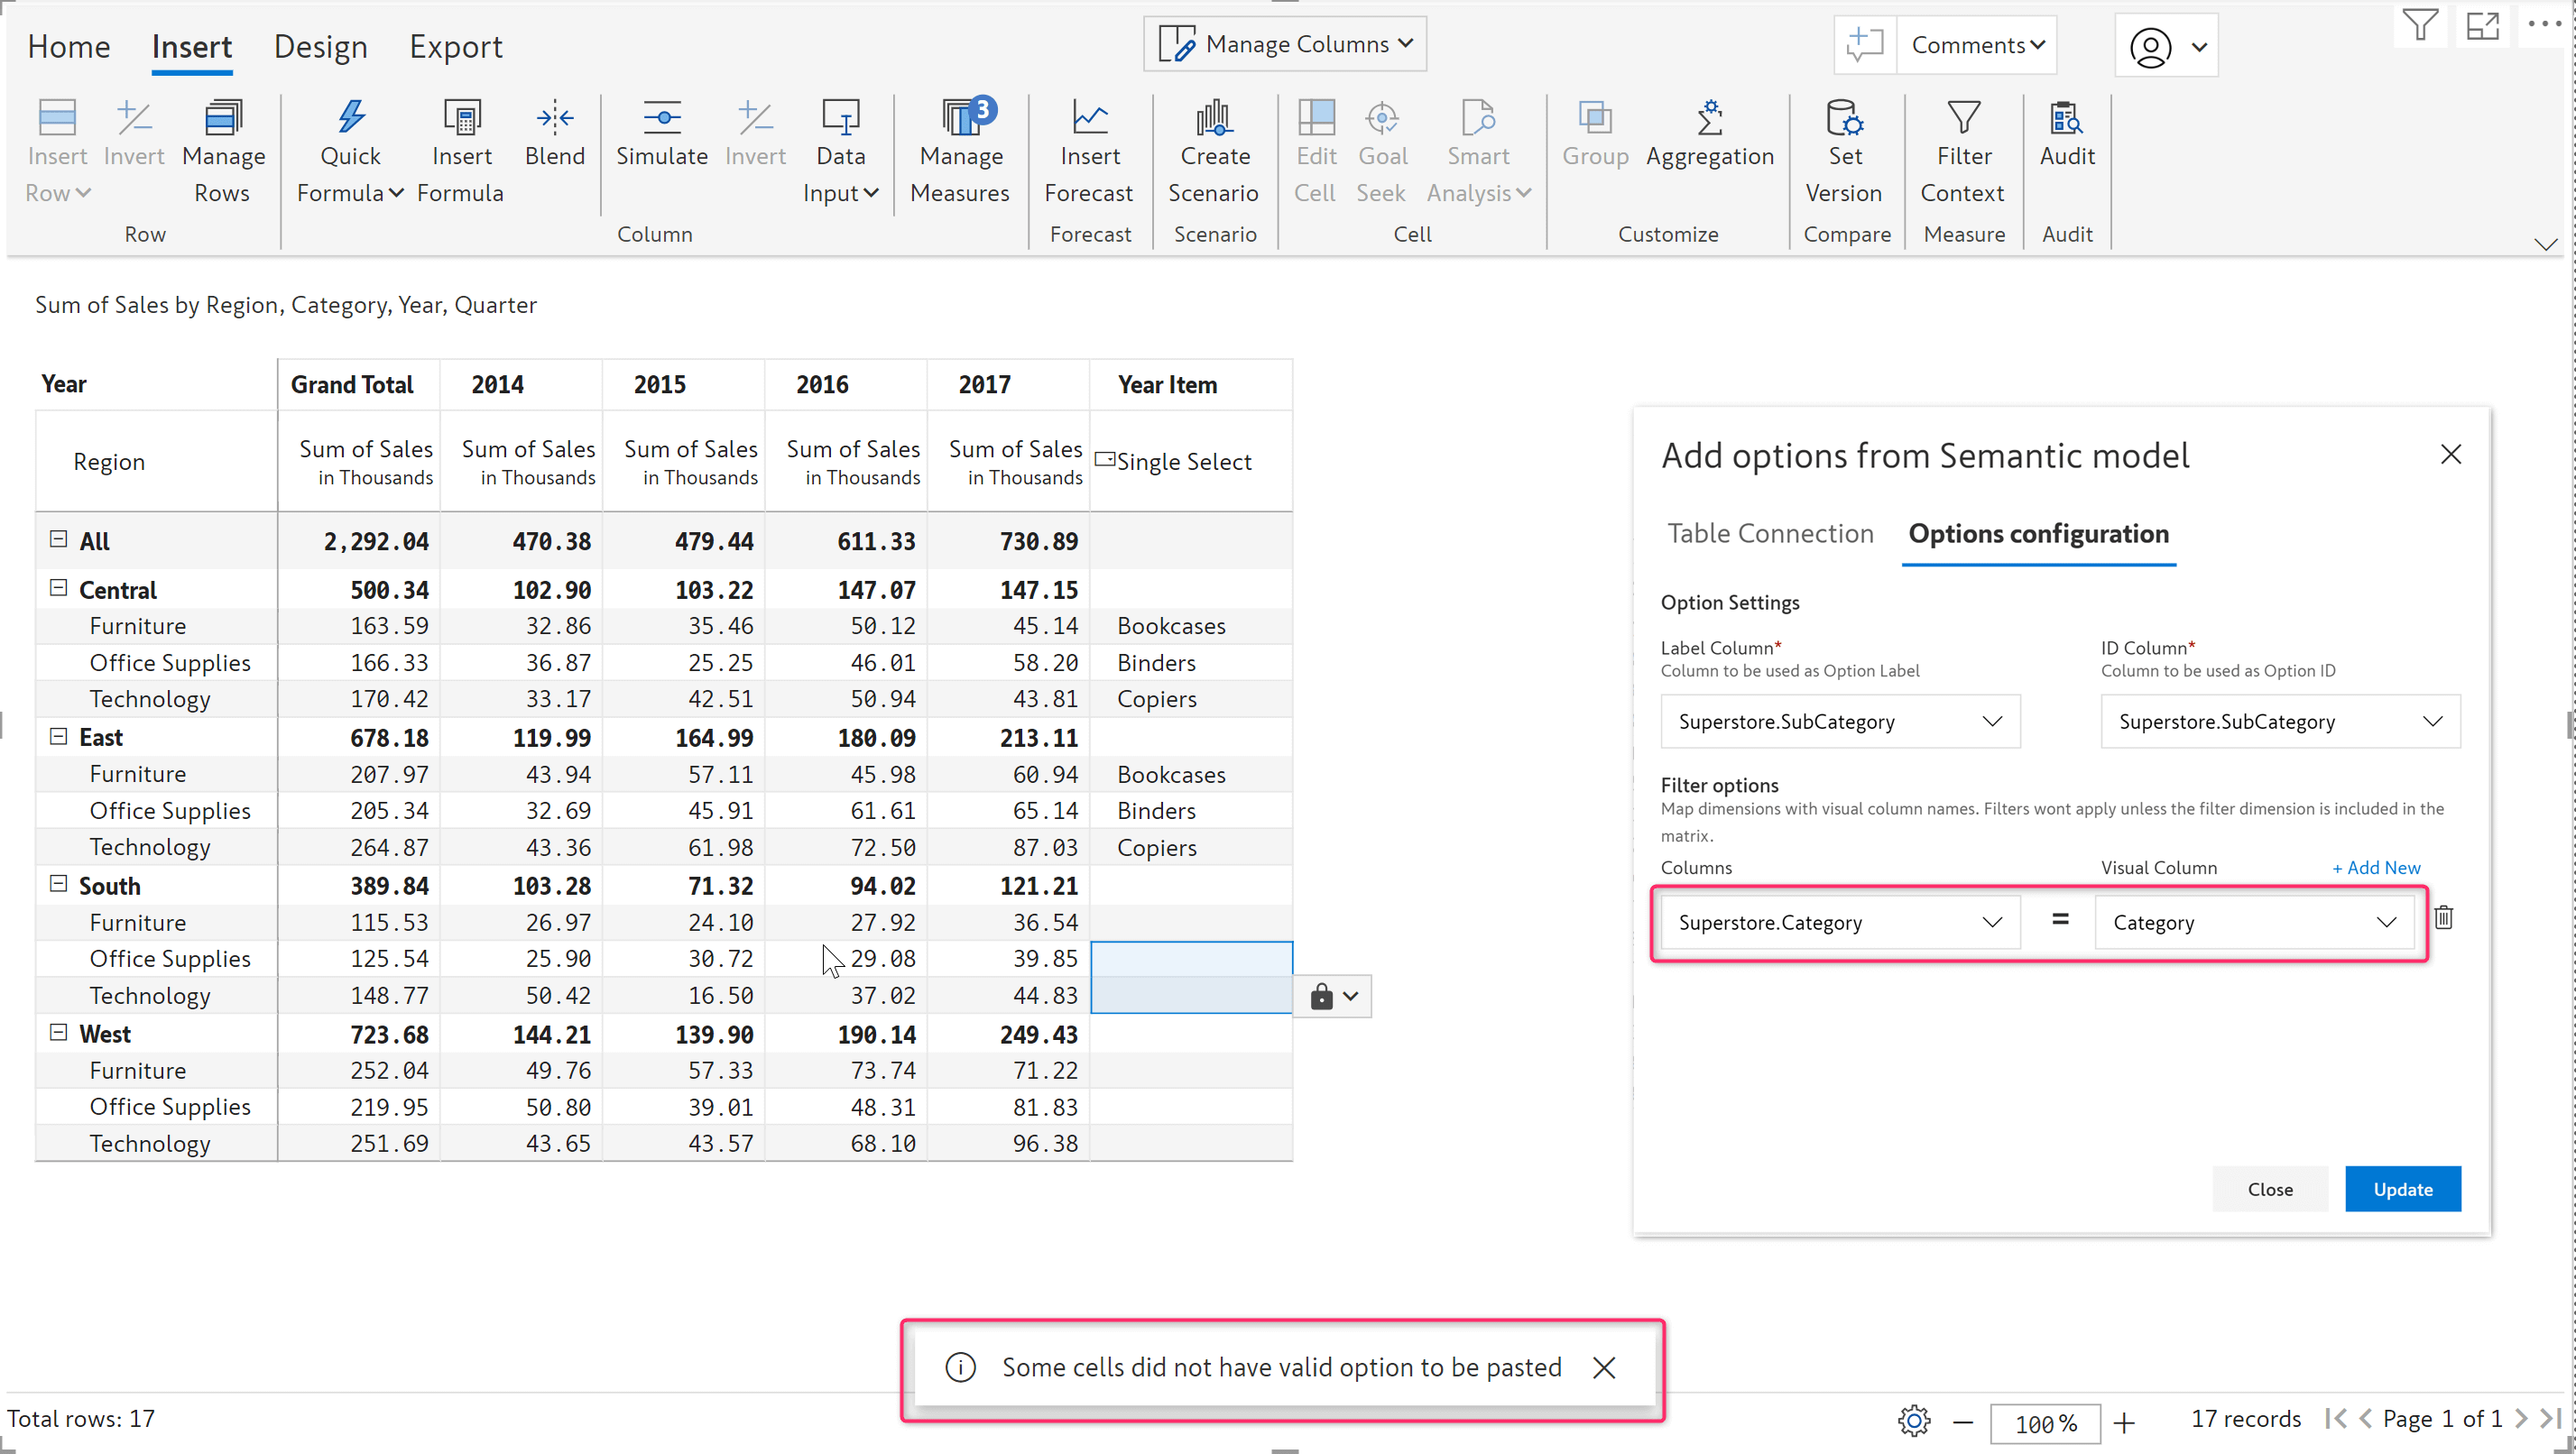
With Inforiver, you can populate dropdown menus from the dataset using the semantic model option. In the previous release, we introduced dependent dropdowns, where the options in the dropdown are dynamically updated based on a filter.
When dropdown filters are enabled, Inforiver also checks if the data is valid when you copy paste data manually within a dropdown data input column. Note that the Copy options (Copy to all rows, Copy until last row etc.) are disabled when dropdown filters are applied.
If you accidentally try to paste an invalid option, you will be notified that the copied cell values do not belong to the chosen category.
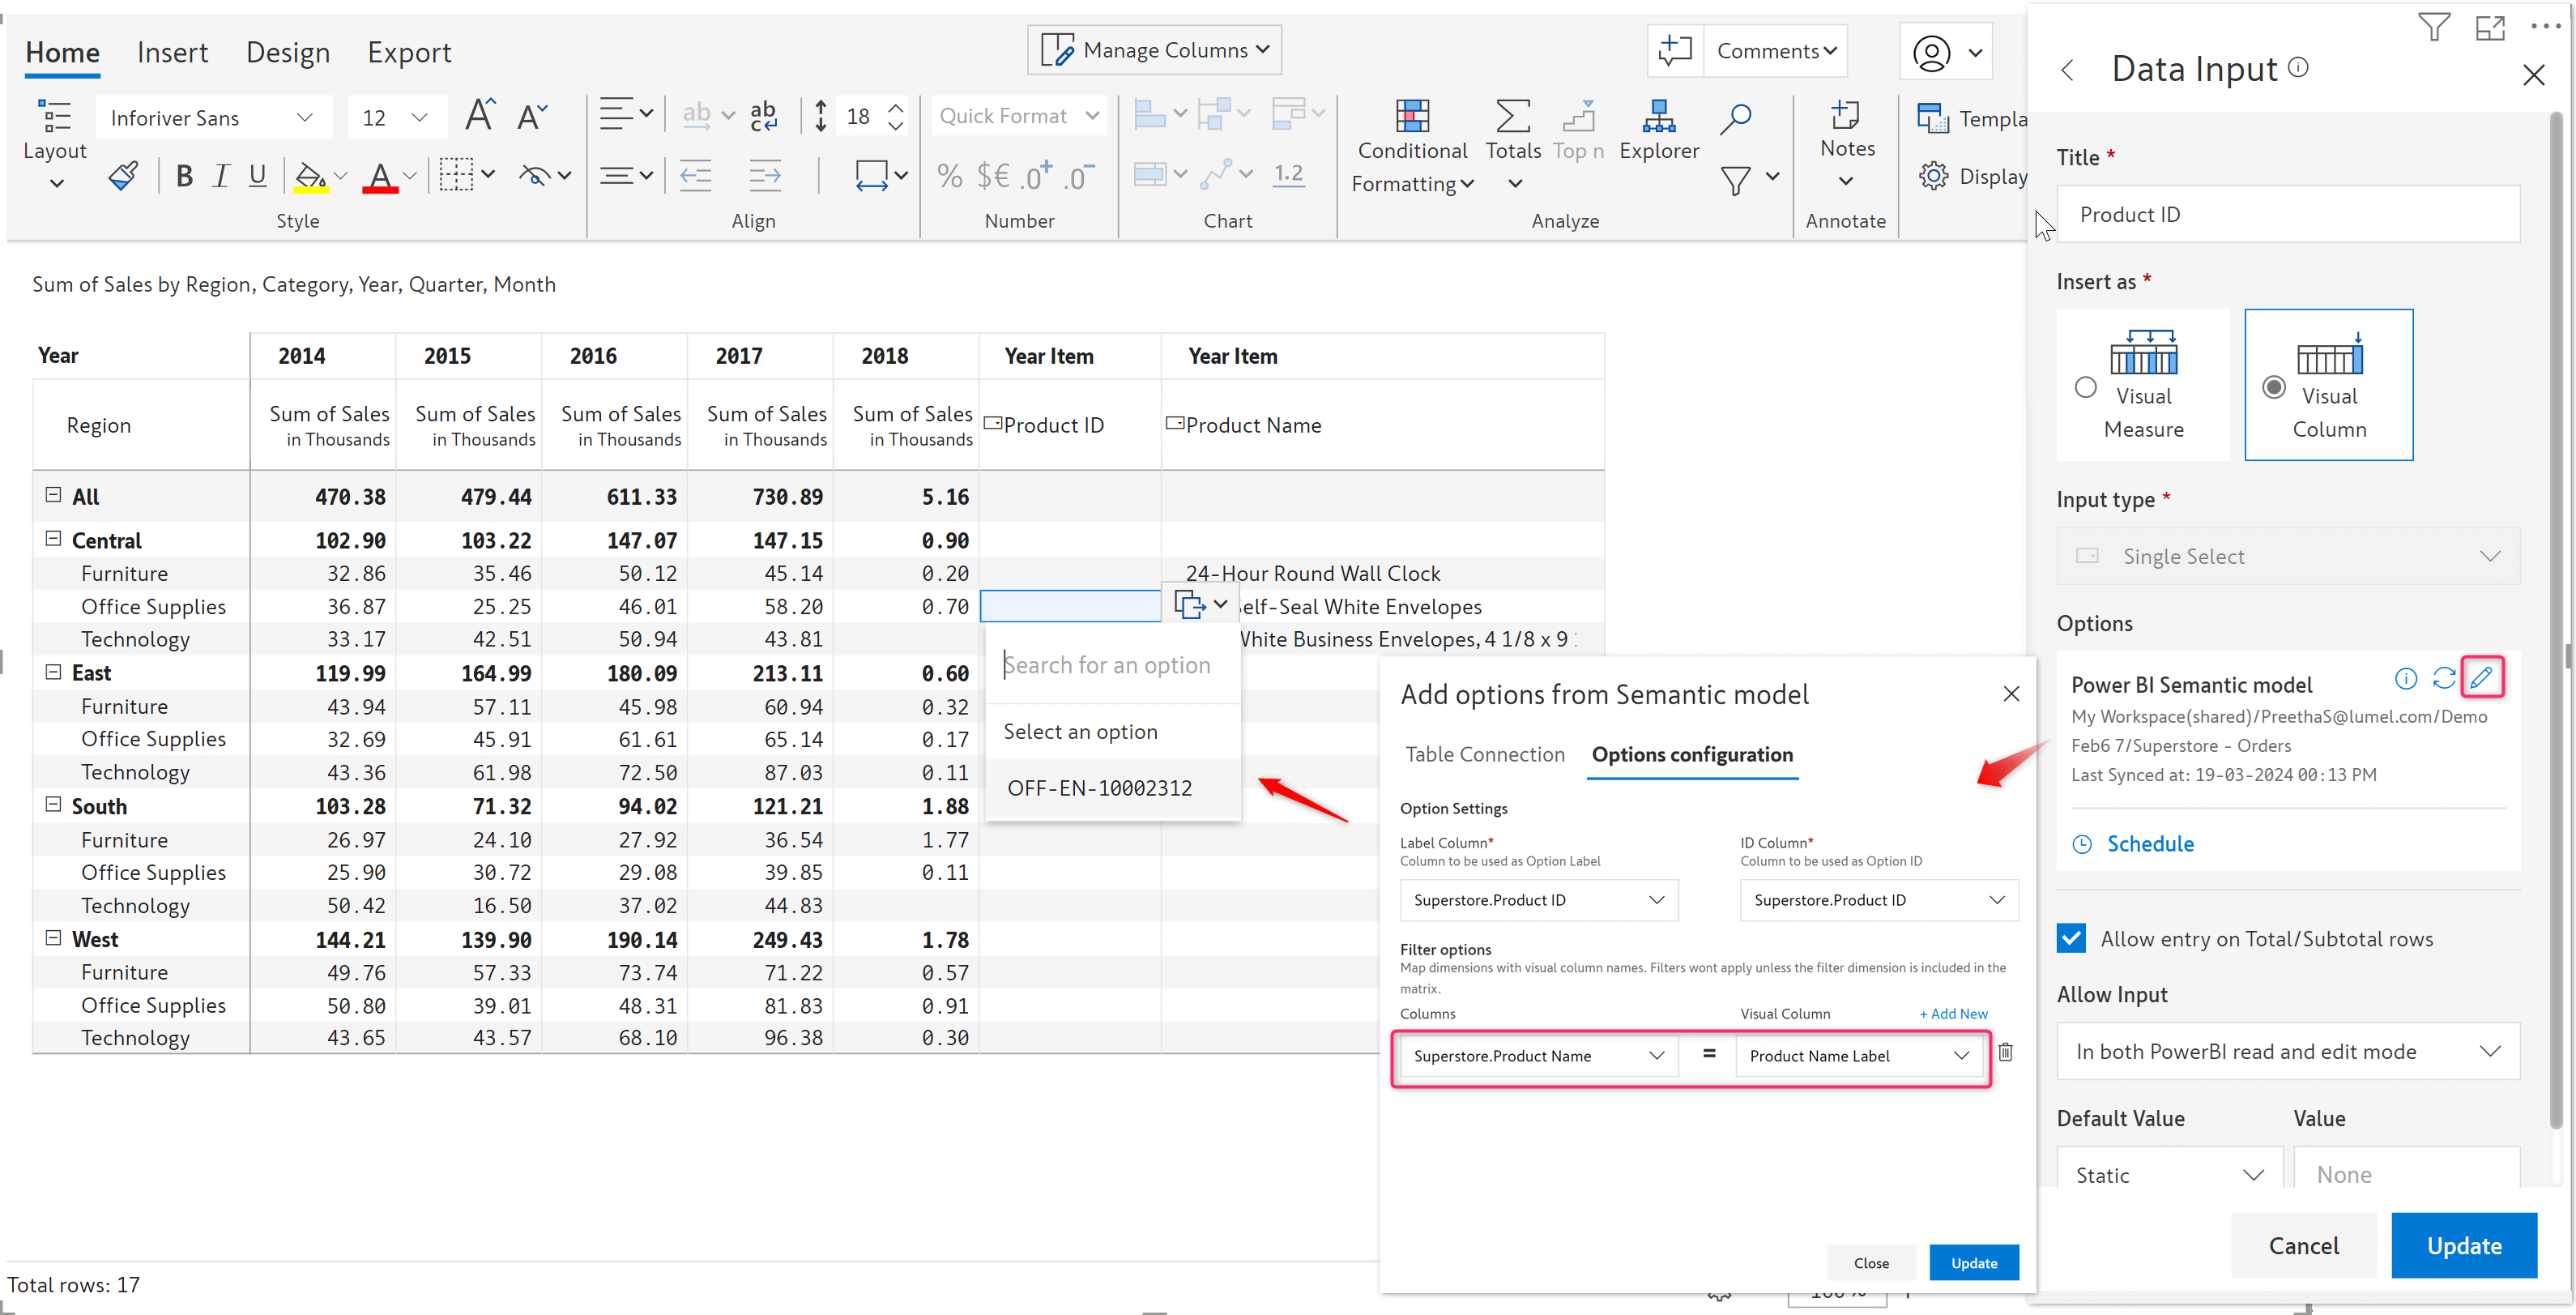
Inforiver allows you to use any other existing single-select or multi-select data input columns as filters when creating dropdown lists. The report below contains two single-select custom columns: one for assigning the 'Product Name' and another for assigning the 'Product ID'.
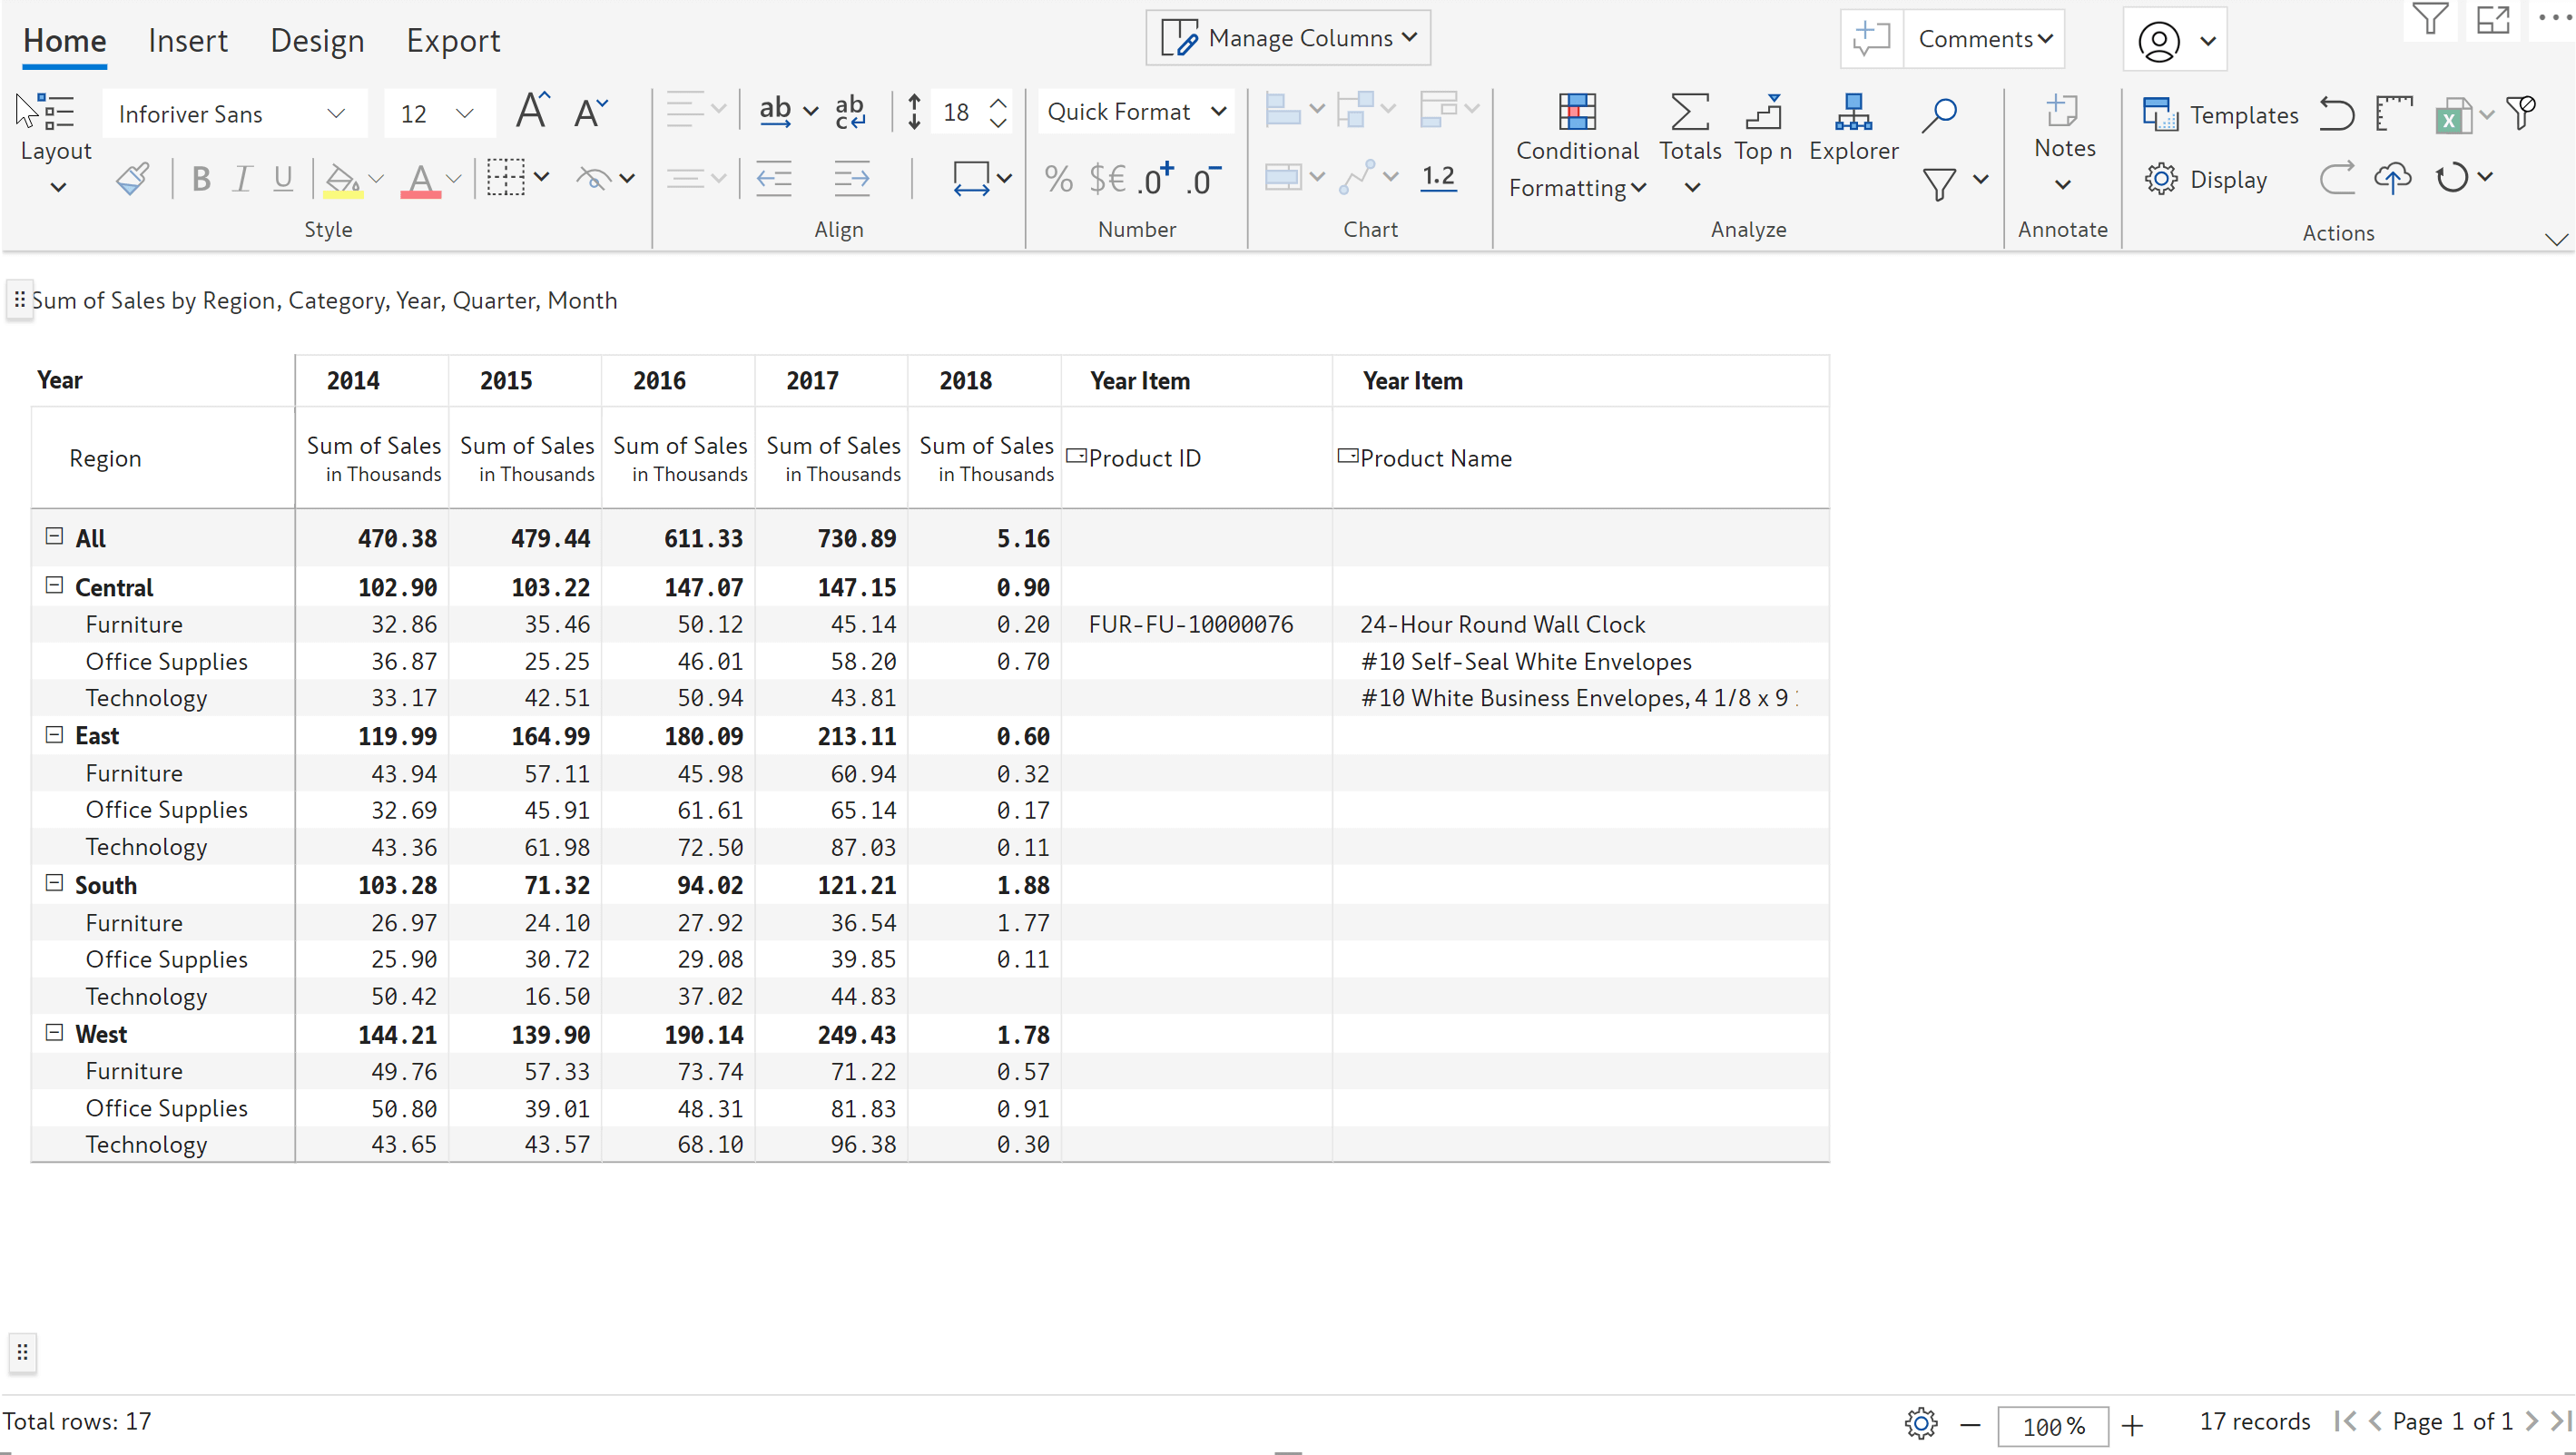
To demonstrate this feature, we chose the Product Name data input field in the filter condition for Product ID. You will be able to see only the respective Product ID for each of the assigned products and not all. In the report below, when you try to assign a product ID for the ‘24-Hour Round Wall Clock’, Inforiver internally validates the product name against the product IDs and returns the corresponding product ID in the dropdown.
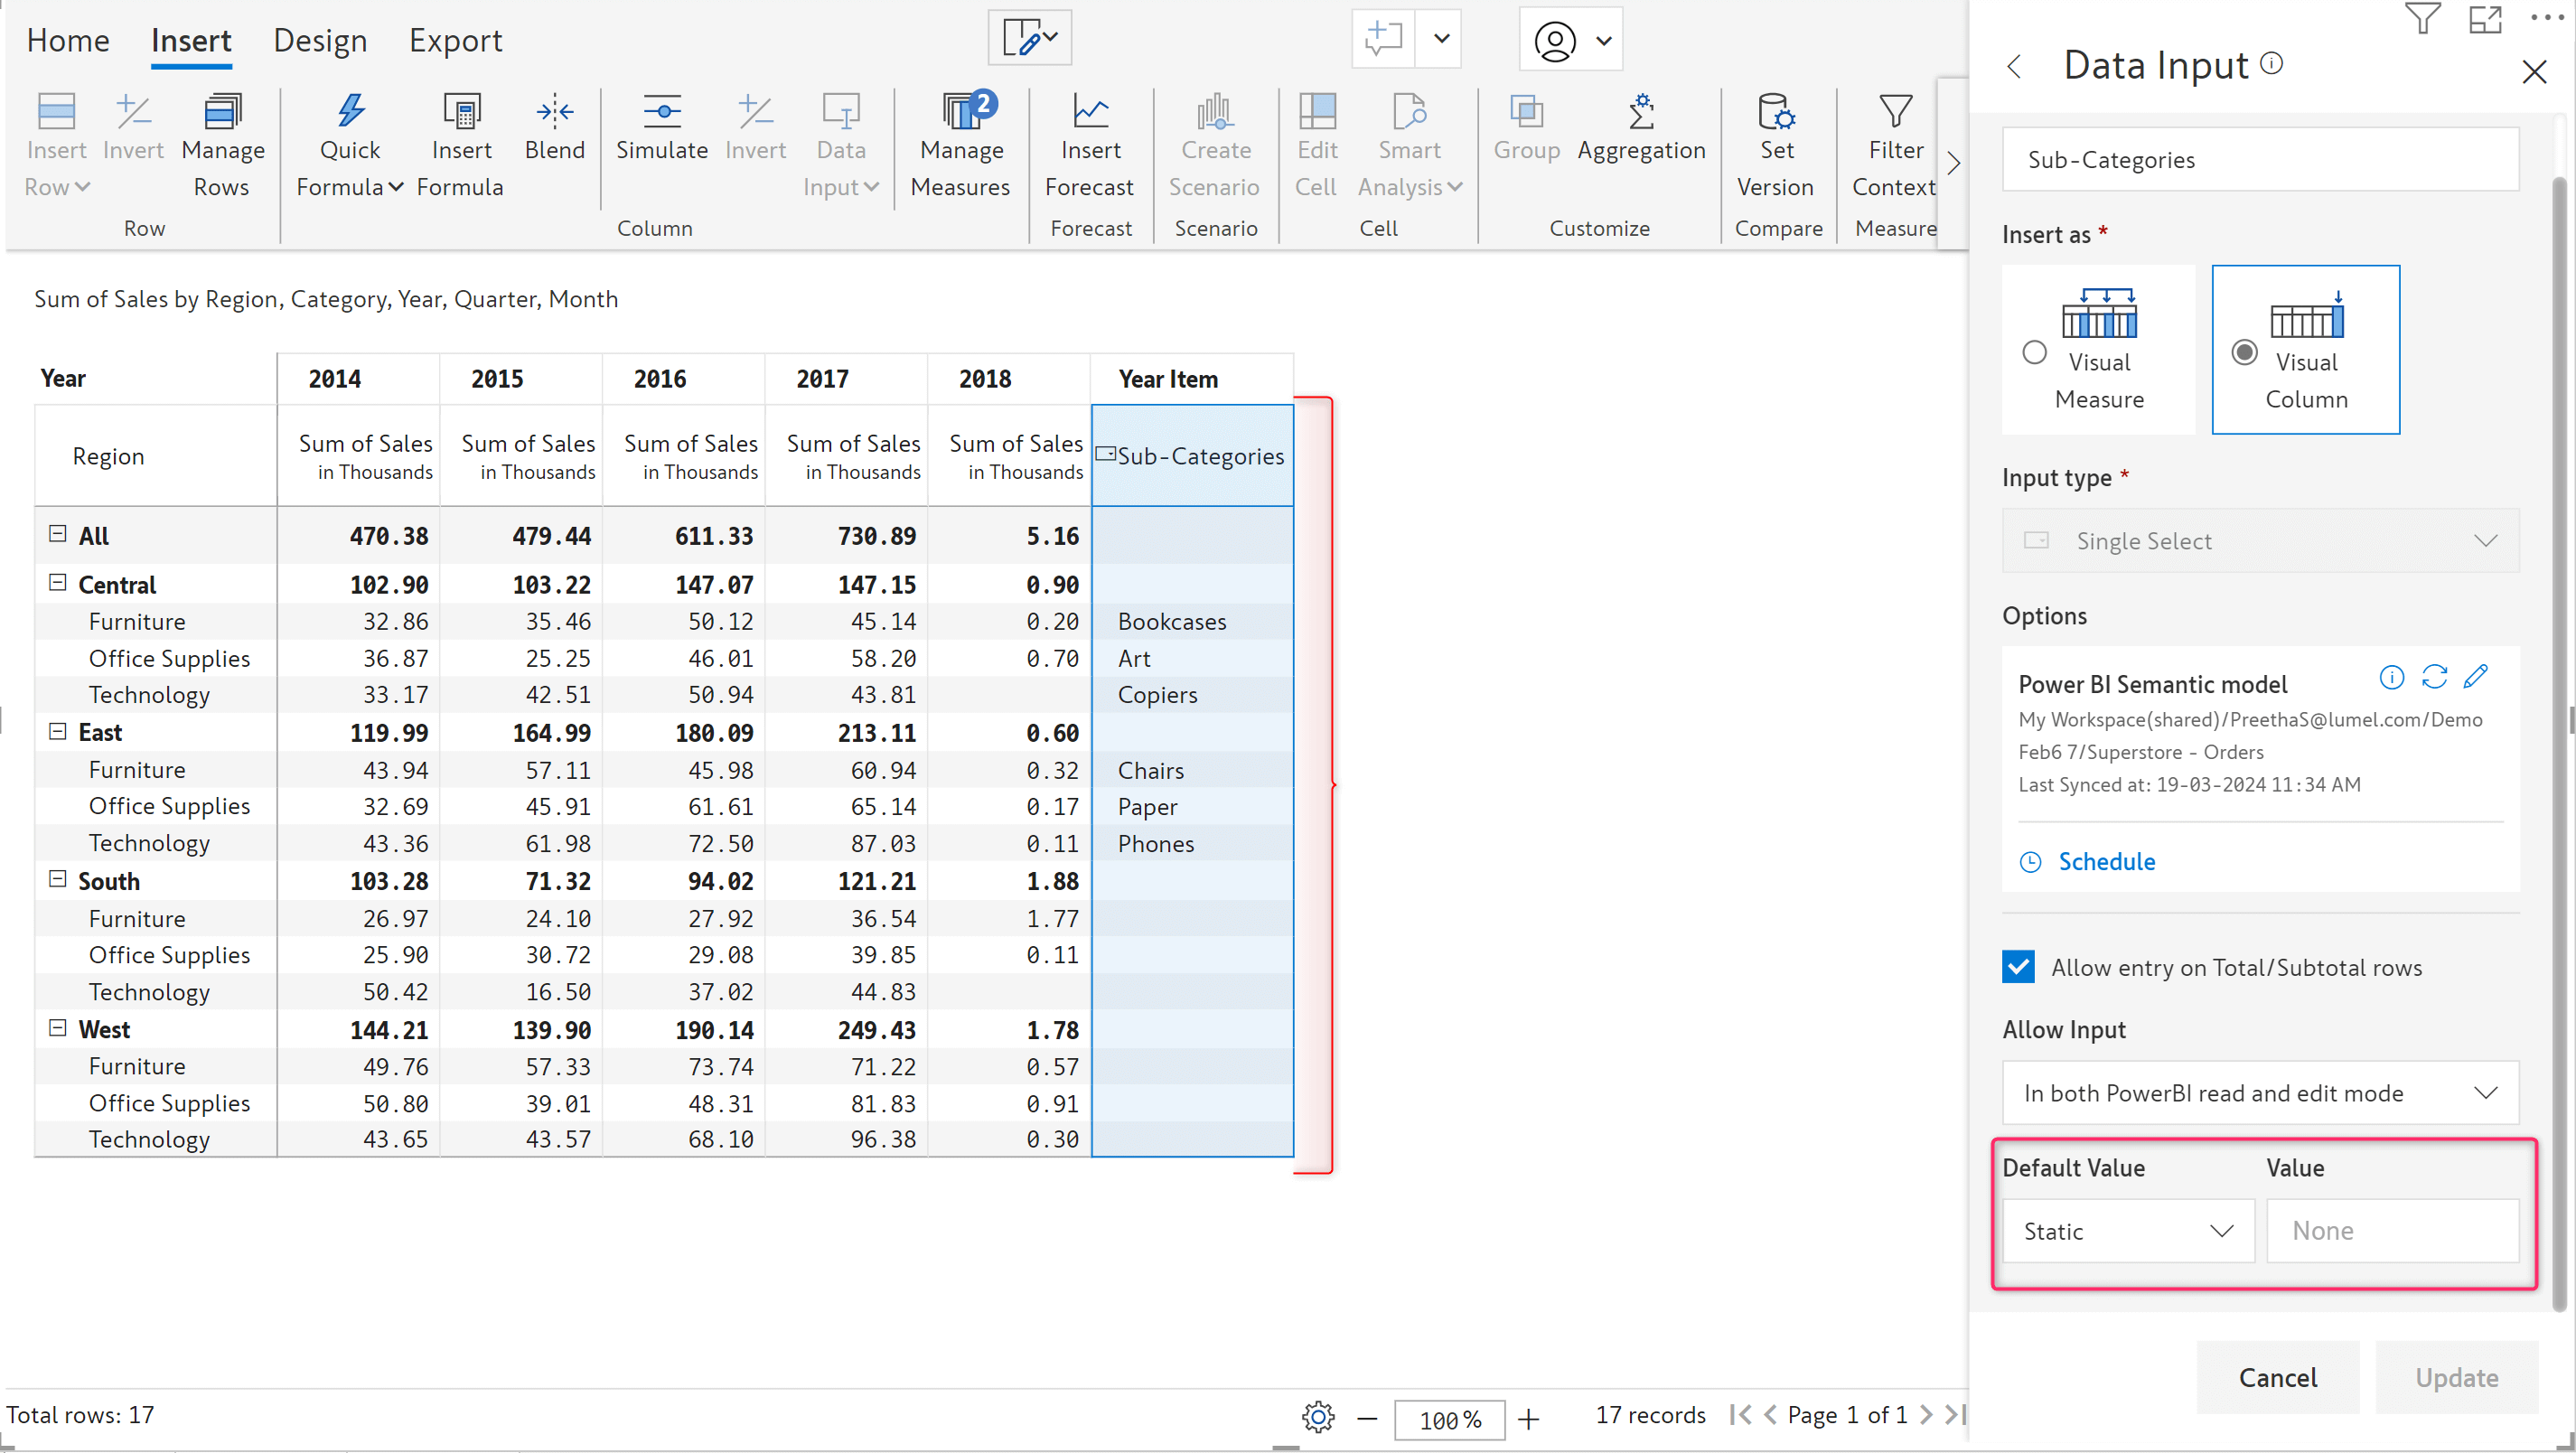
You may have reports with thousands of rows – manually assigning options for each row may not be feasible, resulting in blank cells. In single select dropdowns, you can now configure default values in place of blank records. The default values can be static data that you set, or data from any dimension in the dataset.
In the report below, a few rows are assigned with relevant sub-categories. Some rows are unassigned – they are blank as default values are not set for the single select dropdown.
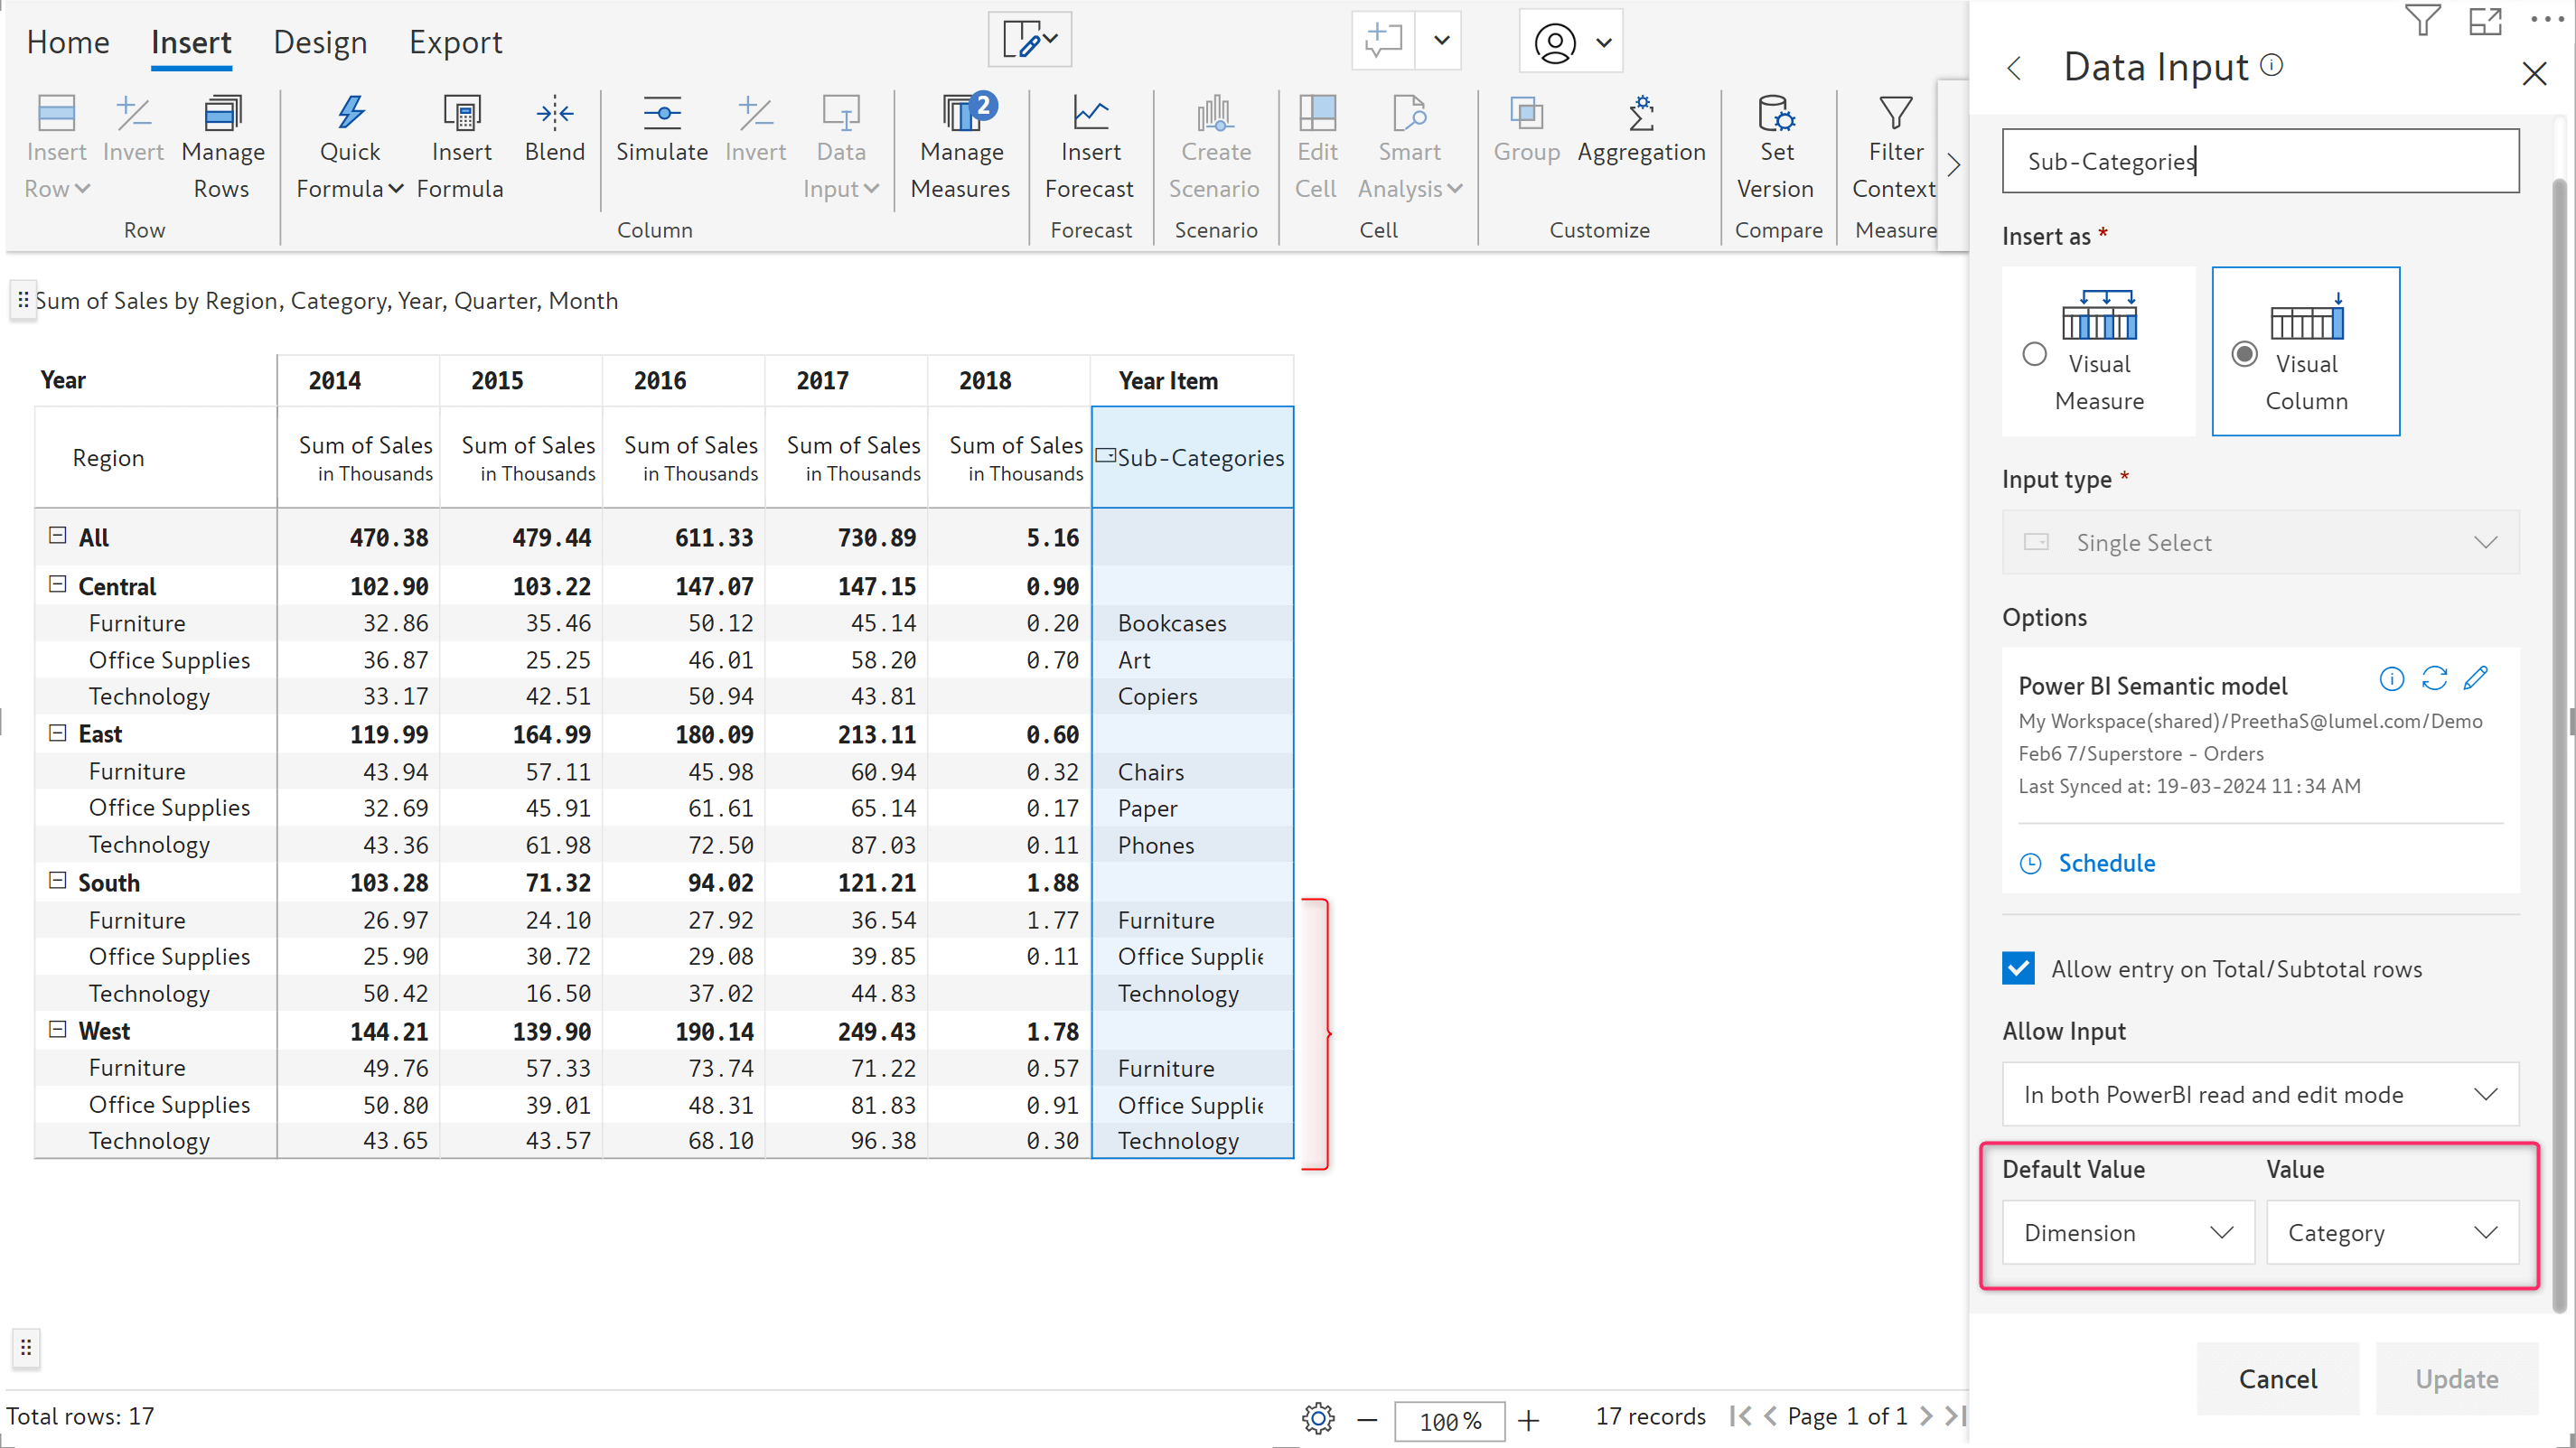
In the example below, we’ve assigned the Category dimension as the default value. When the user does not select an option, the Category itself is automatically used as default value.
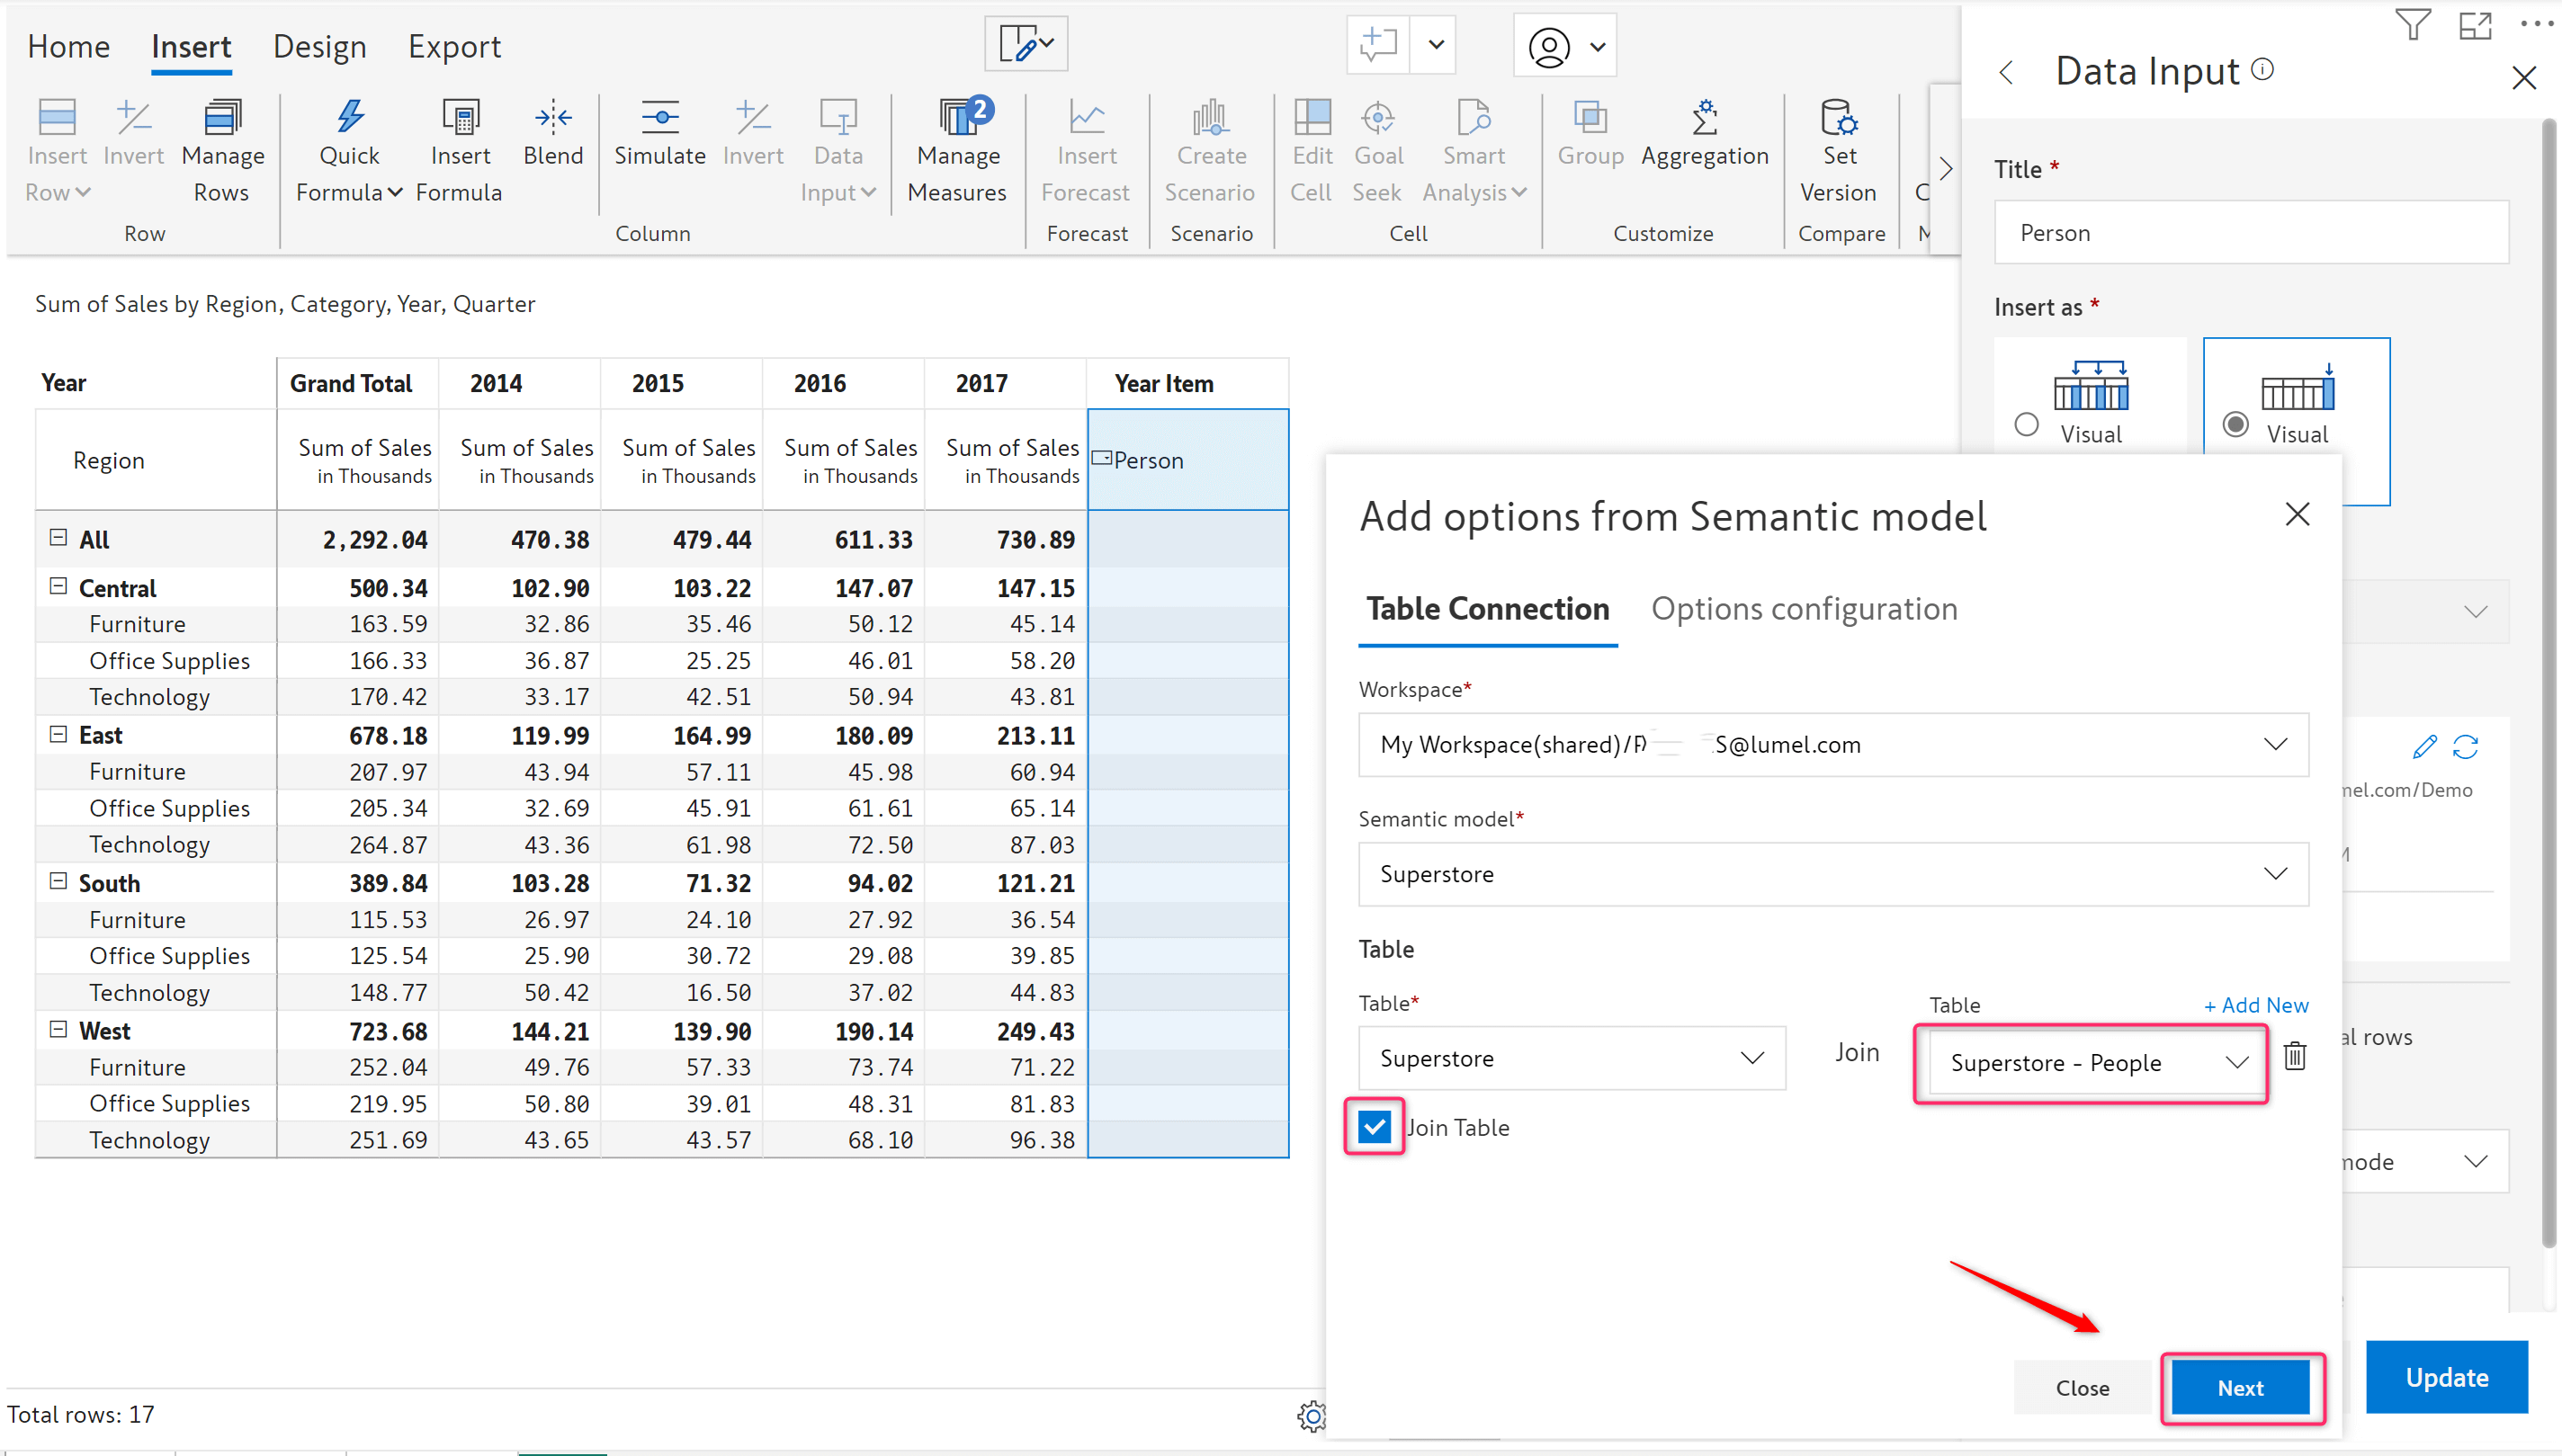
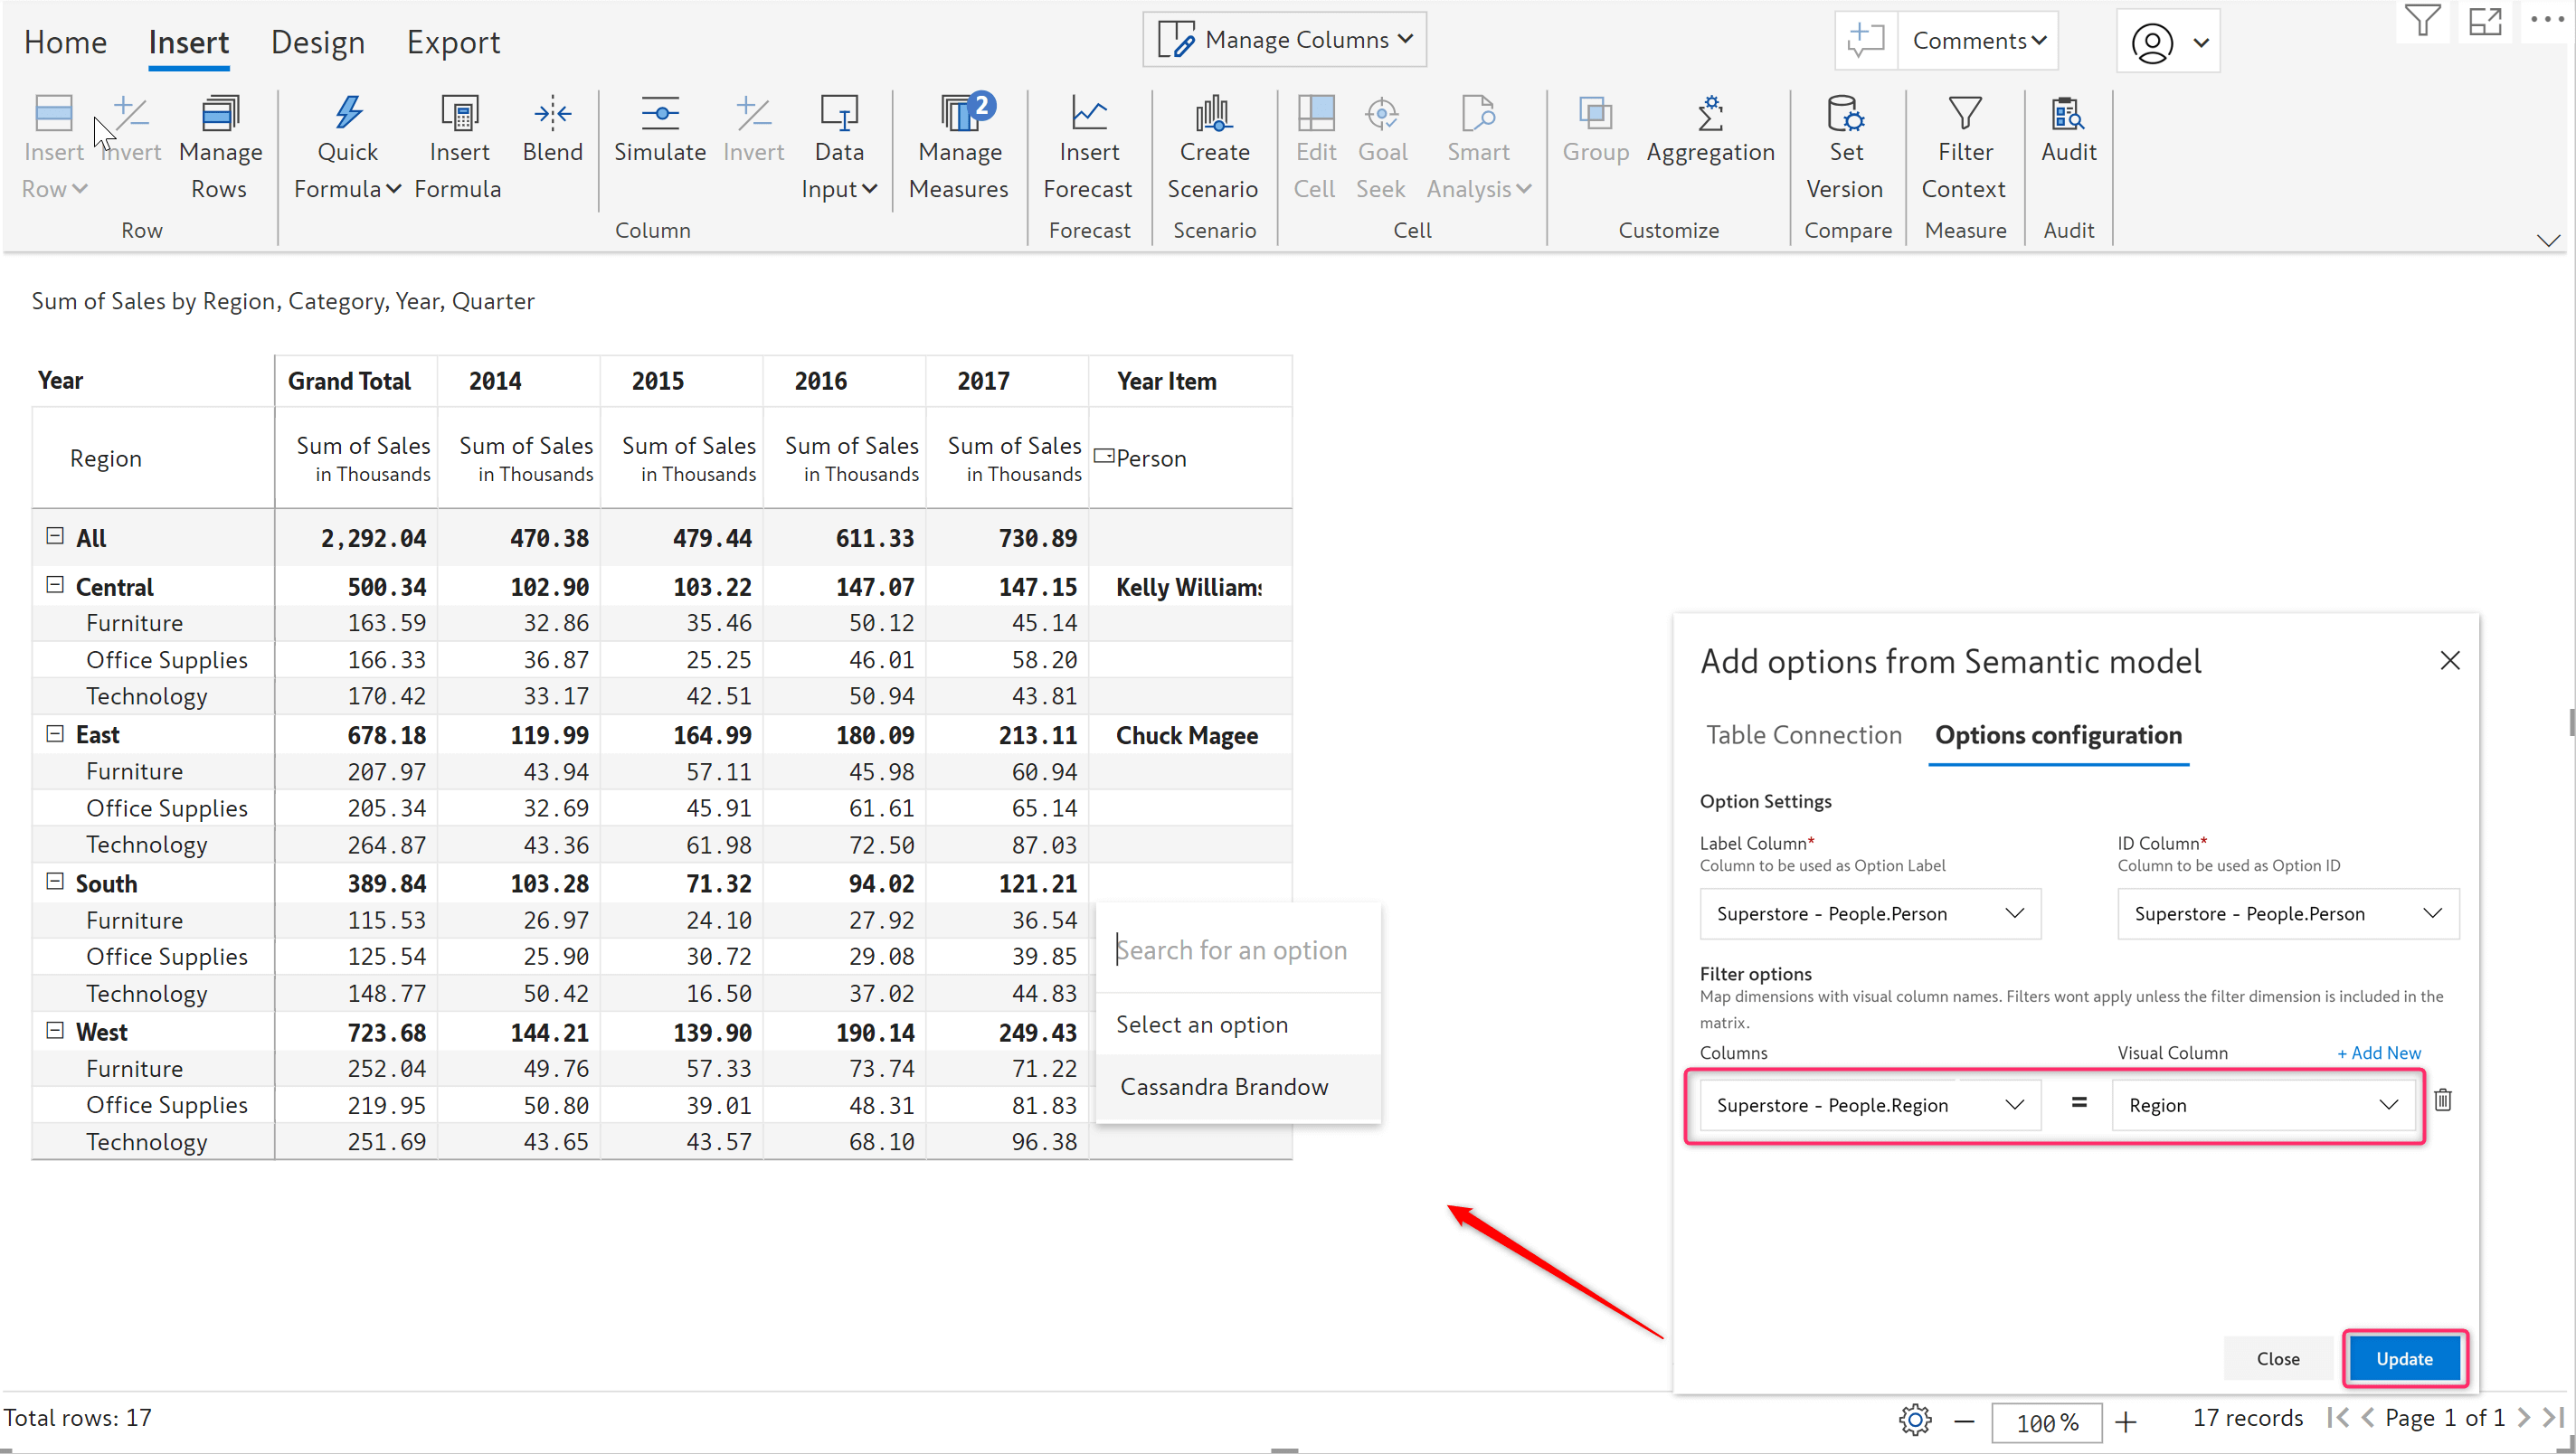
With Inforiver, you can specify a filter condition based on the dimensions in another table. The table used to populate the dropdown and the table to be joined should have a common field.
In this example, consider that we are assigning a person to the Central region. The dropdown should only show the people who are mapped to the central region and not those from other regions. The underlying table that populates the dropdown is the ‘Superstore’ table. However, to cross reference the region, we need to join the Superstore table with the Superstore – People table. You need to select the 'Join Table' option while connecting to a semantic model.
In the filter condition, you can now use the Region field from the ‘Superstore-People’ table.
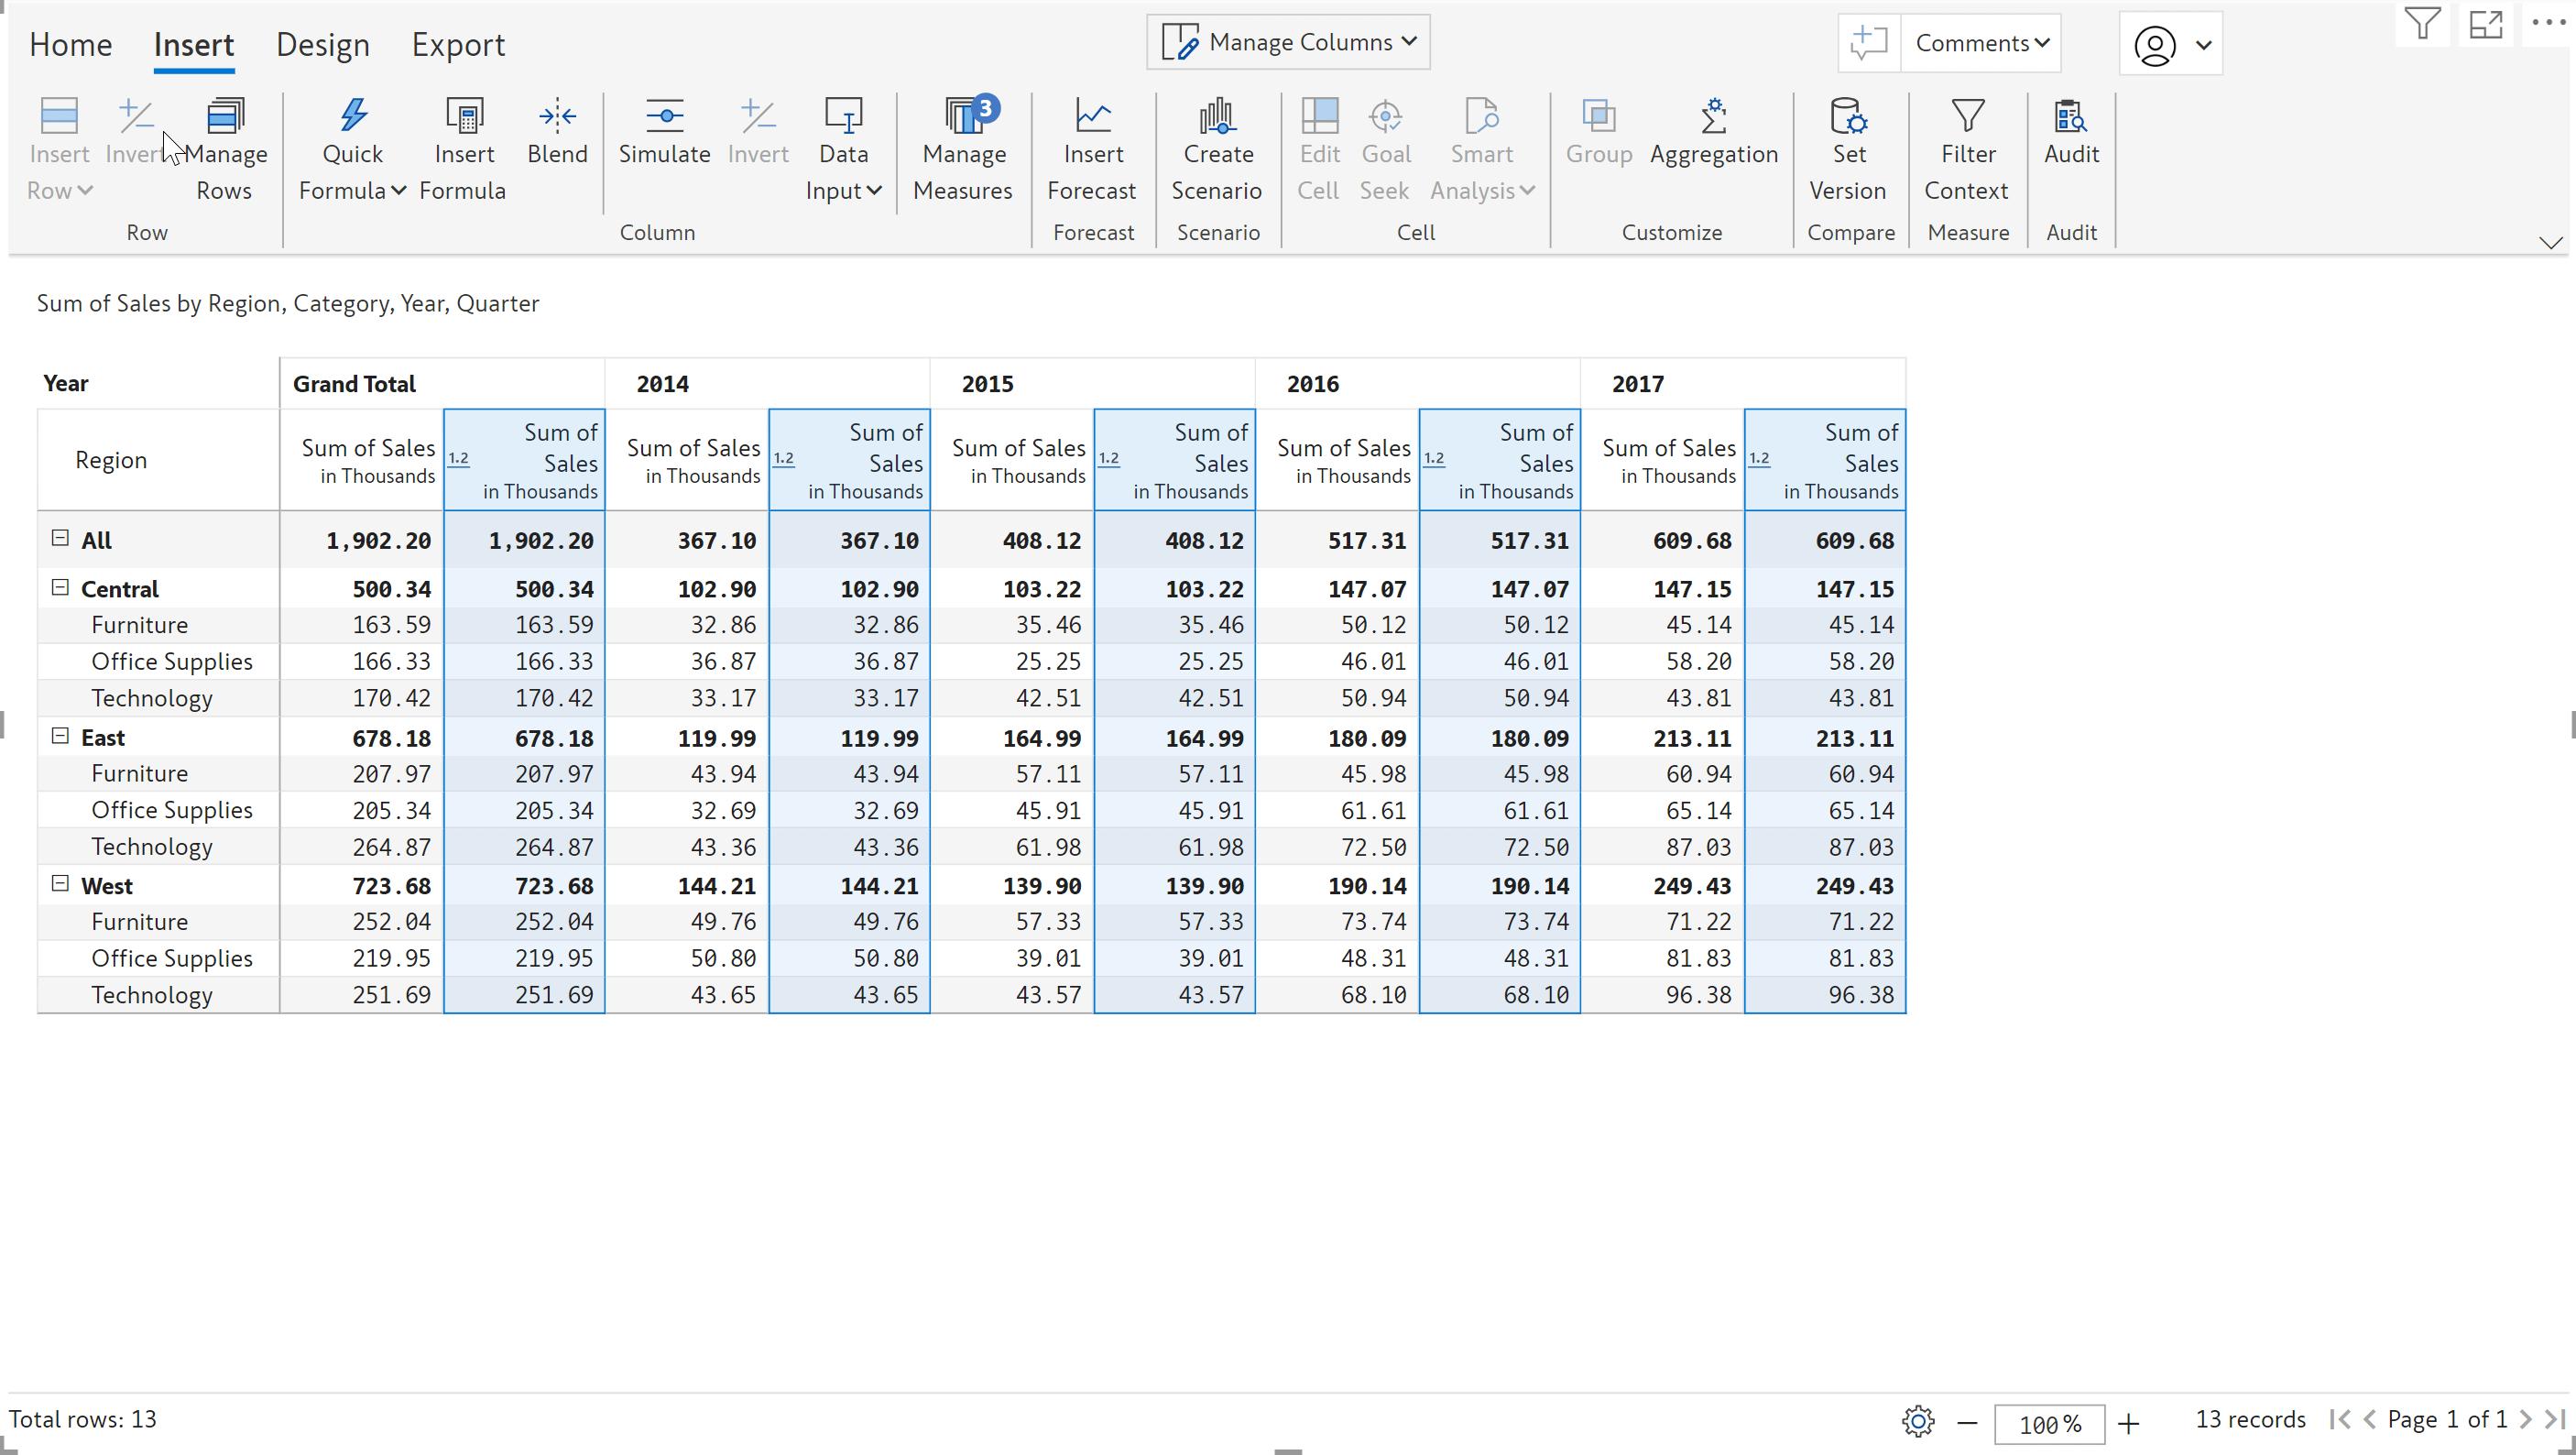
When you add new categories to your dataset, Inforiver automatically fills the data in the measure based on the default value configured while creating the measure.
The report below has data for three regions – Central, East and West.
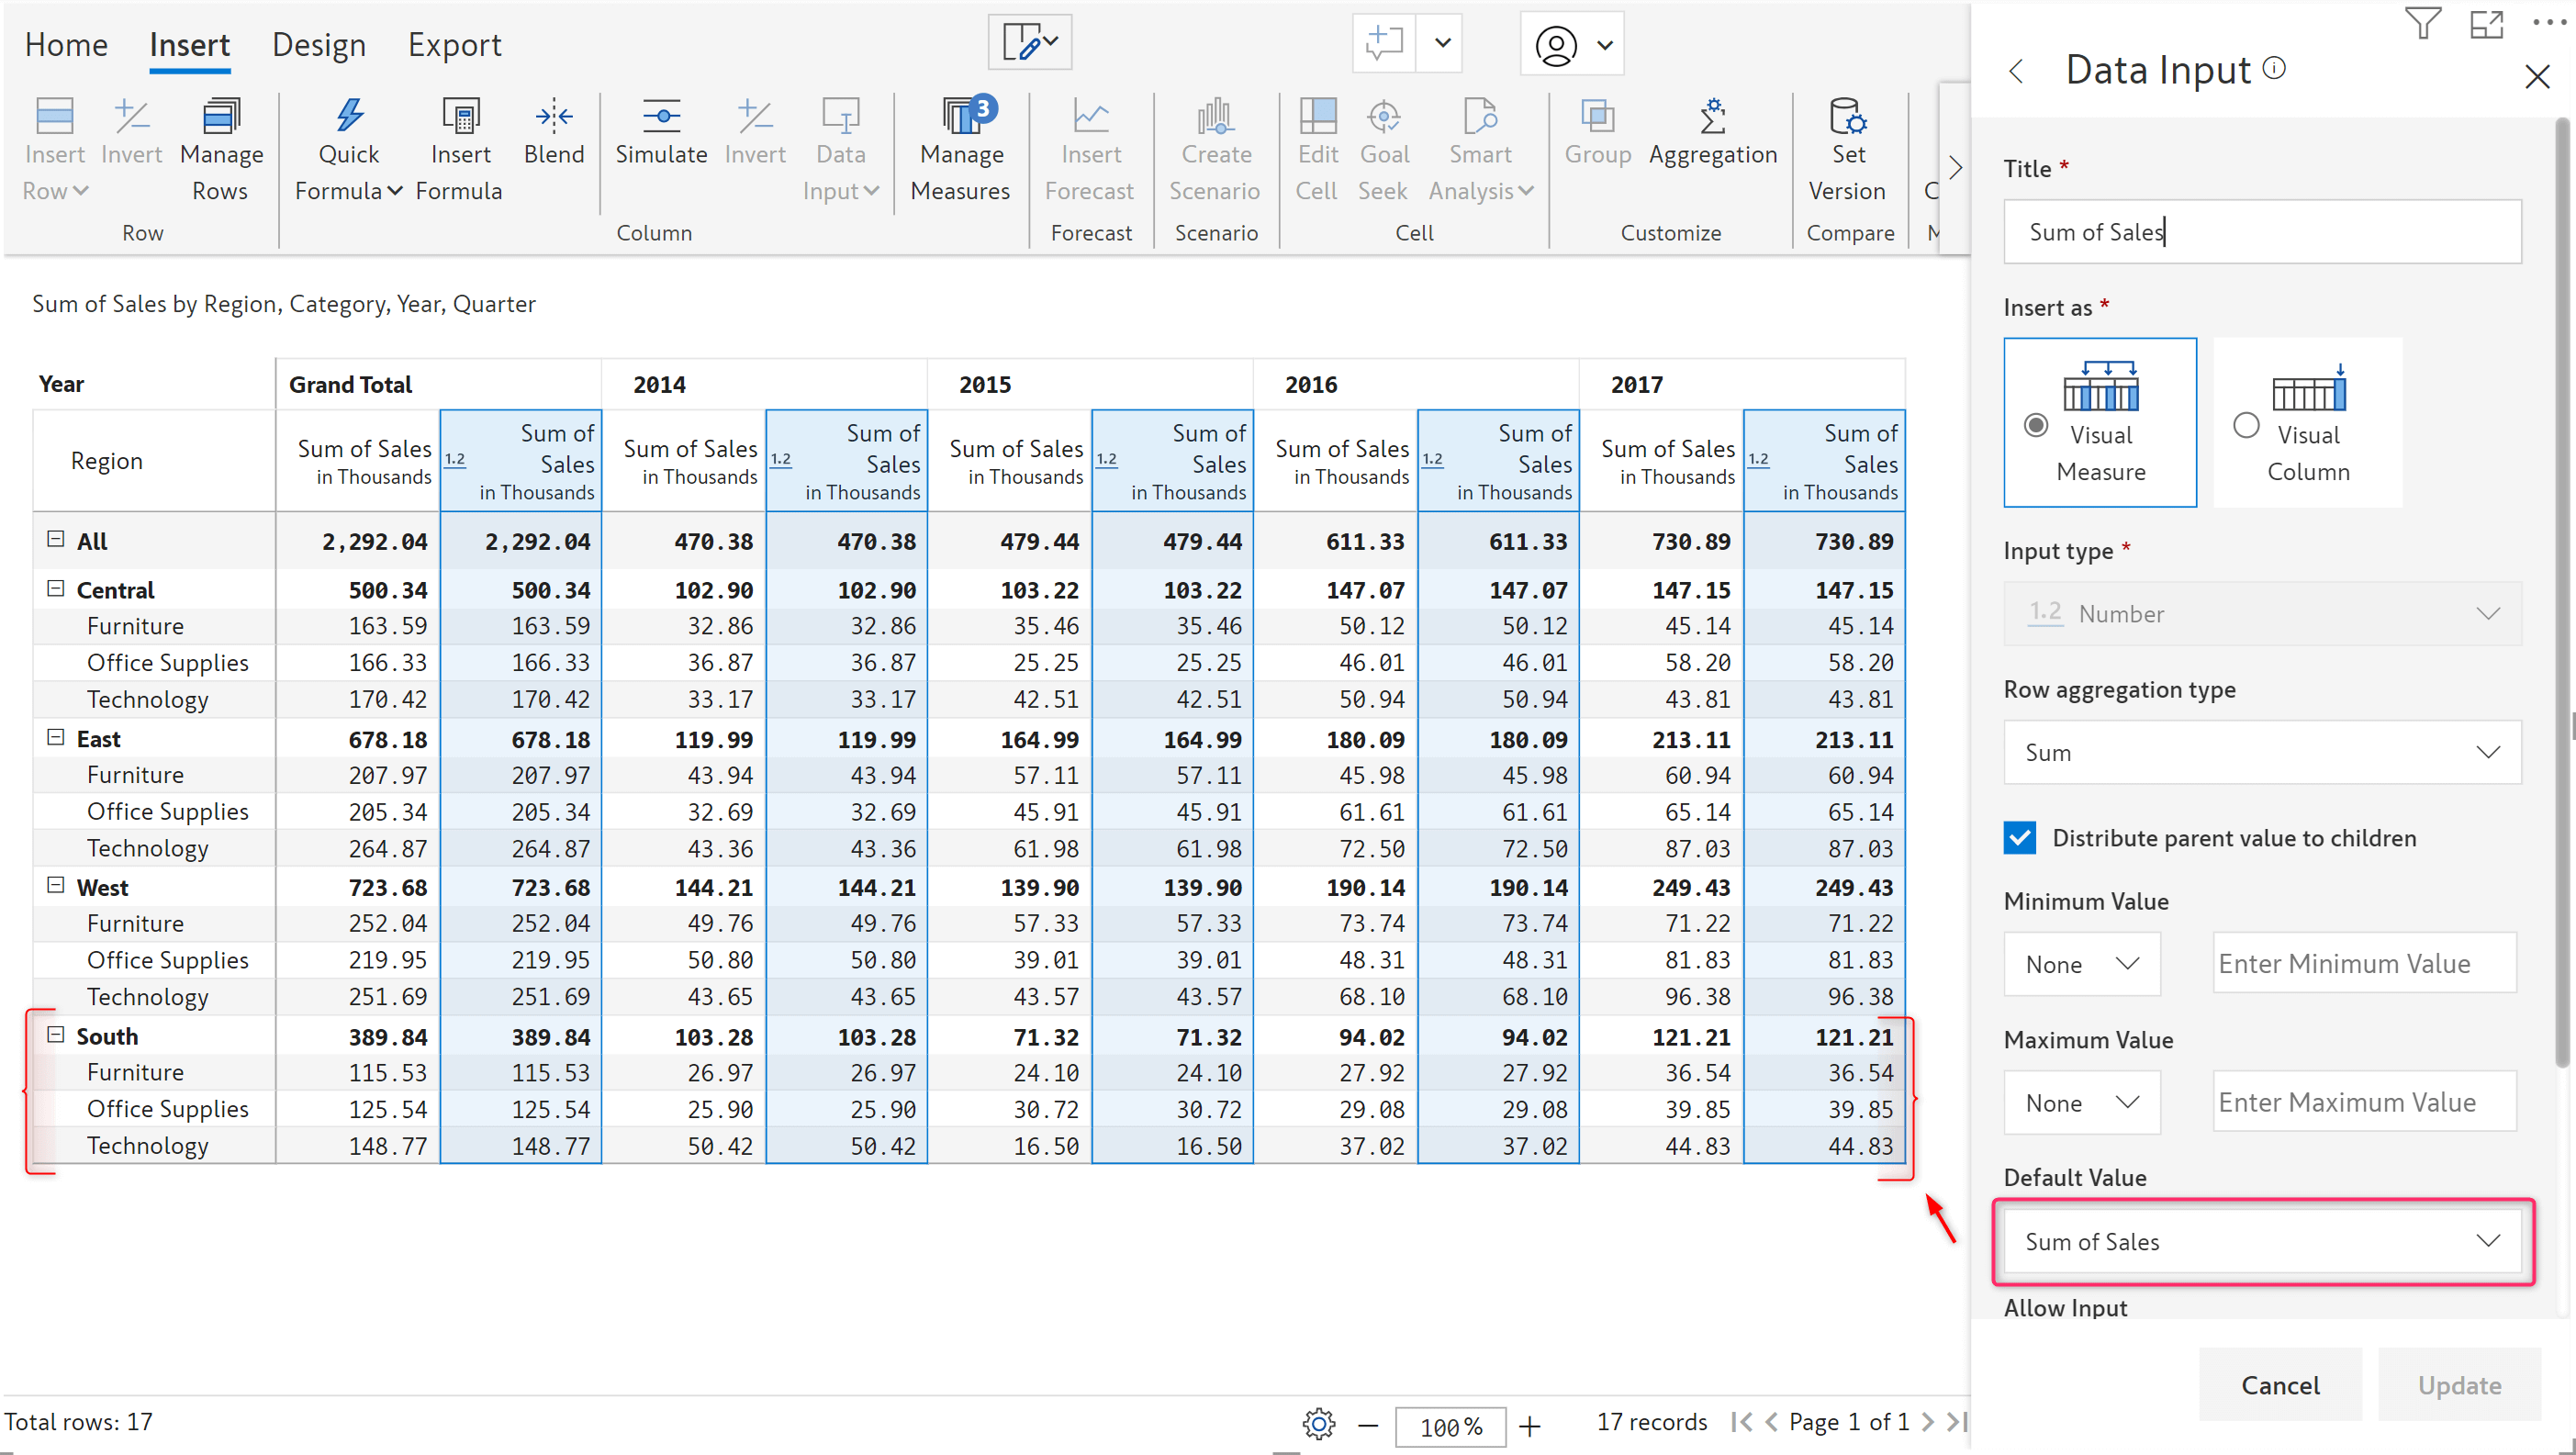
Now when you add data for ‘South’ region, the report automatically fills up the Sales measure based on the default values you have configured. You can seamlessly add new categories to your report and Inforiver will take care of populating the data. Note that this is only applicable for visual measures and not the visual columns.
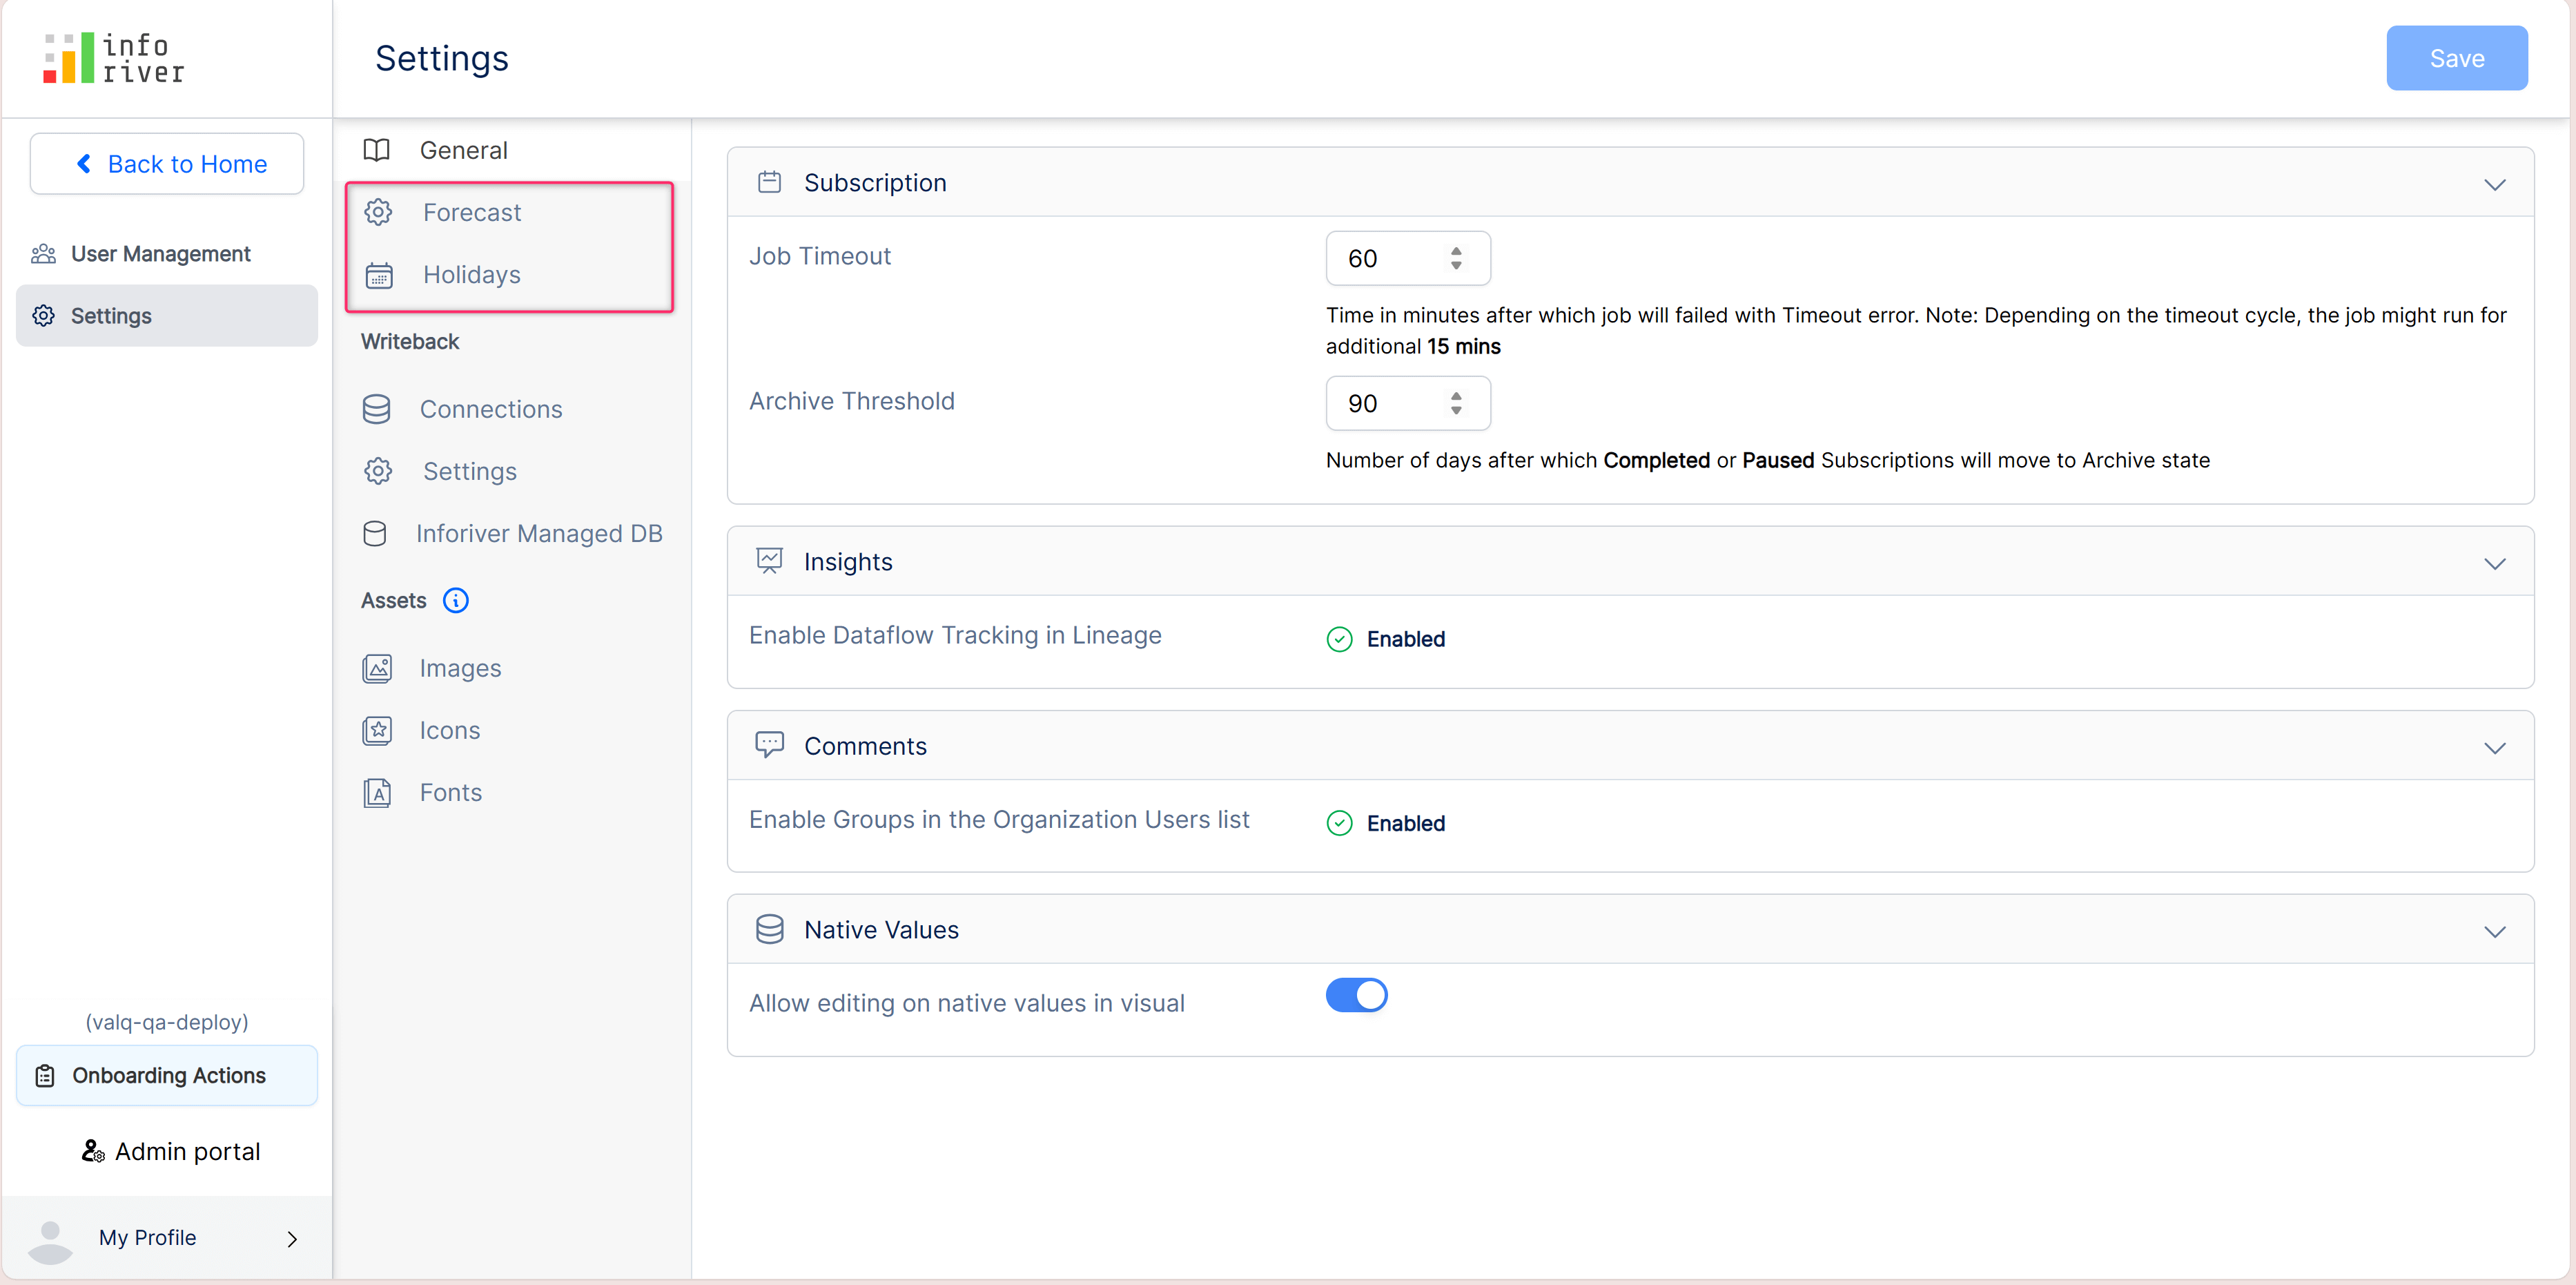
The 'Forecast' and 'Holidays' menus have now been moved to the General section. Previously, they were in the Assets section.
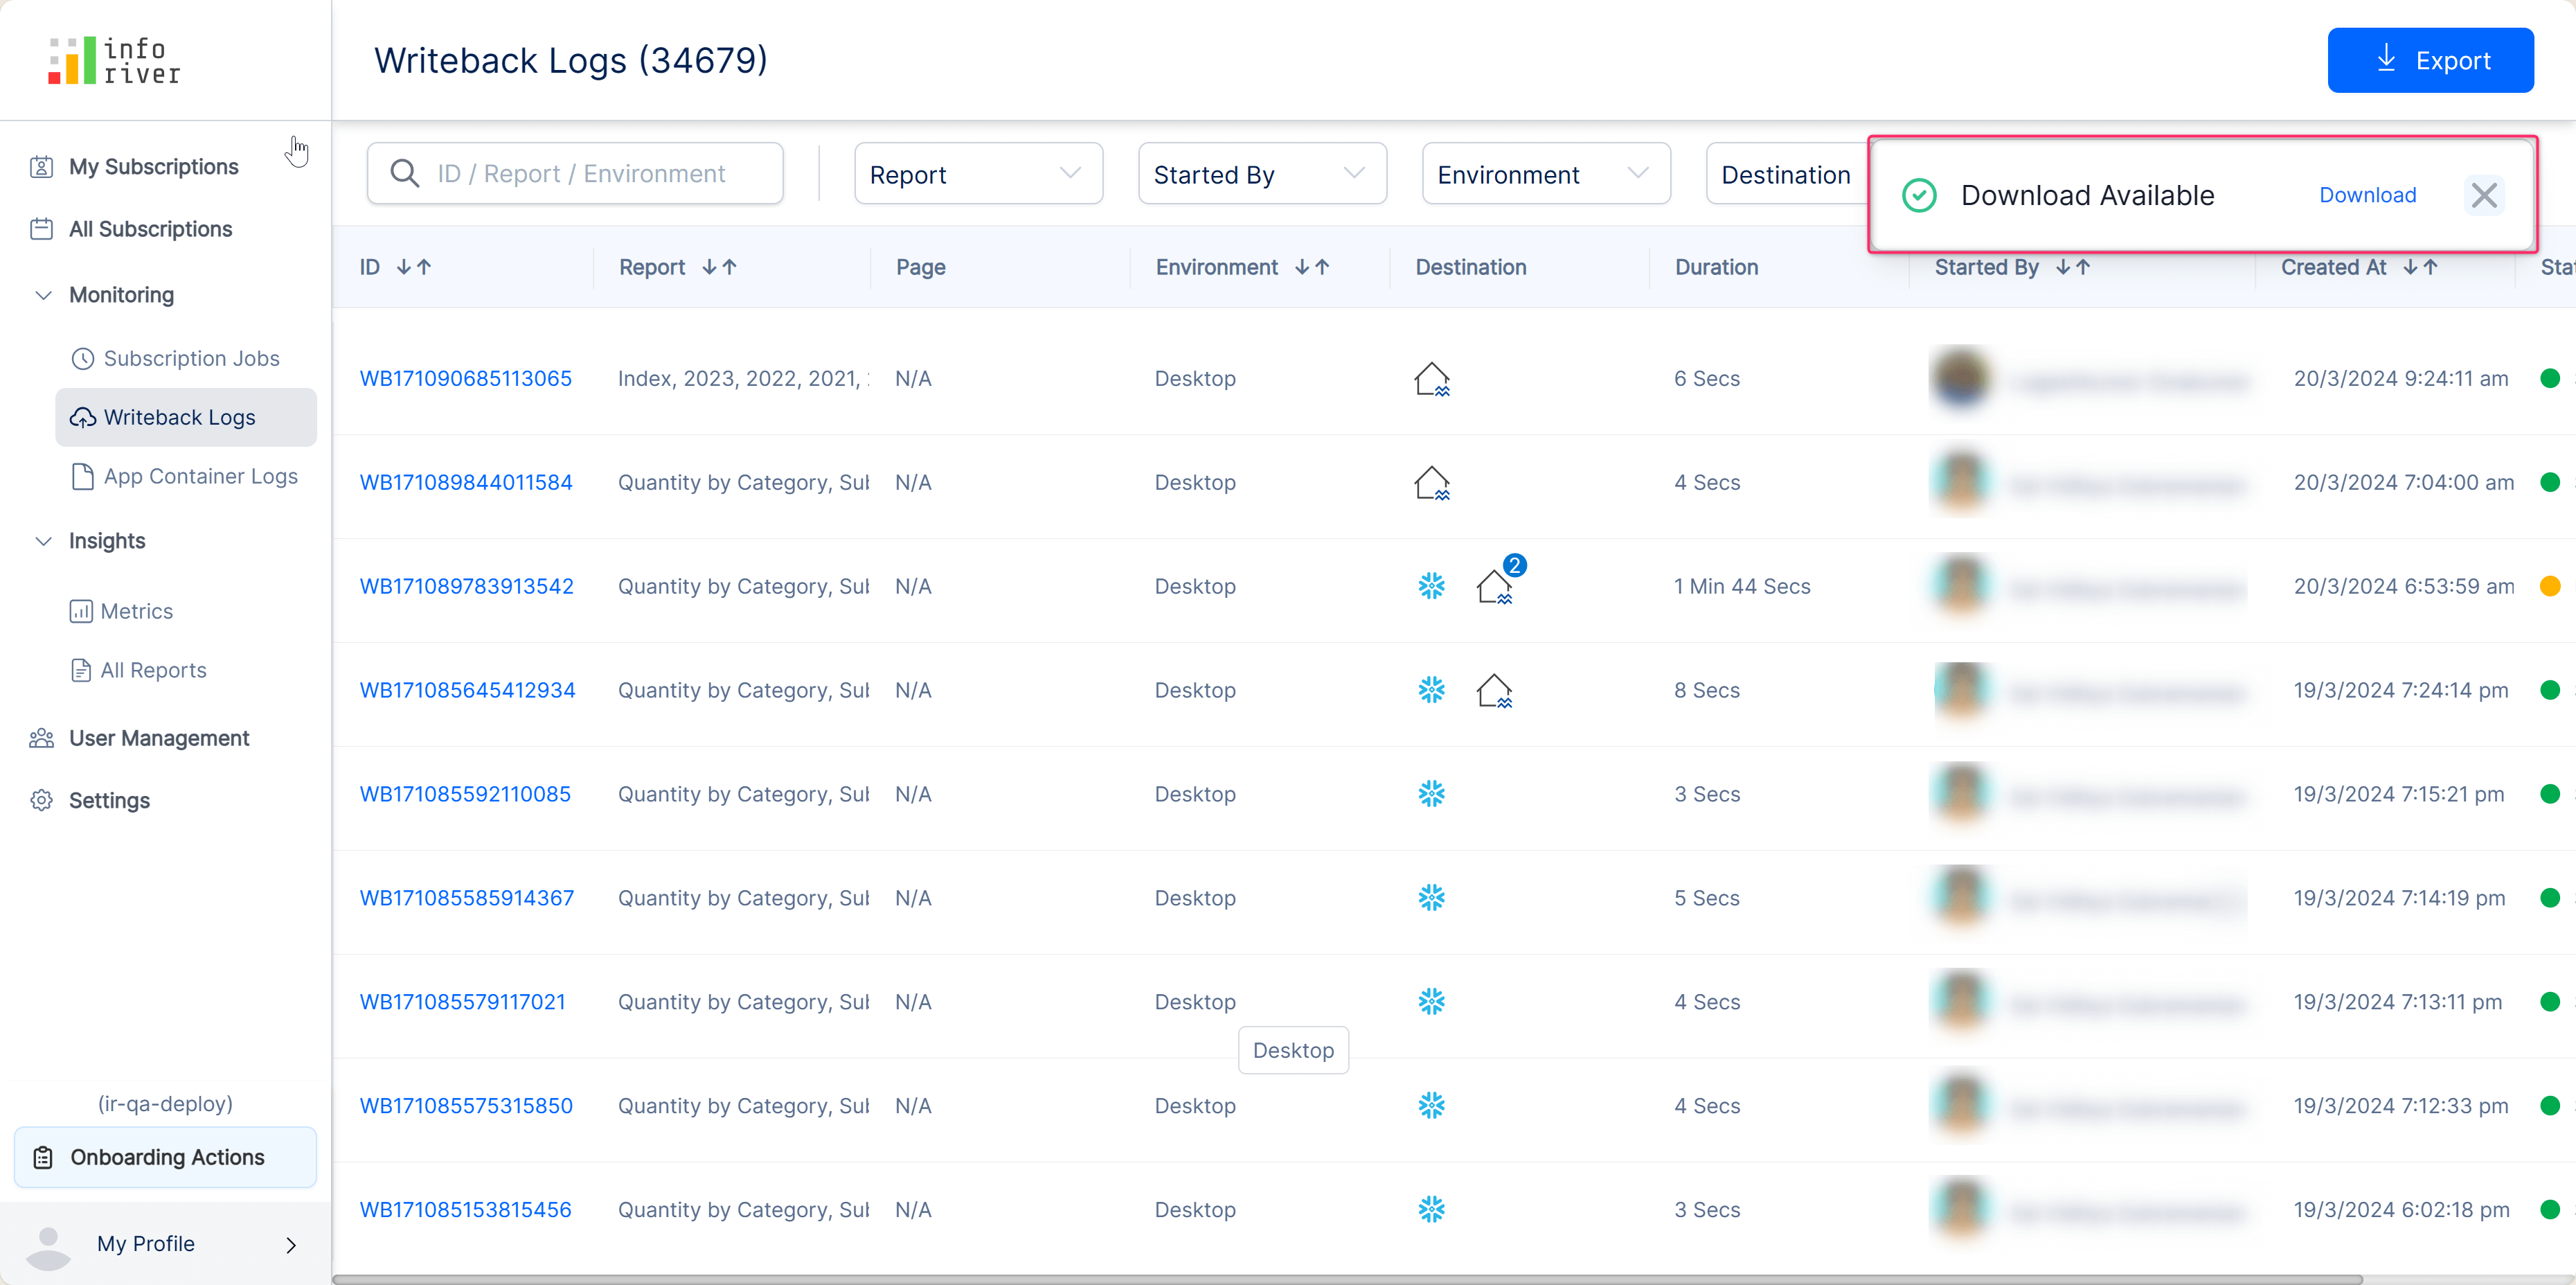
All toast messages that used to appear at the bottom of the window such as downloading or exporting logs will now show up at the top of the admin console, for increased visibility. It is also made user-dismissible and not auto-closed.
The refinements that we continuously make to Inforiver were made possible with your support and feedback. We look forward to receiving your suggestions and have many more exciting innovations lined up! Visit the Inforiver Community to share your ideas, vote on other submissions, and interact with other users.
Inforiver helps enterprises consolidate planning, reporting & analytics on a single platform (Power BI). The no-code, self-service award-winning platform has been recognized as the industry’s best and is adopted by many Fortune 100 firms.
Inforiver is a product of Lumel, the #1 Power BI AppSource Partner. The firm serves over 3,000 customers worldwide through its portfolio of products offered under the brands Inforiver, EDITable, ValQ, and xViz.