
Upcoming webinar on 'Inforiver Charts : The fastest way to deliver stories in Power BI', Aug 29th , Monday, 10.30 AM CST. Register Now
Upcoming webinar on 'Inforiver Charts : The fastest way to deliver stories in Power BI', Aug 29th , Monday, 10.30 AM CST. Register Now
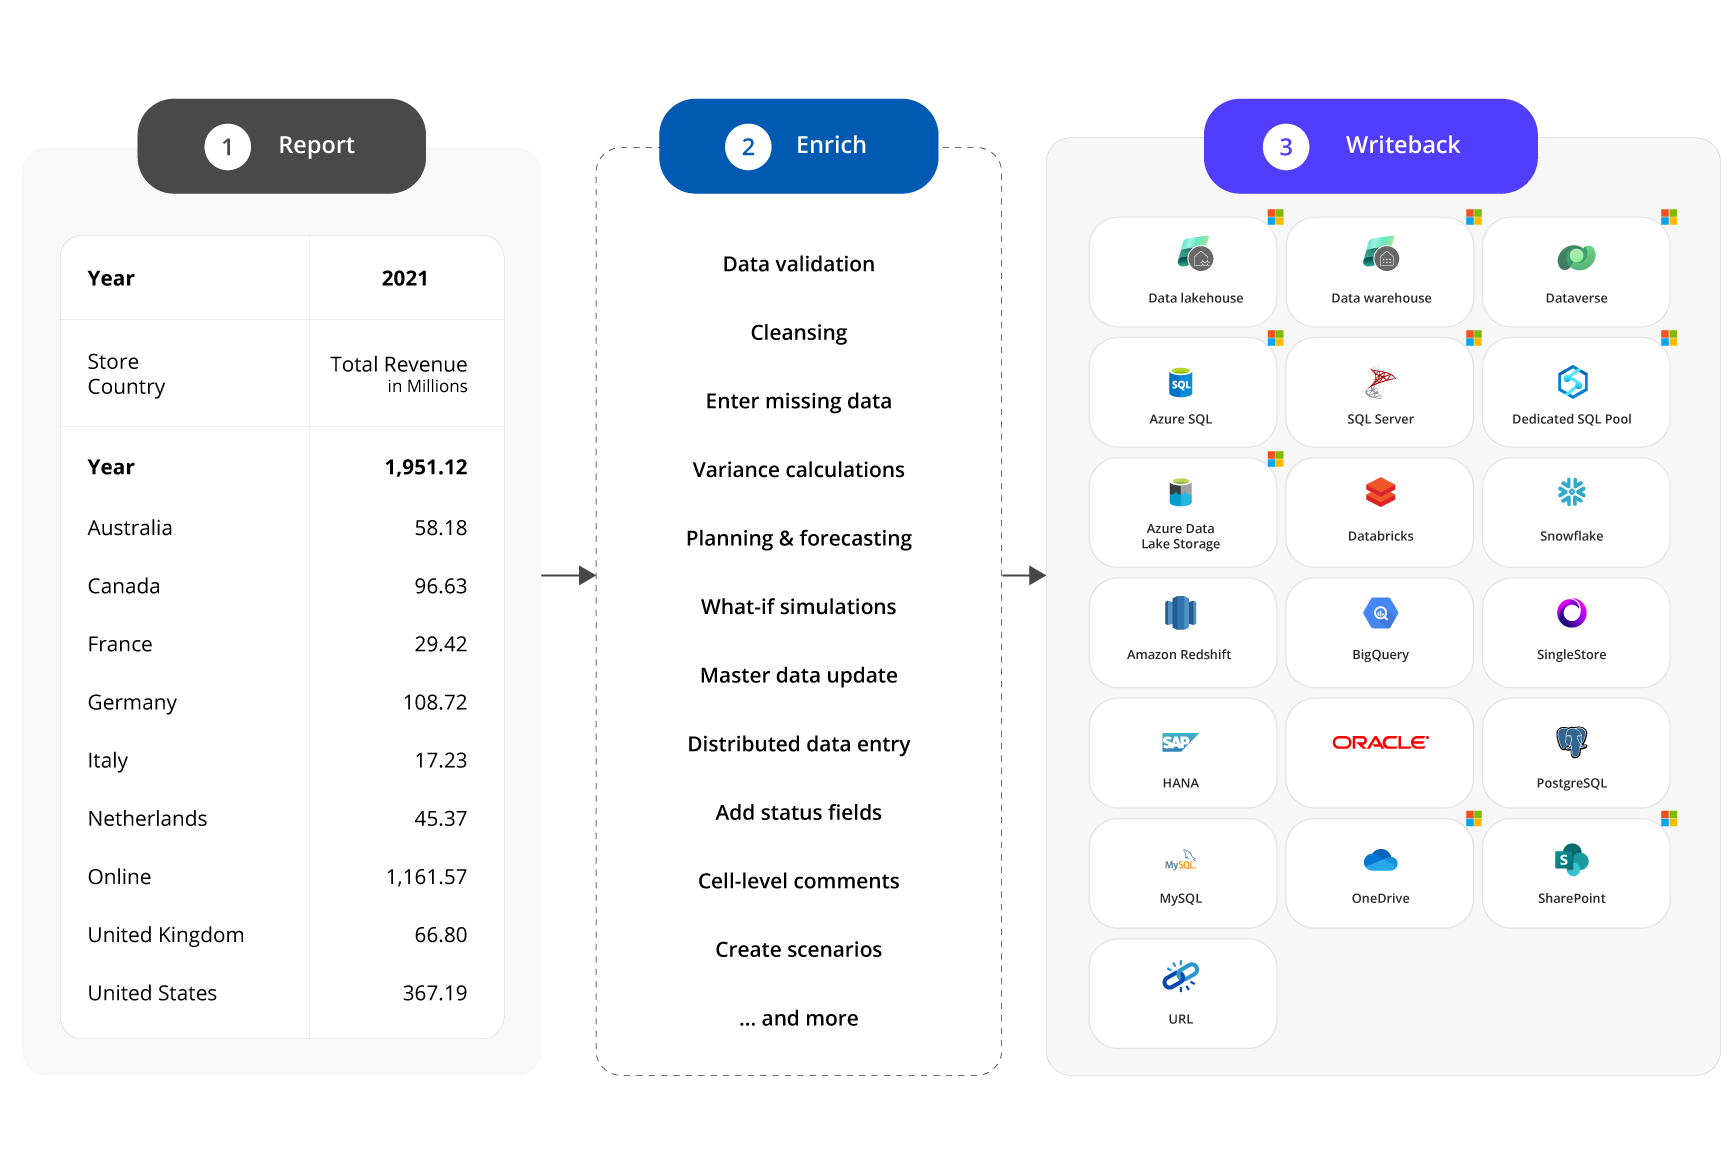
With Inforiver’s user-friendly writeback capability users can post data and comments from the visual to databases such as Azure SQL, SQL Server, Snowflake, BigQuery, Oracle, and more. Users can also writeback to shared drives such as OneDrive and SharePoint and URL endpoints.
Enterprises looking to build reports expect flexibility in layout, presentation & formatting. What has been originally an IT-centric capability is now available through a low-code/no-code experience for business users.
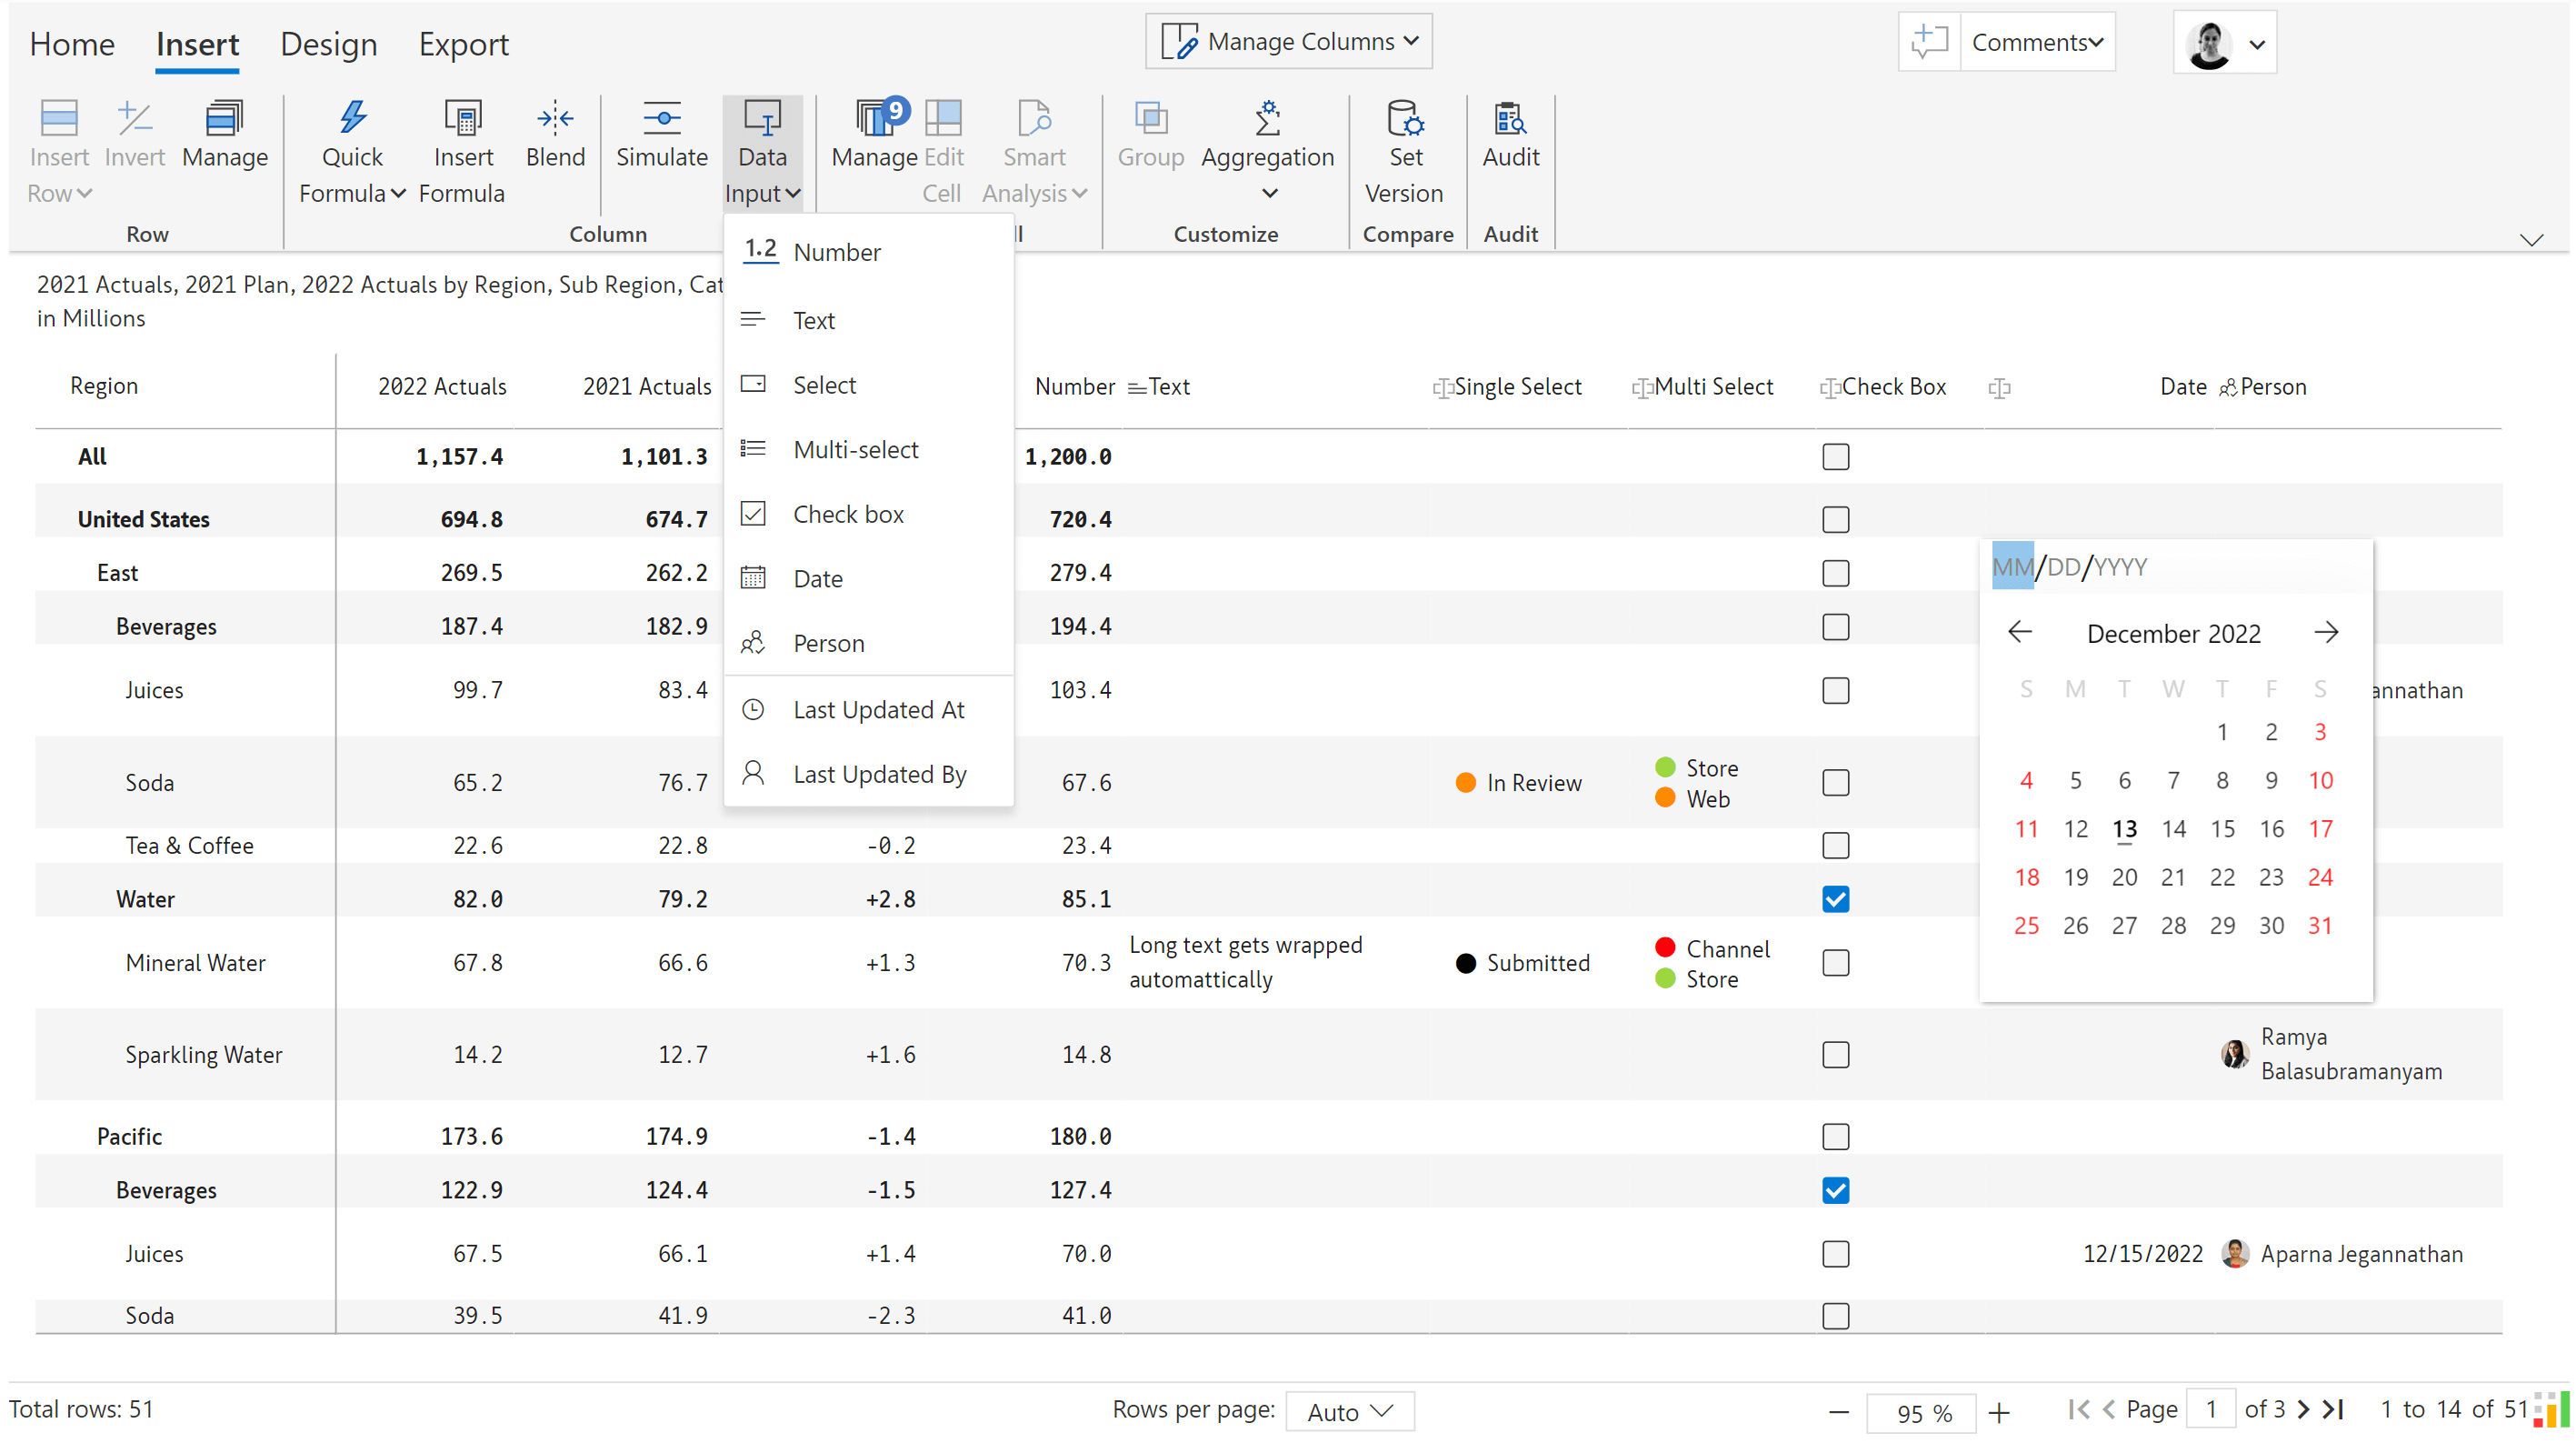
Distributed data entry where multiple users in an organization need to populate a report with values, dates, text etc. has several practical applications. Inforiver provides several data input types such as number, single/multi select, text, date and more.
Inforiver provides an intuitive way of performing planning, budgeting & allocations through an editable table interface. You can create a new plan/budget based on an existing data series or from scratch (Zero-based Budgeting).
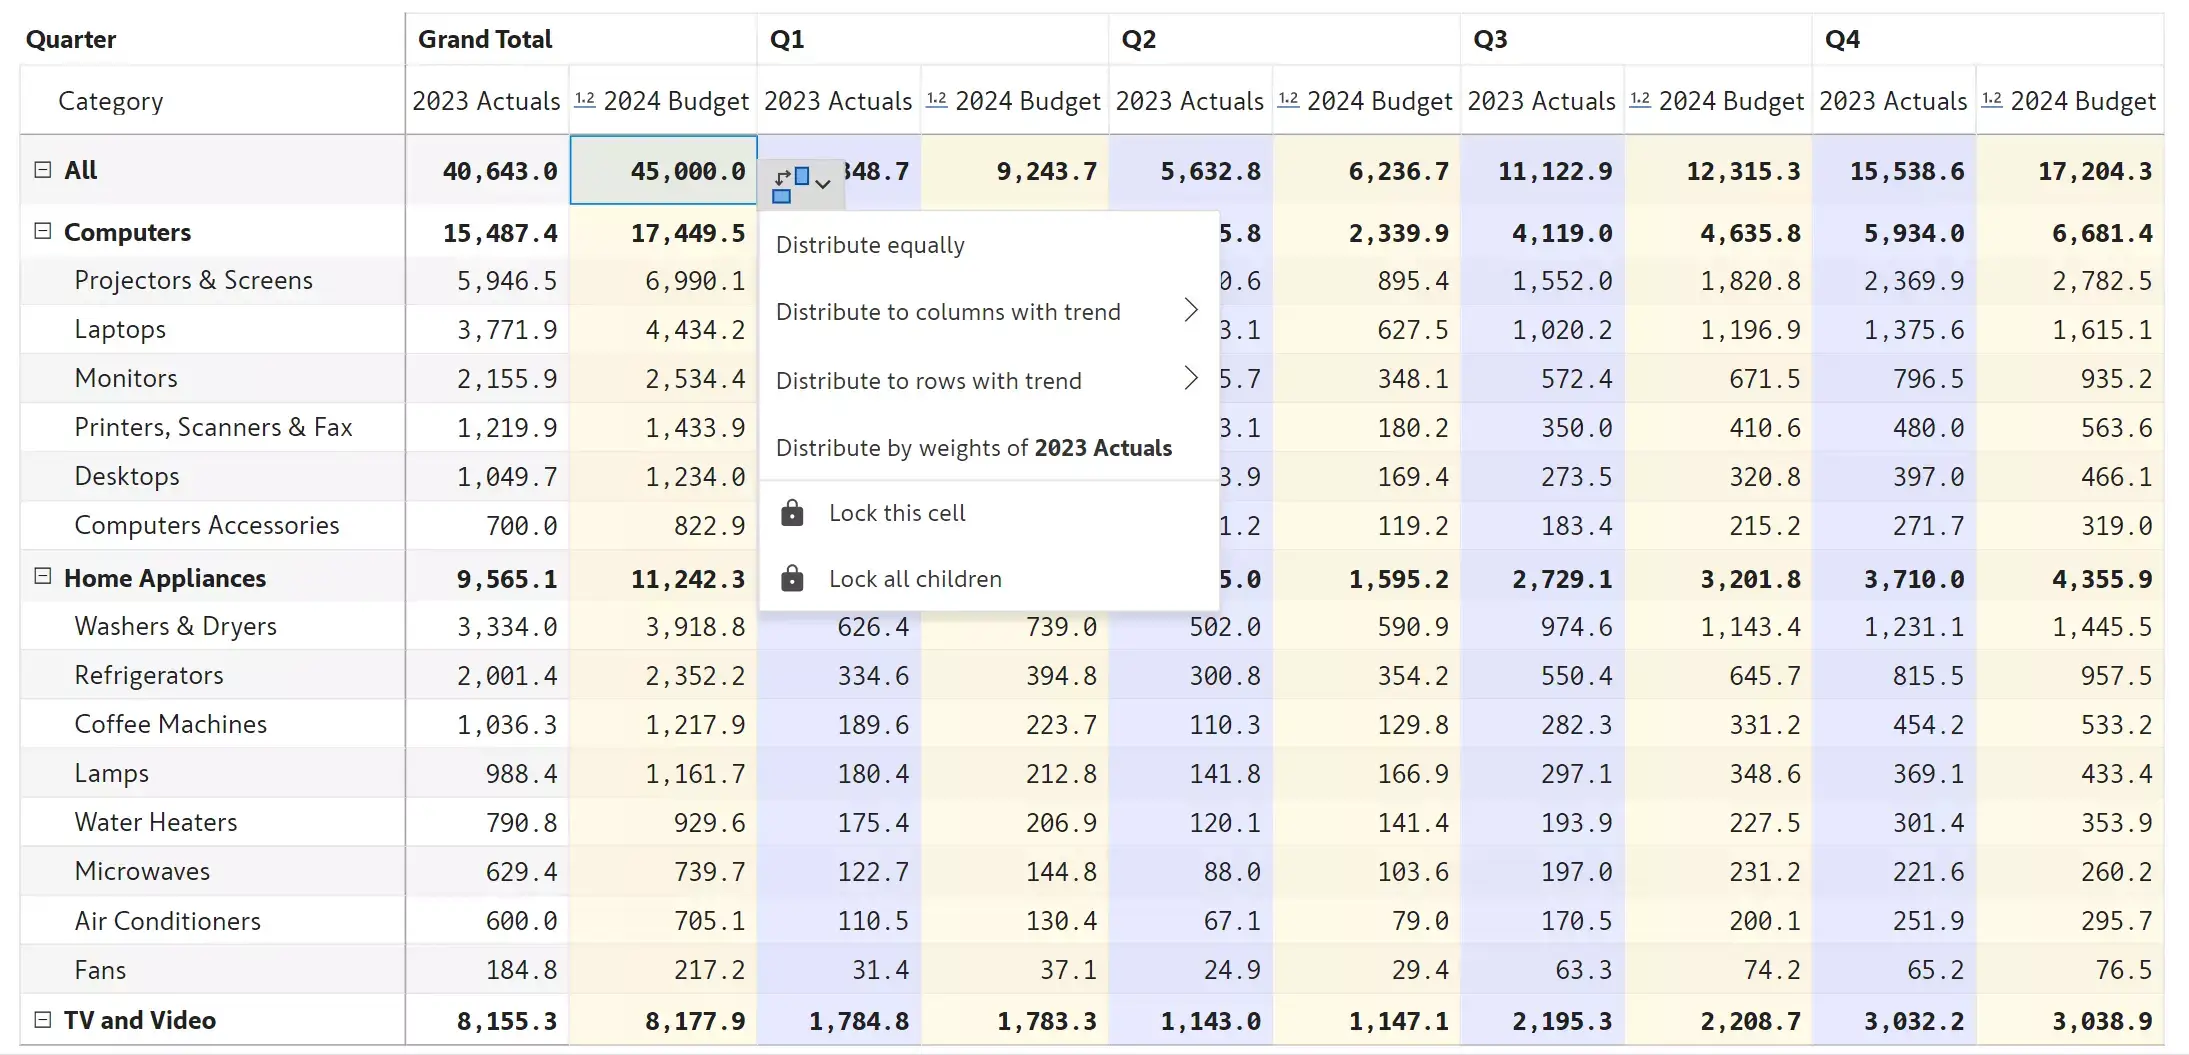
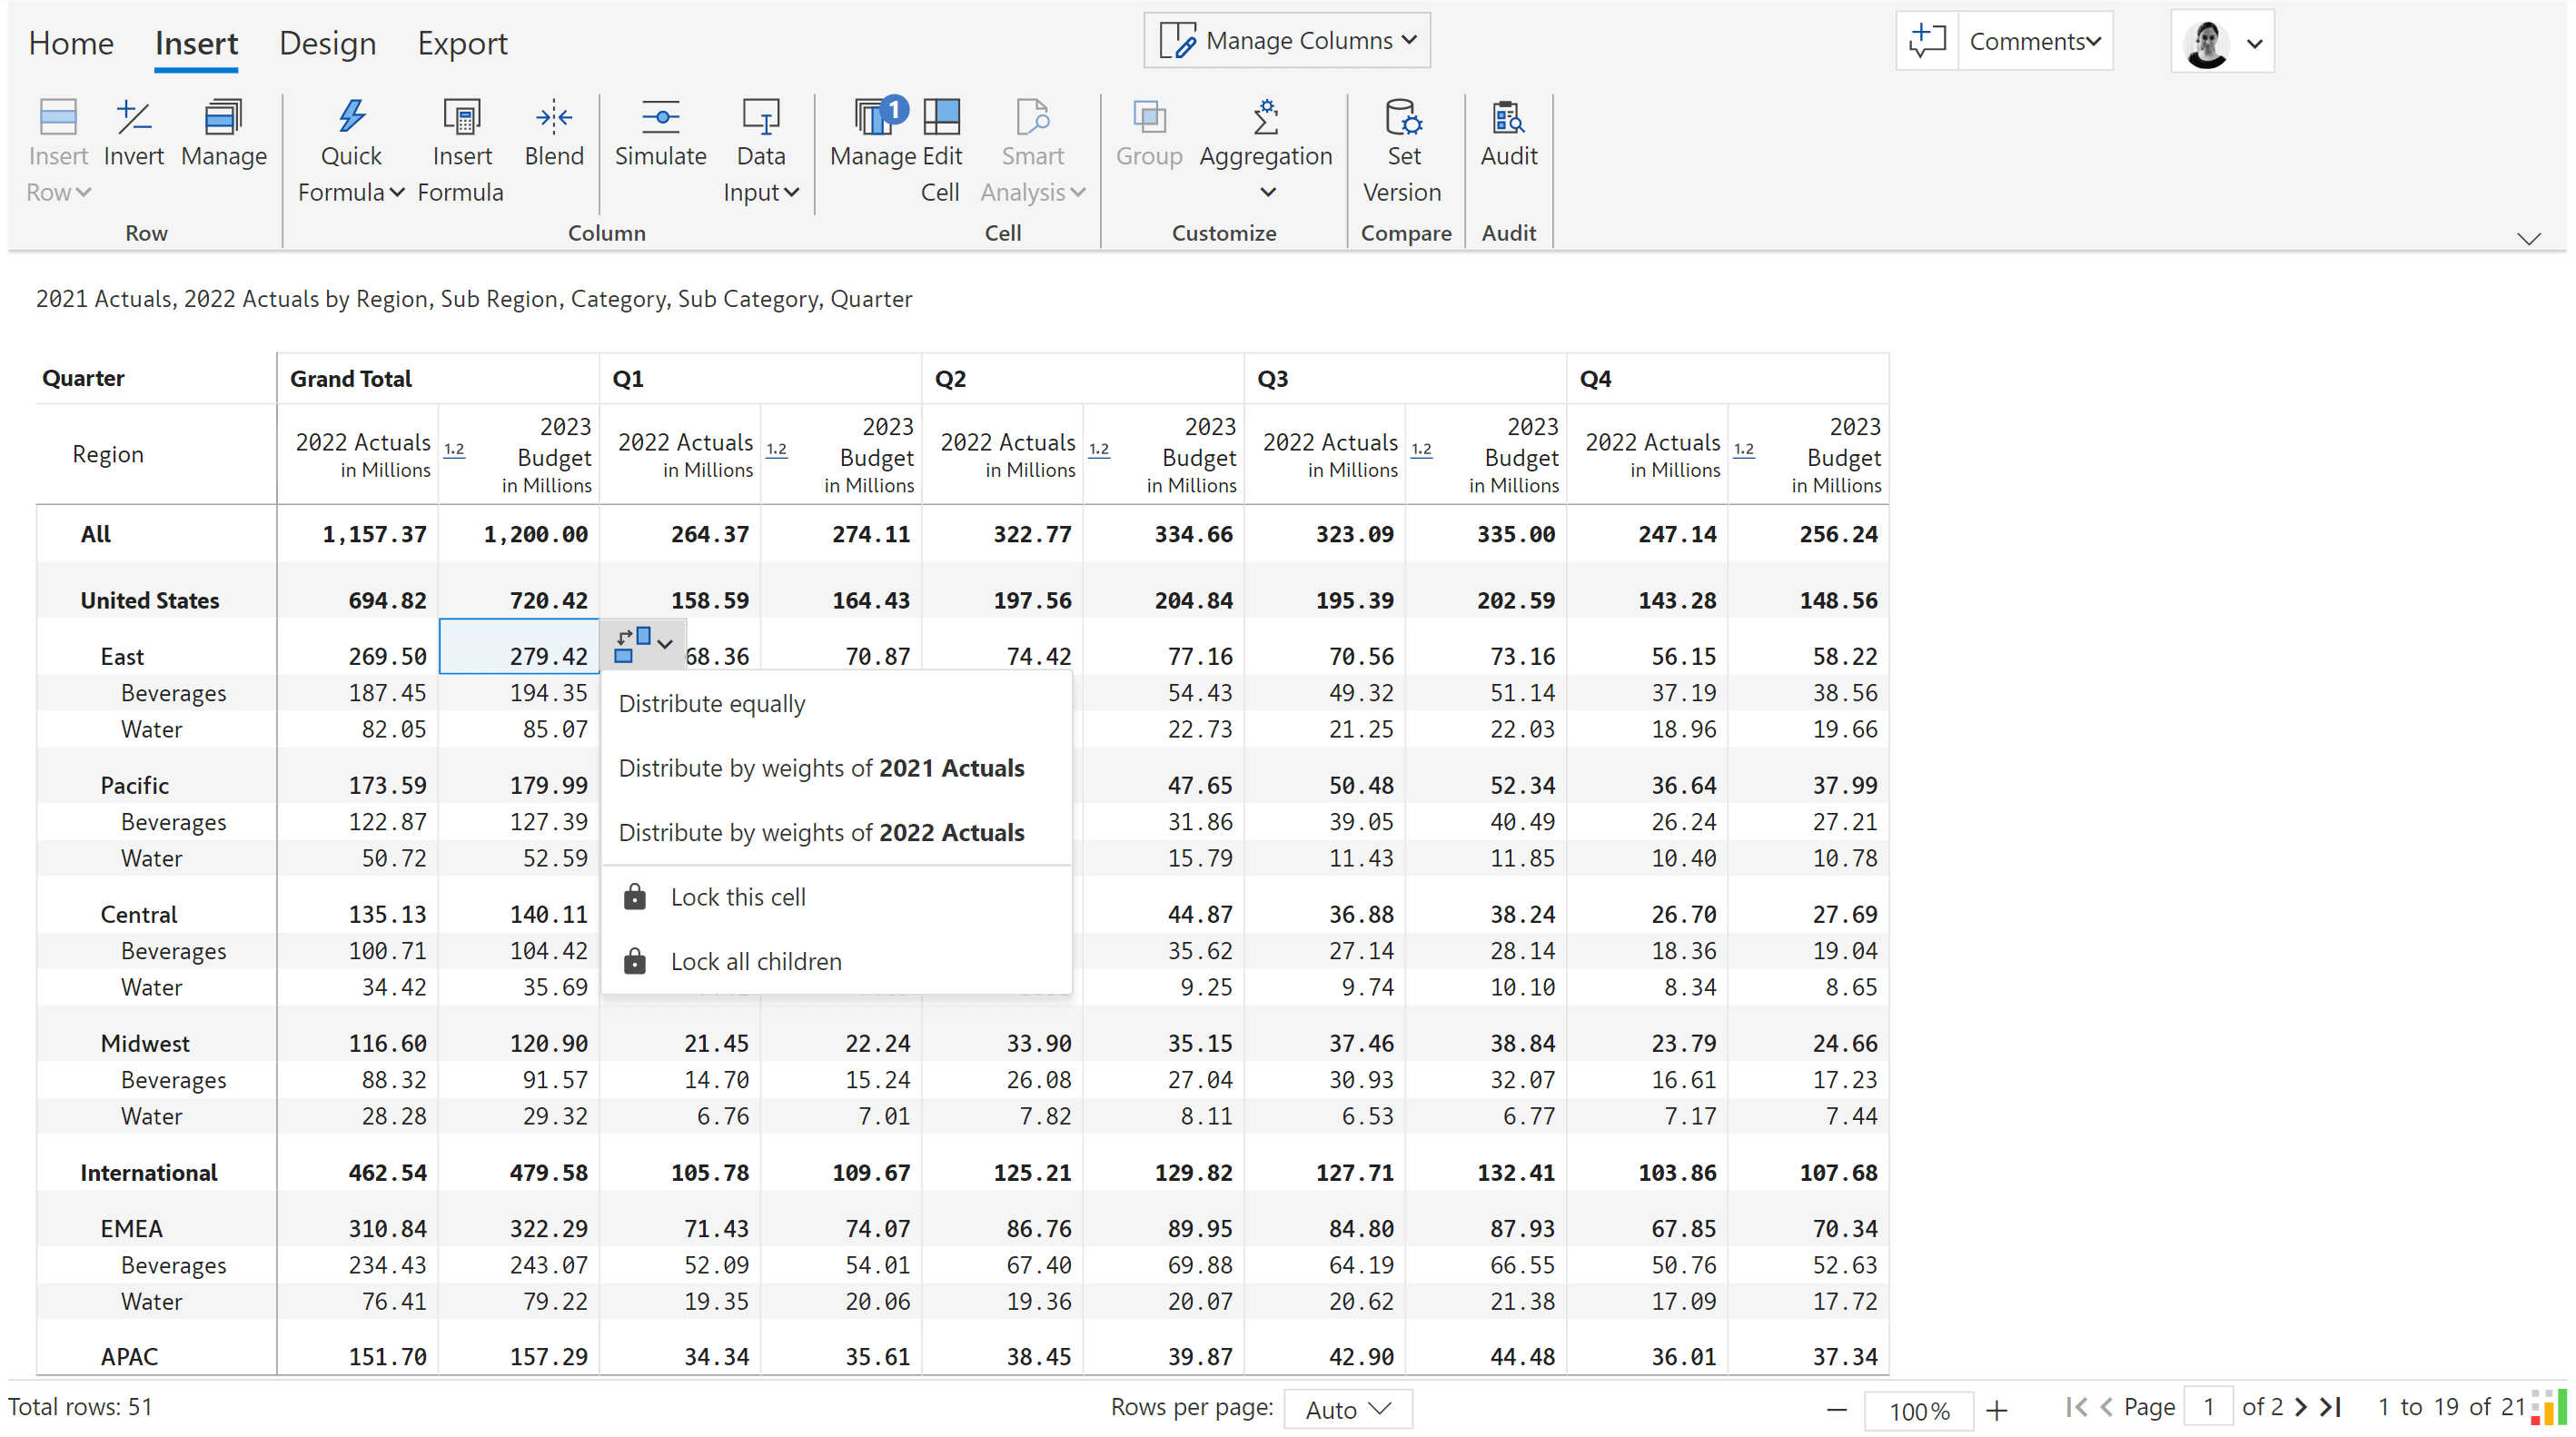
With Inforiver, you can quickly create sales forecasts, business plans or financial budgets. Any value entered in a parent row gets distributed to its children. By default, it is distributed equally, but you can also opt to distribute based on other data (e.g., prior year actuals). Values entered in child rows automatically roll up to the top.
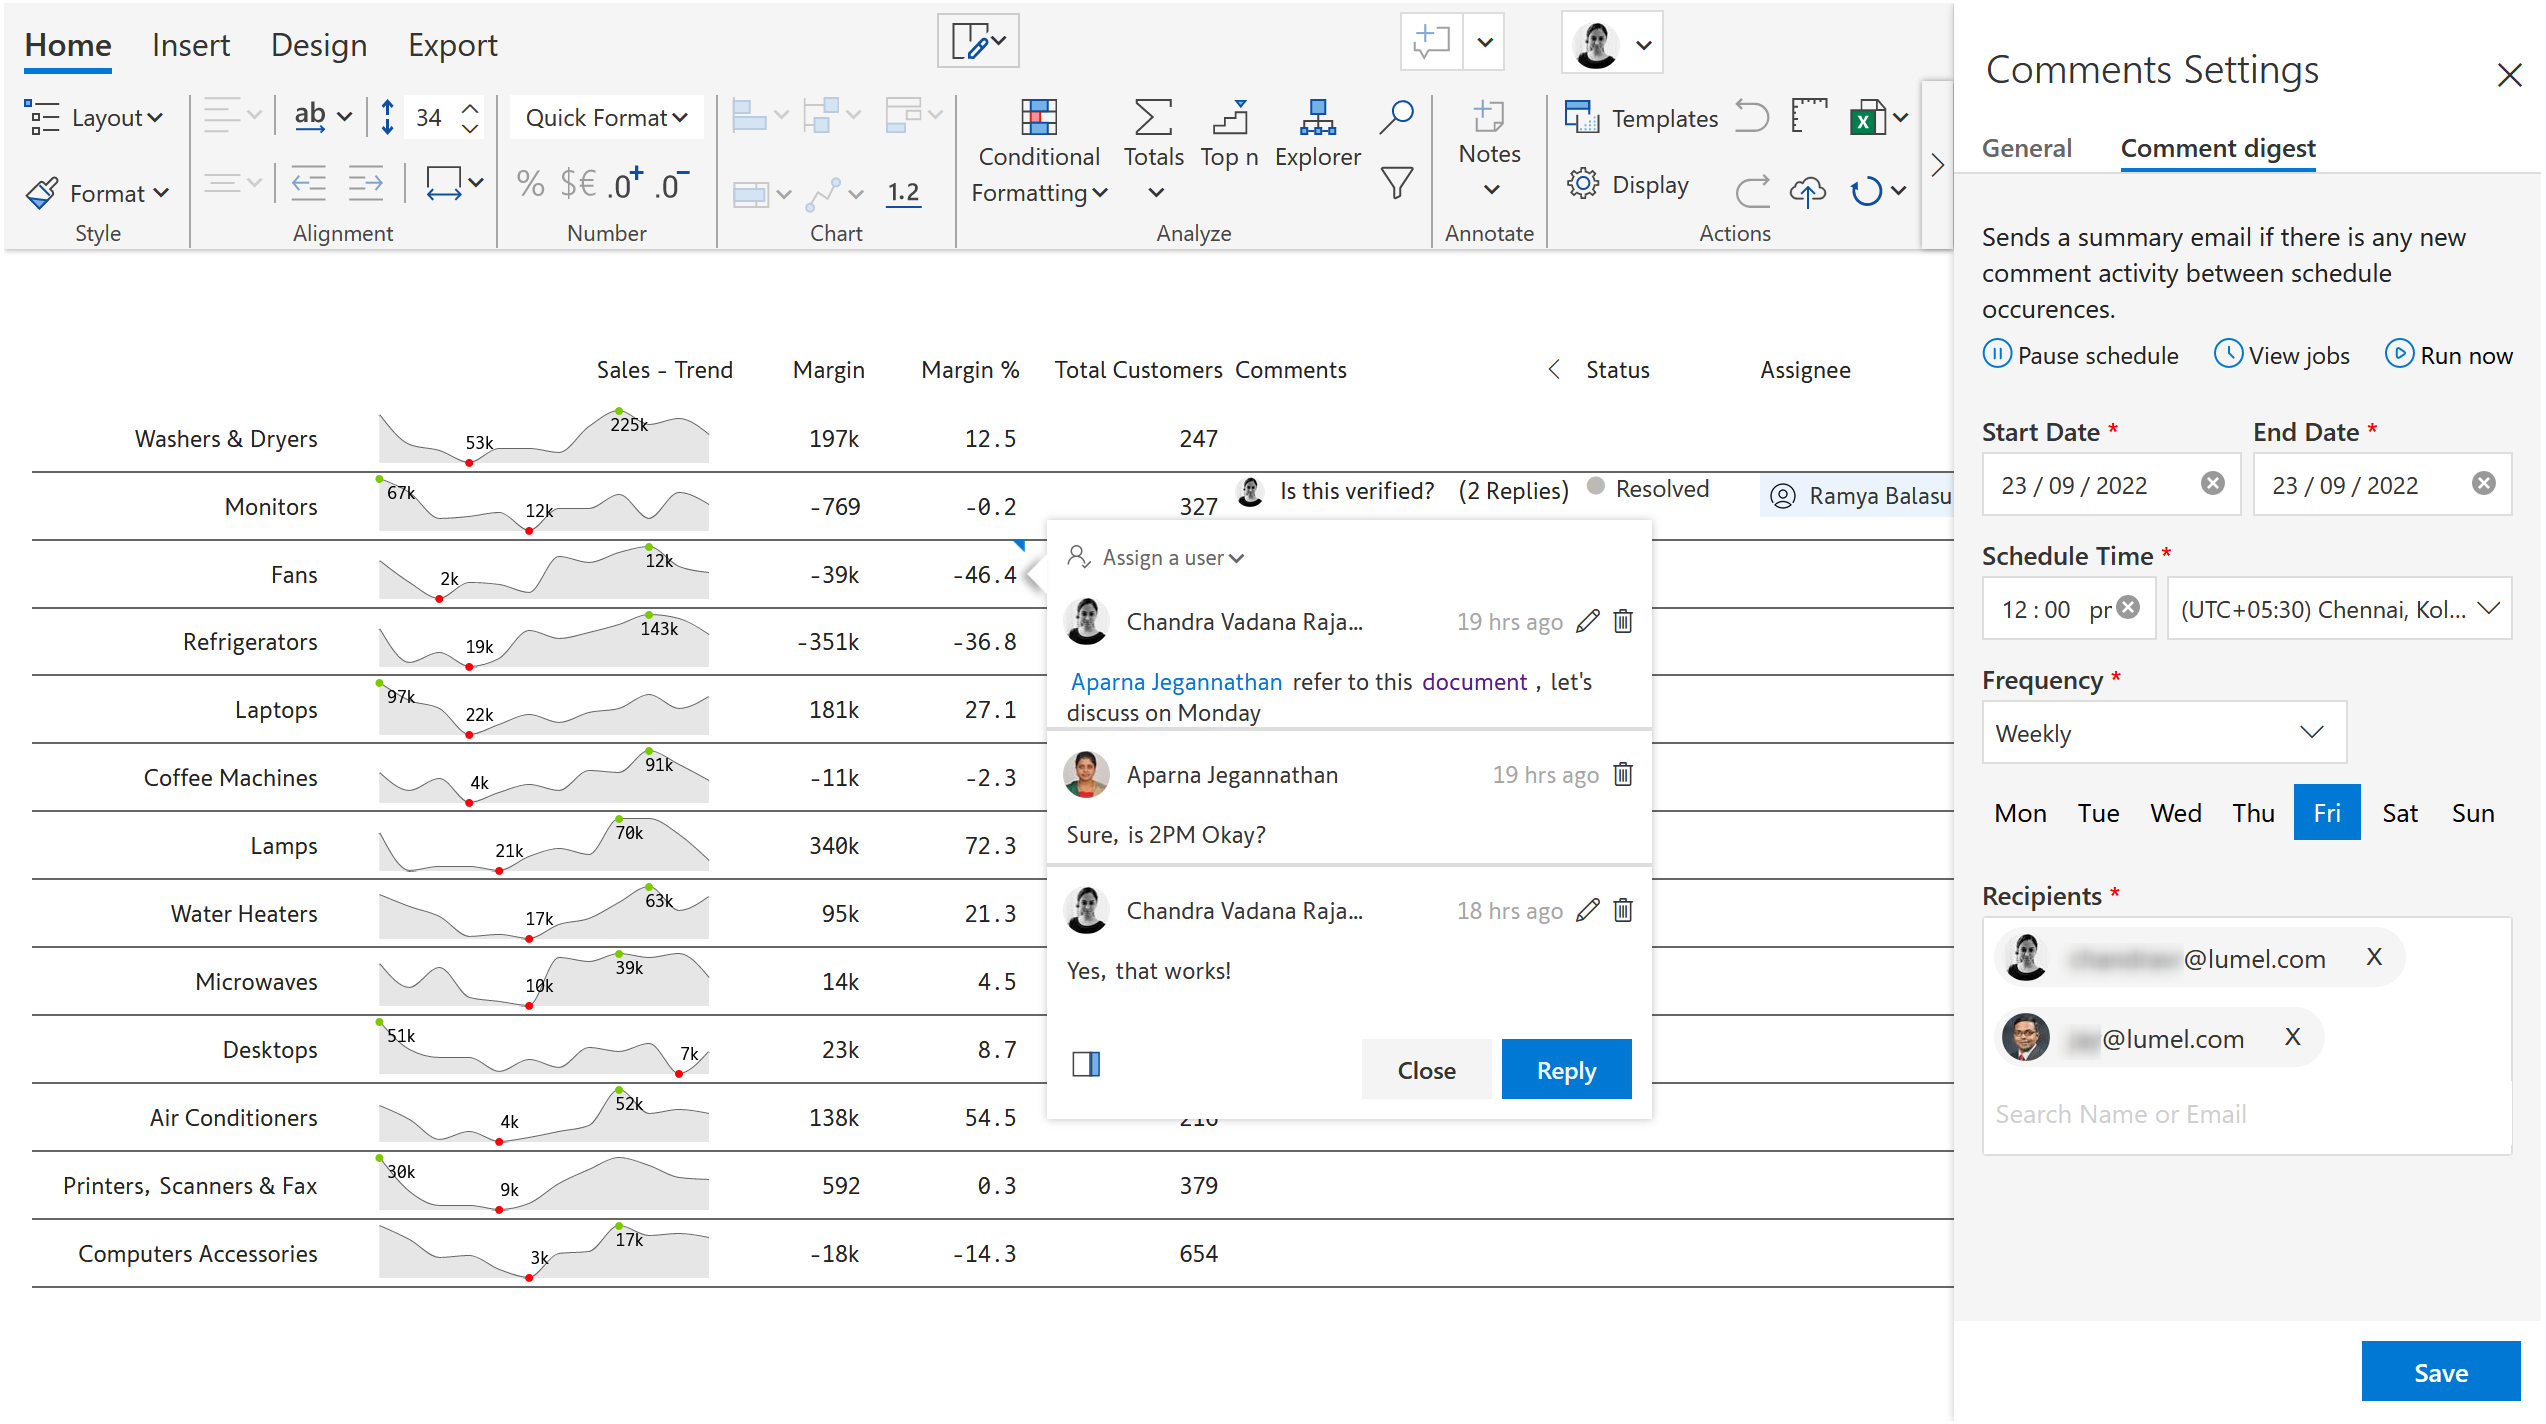
Drive cell-level collaboration with other stakeholders through interactive commenting. Supports @ mentions, task assignment & tracking, email notifications and periodic digests.
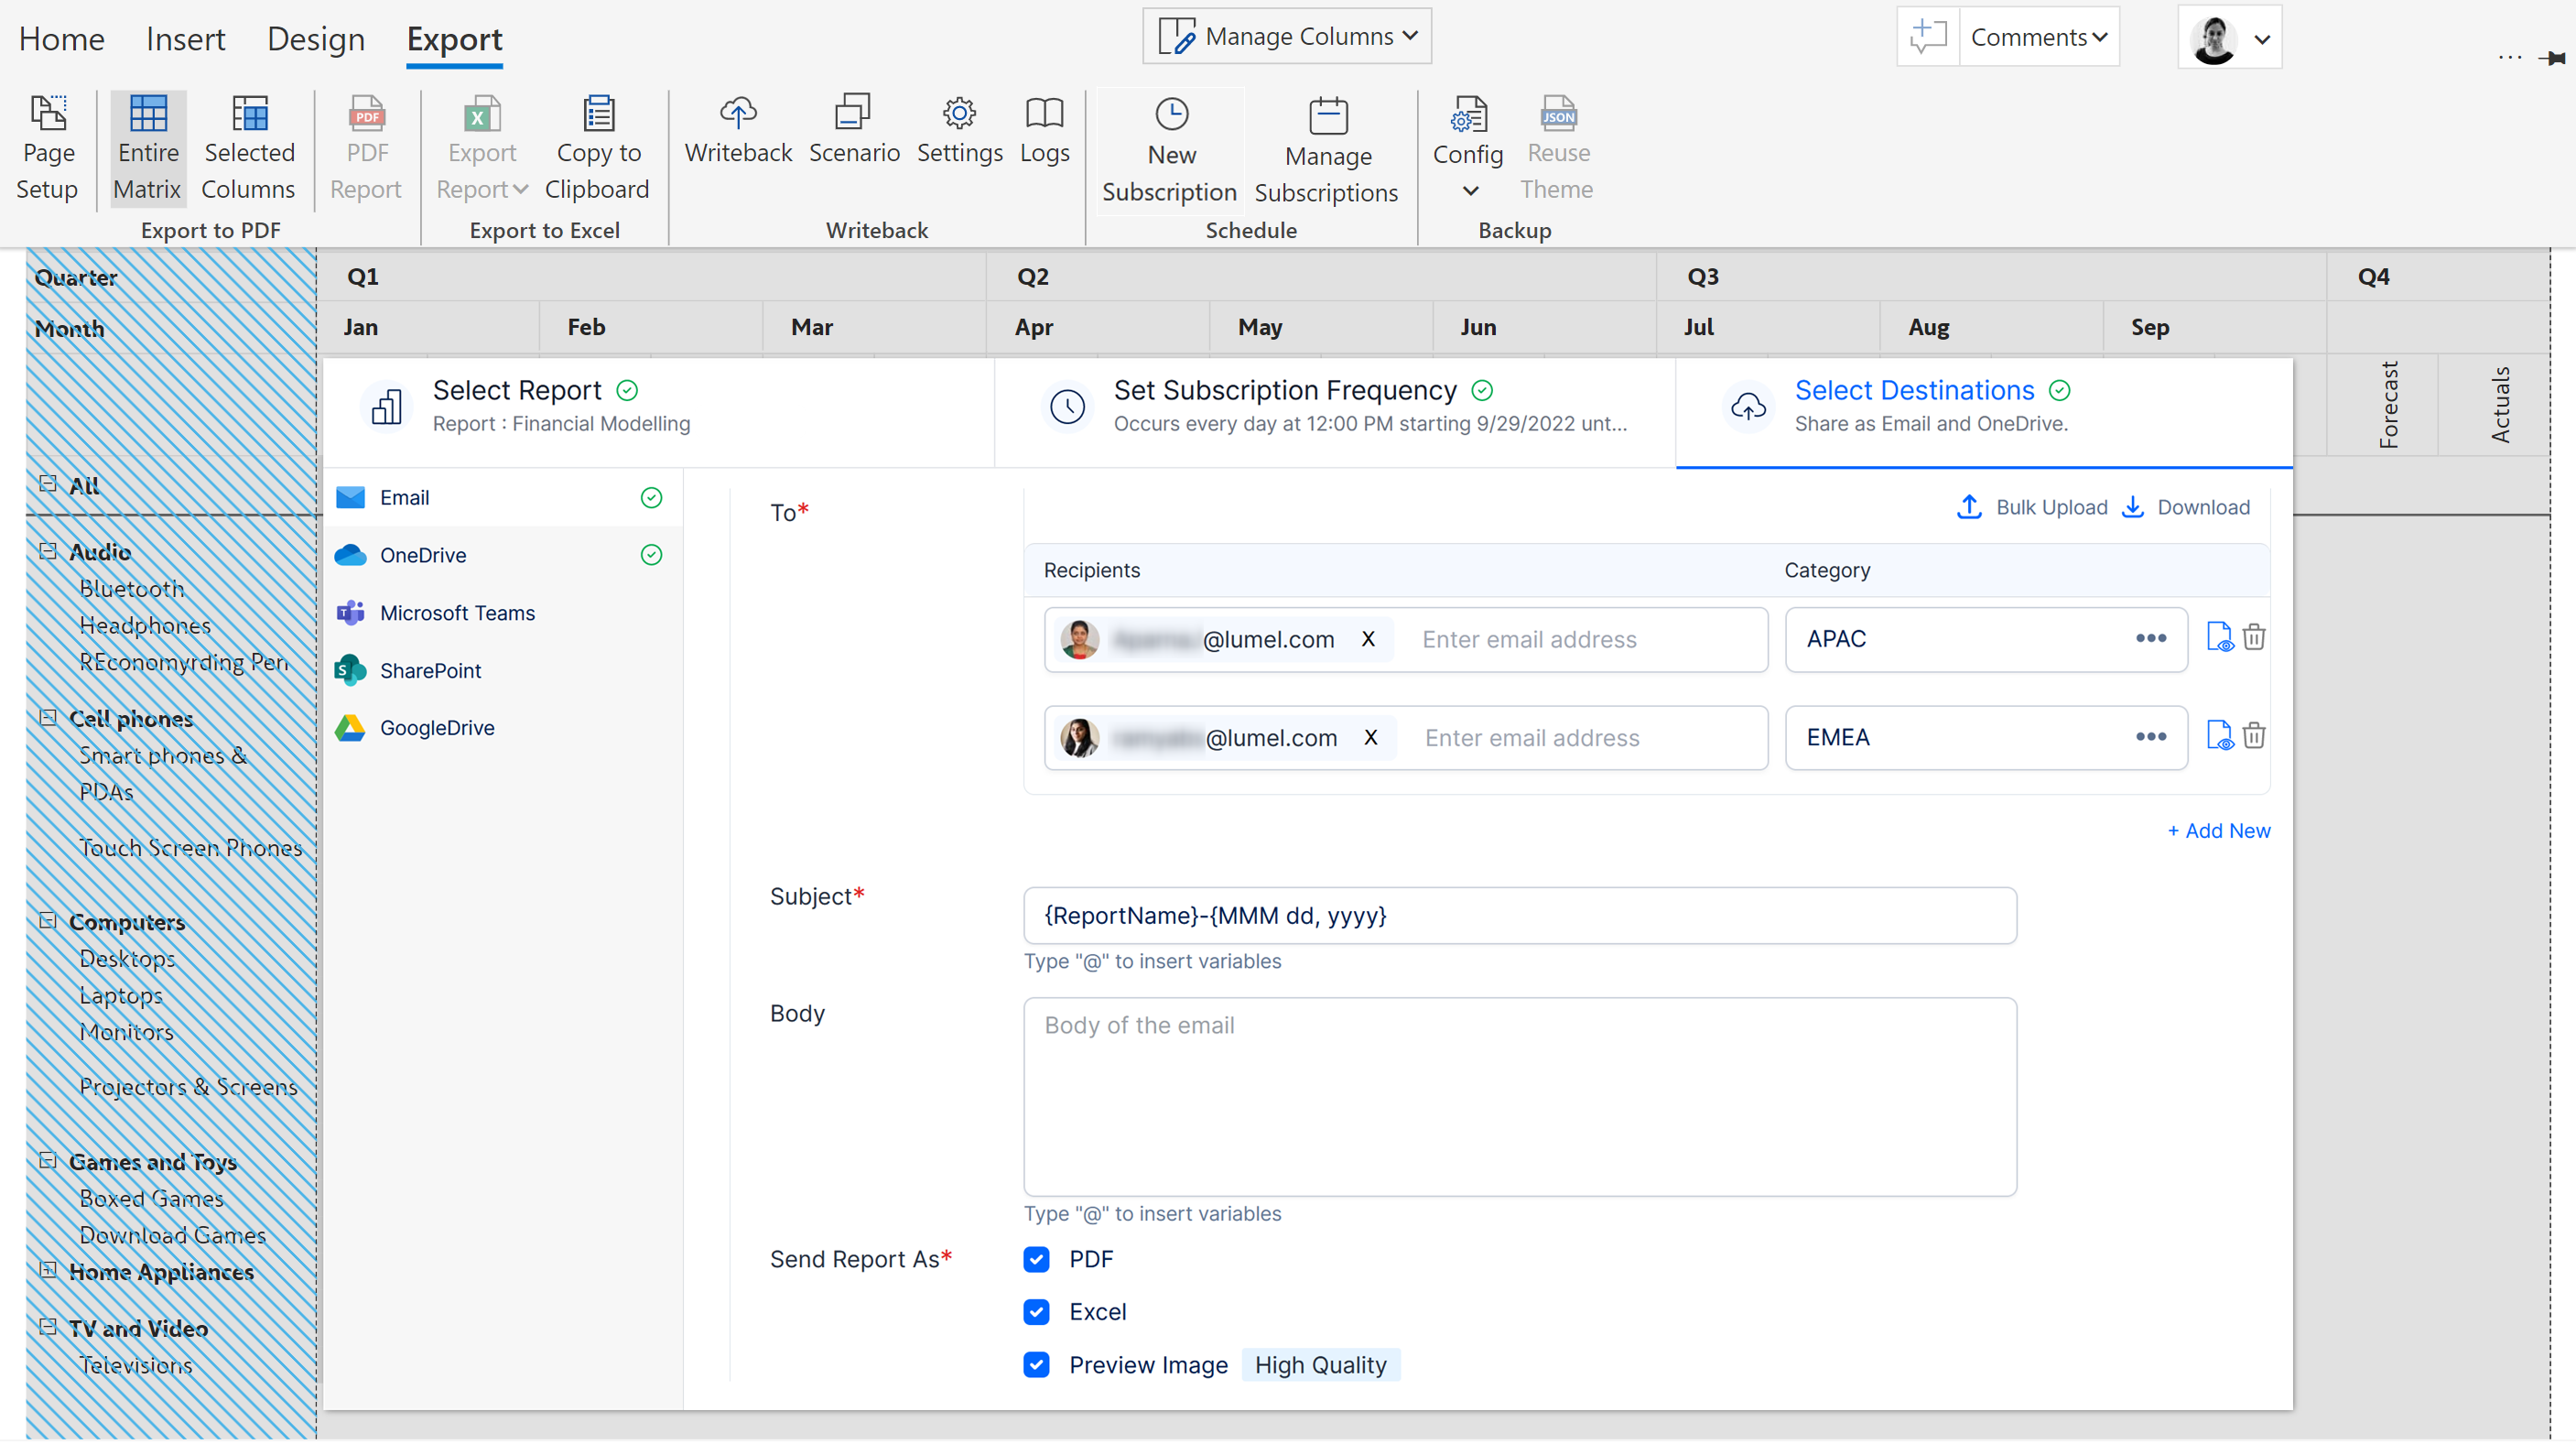
Schedule reports and deliver formatted PDF or Excel file extracts through email or shared folders to other stakeholders. While this has been traditionally an IT-centric use case, Inforiver allows business users to schedule reports with ease.
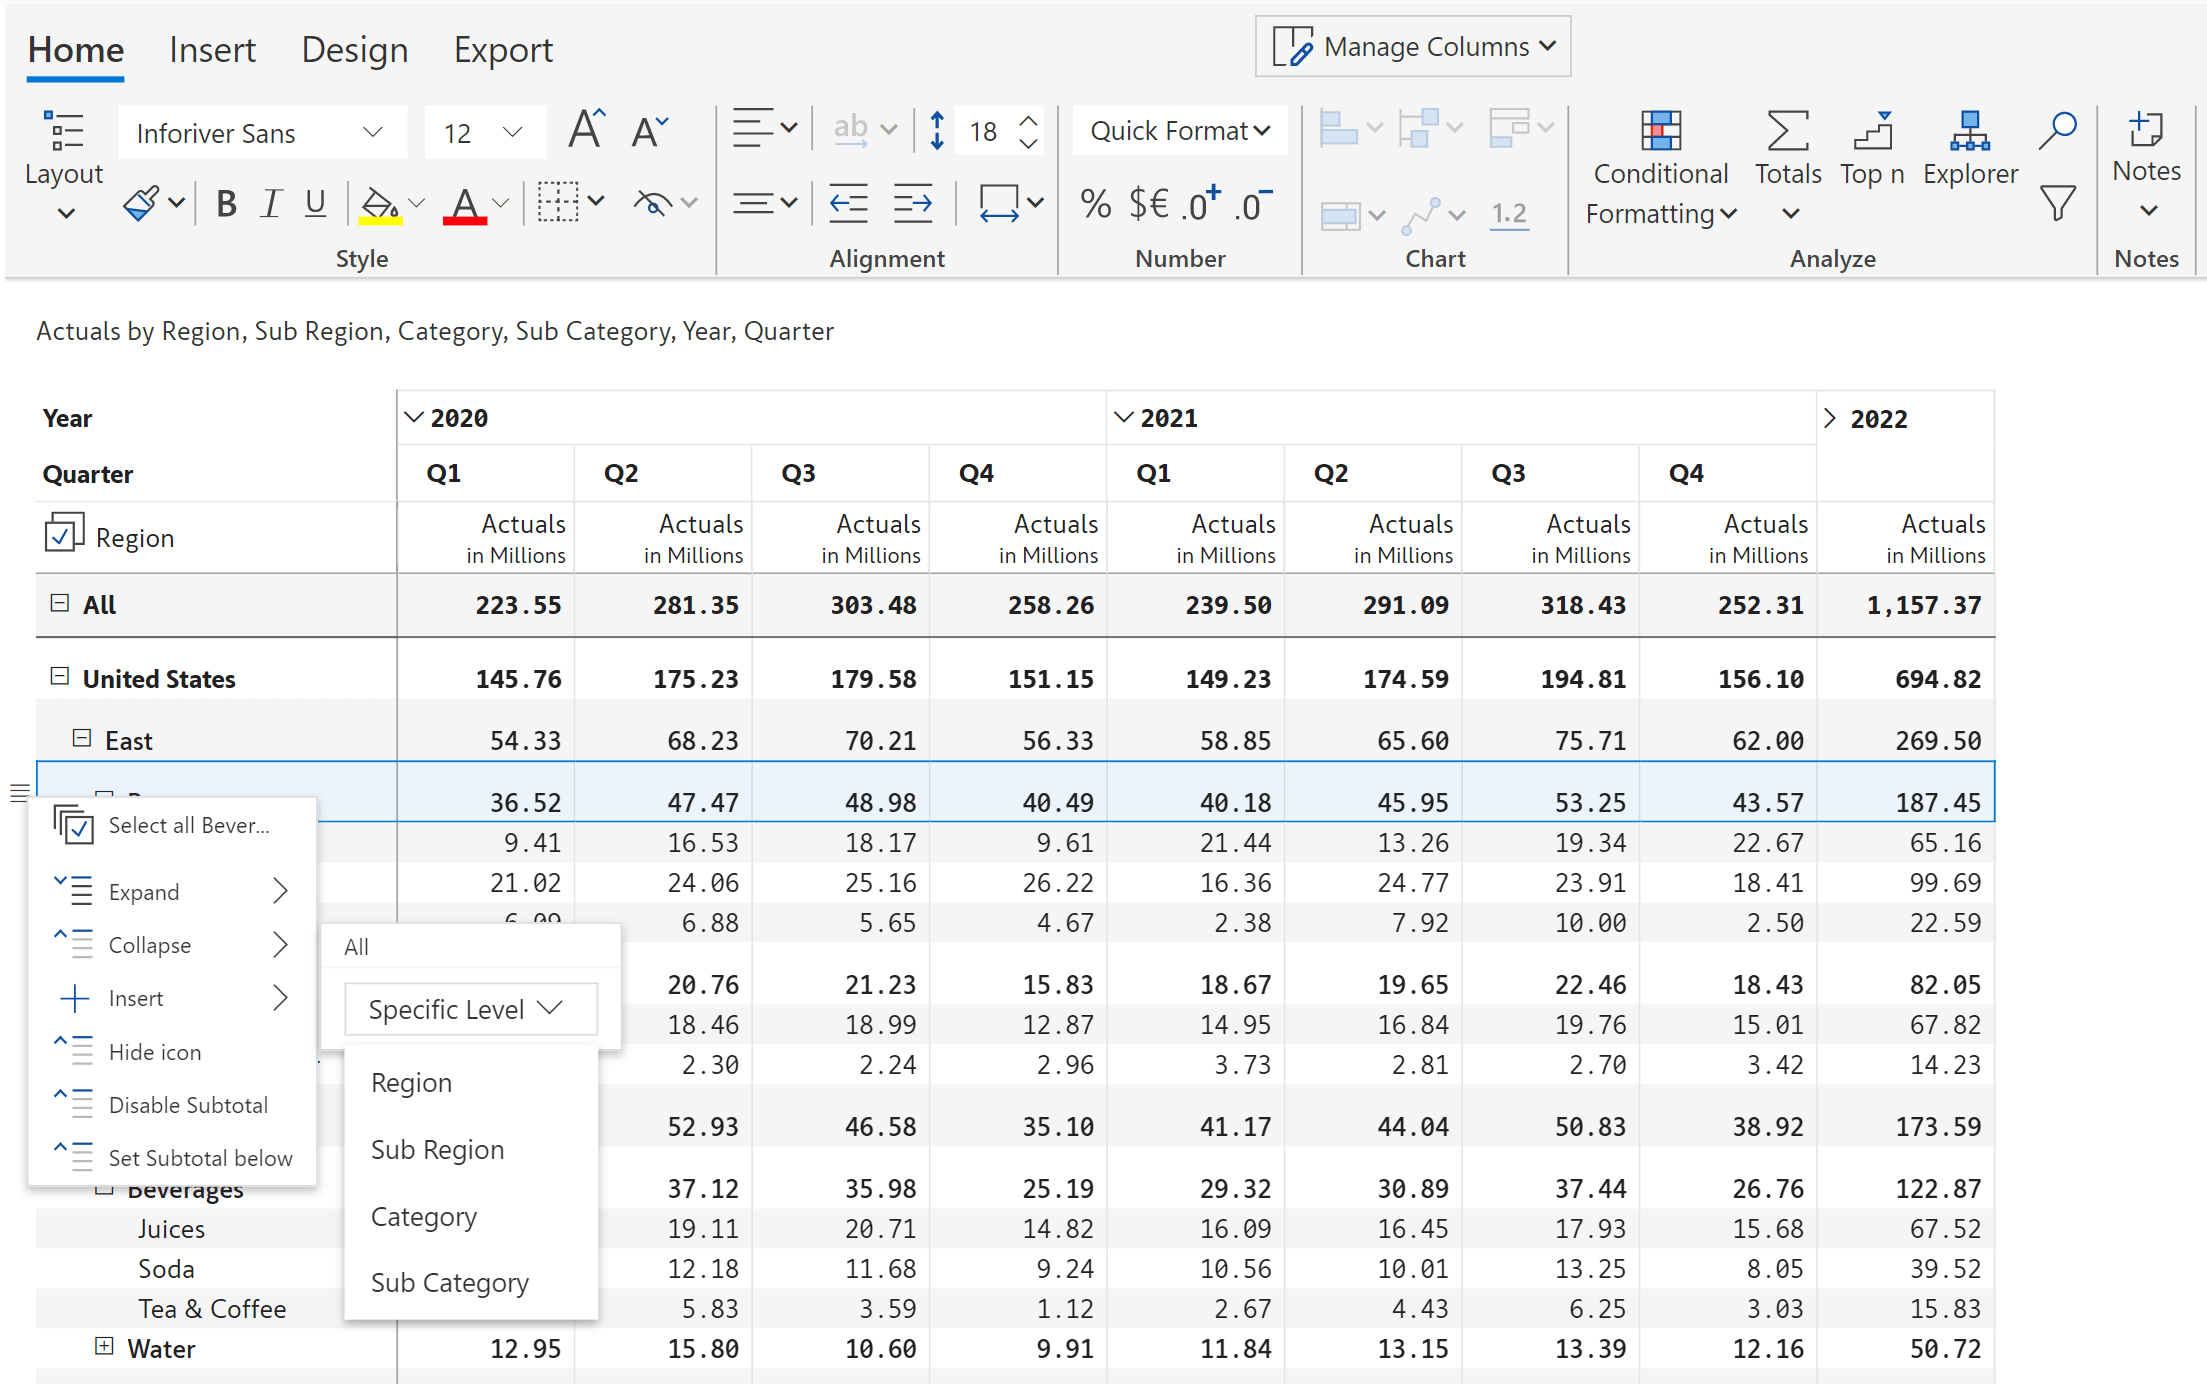
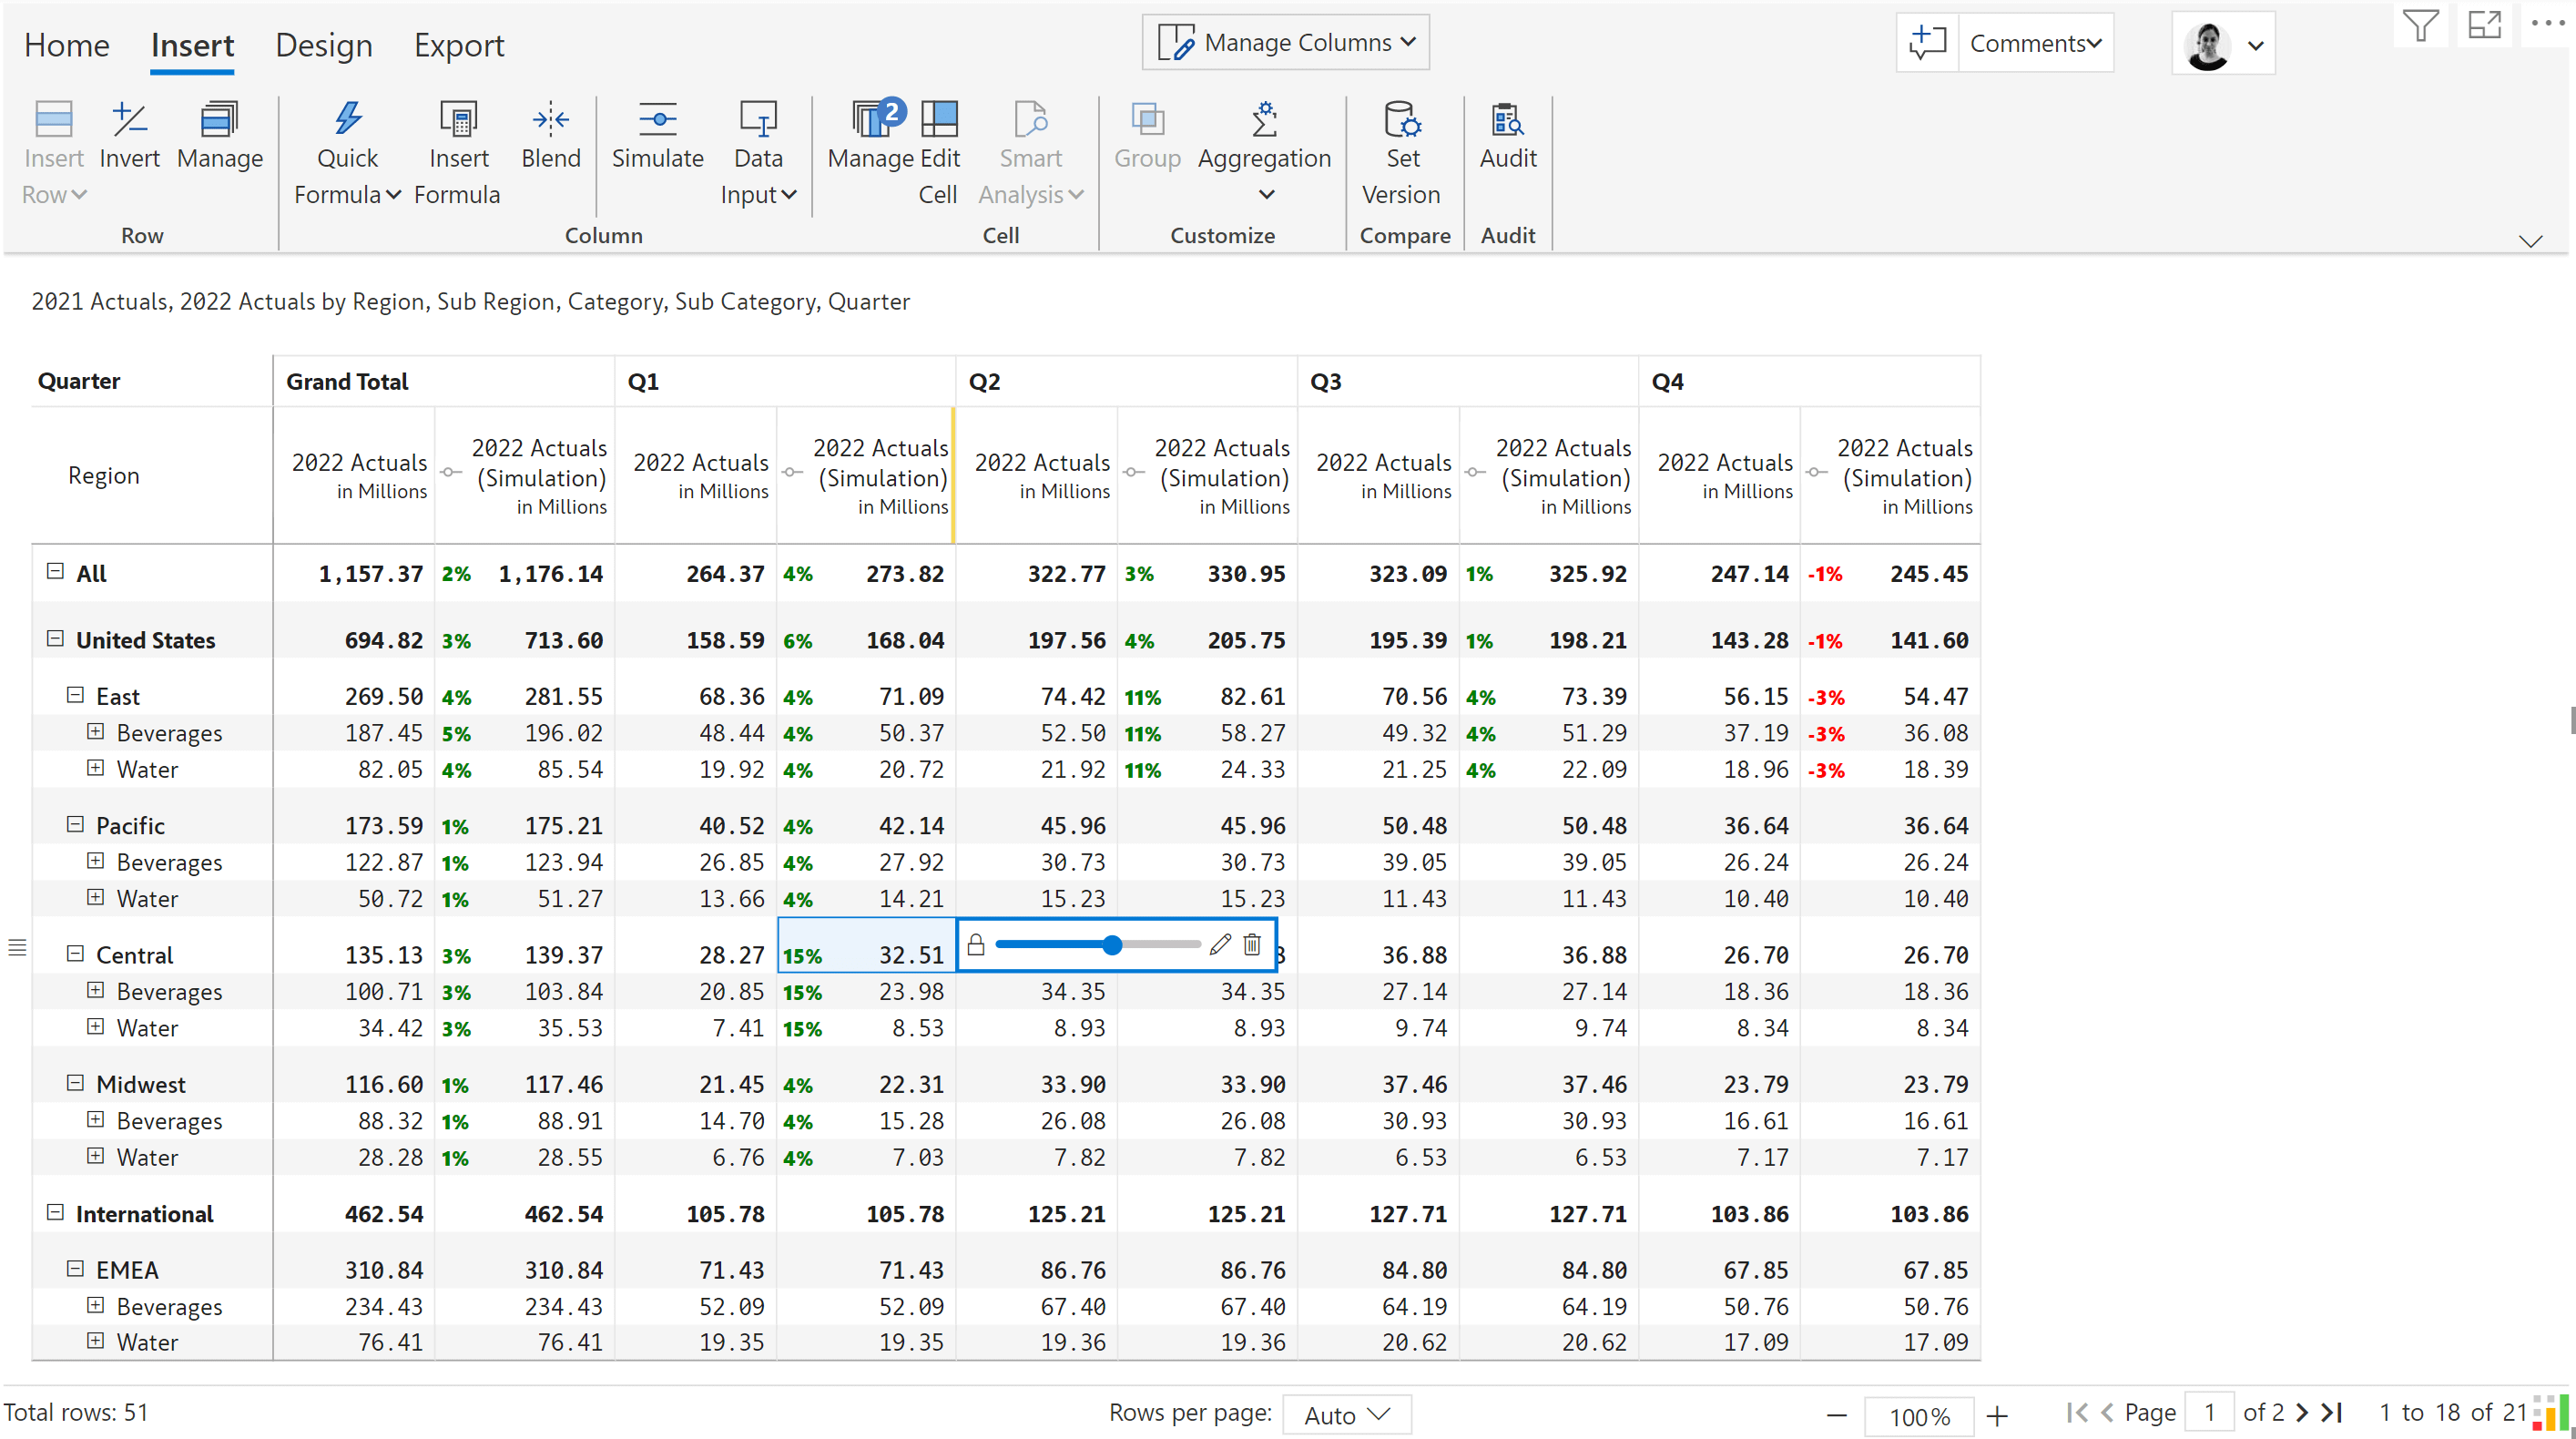
Enrich your analysis & decision-making by applying pivot-table like capabilities inside Power BI. Inforiver offers expand/collapse enabled hierarchies, flexible excel-like layouts such as classic, stepped, outline and option to show measures on rows or columns using the pivot mode.
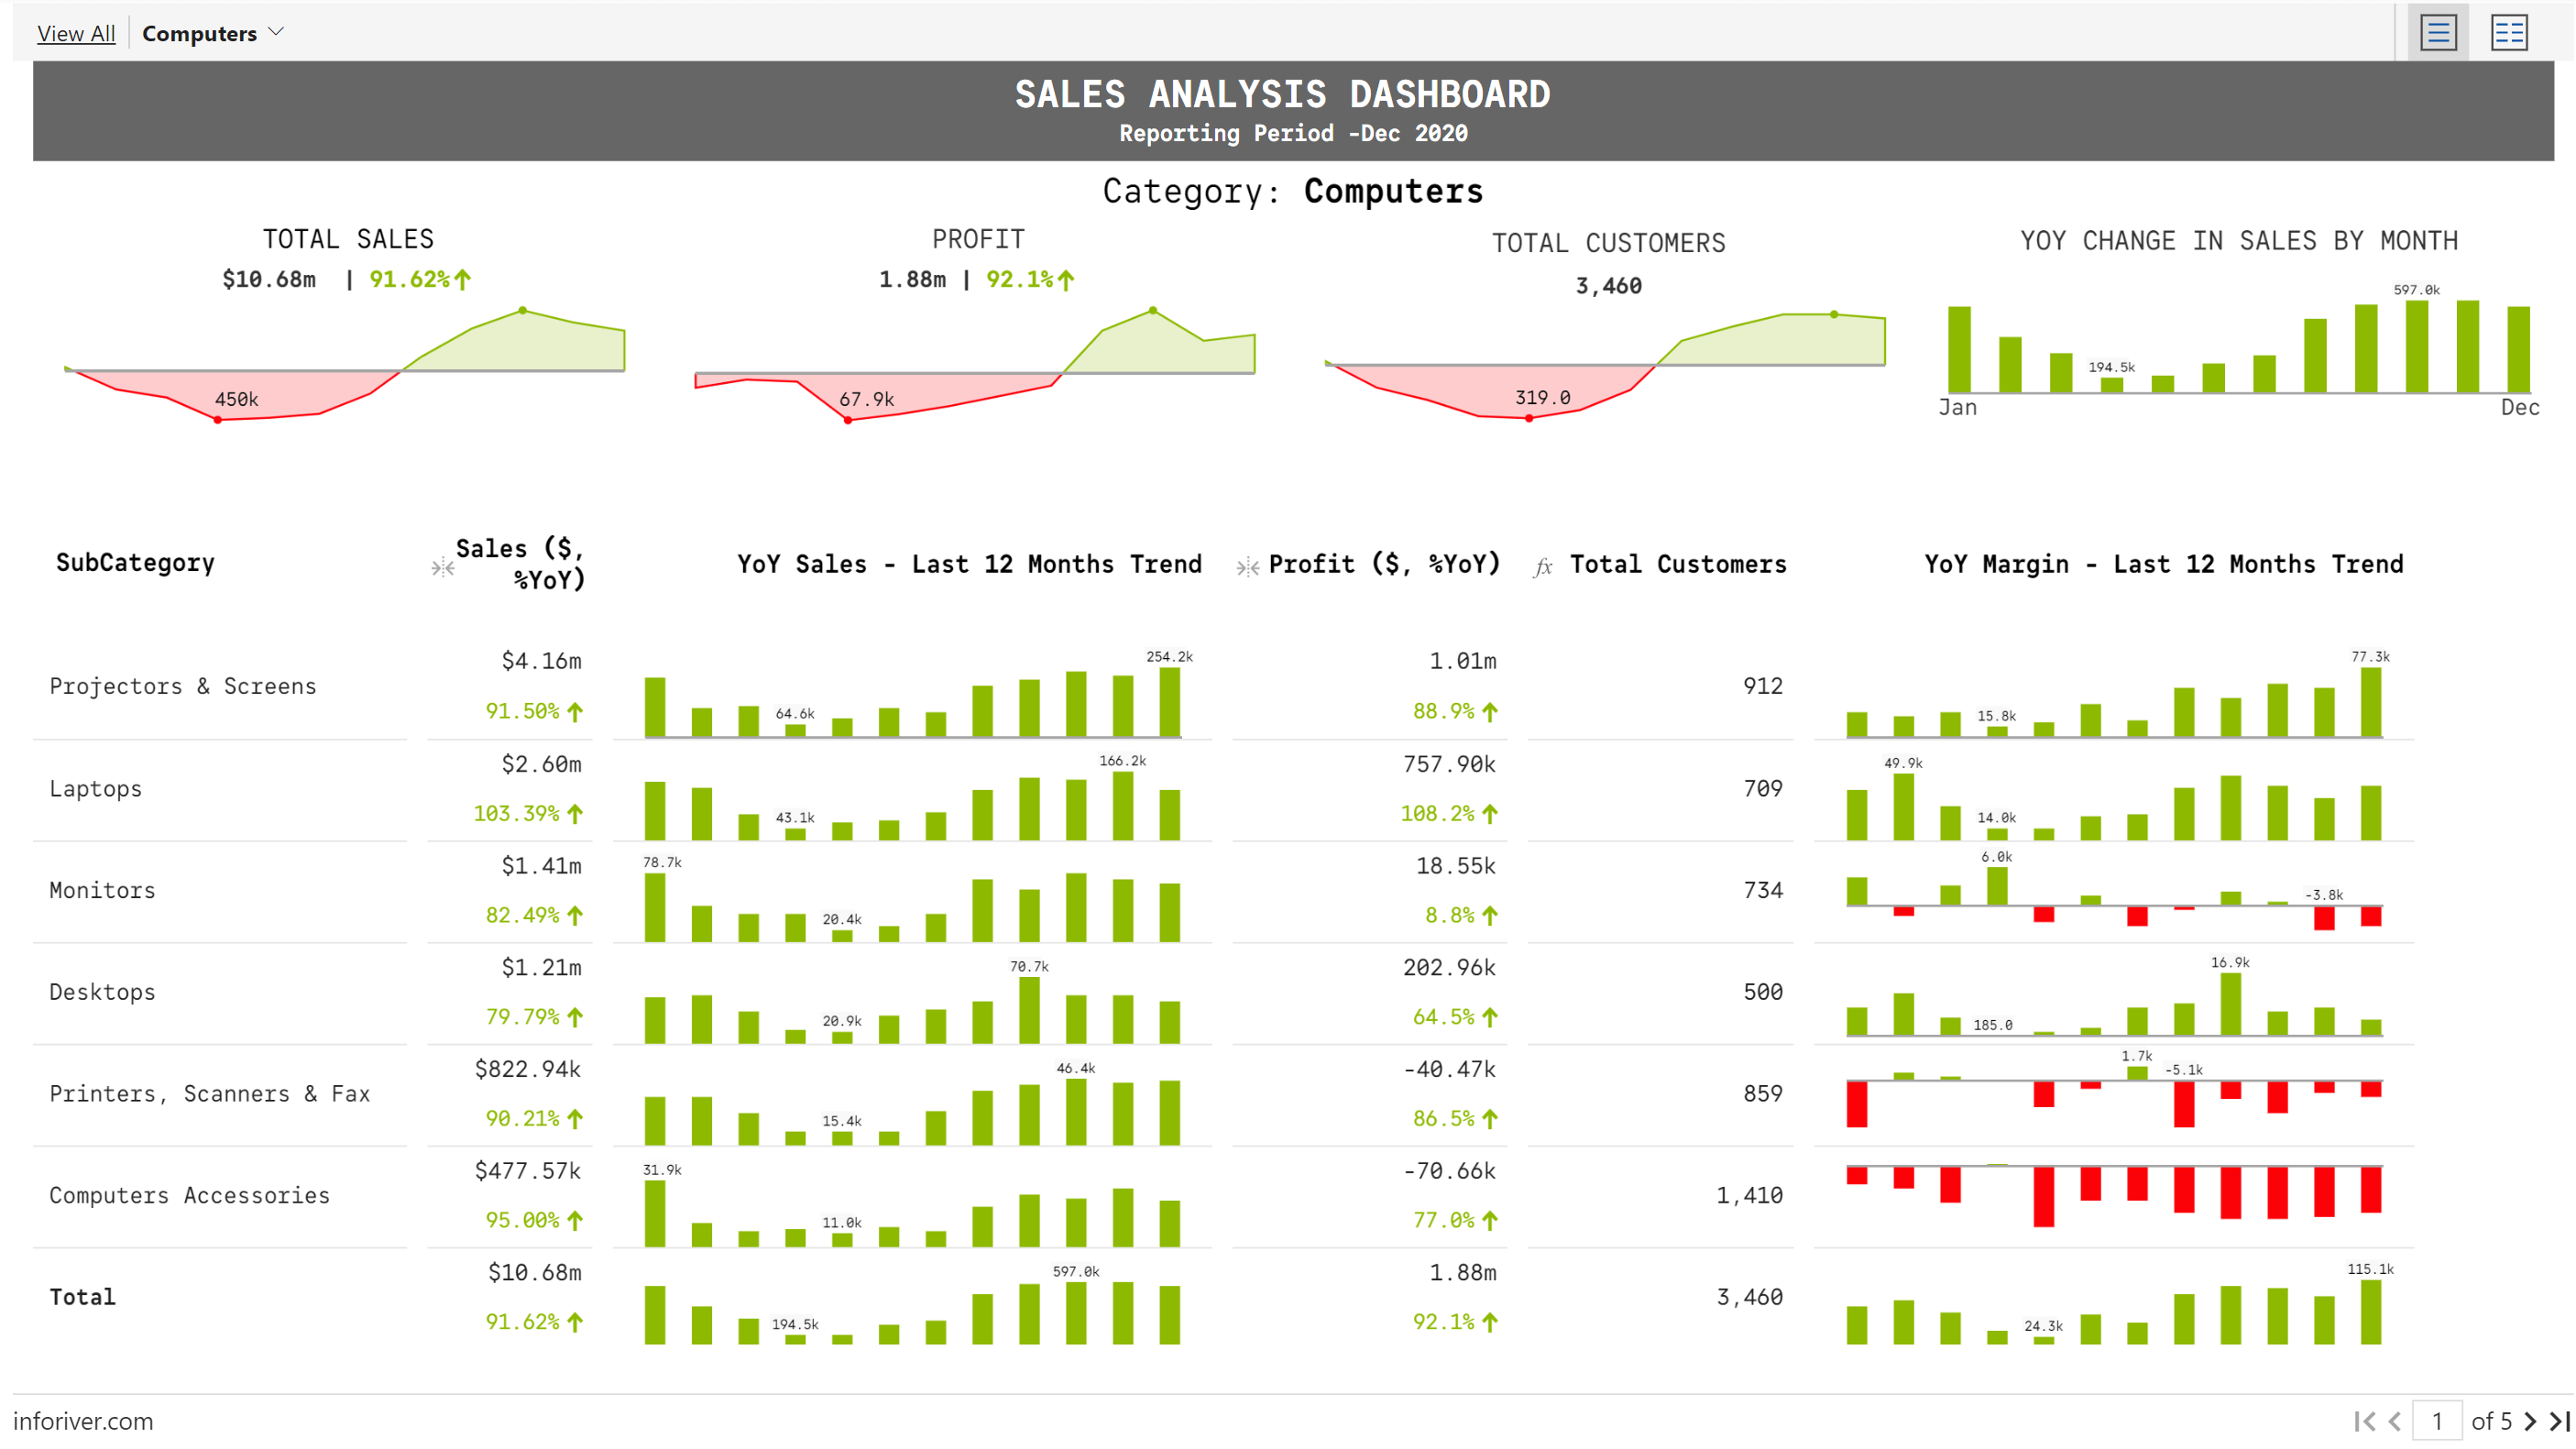
Tell compelling stories using 50+ charts, rich customizable themes, small multiples, data-level comments and more. Enrich your narratives using dynamic titles, data tags and measure-driven data labels. Explain the context and provide insights using dynamic data-level comments and annotations.
 In this webinar, learn how to leverage one-click IBCS report templates to deliver stunning and engaging visualizations in Power BI. Register today to learn more!