
Upcoming webinar on 'Inforiver Charts : The fastest way to deliver stories in Power BI', Aug 29th , Monday, 10.30 AM CST. Register Now
Upcoming webinar on 'Inforiver Charts : The fastest way to deliver stories in Power BI', Aug 29th , Monday, 10.30 AM CST. Register Now
Waterfall charts, also known as bridge charts, are a popular amongst finance professionals as they can effectively depict several finance use cases. Examples include (a) a simple equation (or a statement such as an income statement or cash flow statement), (b) changes to a value or a variable over time, or (c) contribution or distribution of a metric across other dimensions, and more.
In its simple form, the waterfall chart is highly useful for demonstrating how a starting value is affected by a series of intermediate positive or negative values that lead to a final value.
Finance professionals find waterfall charts valuable for its various applications such as the following:
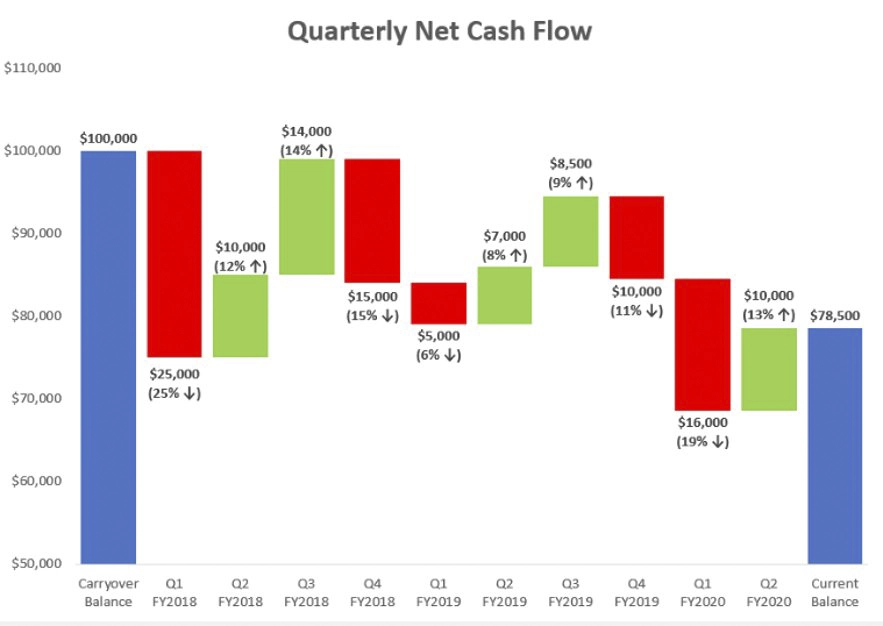
1. They easily represent a cash or income flow: Waterfall charts are excellent for displaying how money or income flows in and out of a business over time. This makes it simple for finance professionals to understand a company's financial performance and identify any cash flow issues that may need to be addressed.
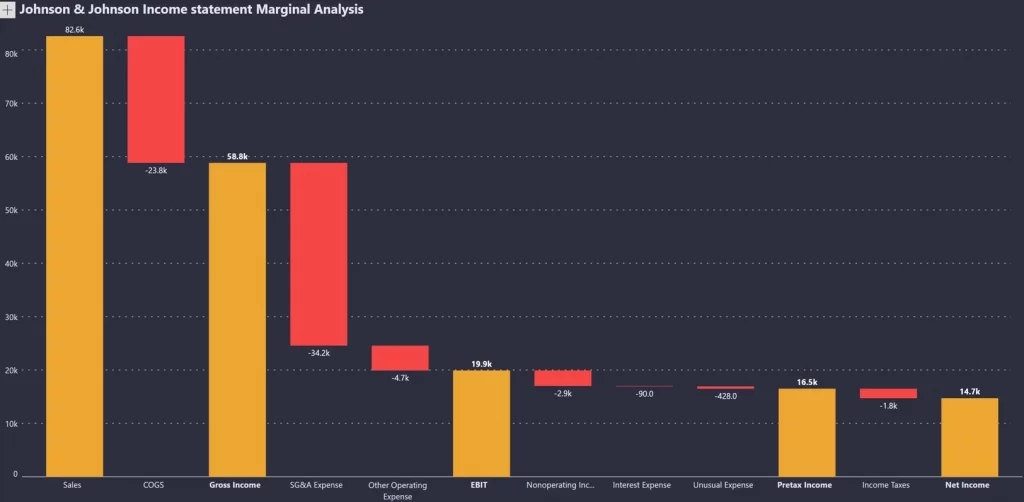
2. They can visually represent profit & loss statements: They are useful for quickly showcasing items than can impact a company's bottom line. It is perhaps the only chart (not counting the table/matrix/scorecard visual) that can encapsulate a statement.
3. They provide a clear breakdown of contributions: Waterfall charts are excellent for demonstrating how different components contribute to a final total, such as revenue breakdown by product or region. This assists finance professionals in identifying areas of strength and weakness and making better business decisions.
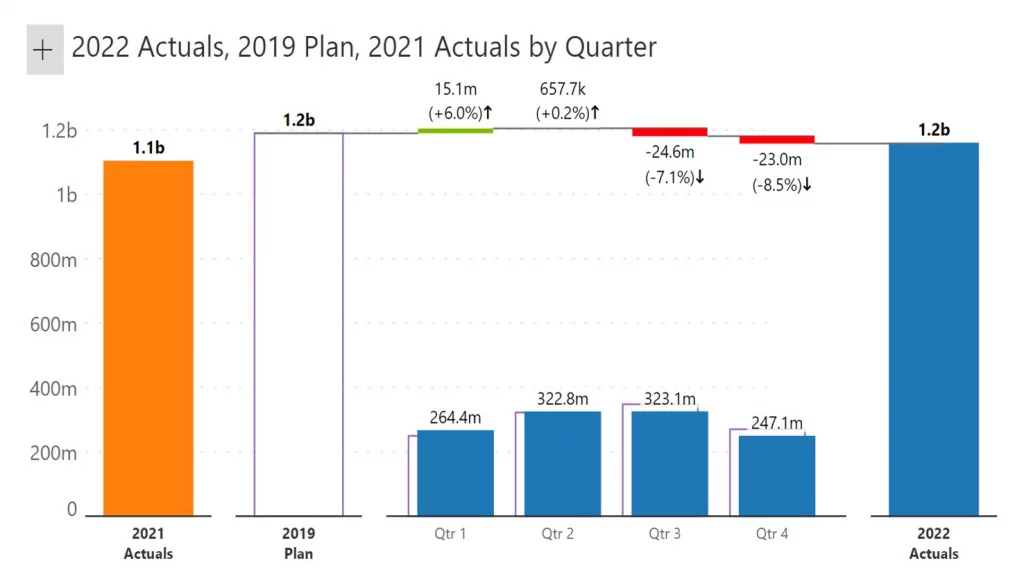
4. They help with variance analysis: They can be used to show the difference between actual and budgeted or forecasted numbers, allowing finance professionals to easily identify areas of over or underperformance and understand the reasons for any variances. For example, we can see below that first half of the year, the company’s Sales surpassed what they had planned but the second half saw a dip in Sales.
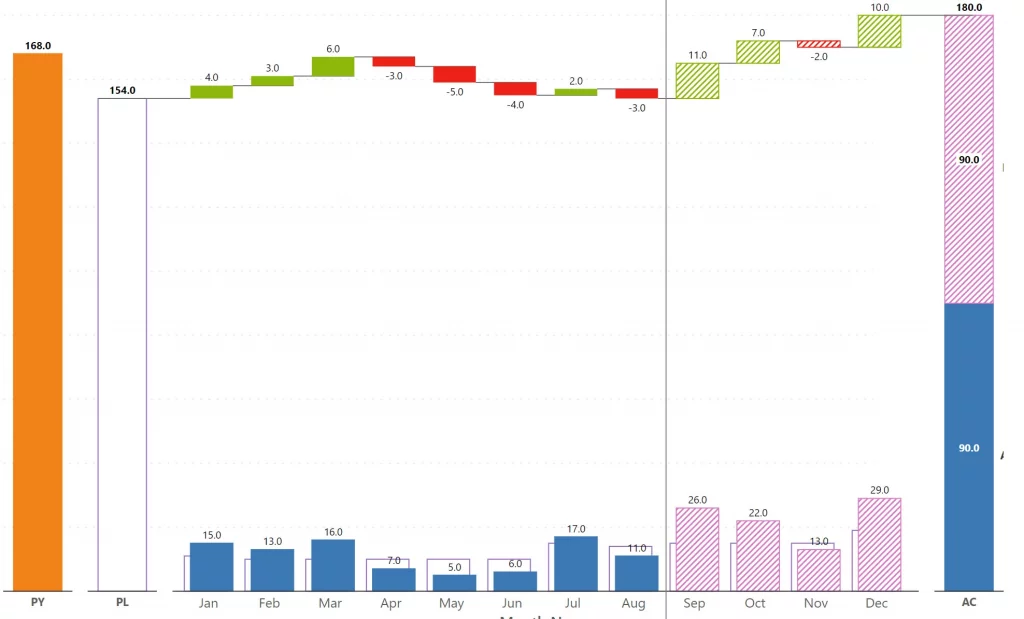
5. Waterfall Forecasts: Waterfall charts can be used to forecast performance for a period for which only a portion of the time has elapsed. In this example below, actuals (Jan to Aug) are highlighted in blue while the forecasts (Sep to Dec) are in pink on the same axis. The final output is the expected performance for the entire period.
There are many more applications of waterfall charts in finance. Overall, they are an effective tool for finance professionals as they enable visual representation of financial performance in a way that is easier for everyone to understand.
To know more about waterfall charts and how to create them right inside Power BI, Dive into our new free ebook "The ultimate guide to waterfall charts in Power BI."
Get a copy of Inforiver today to explore waterfall charts for Finance.

Inforiver helps enterprises consolidate planning, reporting & analytics on a single platform (Power BI). The no-code, self-service award-winning platform has been recognized as the industry’s best and is adopted by many Fortune 100 firms.
Inforiver is a product of Lumel, the #1 Power BI AppSource Partner. The firm serves over 3,000 customers worldwide through its portfolio of products offered under the brands Inforiver, EDITable, ValQ, and xViz.