
Upcoming webinar on 'Inforiver Charts : The fastest way to deliver stories in Power BI', Aug 29th , Monday, 10.30 AM CST. Register Now
Upcoming webinar on 'Inforiver Charts : The fastest way to deliver stories in Power BI', Aug 29th , Monday, 10.30 AM CST. Register Now
With the rising popularity of data storytelling, the term is often mistakenly taken to be synonymous with data visualization. While most people are familiar with visualizing data in some form, confusion abounds as to what data storytelling actually is. In this article, we will explore the differences between the two terms, delving into the distinctions in purpose, structure and impact on both sides.
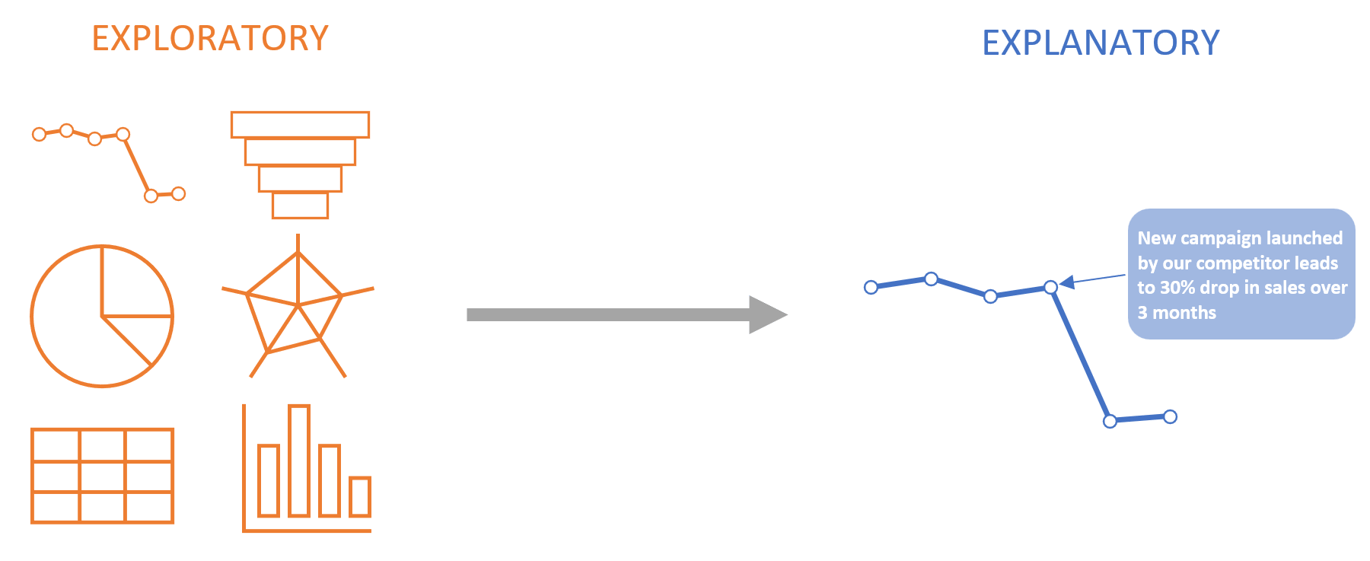
We begin by examining the difference between exploratory and explanatory analysis. Exploratory analysis can be likened to searching for gemstones in a mine, i.e., looking for insights hidden within the data, while explanatory analysis can be likened to displaying one or two gemstones in the best possible way – in other words, showcasing important insights with sufficient context. Put simply, exploratory analysis seeks to find insights, whereas explanatory analysis seeks to make a specific insight clear and understandable. This means that during exploratory analysis, we may sift through a lot of data that is not relevant and eventually find important insights, at which point we move to the explanatory phase, where we make these insights clear to our target audience.
Storytelling is one way of making these insights clear, but not all observations require storytelling, as we shall discuss in the last section on when to use storytelling.
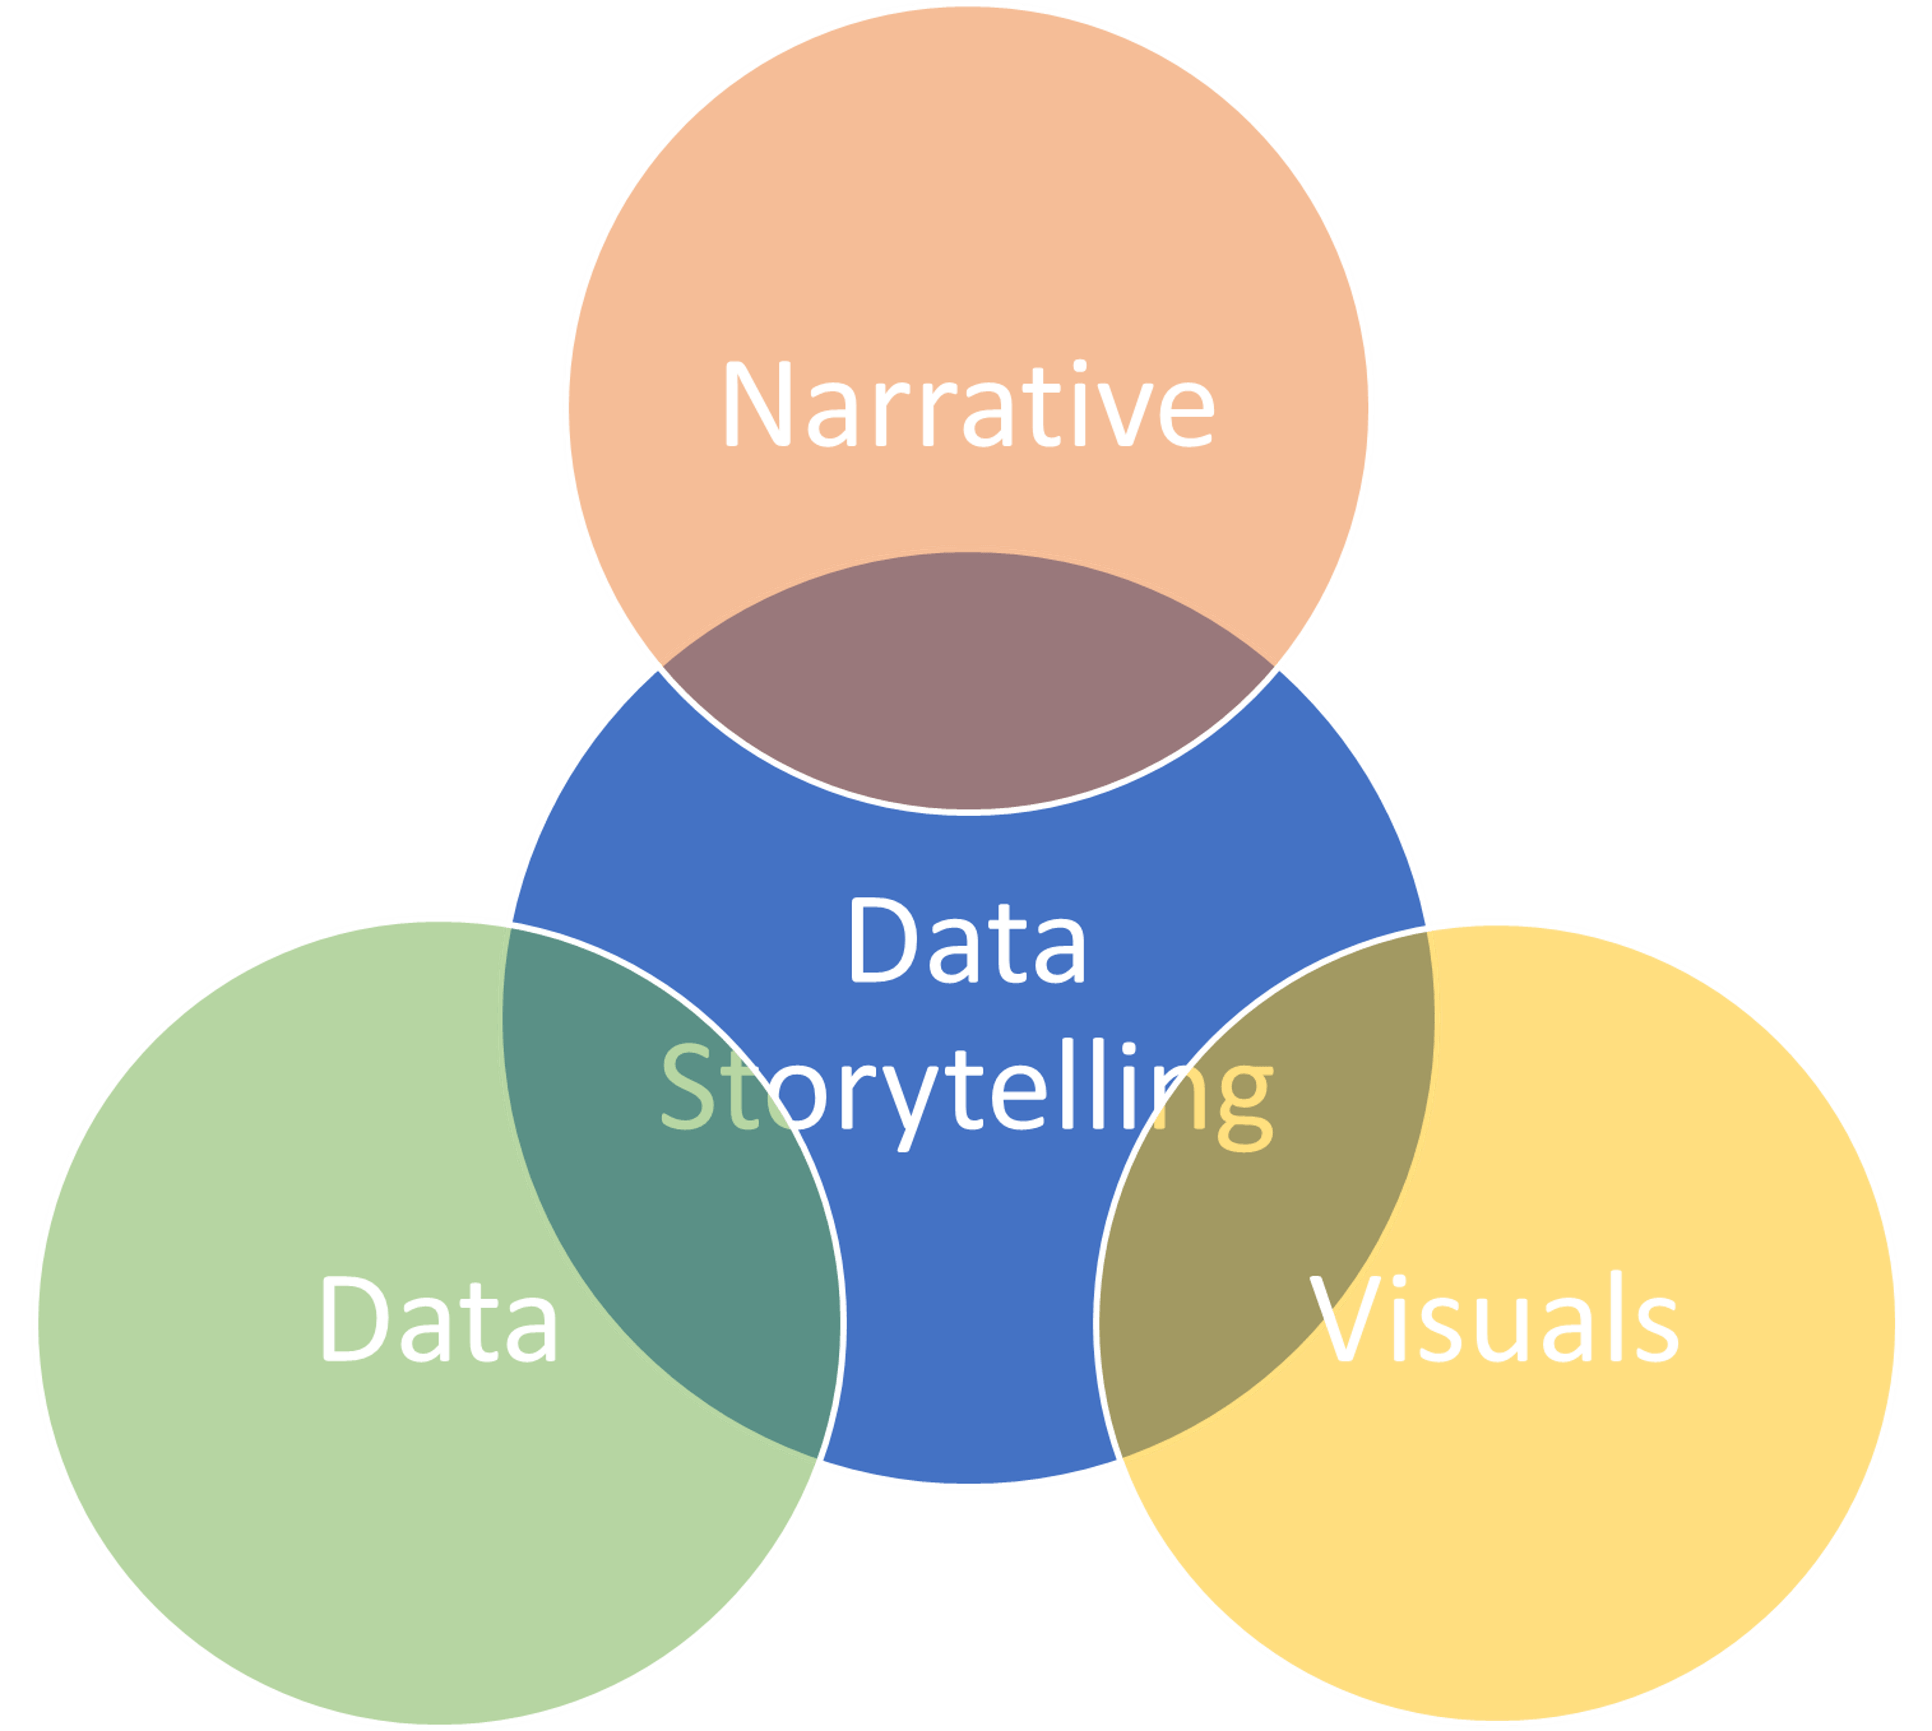
The goal of data storytelling is always explanatory, rather than exploratory, whereas data visualization can be used for both explanatory as well as exploratory analysis. This means that with storytelling, we already have a central insight which we which to elucidate. While we may do this using visual aids like graphs and pictures, data visualization only forms a part of storytelling. As Brent Dykes explains in his book Effective Data Storytelling, data storytelling sits at the center of data, visuals and narrative.
The goal of data storytelling is always explanatory, rather than exploratory, whereas data visualization can be used for both explanatory as well as exploratory analysis. This means that with storytelling, we already have a central insight which we which to elucidate. While we may do this using visual aids like graphs and pictures, data visualization only forms a part of storytelling. As Brent Dykes explains in his book Effective Data Storytelling, data storytelling sits at the center of data, visuals and narrative.
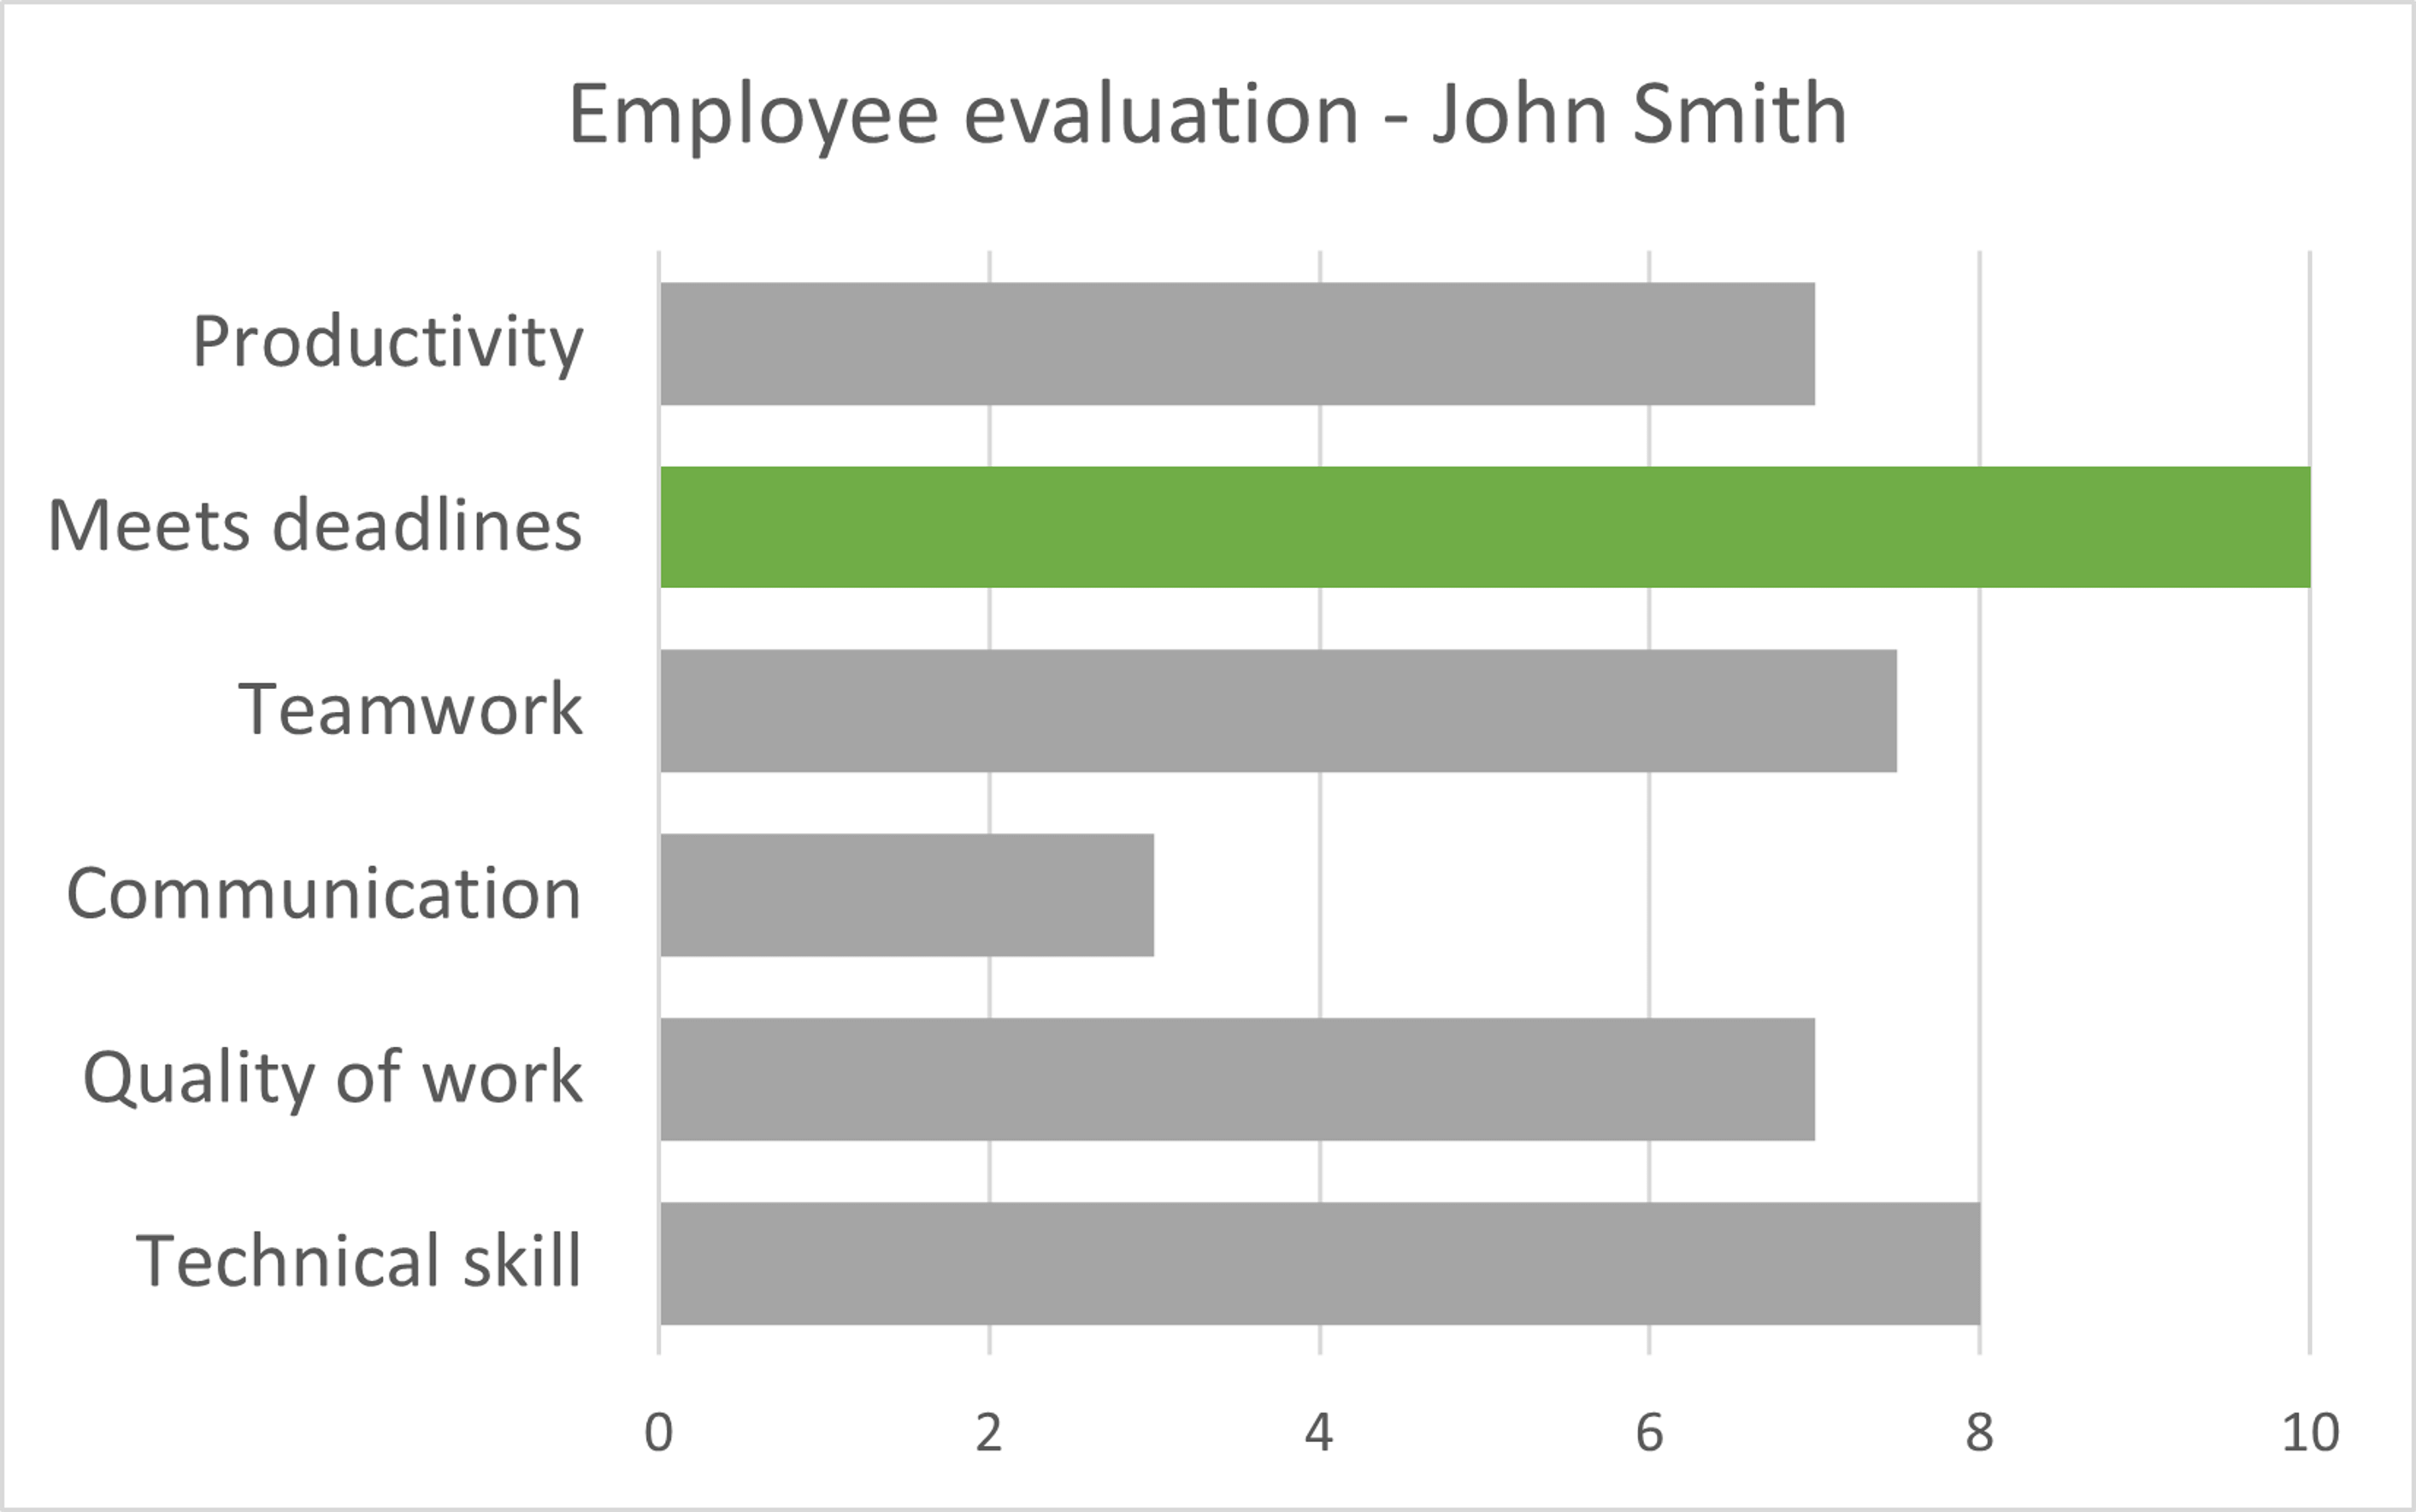
It may be the case that John is the only member of his team who has consistently met deadlines, putting his performance ahead of his team’s. If this is the point that we wish to focus on, we may consider a chart like the one below, that highlights this metric.
Conversely, John’s lack of communication skills has perhaps had a significant adverse effect on the performance of his team. In this case, we may want to employ a chart like the one below to draw attention to the right metric.
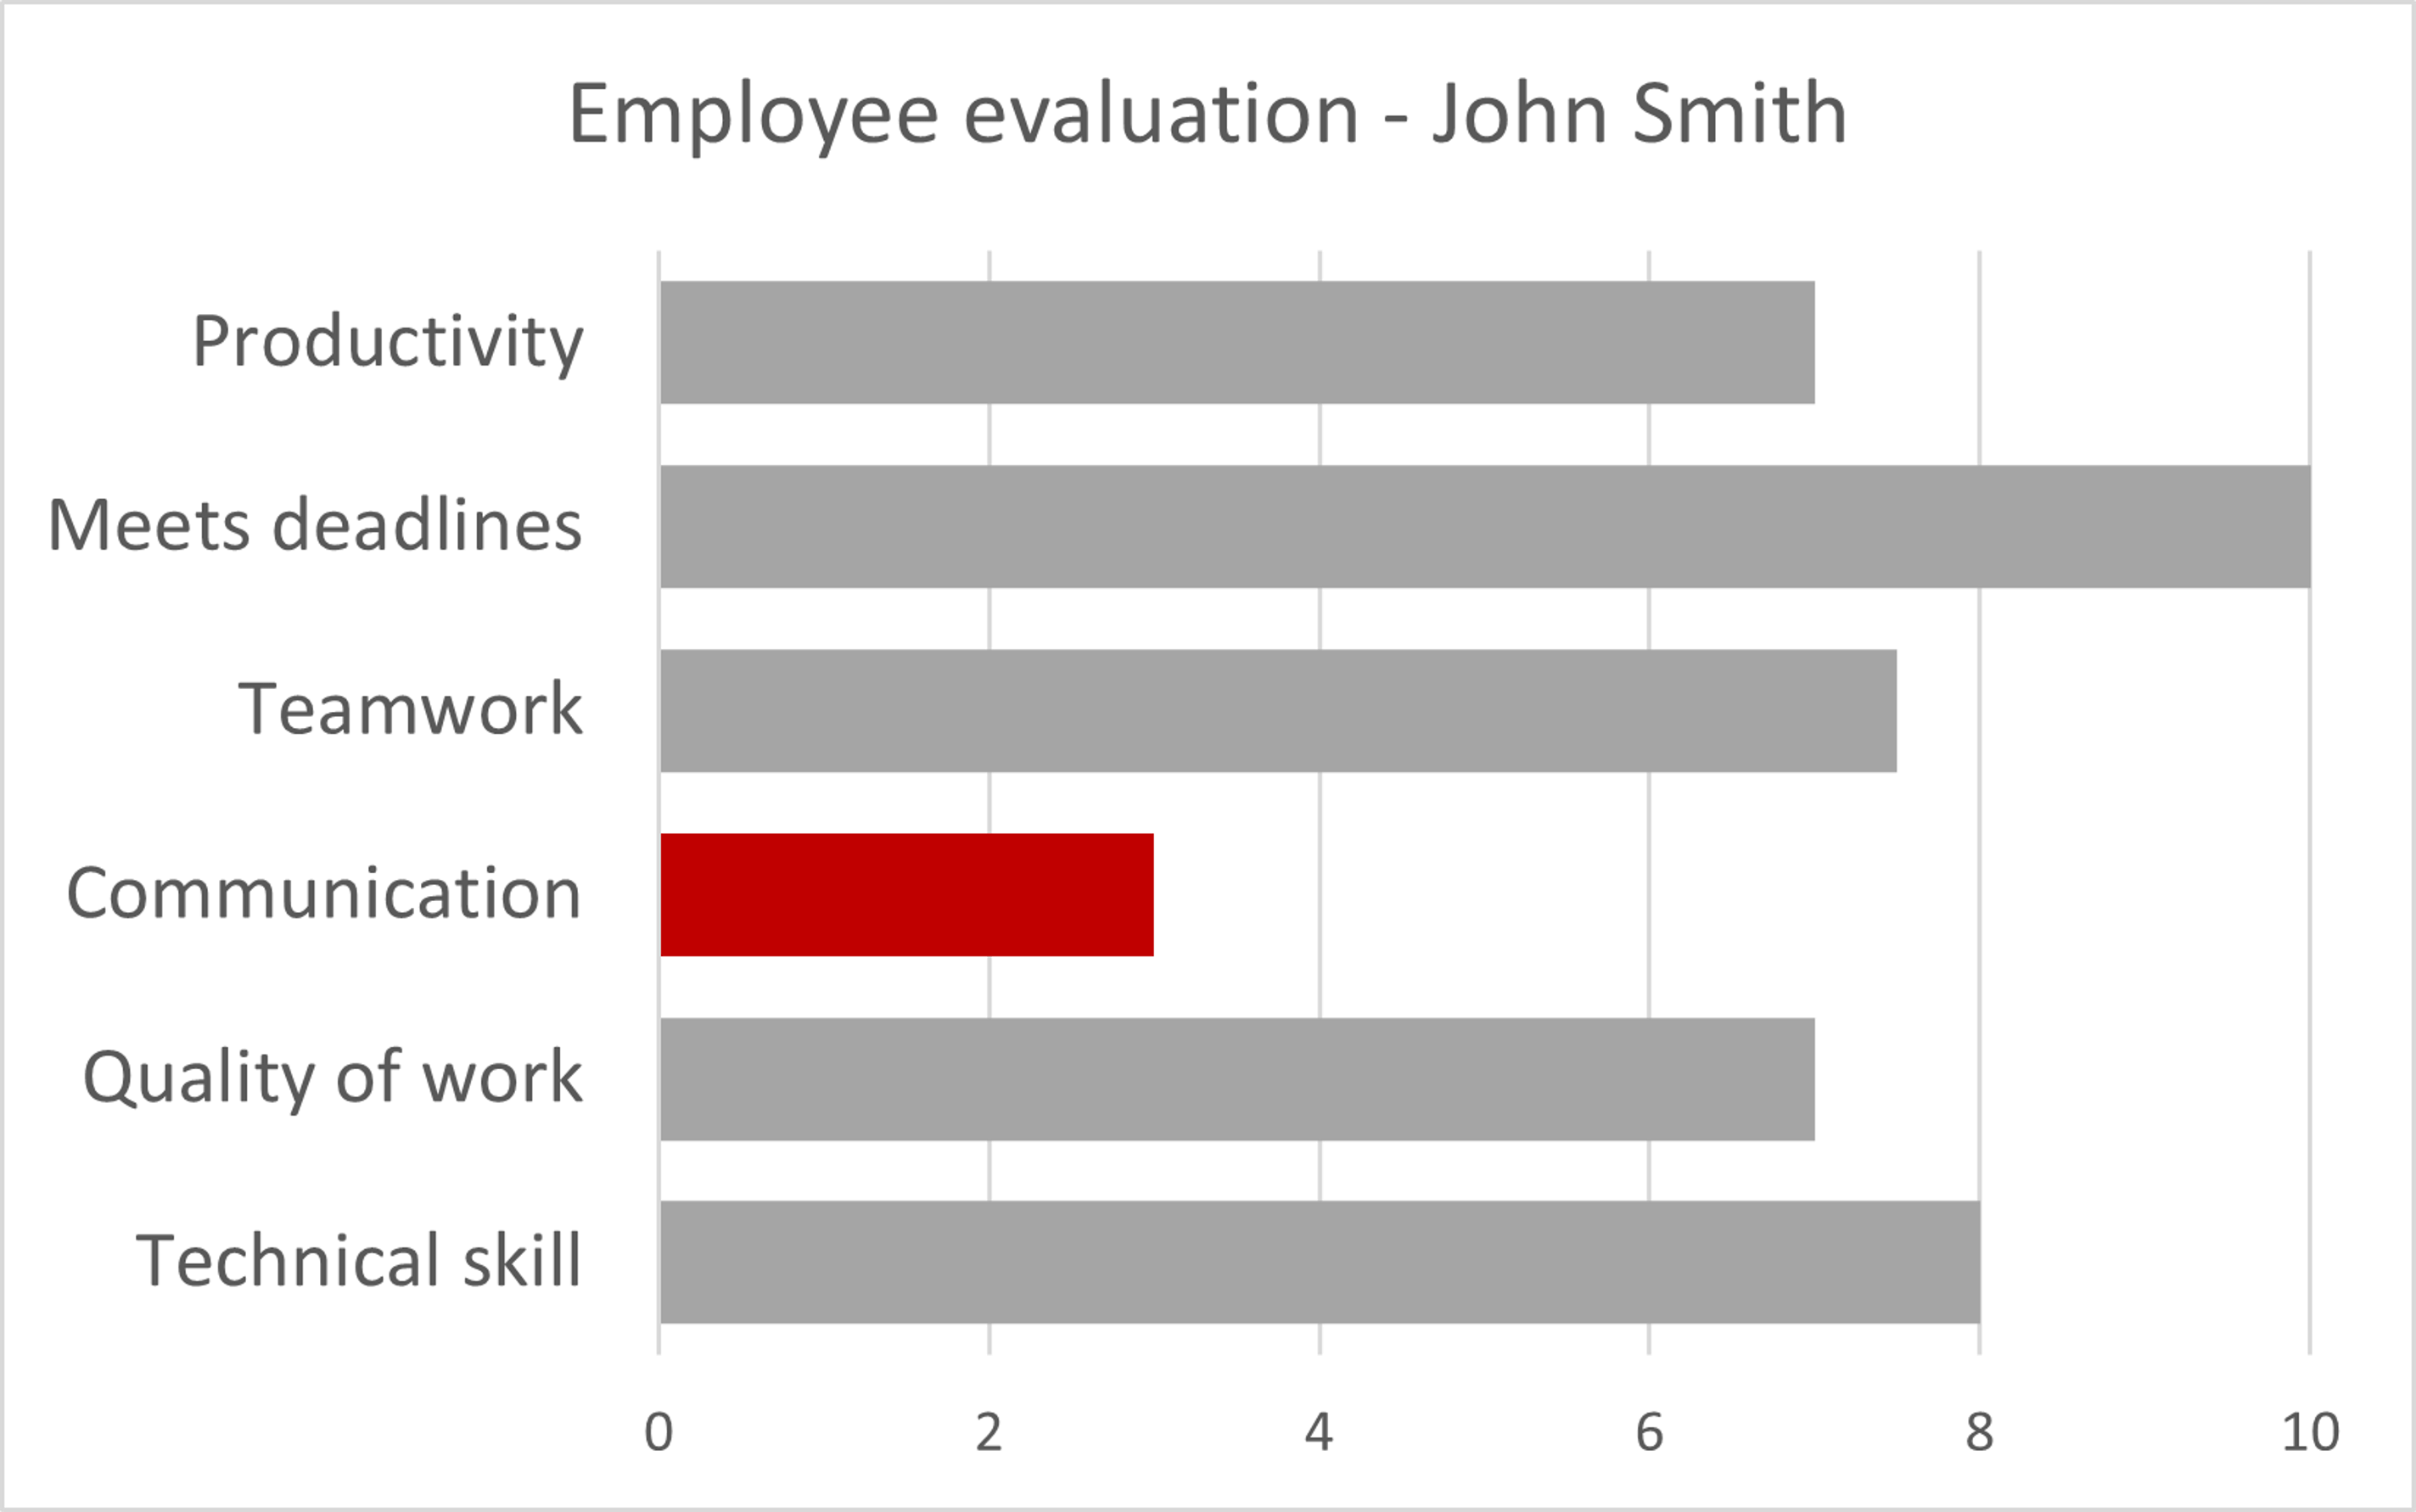
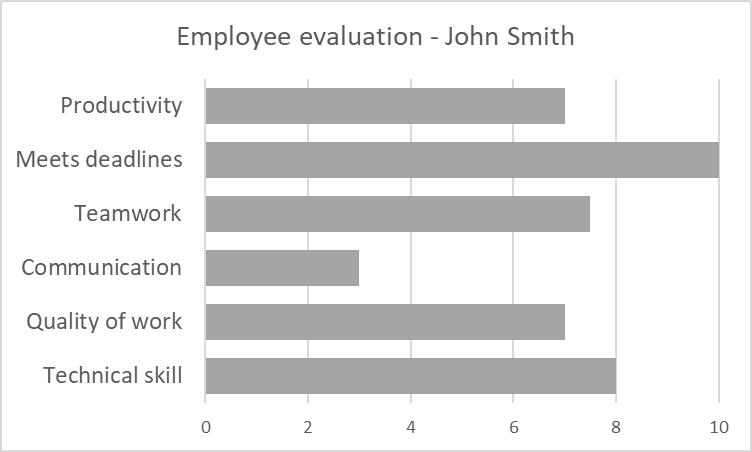
Though all three of these charts show the same data, they each draw the reader’s attention to a different aspect of the chart. While the first chart with all bars in grey contains many competing stories, the next two charts each bring focus to one specific insight. This attention to a single insight is one of the characteristics of a good story. Other pre-attentive attributes that can be used to draw the eye include length, width, orientation, size, position, and curvature.
Though data visualization forms an integral part of data storytelling, simply presenting a single insight using a chart does not make a story. A narrative structure is truly what sets storytelling apart from just visualization. To complete the picture, let us understand how narrative structure can be applied to data.
Now that we have understood how data visualization forms only a part of storytelling, let us discuss the motivation for data storytelling. There are two main motivations for presenting data through a narrative structure. The first is to provide sufficient context around our insight in order to make it understandable. Using a narrative also adds a causal structure that connects the facts that lead up to our central insight. The second reason is to add emotional value to our insight, allowing us to engage and ultimately convince our audience about the importance of our idea, and to spur them into appropriate action.
People with analytical mindsets often overlook the emotional element, assuming that facts should speak for themselves or that data impacts everyone as it does them. However, this approach is rarely effective or useful in real-world scenarios, where each audience member has a unique background, motivation, and skill set. When crafting data stories, a crucial question to address is: Why should people care? Incorporating an emotional element provides a compelling reason for people to engage with your insights.
Now, this narrative element is largely absent from data visualization where we use charts to appeal more to the logical and numerical side. In addition, a chart lays out all of the facts for the audience to take in all at once, instead of leading up to a main insight as in the case of a narrative.
Many authors have written about how to adapt narrative structure to data insights. We will examine Brent Dykes’ adaptation of Freytag’s pyramid in detail to get a handle on what narrative structure is all about, before briefly discussing other possibilities.
Want to take your data storytelling to the next level in Power BI?
See storytelling features in Inforiver Analytics+
Humans have always been storytellers, starting from our hunter-gatherer ancestors who told stories gathered around the fire, to modern employees who gather around the water cooler to exchange office gossip. This centrality to our culture has made narrative structure an important subject of literary analysis. Narrative structure can be defined as the order in which events occur in a story. Gustav Freytag proposed the structure pictured below in 1863, known as Freytag’s pyramid.
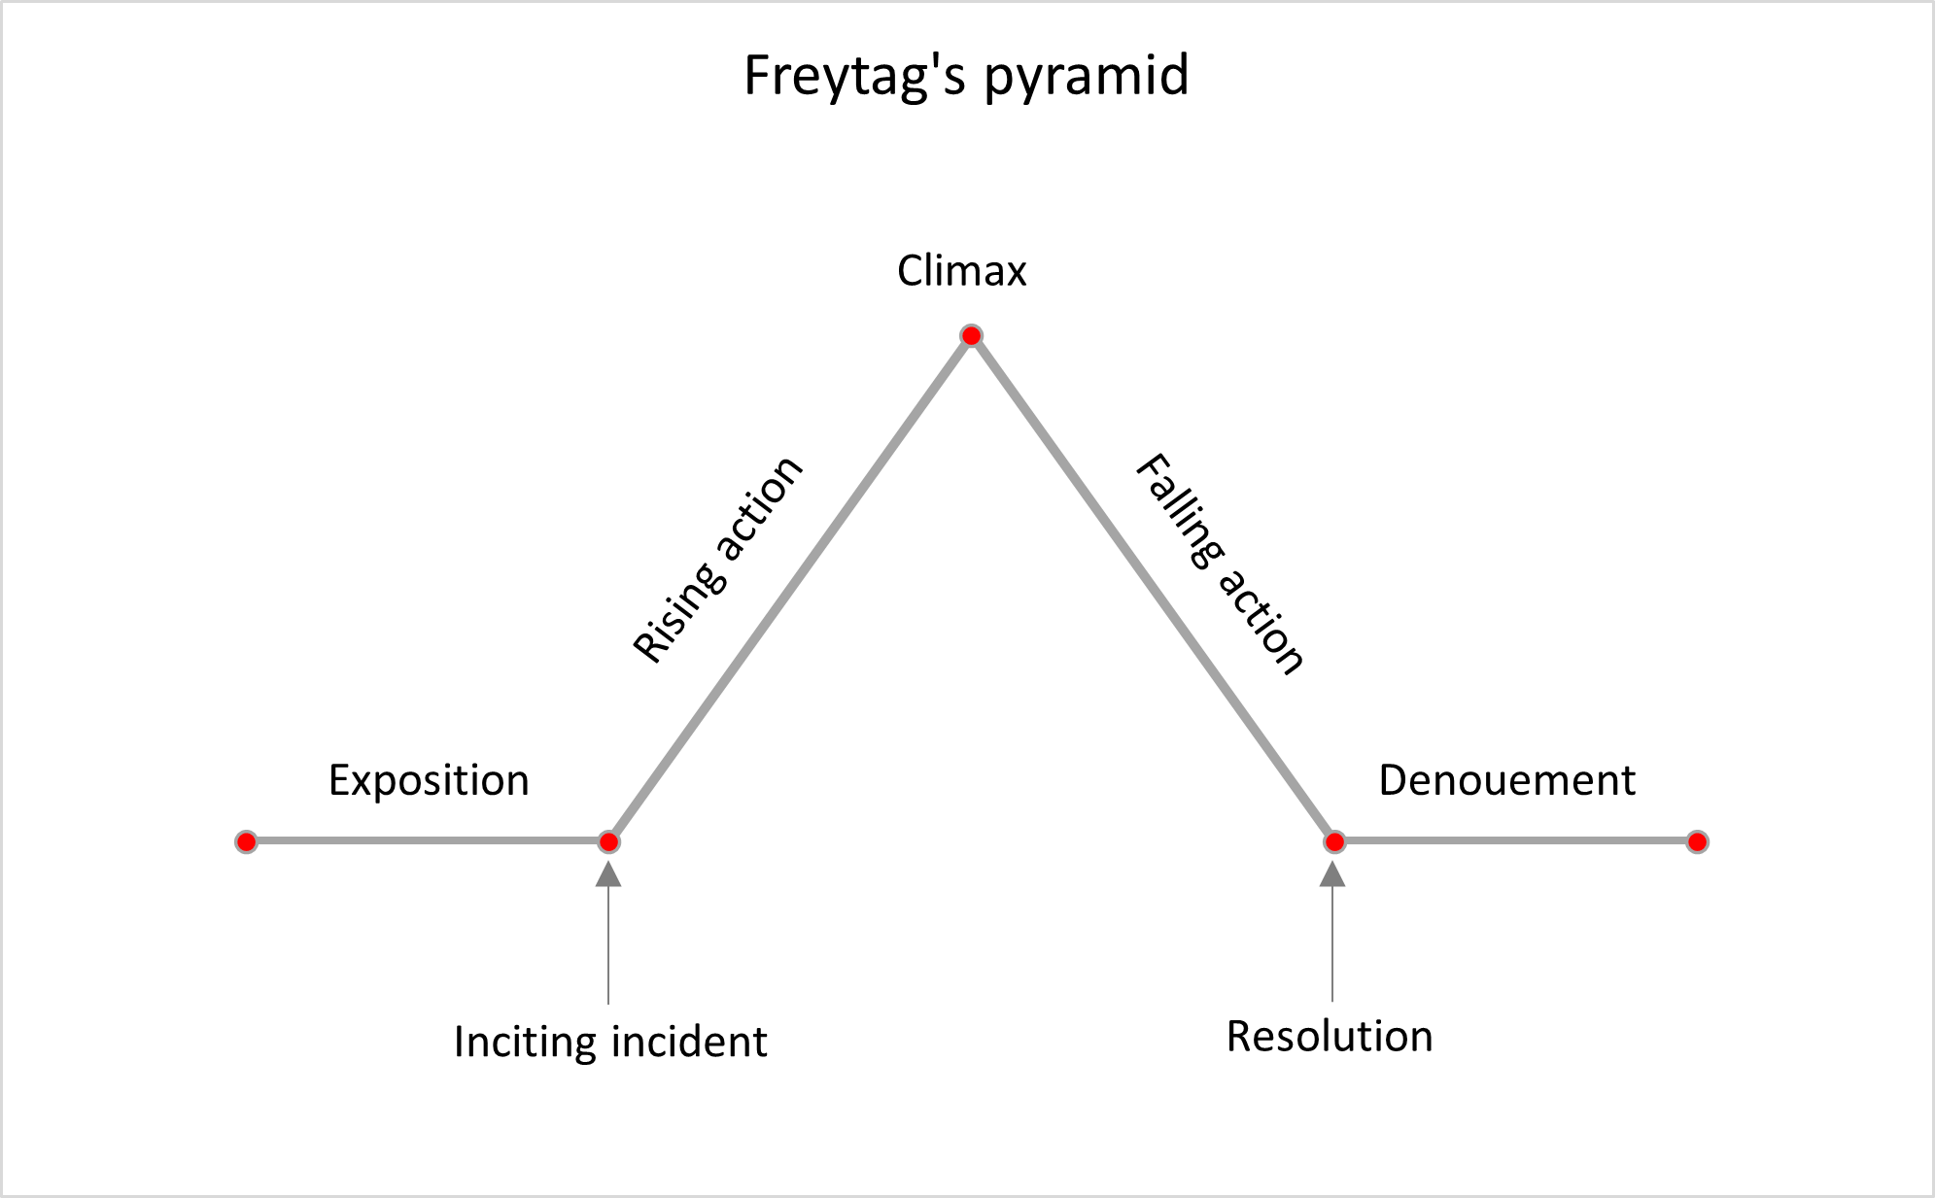
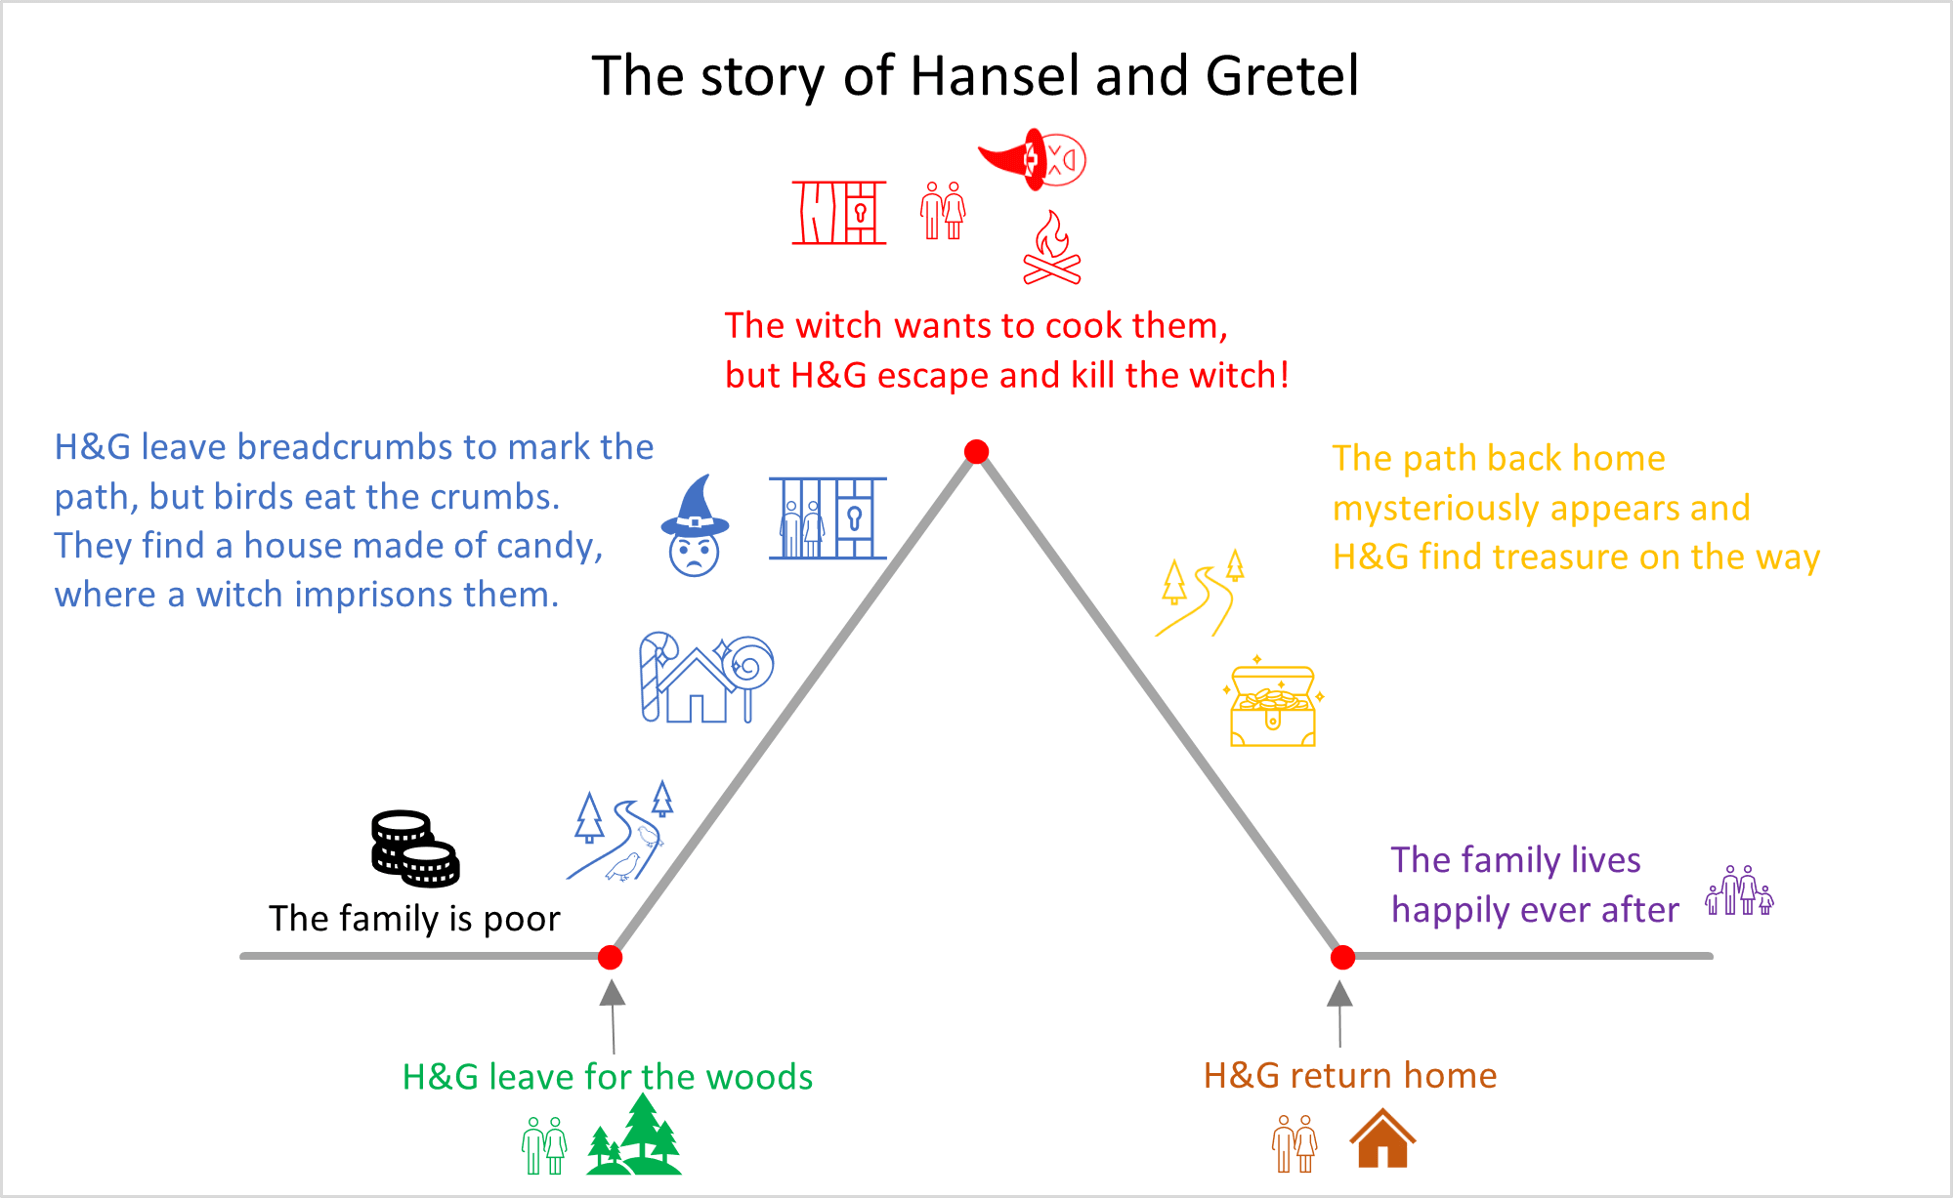
We may understand Freytag’s pyramid using the story of Hansel and Gretel. The exposition is the setting and context of the story. Here, we learn that Hansel and Gretel live with their parents in extreme poverty, where the children have nothing to eat. Then comes the inciting incident, which is the spark that sets the story in motion and changes the course of our characters’ journeys – spurred by hunger, the siblings run away into the woods.
Now comes a series of events that constitute the rising action. The children decide to mark the path through the woods with breadcrumbs, so that they can follow the trail back, but the breadcrumbs are eaten by birds and the children are lost. Eventually, they happen upon a house made entirely of candy, and are lured in by an evil witch who locks them in a cage. Then comes the exciting climax – as the witch is preparing to cook and eat the children, they escape from the cage and instead push the witch into the fire, killing her!
The story then goes through the falling action stage, where we see the reckoning and reversal. The path leading home mysteriously reappears and as the children walk back, they find gold and jewels which they take with them. For the resolution and denouement, the children reach home and are safely reunited with their parents and the family lives happily ever after.
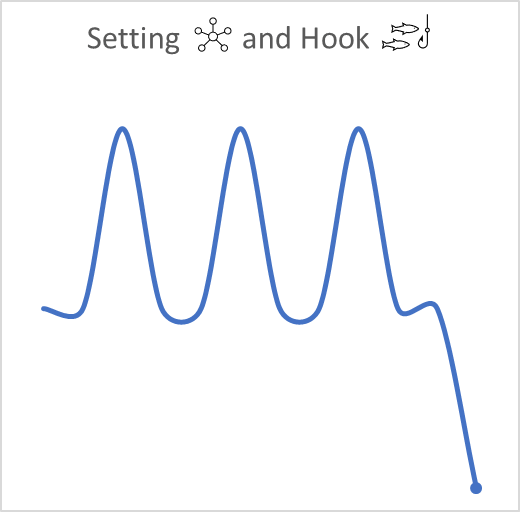
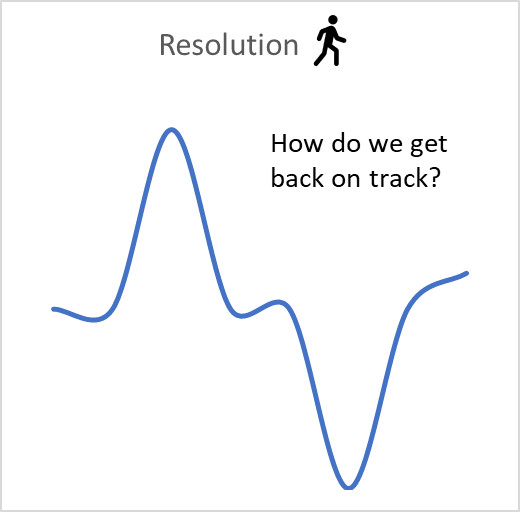
Now, you may wonder what any of this has to do with data analysis or visualization. In his book Effective Data Storytelling, Brent Dykes uses Freytag’s pyramid to create a narrative structure that can be used to tell data stories. An adapted diagram of his structure is shown below.
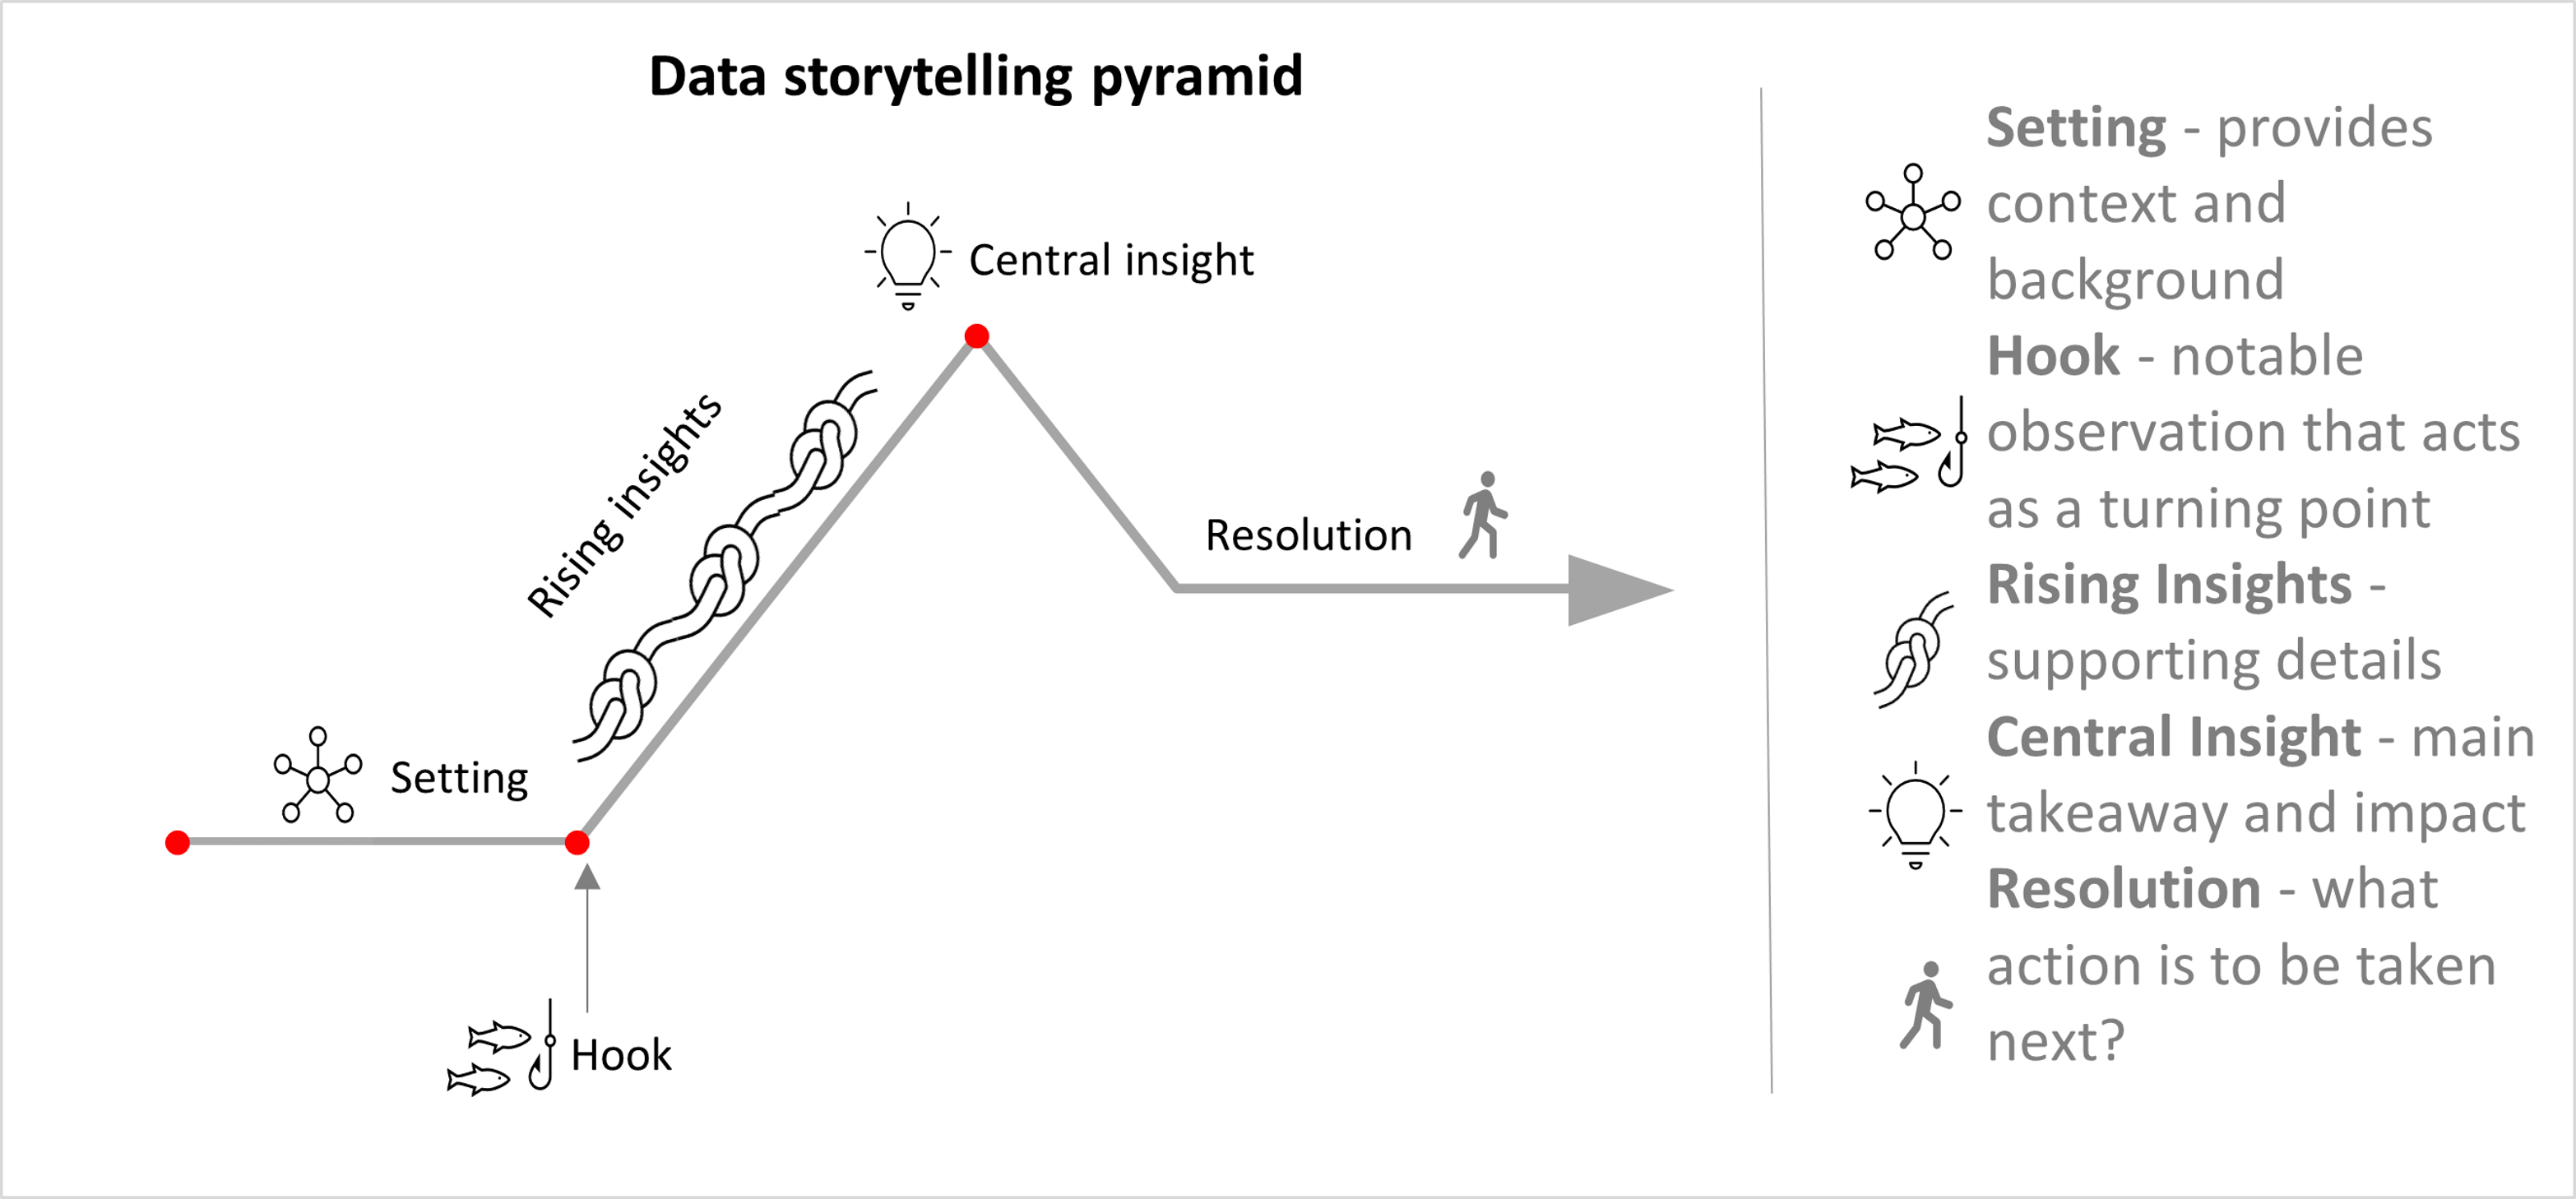
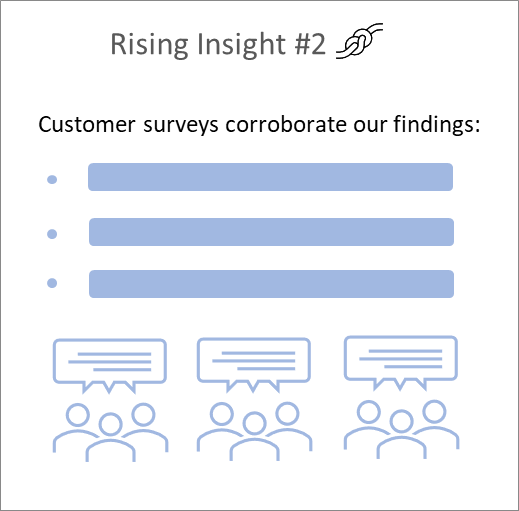
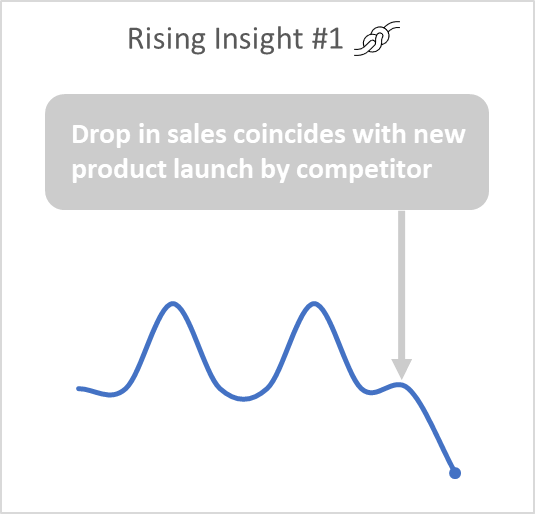
3. Rising insights: Rising insights constitute the supporting data and insights that add to the context around the anomaly that we noticed. We may try to answer the question, why did the change happen? With our sales example, we may perhaps note how a competitor launched a new product, coinciding with the dip in sales. We may provide additional supporting details such as surveys detailing the reasons why customers switched to the competitor’s product.
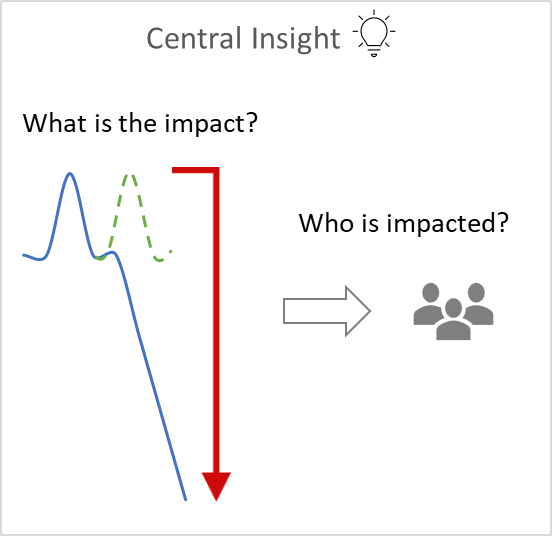
4. Central Insight: We have now built up to the “Aha! Moment”, which answers the question, why should people care? This provides the impact factor – what happens if the current trend continues? Why is it important to your organization? For example, with our sales story, we may want to emphasize that a continuation of the current trend would lead to a loss of $5 million for the company over the next 6 months. This is also your chance to make use of a hero in your story. Now, many people assume that the data is the hero of a data story, but keep in mind that people should always be the heroes of your story.
Business decisions ultimately affect people, whether it is the stakeholders, customers, or the teams involved, and adding a human impact factor can persuade your audience of the importance of your result.
5. Resolution: The resolution of the story comes in terms of the next steps that need to be taken. It lies in answering the question, what do we do about it? Now that you have convinced your audience about the credibility and importance of your insight, it is important to bring the story full circle by discussing what direction to take in light of what the data has shown. This gears our data story towards action, and prevents it from becoming just another “nice” or “interesting” story that is shortly forgotten.
Many authors have adapted story structure to fit data insights in different ways. Storytelling with Data author, Cole Nussbaumer Knaflic, adapts the classic structure of plot-twist-ending that we are all familiar with to data insights in the following way:
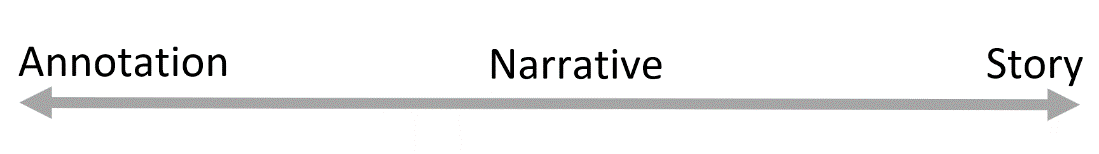
Jonathan Schwabish, author of Better Data Visualizations, uses an axis stretching from annotation to narrative to story to talk about story structure. He contends that while annotation consists of adding text to charts that explains their content and working, and narrative consists of guiding the reader through a series of visualizations, story comes from adding emotion and a climax to narrative.
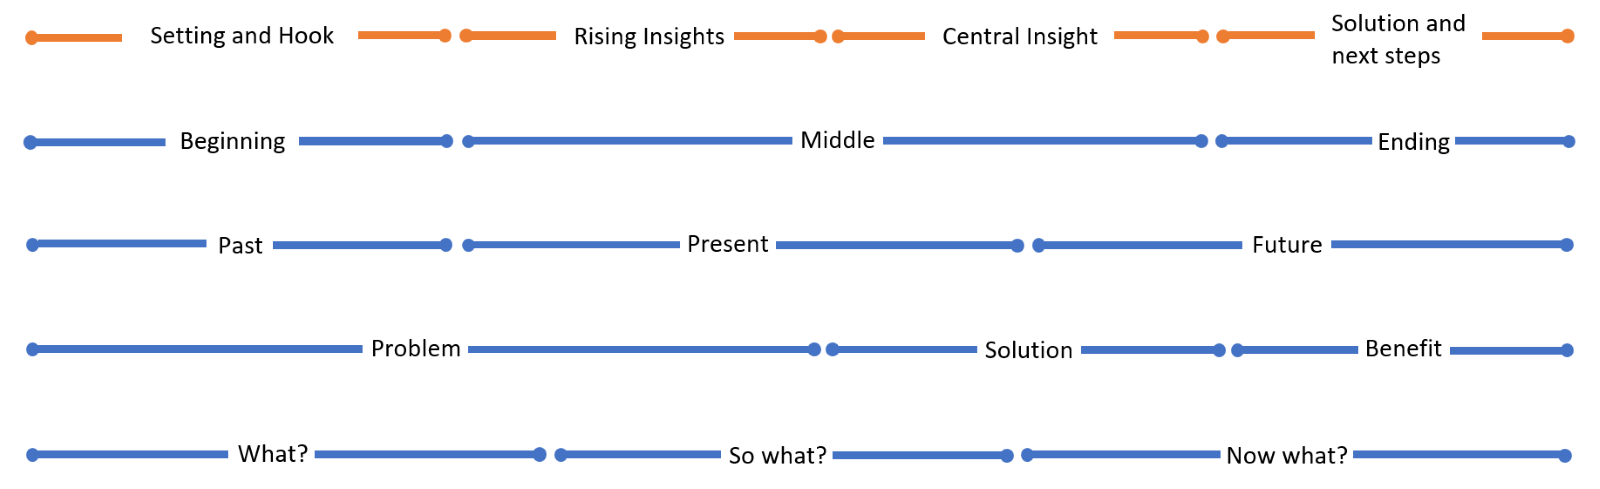
There are other types of commonly used structures in presentations, including beginning-middle-end, past-present-future, problem-solution-benefit, and what? – so what? – now what? Many of these can be mapped alongside our model from the previous section as follows.
Not all insights require a story. In fact, applying a long-winded narrative to every single insight is likely to take an inordinate amount of time and cause the audience to lose interest. Instead, stories must be employed strategically, for only the most important insights. Brent Dykes offers a visualization showing when stories are best used, which we have adapted below:
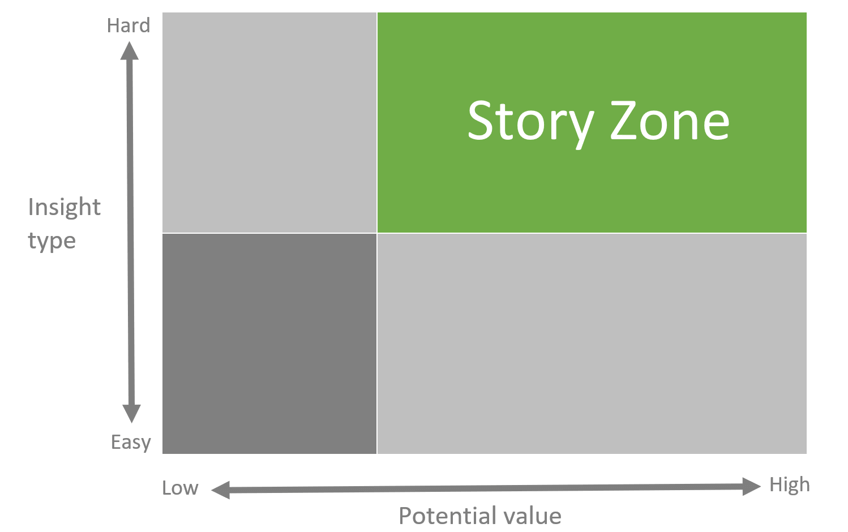
This diagram must be read in terms of enacting change. The story zone represents the conditions in which it is most difficult to convince your audience to act on your insights. On the vertical scale, an insight can be hard when it is inherently hard to understand, or when it requires a substantial investment into change, or a risk that your audience may not be willing to take. On the horizontal scale, we have the potential value of the insight. As seen here, stories are best used for relatively difficult insights with medium to high value. Insights that are of high value, but easy to implement likely do not need storytelling. This is a case where data visualization is often an adequate tool to convince our audience.
To conclude, storytelling can be a powerful tool when used strategically to convey the right type of insights. While data visualization is an essential part of the storytelling journey, the latter involves an essential narrative element that is missing from simple visualization. This lends emotional depth that can help the audience become invested in and ultimately convinced by our story.
By - Hamsini Sukumar
References:
Other resources:

Inforiver helps enterprises consolidate planning, reporting & analytics on a single platform (Power BI). The no-code, self-service award-winning platform has been recognized as the industry’s best and is adopted by many Fortune 100 firms.
Inforiver is a product of Lumel, the #1 Power BI AppSource Partner. The firm serves over 3,000 customers worldwide through its portfolio of products offered under the brands Inforiver, EDITable, ValQ, and xViz.