Upcoming webinar on 'Inforiver Charts : The fastest way to deliver stories in Power BI', Aug 29th , Monday, 10.30 AM CST. Register Now
Upcoming webinar on 'Inforiver Charts : The fastest way to deliver stories in Power BI', Aug 29th , Monday, 10.30 AM CST. Register Now
There are huge differences between Inforiver and Acterys when it comes to planning. These differences manifest not only in the features & capabilities supported, but also in the underlying philosophy and approach to planning.
Understanding the philosophical differences first will help us relate better to the differences in features & capabilities.
Acterys, like many other planning software (such as PowerOn, Aimplan, Anaplan, OneStream, and Pigment), follows a legacy, model-first approach to planning. This approach - which came into existence three decades ago - has several disadvantages, including the following:
Inforiver, on the other-hand, follows a modern, user-first approach to planning. The modern and futuristic approach has several advantages, including the following:
| No. | Category | Inforiver | Acterys |
|---|---|---|---|
| 1 | Architecture | Single visual with all capabilities built-in; Consistent UX | Needs multiple Acterys visuals with varied UX to build planning apps. |
| 2 | Planning Approach | Modern, user-first approach; Self-service planning. | Legacy, model-first approach; IT-dependent, as it needs database and models to be set up first. |
| 3 | Plan right on top of your existing Power BI semantic layer | Yes. Plan on top of ANY Power BI report or semantic model. Does not require replication of data from source - this way, your plans are always based on the latest data. Ensures 100% self-service planning. | No. Needs custom models dedicated for planning. You need to create dimensions & fact tables (cubes) first at the database. You need to replicate data into a staging layer - in a format suited for Power BI reporting. |
| 4 | Ideal for well-defined planning needs | Yes | Yes |
| 5 | Ideal for ad-hoc planning needs | Yes | No |
| 6 | Plan data coexists with your reporting (actuals) data | Yes | No. Creates a data silo. Your plans exist in a walled garden. |
| 7 | Data modeling efforts | Minimal to none for planning. Supports no-code, real-time between multiple plans (using InfoBridge). | Extensive data modelling efforts for planning. |
| 8 | Change Management & Maintenance | Low | High |
| 9 | Reliance on developers / IT | Low | High |
| 10 | User Experience (UX) | Innovative Excel-like UX; Slick toolbar with on-canvas interactions; No need to use complex property sheets. | Legacy approach to UX. Property-sheet based configurations. |
| 11 | Time-to-valueSpeed of Go-Live | Build your first, full-fledged planning application in minutes | Your first, full-fledged application takes several days to weeks |
Let us review some of the other differences below.
| No. | Category | Inforiver | Acterys |
|---|---|---|---|
| 12 | Microsoft Integration | Leverages Power BI, Fabric & Azure platform capabilities to the fullest. | Some Microsoft integration, with redundant ETL and data modelling. |
| 13 | Pricing | Transparent, flexible & scalable pricing (SaaS for SMB and Azure Private tenant for large enterprises). | Pricing not disclosed; Higher TCO due to implementation costs. |
| 14 | Deployment options | SaaS and Private Hosting on Azure services (“On-Premises”; Faster and simpler one-click deployment (Azure, AWS). | SaaS and On-Premises; Extensive IT and backend model setup, deployment & implementation effort. |
| No. | Category | Inforiver | Acterys |
|---|---|---|---|
| 15 | Company size | Smaller team (~30) mainly consisting of sales and marketing staff. Refer LinkedIn. | Smaller team (~30) mainly consisting of sales and marketing staff. Refer LinkedIn. |
| 16 | Reference customers | Global multinationals such as Merck, Microsoft, Disney, GSK and Allianz | Mainly small and medium businesses. Refer list of customers from the website. |
| No. | Category | Inforiver | Acterys |
|---|---|---|---|
| 17 | True hierarchical planning | Yes | Yes |
| 18 | Excel-like formatting | Flexible cell, value and number formatting options | Not supported natively. A separate Acterys visual is required. |
| 19 | Conditional formatting | Advanced. Rules-based. | Basic native Power BI formatting. |
| 20 | Comments & conversations | Cell, row, column and report-level comments with dynamic filter context awareness. Tracks user with AAD authentication, supports @mentions, pushes email notifications, facilitates replies & threaded conversations. | Basic cell level commenting. Also available as separate visual. Following are not supported: user tracking, notifications, replies or threaded conversations. |
| 21 | Audit | Filterable and interactive audit trail. Tracks chain of custody for changes made by multiple users. Can be tracked at cell or report level. | Basic change history data dump stored in raw xml format. |
| 22 | Budget allocations & distributions | Advanced splashing & distributions in rich, Excel-like interface. Supports several methods: equal, weights of self/past values/other drivers, till end of period, trend-based, etc. Highlights changes. | Yes. Supports basic distributions including ‘fill right’. Does not highlight elements impacted. |
| 23 | What-if Simulations | Advanced simulations with live variances. | Basic value-entry based simulations. |
| 24 | Scenarios | On-the fly and instant scenarios, with live variances. | Need to use separate Acterys copy visual to create manage scenarios. |
| 25 | Scheduling | Advanced scheduling with flexible frequencies. | Not supported. |
| 26 | Snapshots | Take periodic snapshots for distribution or backup. Compare with snapshots for variance analysis. | Not supported. |
| 27 | Themes | Support for enterprise themes. | Not supported. |
| 28 | Approvals | Out-of-the-box support with dropdown status fields. | Supported, but with additional development & configuration. |
| 29 | Adjustments | Manager can deny approval and request adjustments. | Not supported. |
| 30 | No-code planning templates | Add right on top of your existing report by inserting additional fields. Supports numeric, text, dropdown, date & user fields. | Back-end configuration needed to create planning templates. Additional fields cannot be added directly to the visual. |
| 31 | Time series extensions | Add future time periods in a report even if source data does not have future time-period dimension values. Feature available out-of-the-box. | Not supported. Modeling efforts required. |
| 32 | Rolling Forecasts | Automatically rolls over actuals to forecast during user defined closing cycles. | Not supported. |
| 33 | Goal Seek | Perform hierarchical goal-seek: Set objective value and auto distribute and proportionally allocate values in a hierarchy. | Not supported. |
| 34 | Pivot View and Aggregated Data Entry | Create multiple views inside the report at different levels of granularities; Users can splash data from any level which propagates to all records. | Not supported. |
| 35 | Dynamic cross-table / cross-visual lookup | LOOKUPs from other Inforiver reports to fetch data based on user inputs (e.g., User selects a rate type, and actual values are pulled into the visual). | Not supported. |
| 36 | Connected Planning | Seamless no-code, real-time connected planning through InfoBridge. No database modelling required. Changes in one report reflect in other reports real-time. | Requires extensive modelling and ETL. Even when achieved, downstream reports need refreshing. |
| No. | Category | Inforiver | Acterys |
|---|---|---|---|
| 37 | Modern, next-gen Writeback | The most modern writeback of all planning apps. Supports semi-structured and on-the-fly writeback where tables need not be defined in advance in the database. Fact table is untouched. | Writes back into fact tables (in the staging layer). The fact tables are altered. |
| 38 | Writeback destinations out of the box | Supports 10+ on-premises and cloud destinations (Snowflake, Databricks, Redshift, etc.) and shared drives (e.g., SharePoint). Admins can restrict users to specific destinations. | Writes back only to cloud and on-premises SQL Server. |
| 39 | Write back to multiple destinations simultaneously | Supported | Not supported. |
| 40 | Scheduled Writeback | Supported | Not supported. |
| 41 | Swap writeback destination without impacting your planning apps | Supported | Not supported. |
| 42 | Writeback using webhook / API | Yes, you can write anywhere. | Not supported. |
| 43 | No-code customized writeback | Customize your writeback out-of-the-box. E.g., Writeback only data with comments, exclude grand and subtotals, write back specific measures, write back specific row categories, etc. | Not supported. |
| 44 | Writeback with dimension IDs | Add dimension keys (e.g., Product ID) along with data shown in matrix (e.g., Product Name). This is critical for downstream integration. | Not possible. This would be a significant modelling effort. |
| 45 | Writeback in wide or long table formats | Yes. Write to wide formats when you want to write back as you see in an Excel file. Use long formats for query-friendliness and to track change history. | Not supported. |
| 46 | Writeback with error validation | Yes. Both formula and value-driven checks supported. | Not supported. |
| No. | Category | Inforiver | Acterys |
|---|---|---|---|
| 47 | Global destination authorizations | Yes. Admin can turn on/off specific destinations across the company (e.g., Databricks, OneDrive). | Not applicable. |
| 48 | Authorization for admin-created connections | Yes. Admin creates global connections and can authorize specific (or all) users. | Not applicable. |
| 49 | Authorization for users to create their own connections | Yes. Admin can authorize specific (or all) users to create their own connections in their report. | Not applicable. |
| 50 | Scenario security | Yes. Report creator controls who can access scenarios in the report. | Not supported. |
| 51 | Commenting security | Yes. Report creator controls who can comment in their report. | Not supported. |
| 52 | Workspace security | Yes. Admin controls which users can have access to the Inforiver workspace. | Not applicable. |
| 53 | Insert column security | Yes. Report creator decides who can view or enter data in specific measure fields. | Not supported. Anyone with access to report can enter data. |
| 54 | Insert Row security | Yes. Report creator controls who can insert rows. | Not supported. Anyone with access to report can insert rows. |
| 55 | Conditional validations | Yes. Data input fields can only accept specific range of values. | Not supported. |
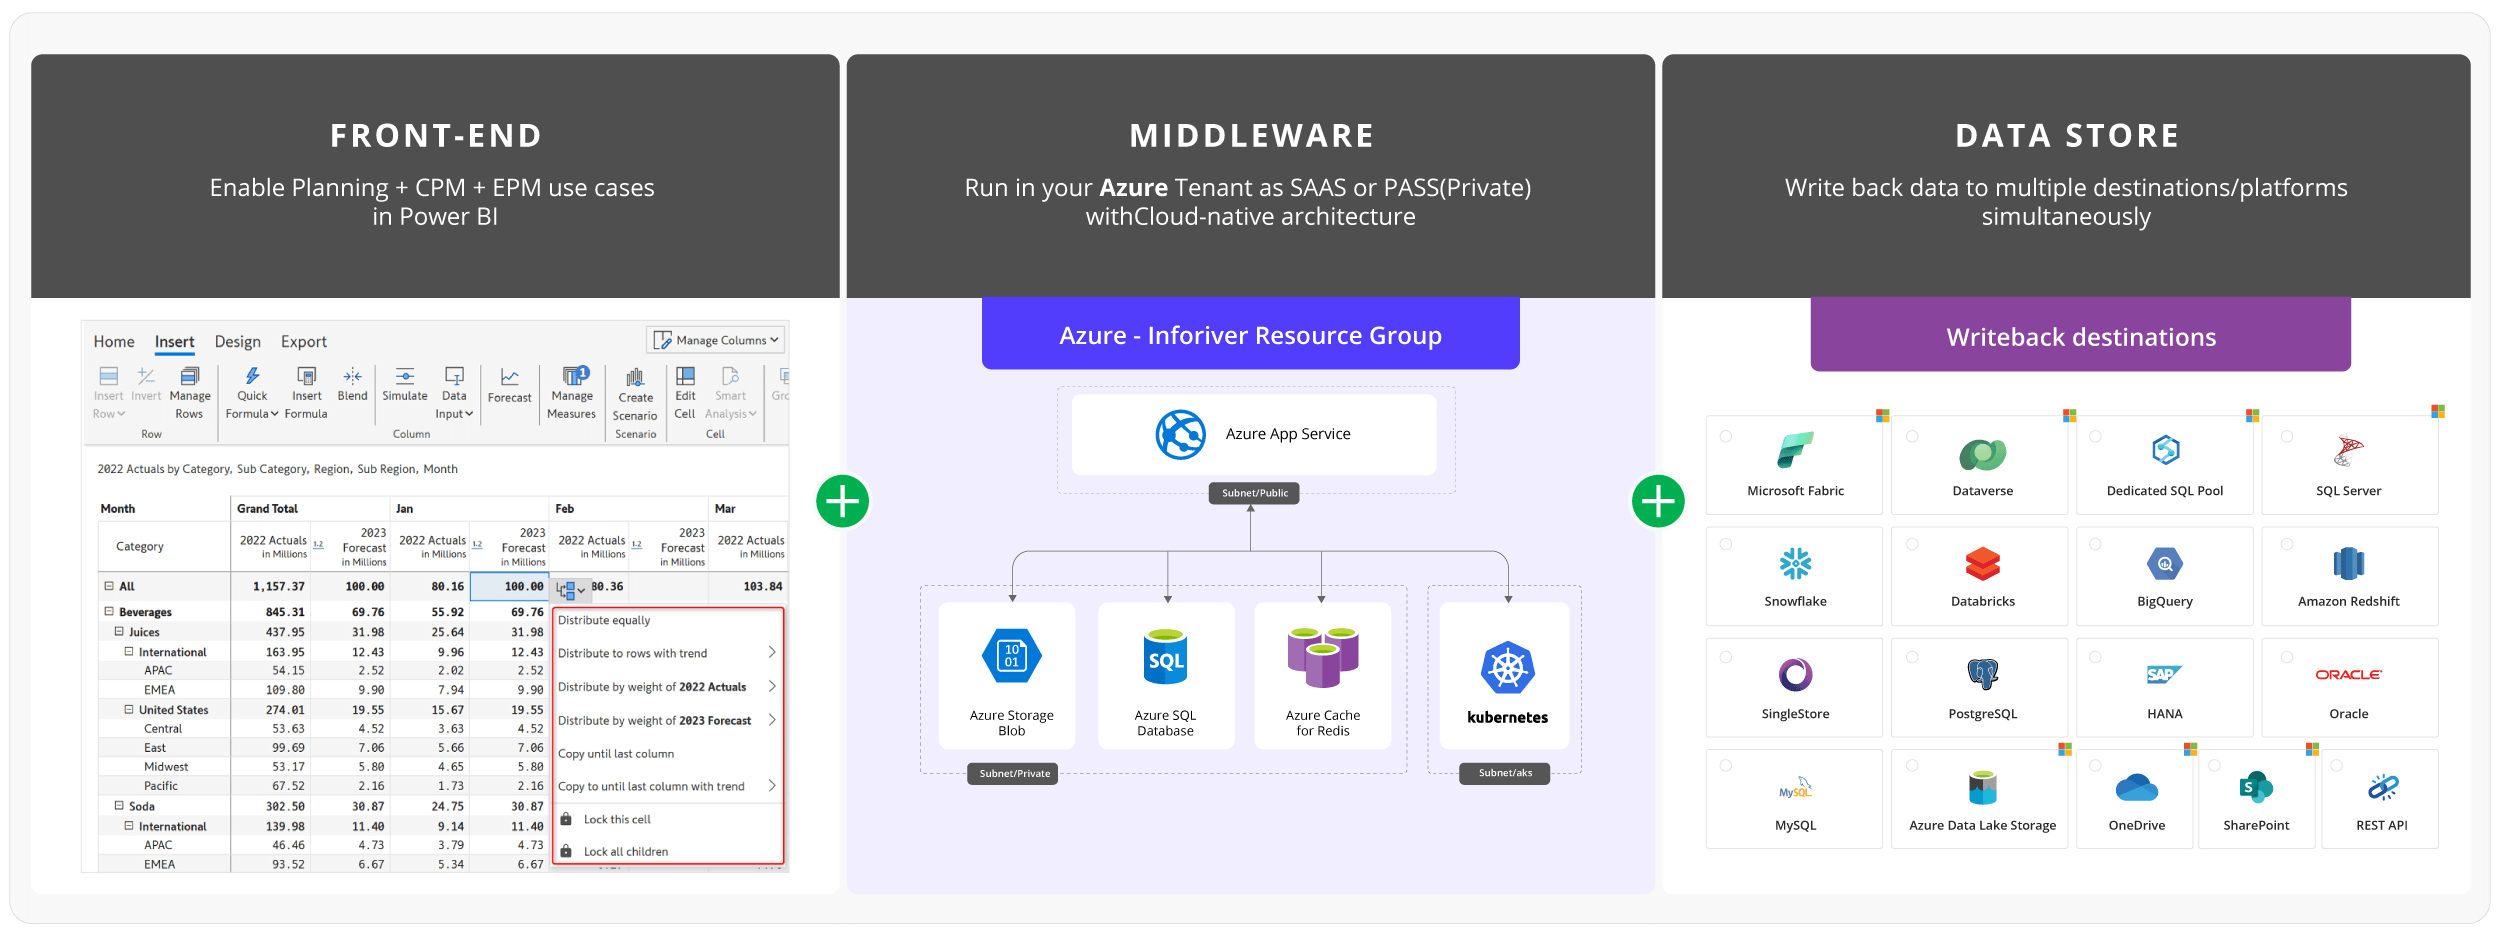
The above innovations are possible through Inforiver's modular cloud architecture that decouples the front-end, middleware, and data store. This allows you to:
Learn more about Inforiver
To learn more about the latest from Inforiver and why we are garnering recognition from industry experts, check out our newest brochure.
Inforiver and all our planning and analytics products continue to be updated to provide a diverse range of users with optimal performance. With continual improvements and innovations planned, we welcome your feedback.
If you’re ready to level up your planning, reporting, and analytics, try our products for free today.
Note: This page has been made available for general information purposes only. While we strive to ensure accuracy of information, product capabilities & features are subject to change over time. If you notice any inaccuracies or outdated information, please report them to us at Contact us so we can correct them.

Inforiver helps enterprises consolidate planning, reporting & analytics on a single platform (Power BI). The no-code, self-service award-winning platform has been recognized as the industry’s best and is adopted by many Fortune 100 firms.
Inforiver is a product of Lumel, the #1 Power BI AppSource Partner. The firm serves over 3,000 customers worldwide through its portfolio of products offered under the brands Inforiver, EDITable, ValQ, and xViz.