Upcoming webinar on 'Inforiver Charts : The fastest way to deliver stories in Power BI', Aug 29th , Monday, 10.30 AM CST. Register Now
Upcoming webinar on 'Inforiver Charts : The fastest way to deliver stories in Power BI', Aug 29th , Monday, 10.30 AM CST. Register Now
The Inforiver Reporting Matrix continues to evolve, empowering users with more flexibility, control, and customization in their reporting workflows. In the latest October update v3.3.9, we’ve introduced several powerful enhancements designed to improve how you view, export, and interact with your reports.
From stepped and outline layouts in Excel exports to grouping columns, conditional formatting in read view, and new options for suppressing rows and columns with zero values, this release offers a suite of features that help you create cleaner, more focused, and highly tailored reports.
Let’s dive into the latest features that are now available in the Reporting Matrix — and see how they can transform the way you build and share your reports.
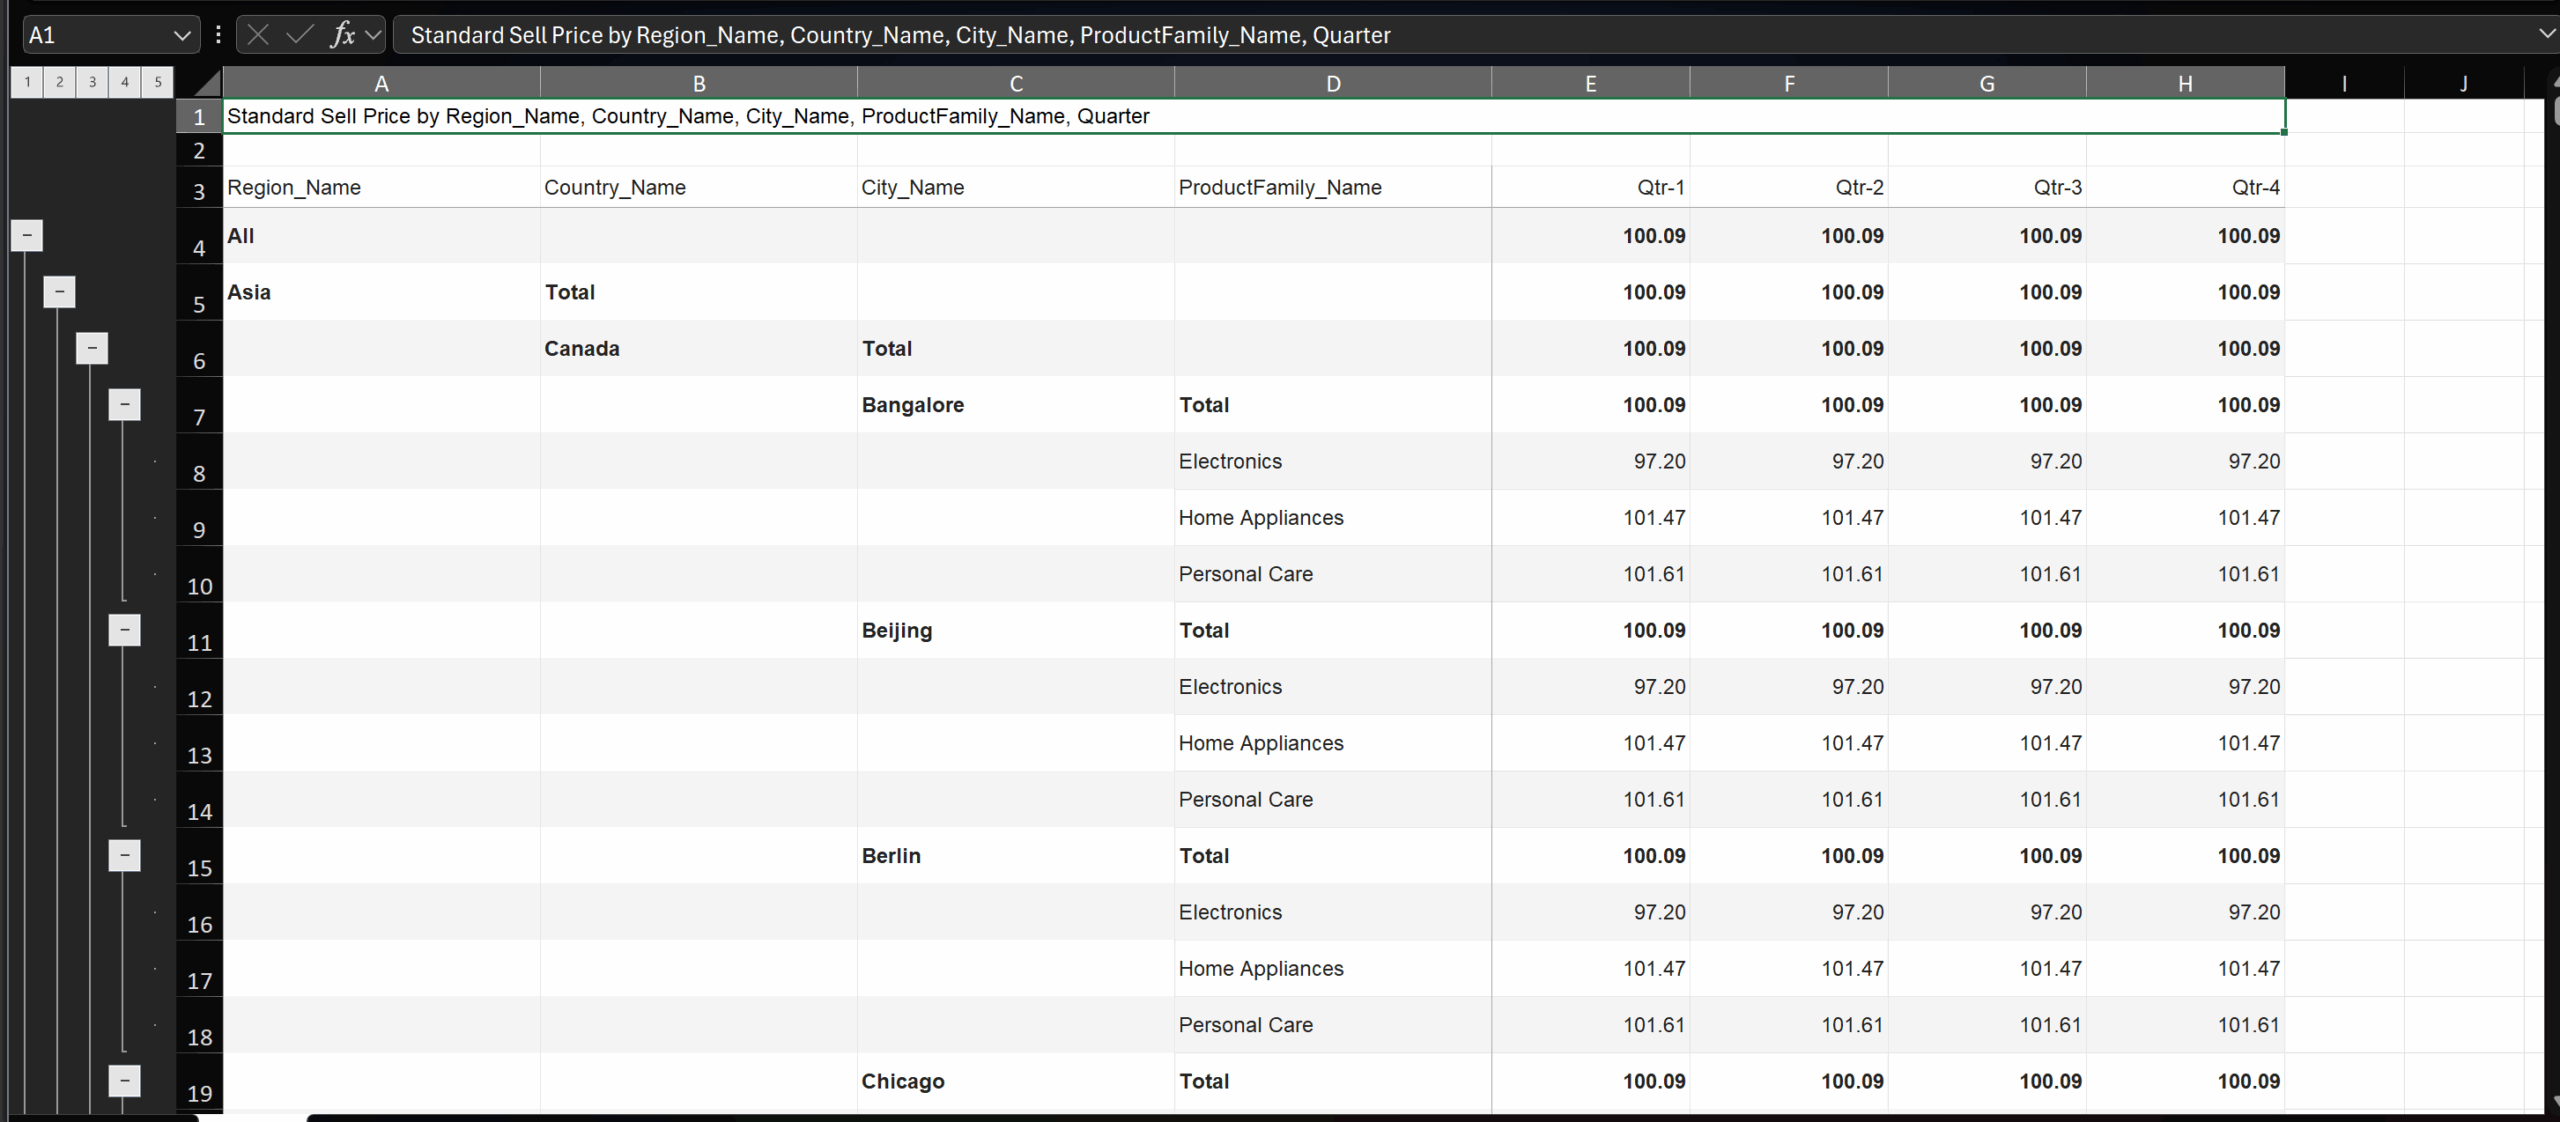
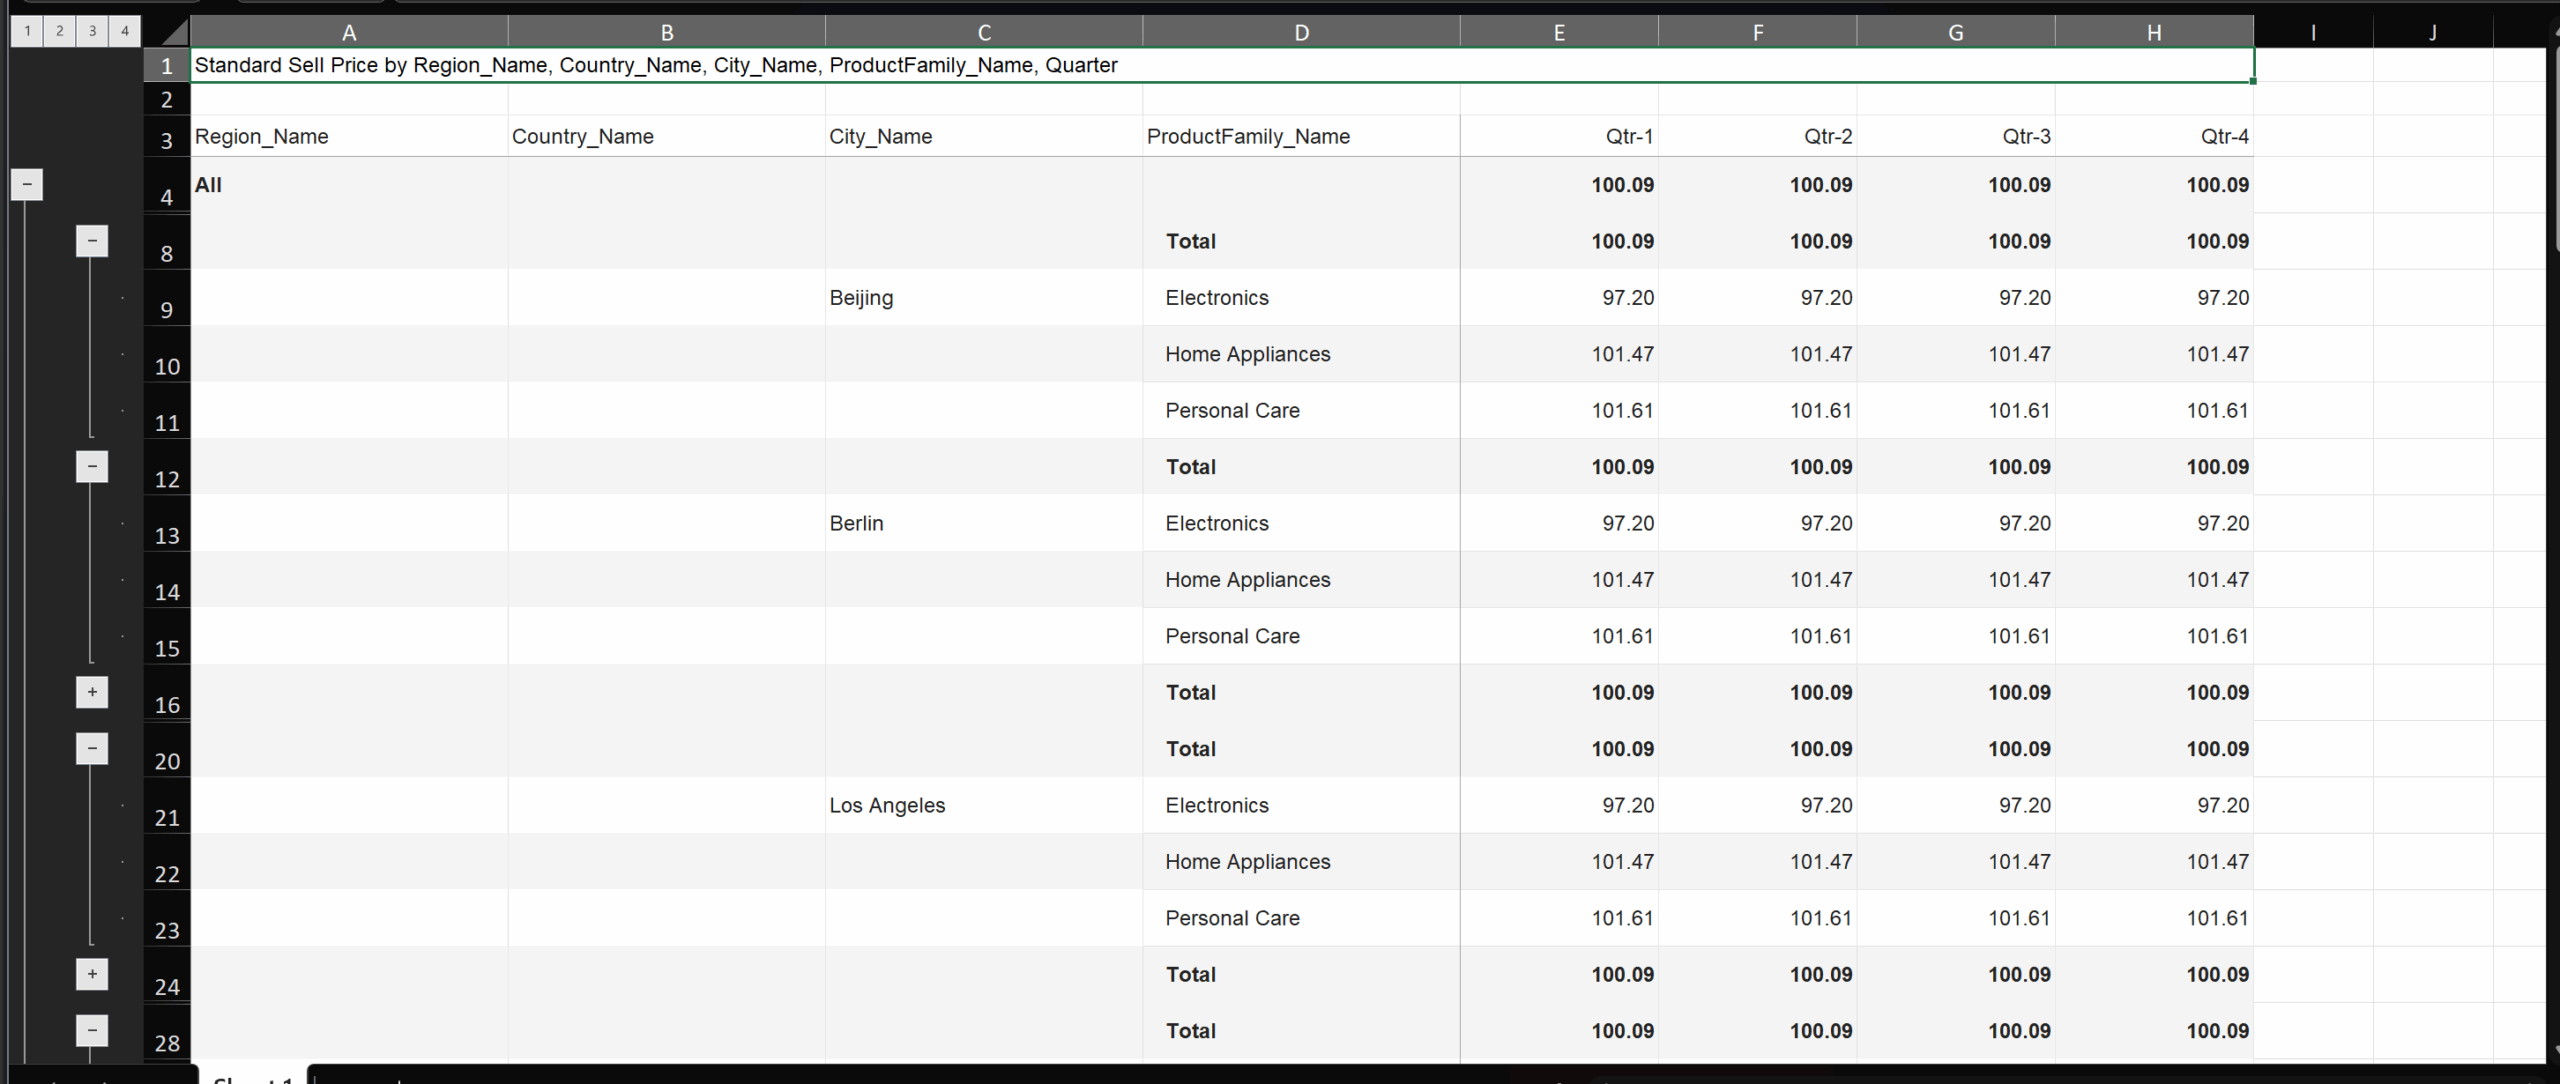
You can now export to Excel in Outline and Stepped Layouts with the Expand/Collapse option

The images below show the exported Excel file in the Outline and Stepped Layouts:
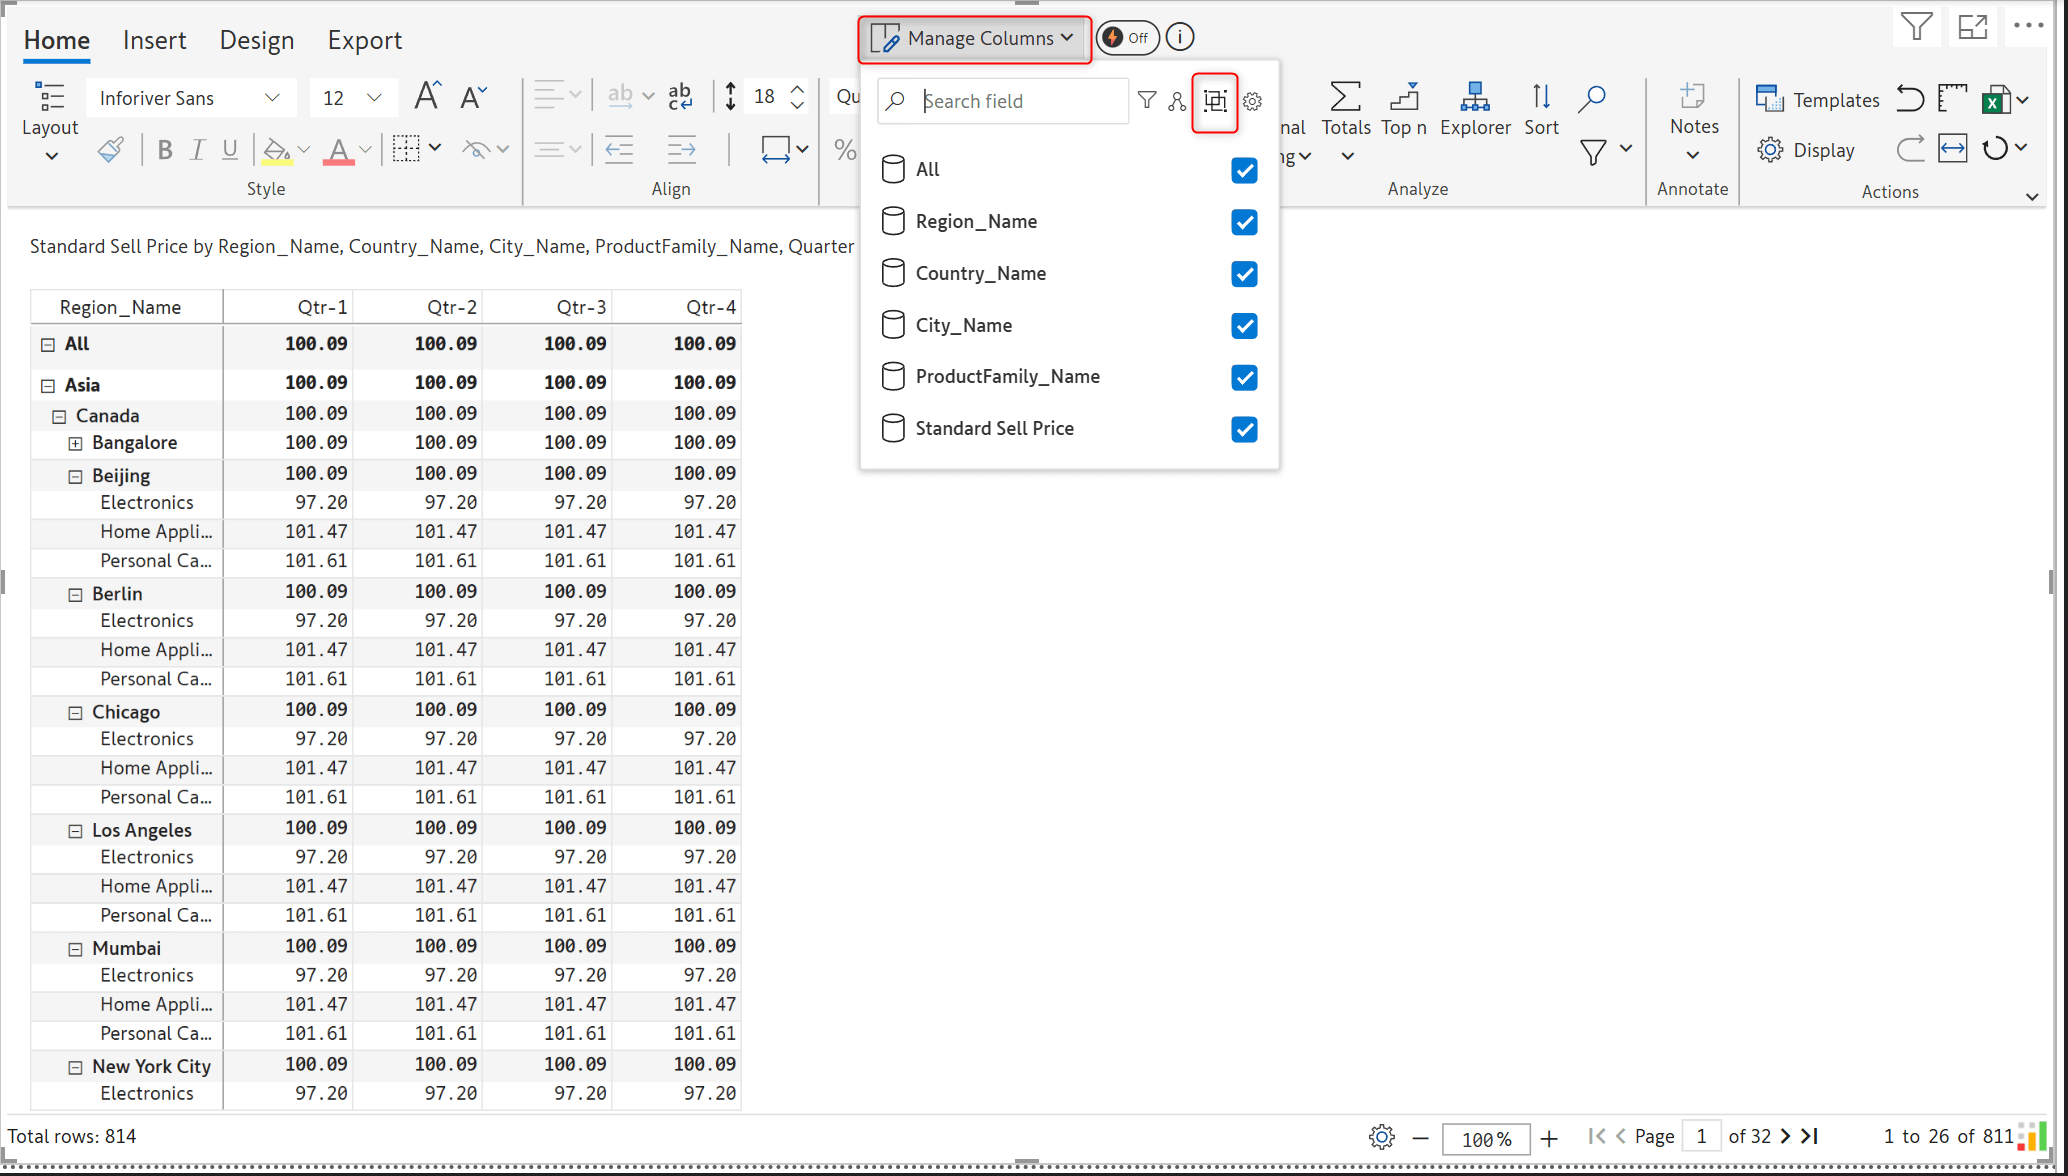
You can now group measures and columns of your choice and manage them together in the reporting matrix by clicking on the Model view icon under Manage Columns.
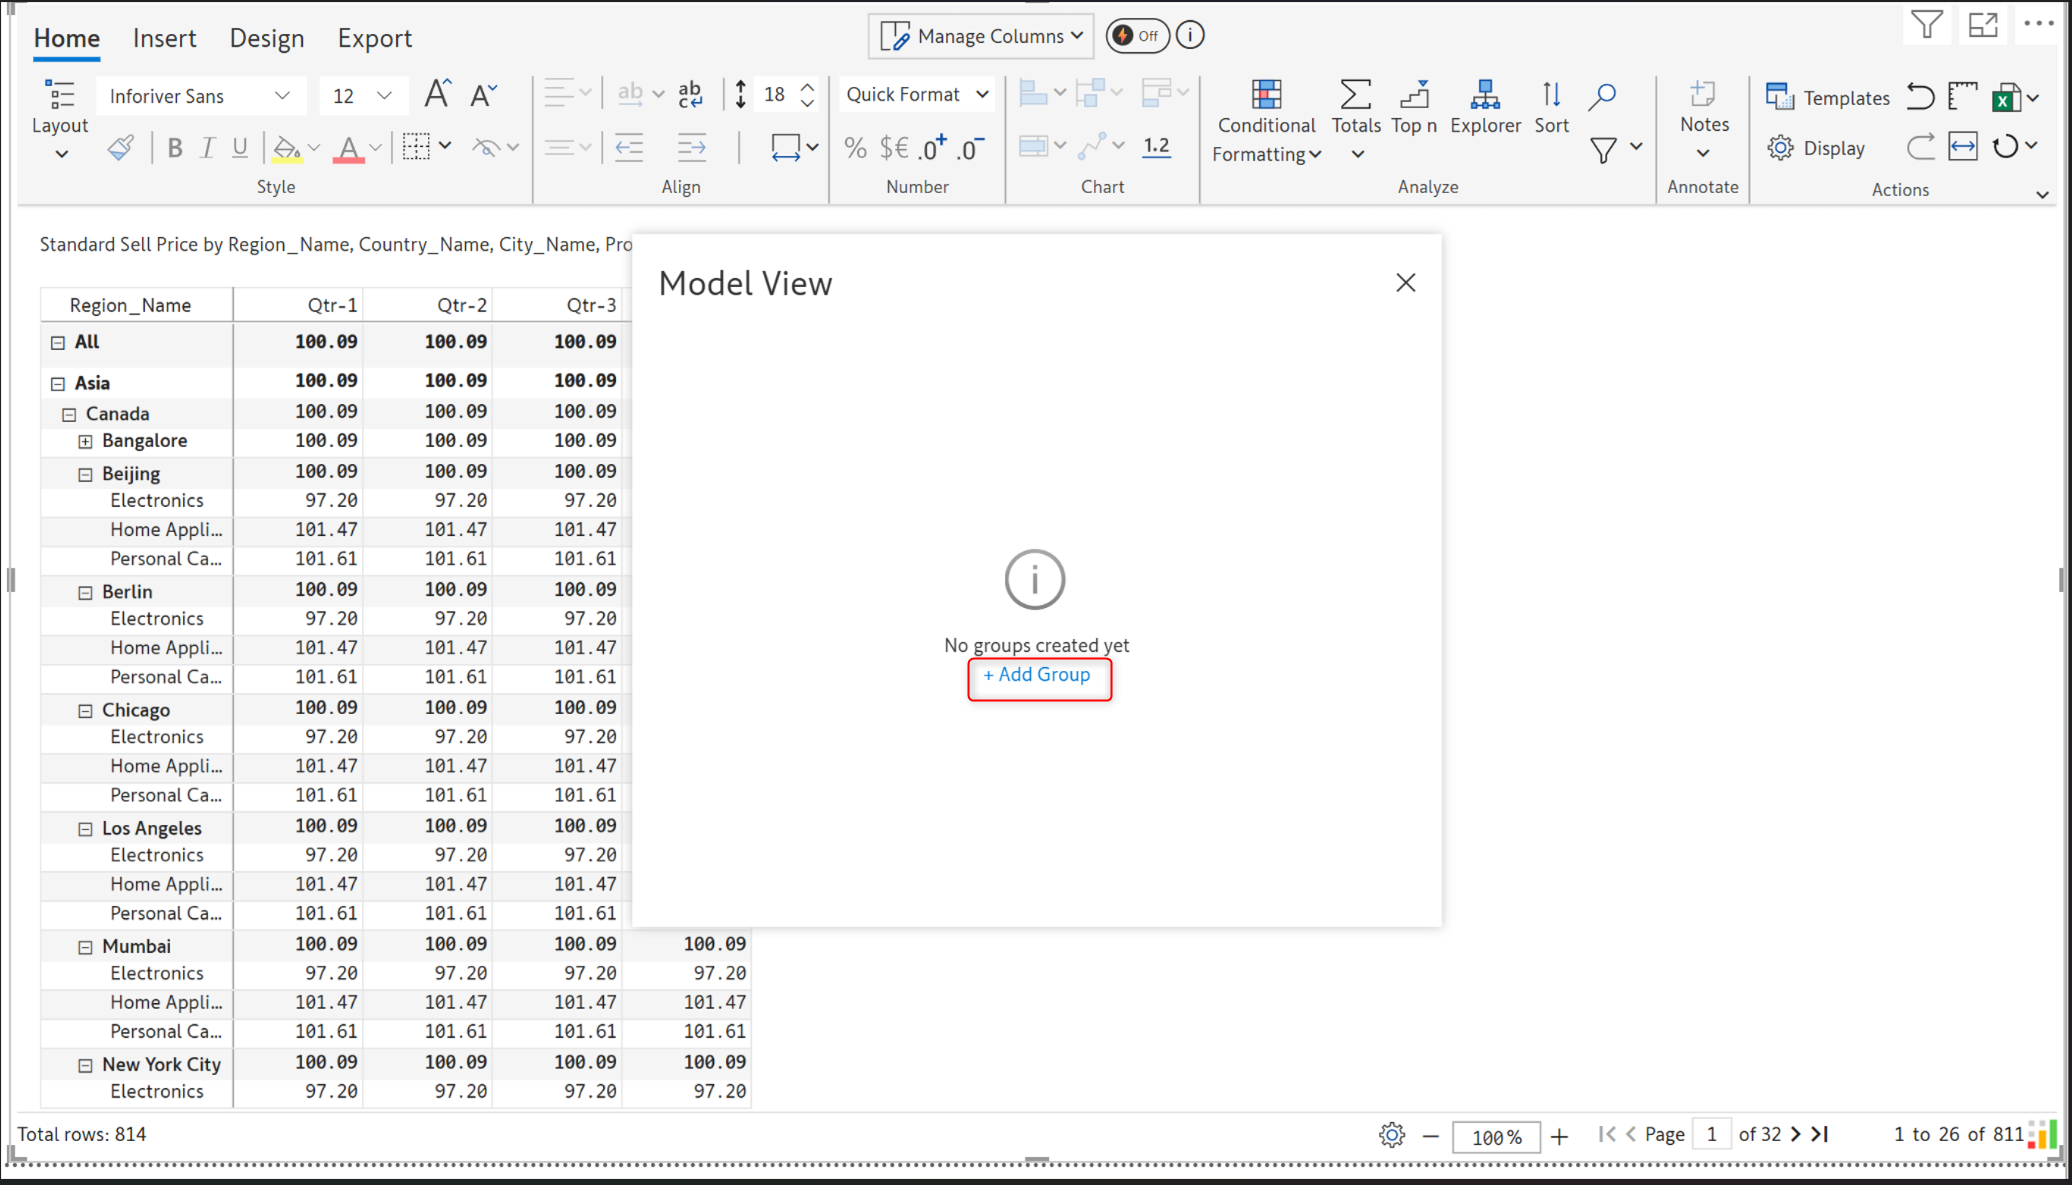
In the Model view pop-up, click on Add Group.
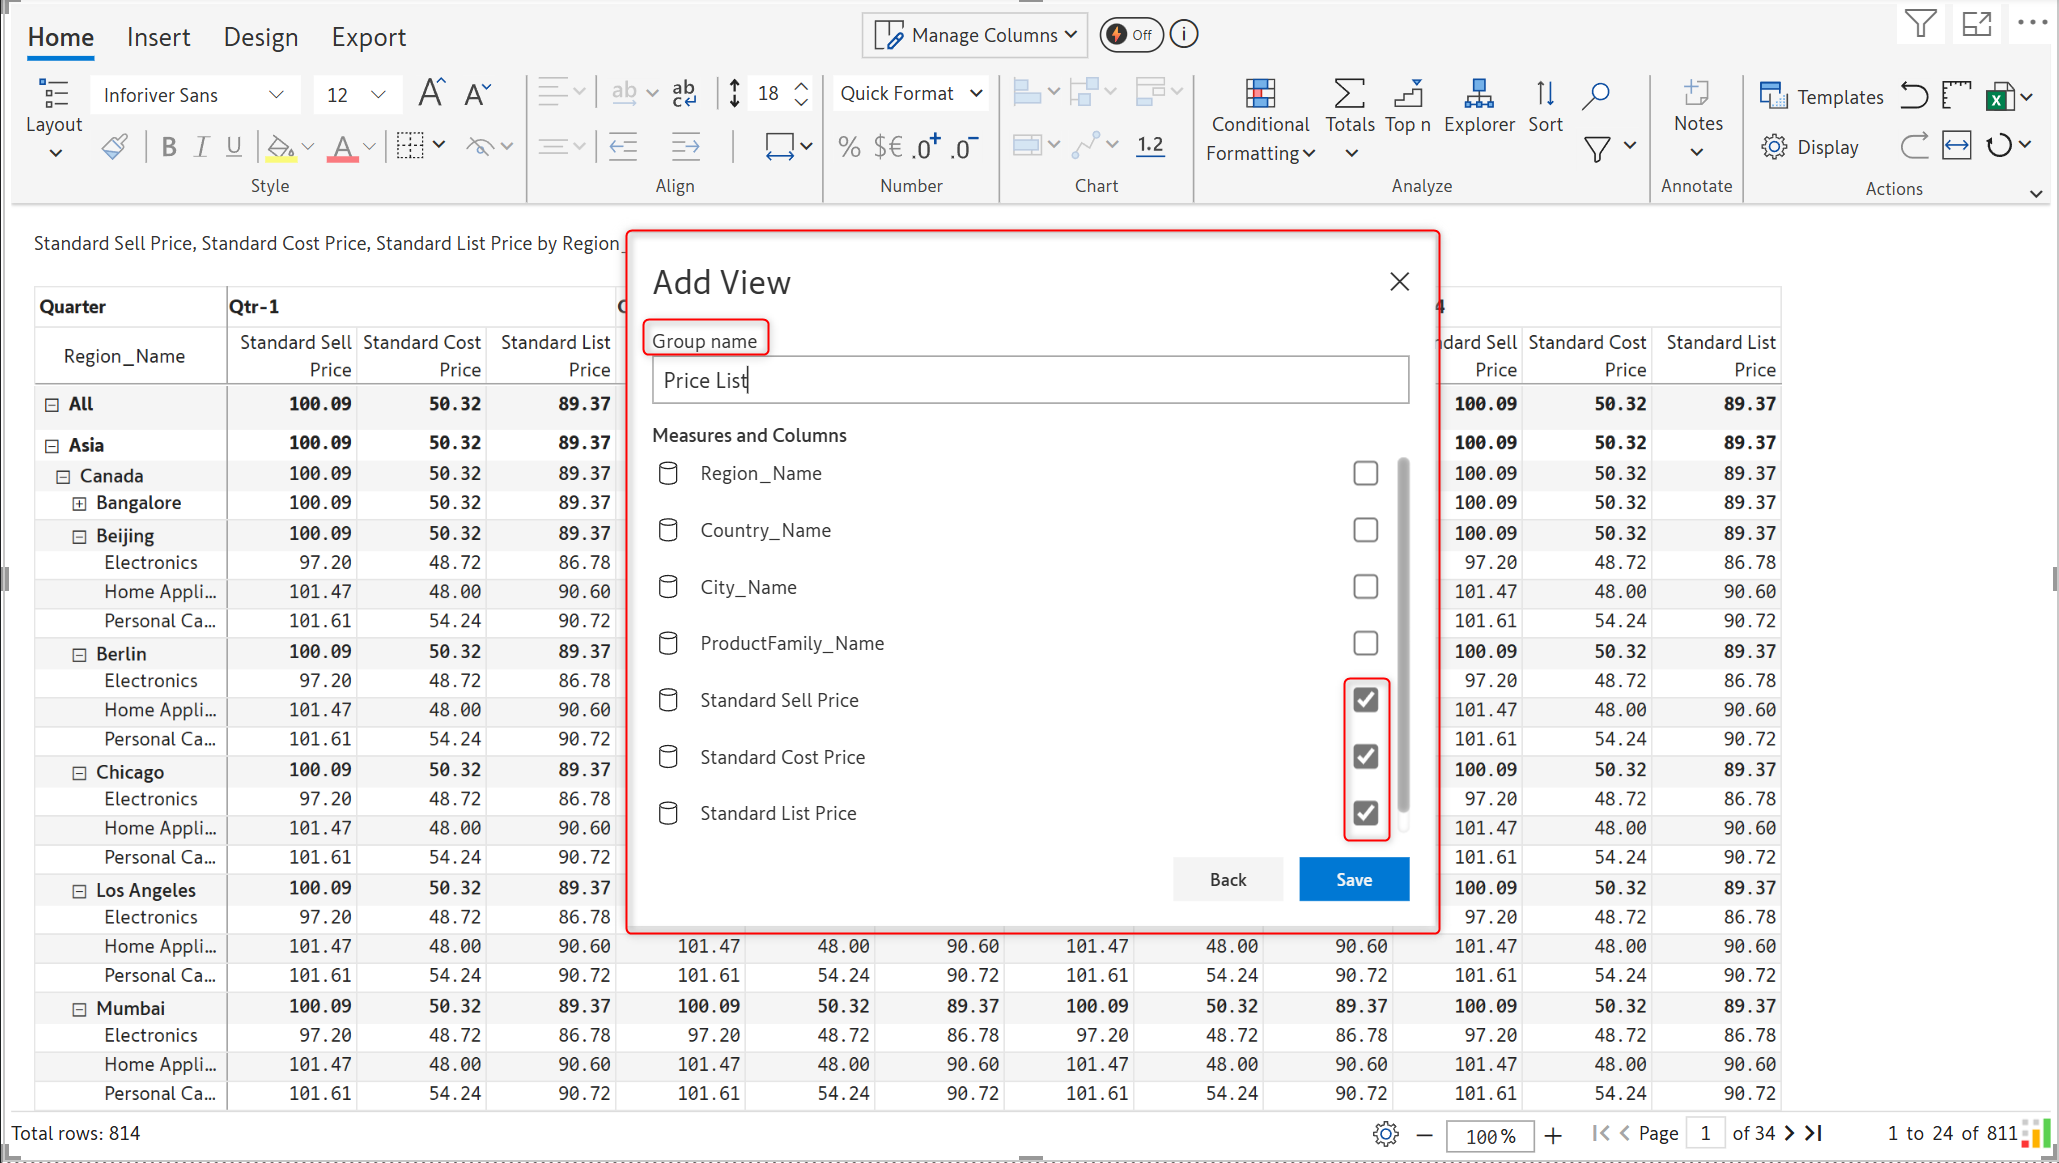
In the ‘Add View’ pop-up, enter the Group name and select the measures to be grouped, and click Save.
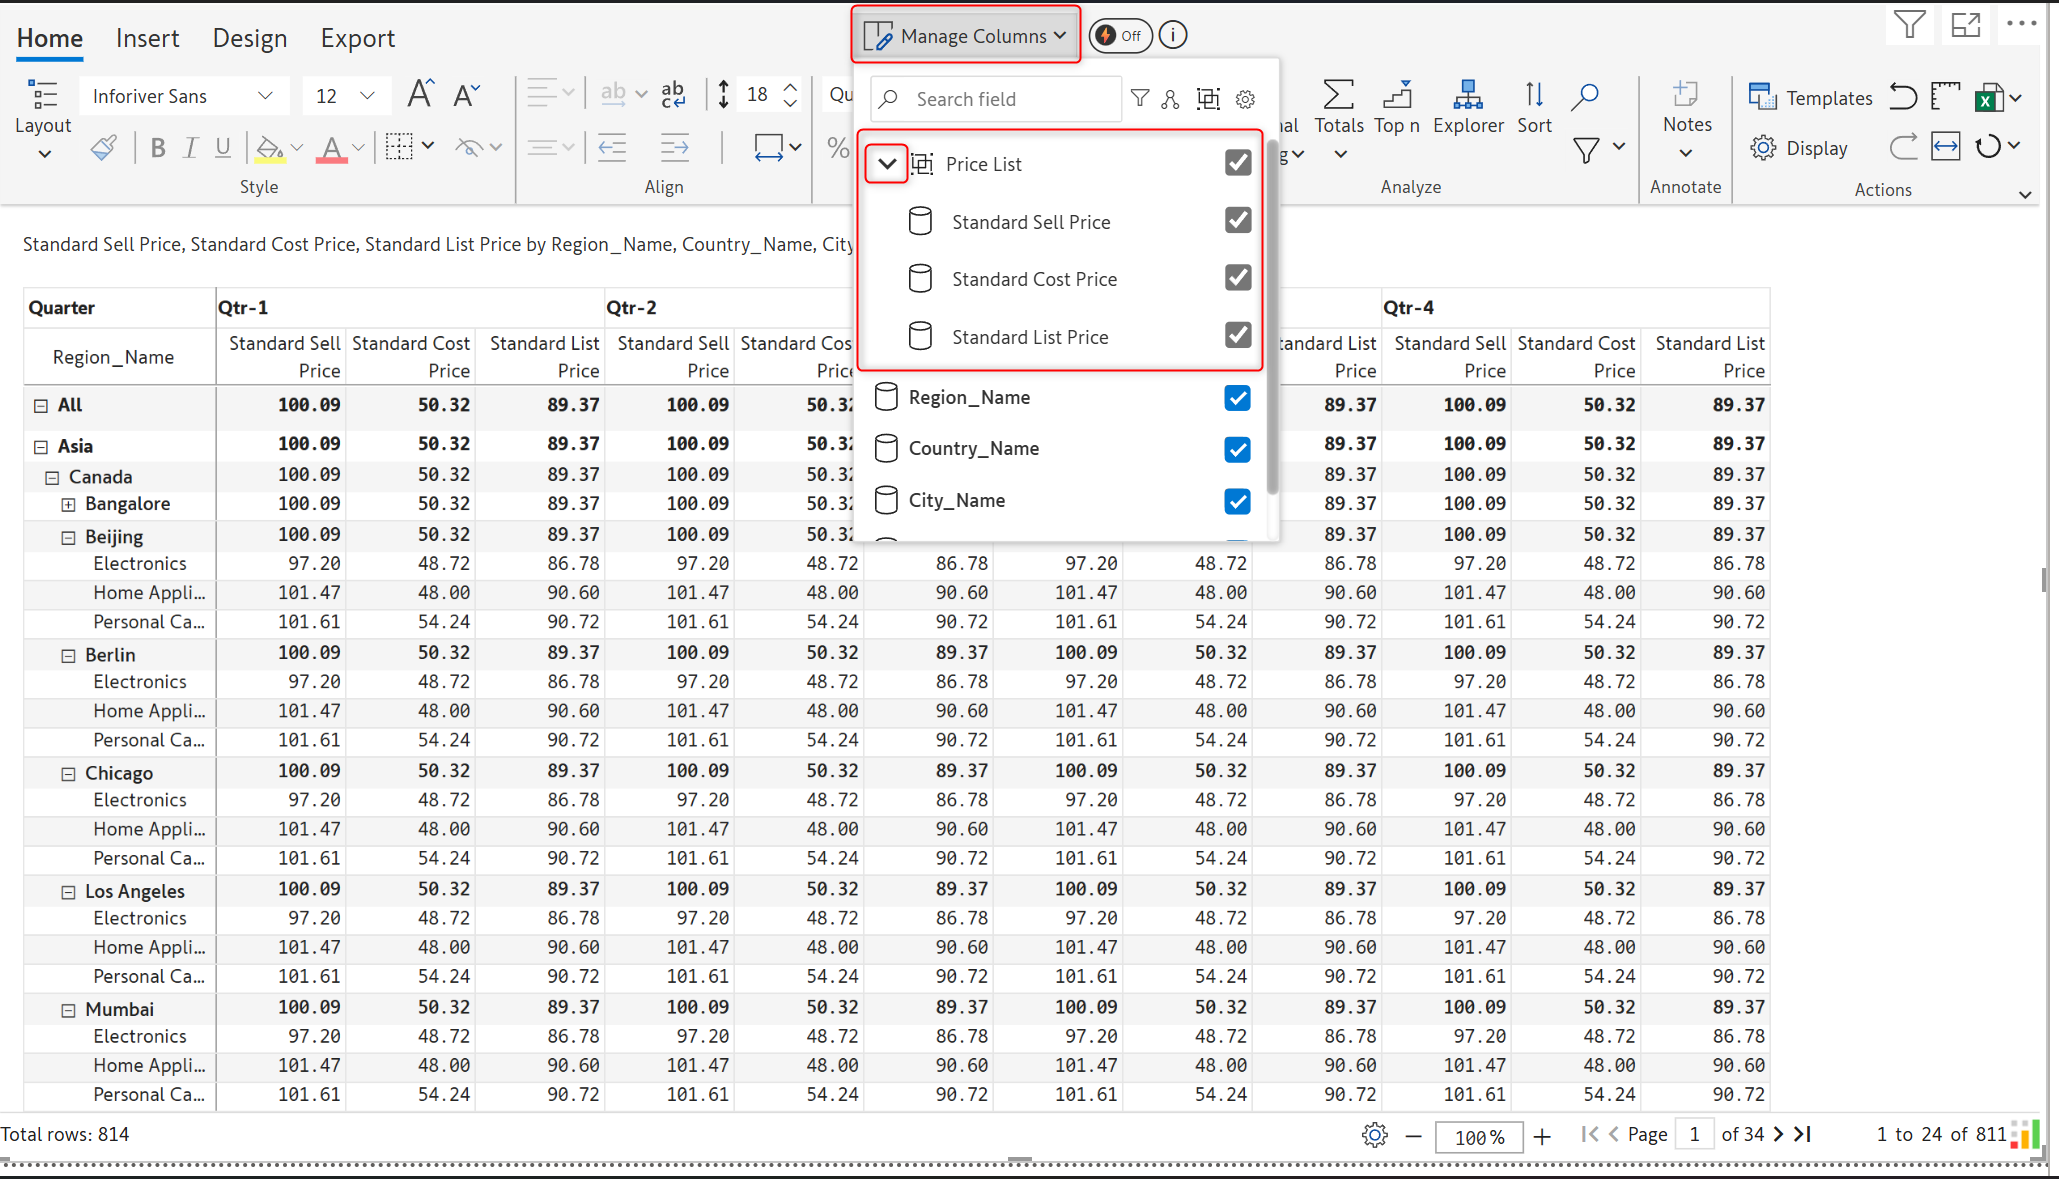
You can now see the columns grouped under the group name under Manage columns. Expand the group name to view the measures within.
In the image below, Price List is the group that contains the measures: Standard Sell Price, Standard Cost Price, and Standard List Price.
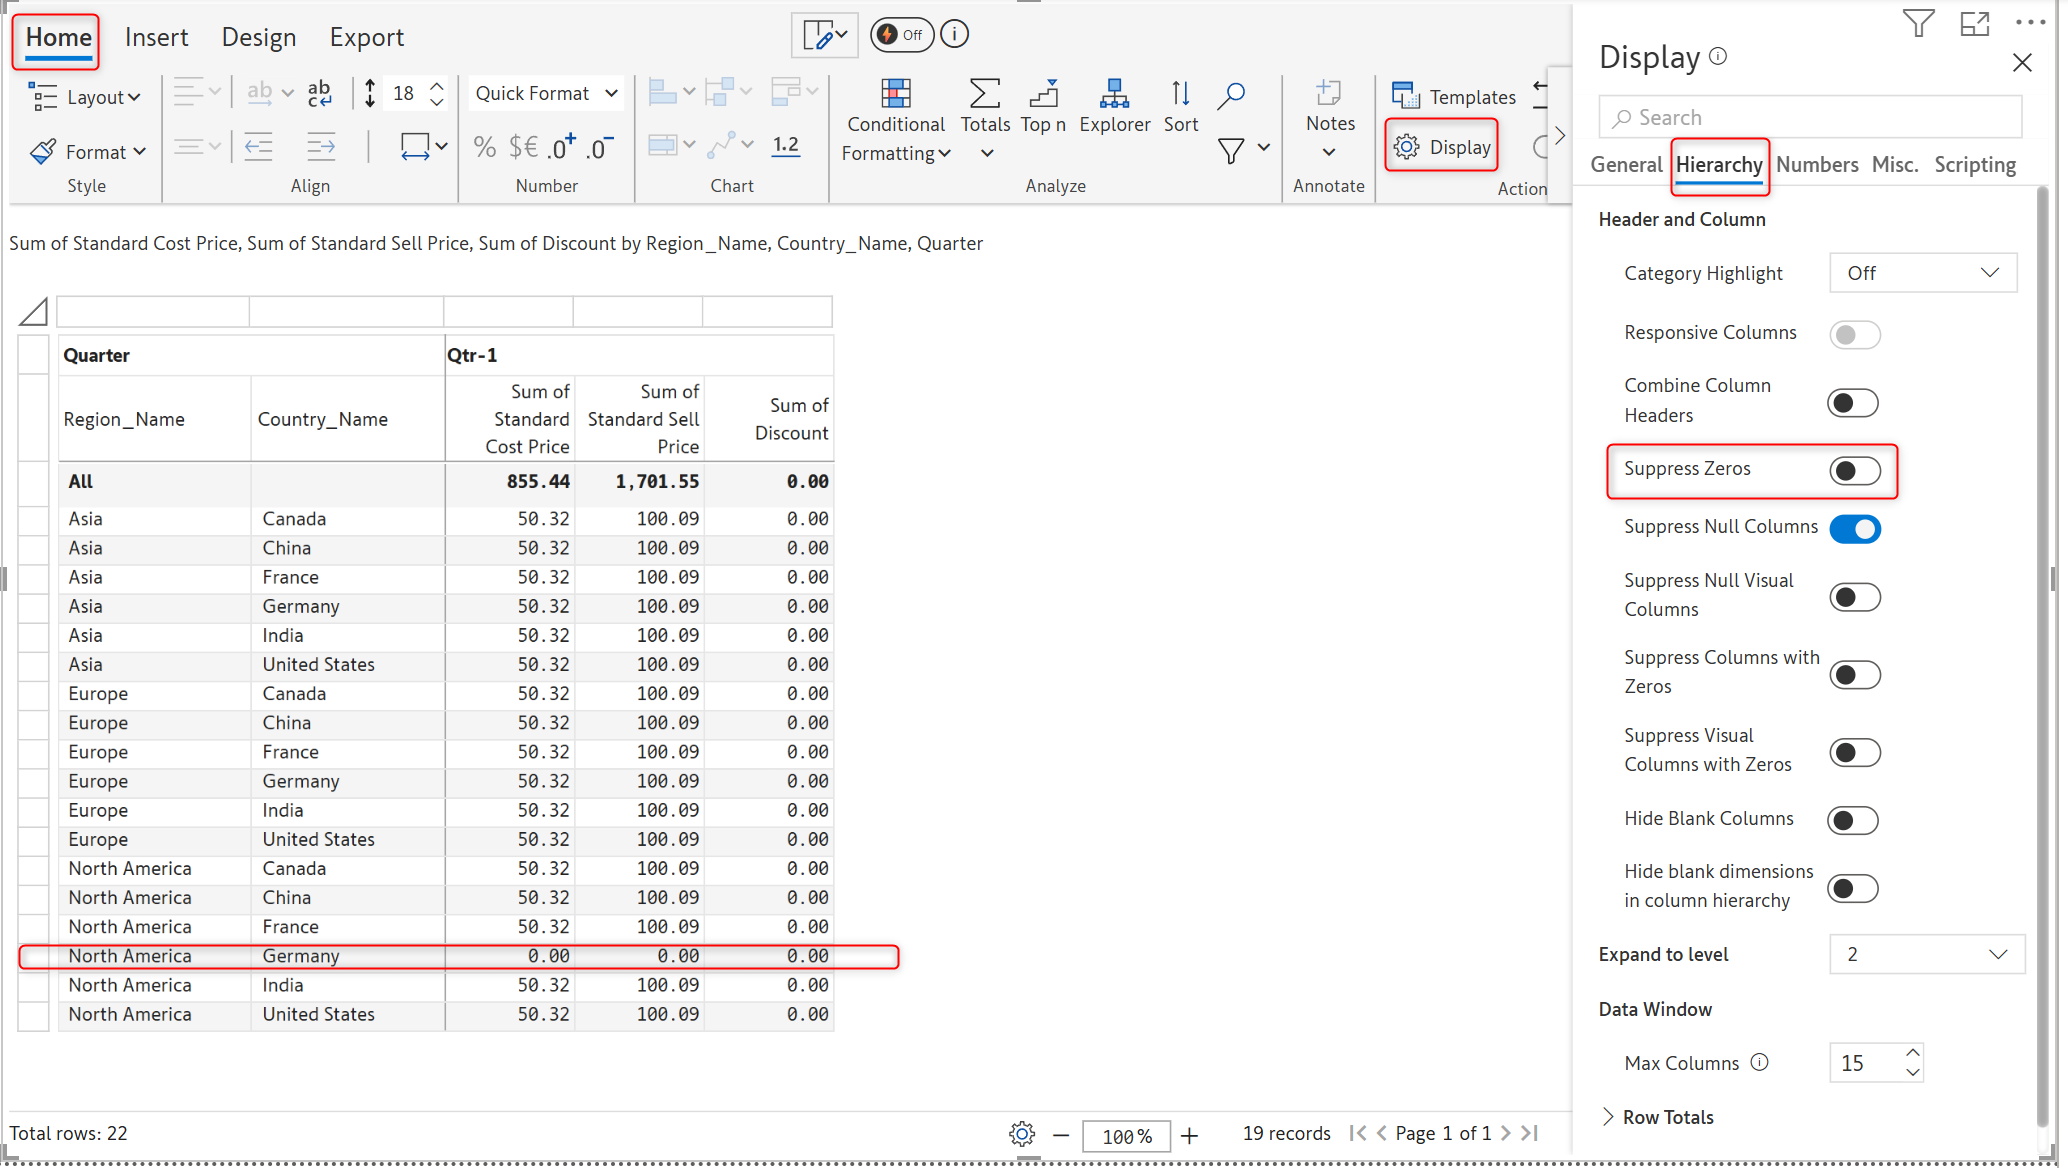
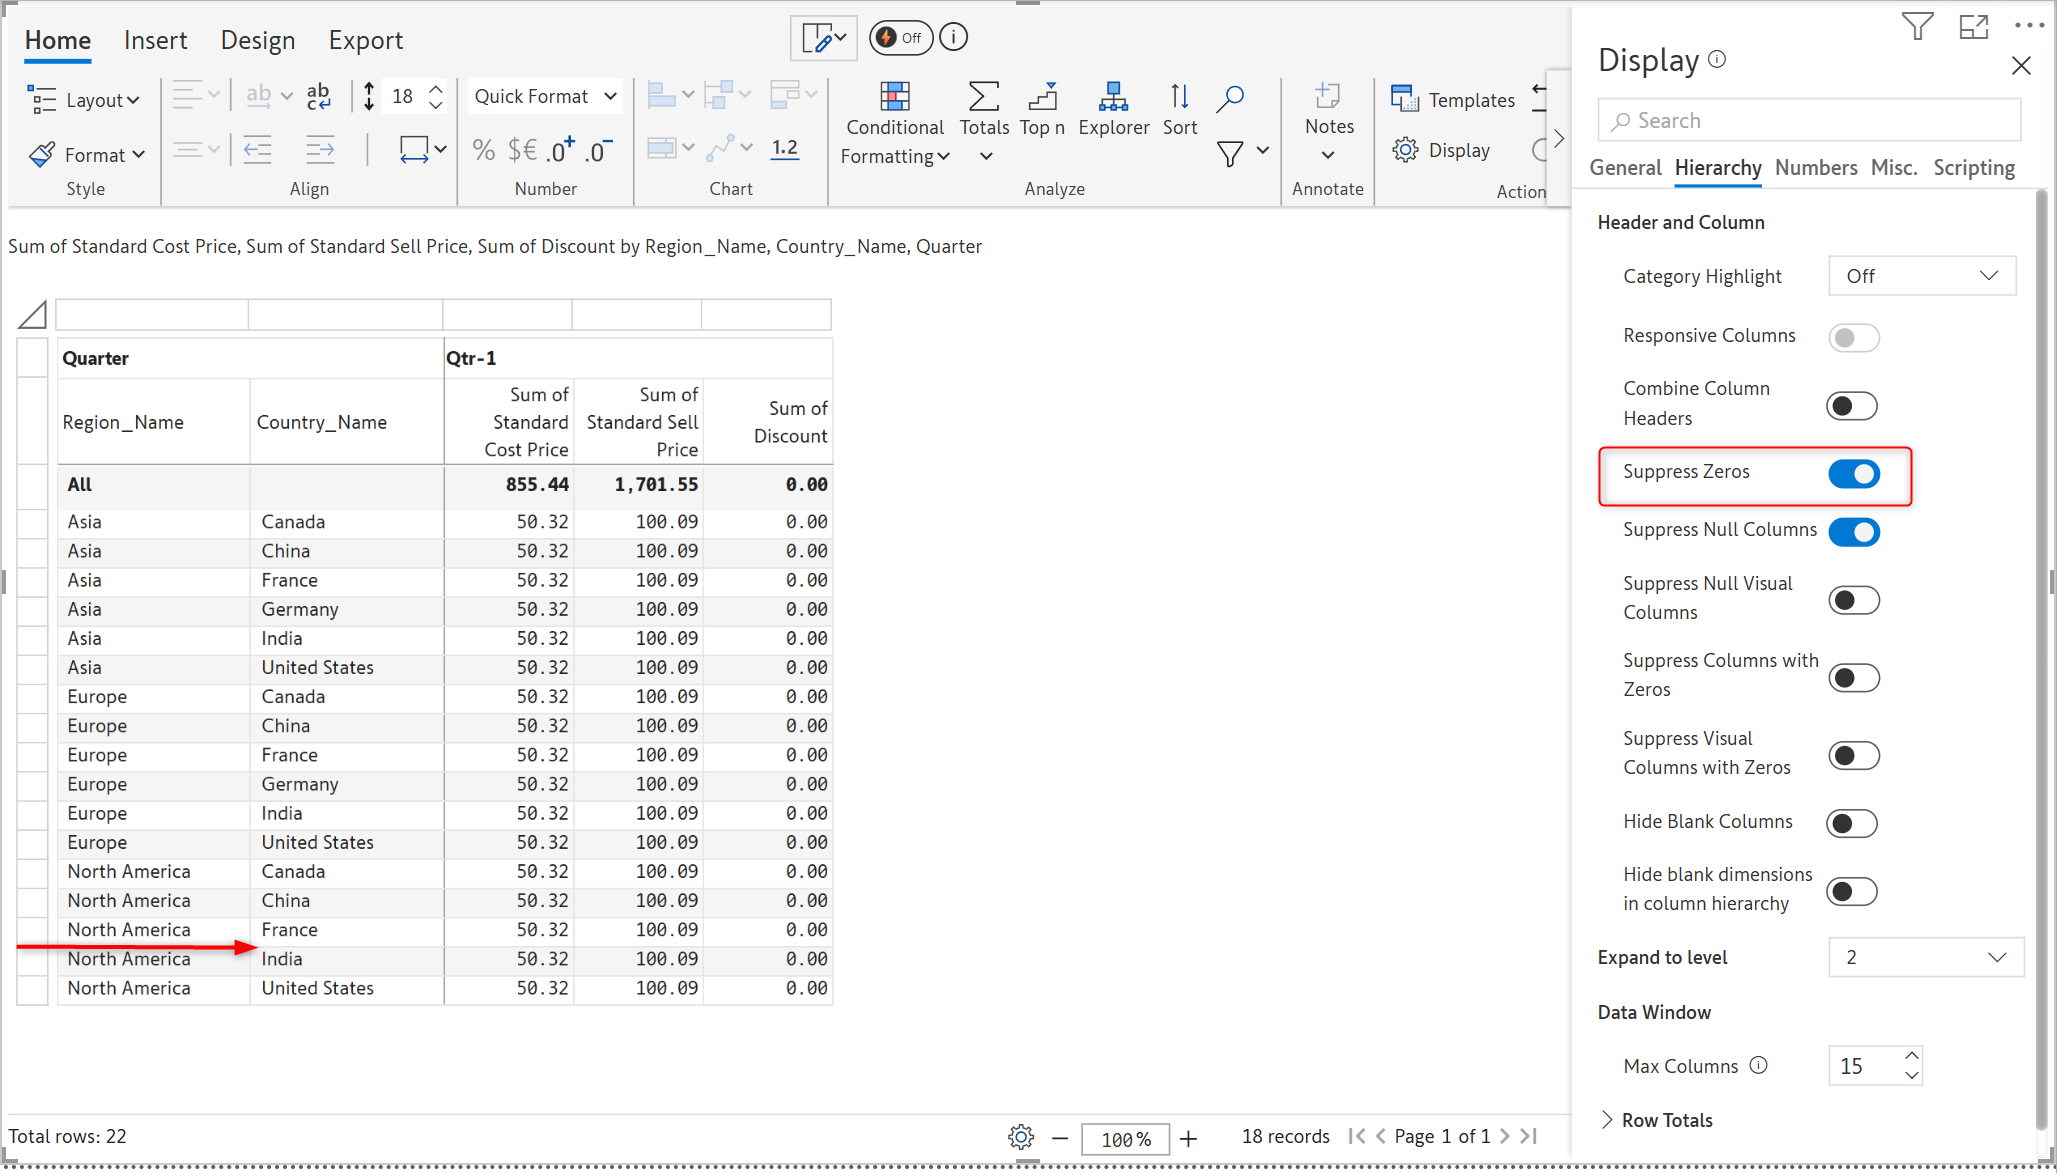
You can now suppress rows with zeros in the table layout as well. Suppression applies only when all columns for a row are zeroes.
To do this, go to Home > Display > Hierarchy. Enable the ‘Suppress Zeros’ toggle to suppress the rows with zeros.
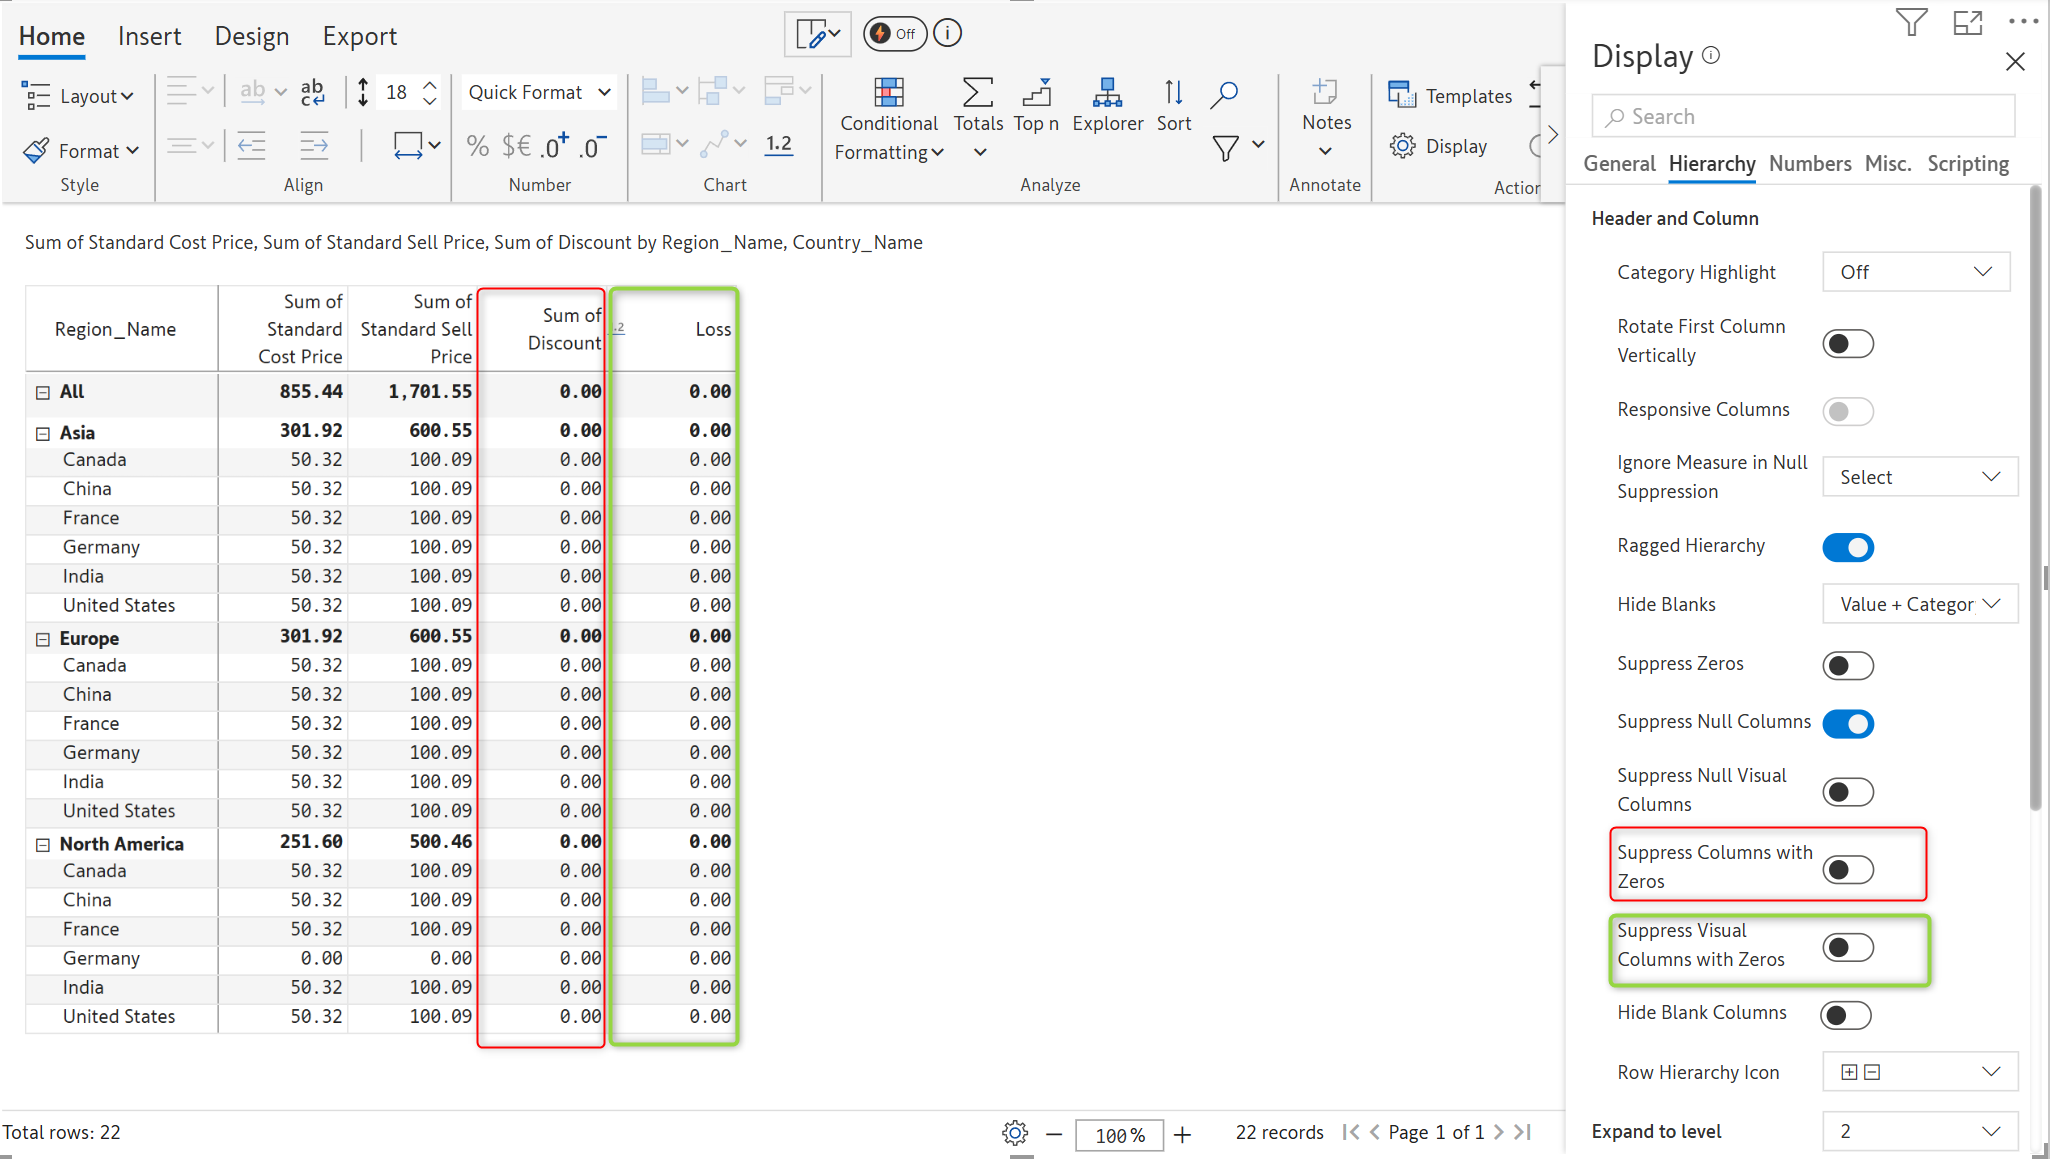
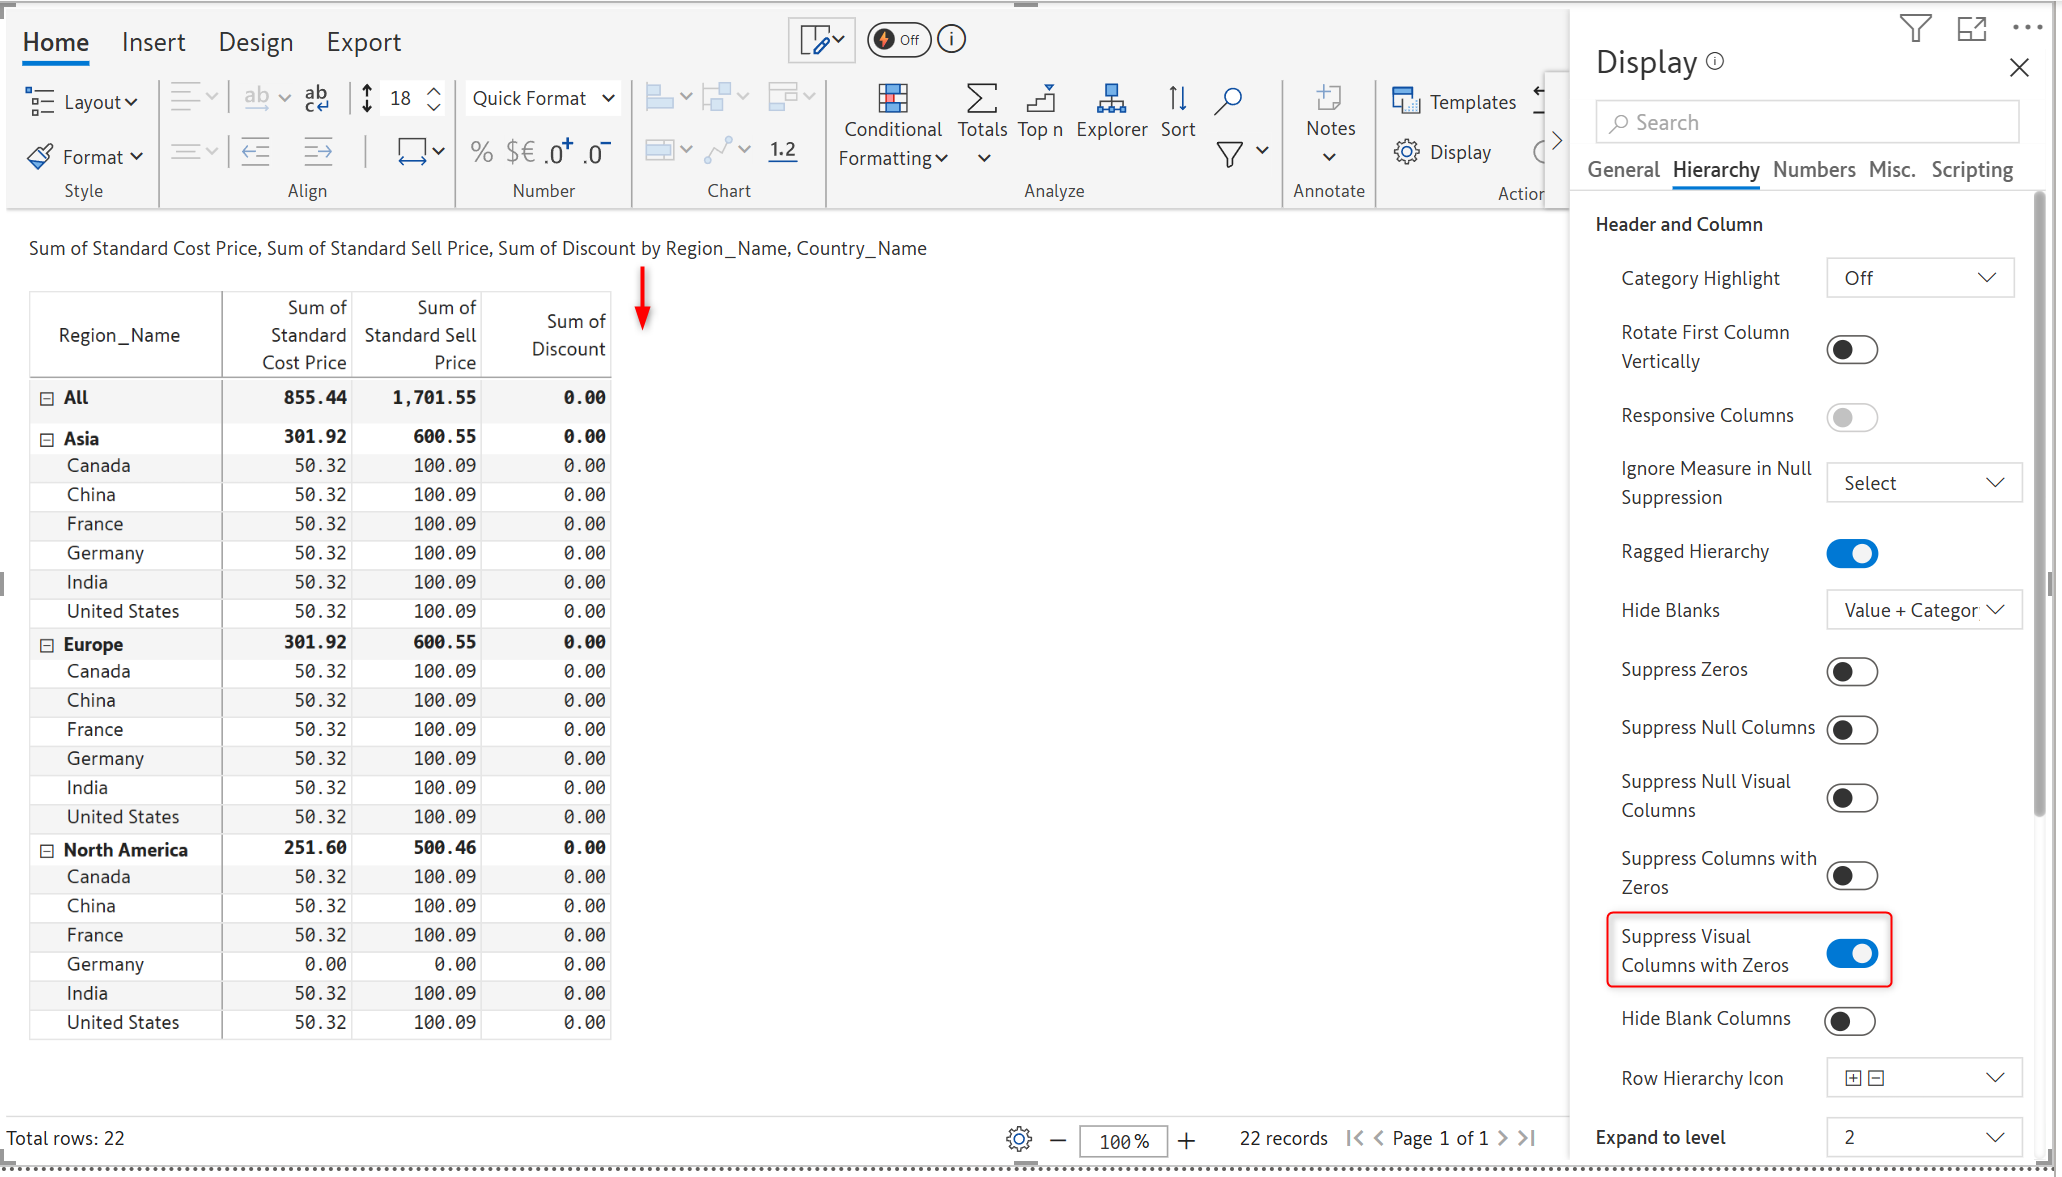
You can now suppress both native measures and visual columns with zeros.
In the image below, the Sum of Discount is a native column with zero values and Loss is a visual column with values as zero, which are visible as the ‘Suppress Columns with Zeros’ and ‘Suppress Visual Columns with Zeros’ toggle buttons are disabled.
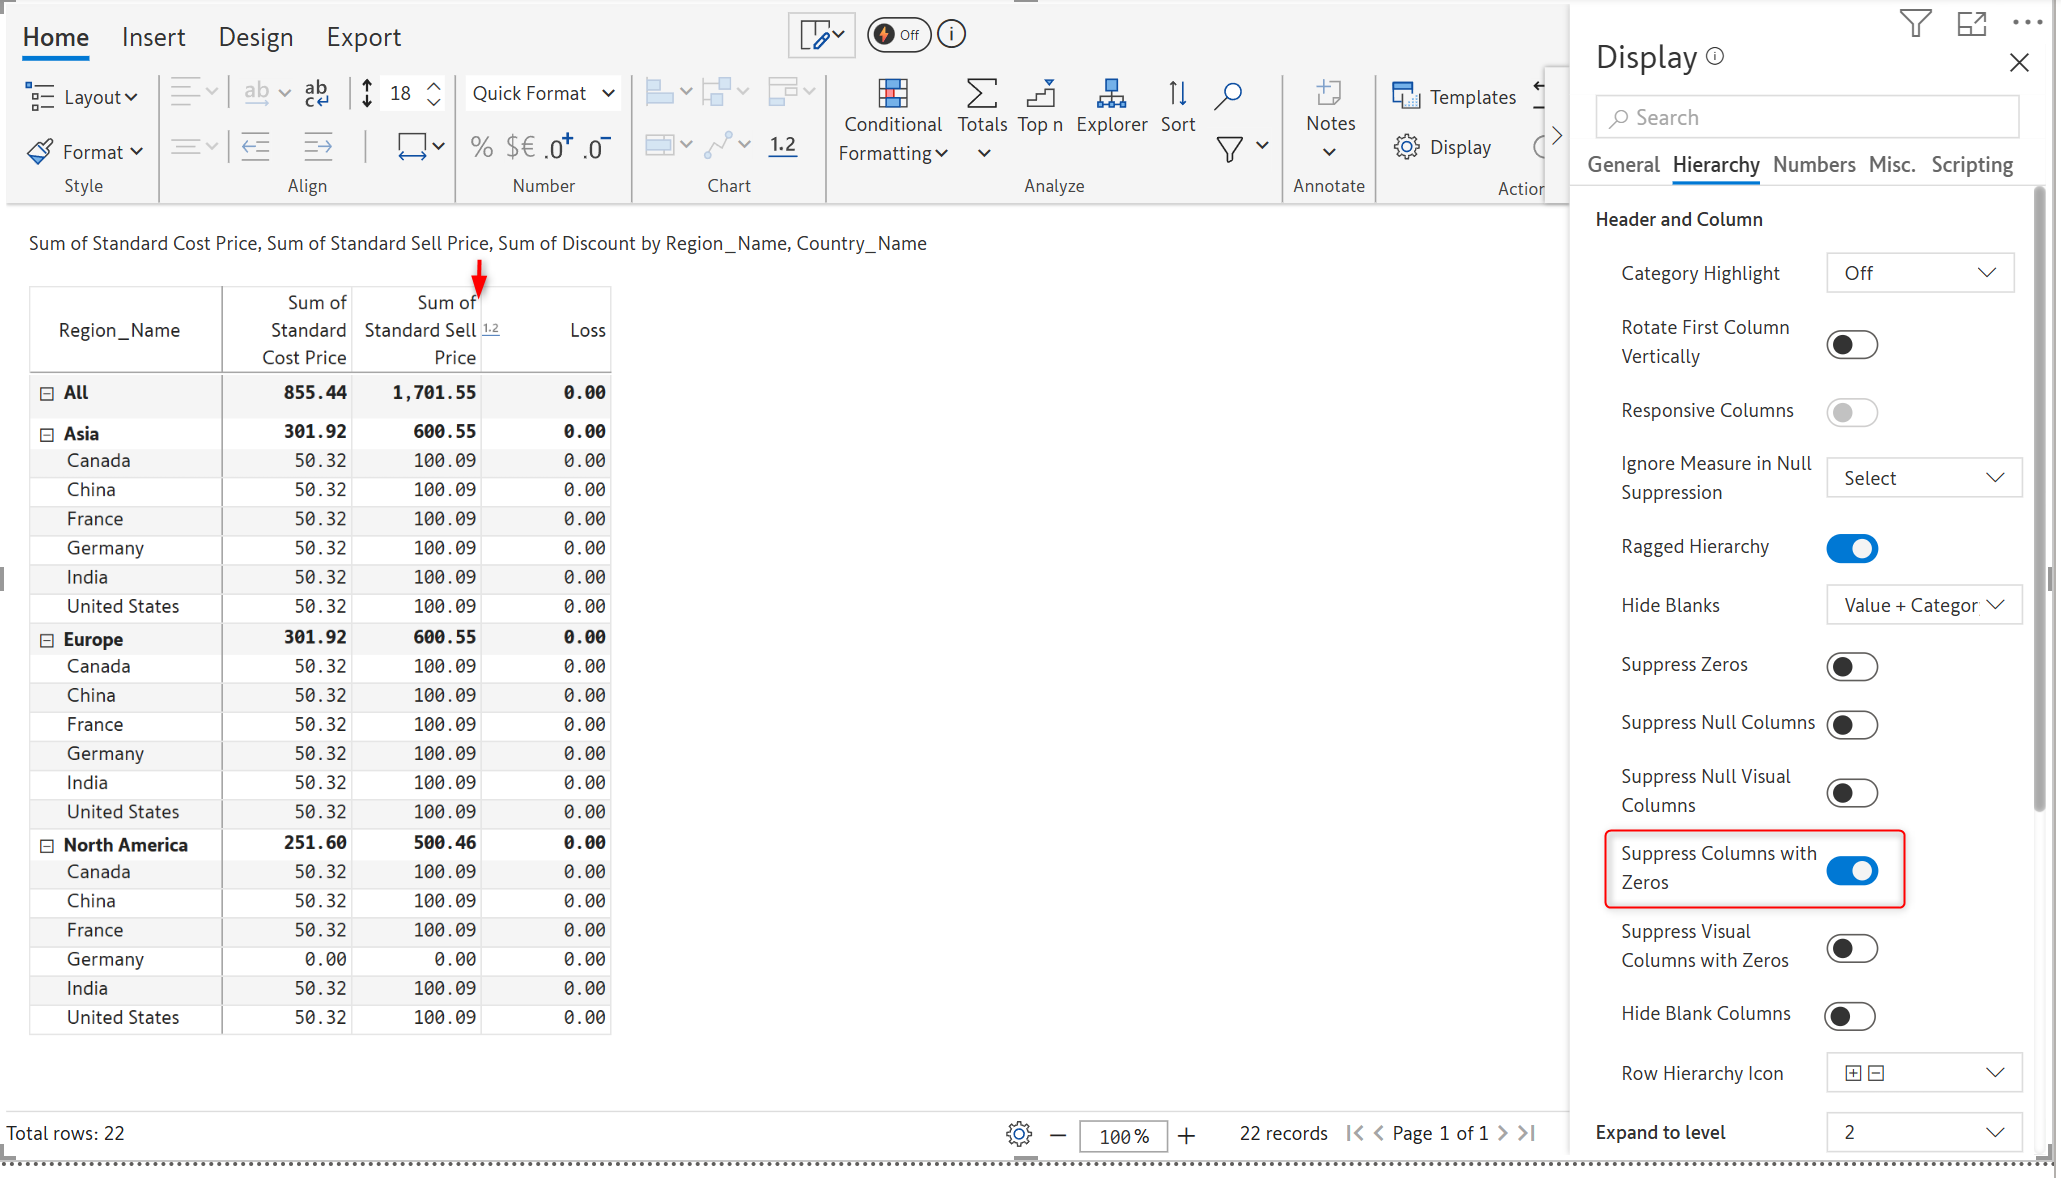
In the image below, the native measure is suppressed:
In the image below, the visual column Loss is suppressed:
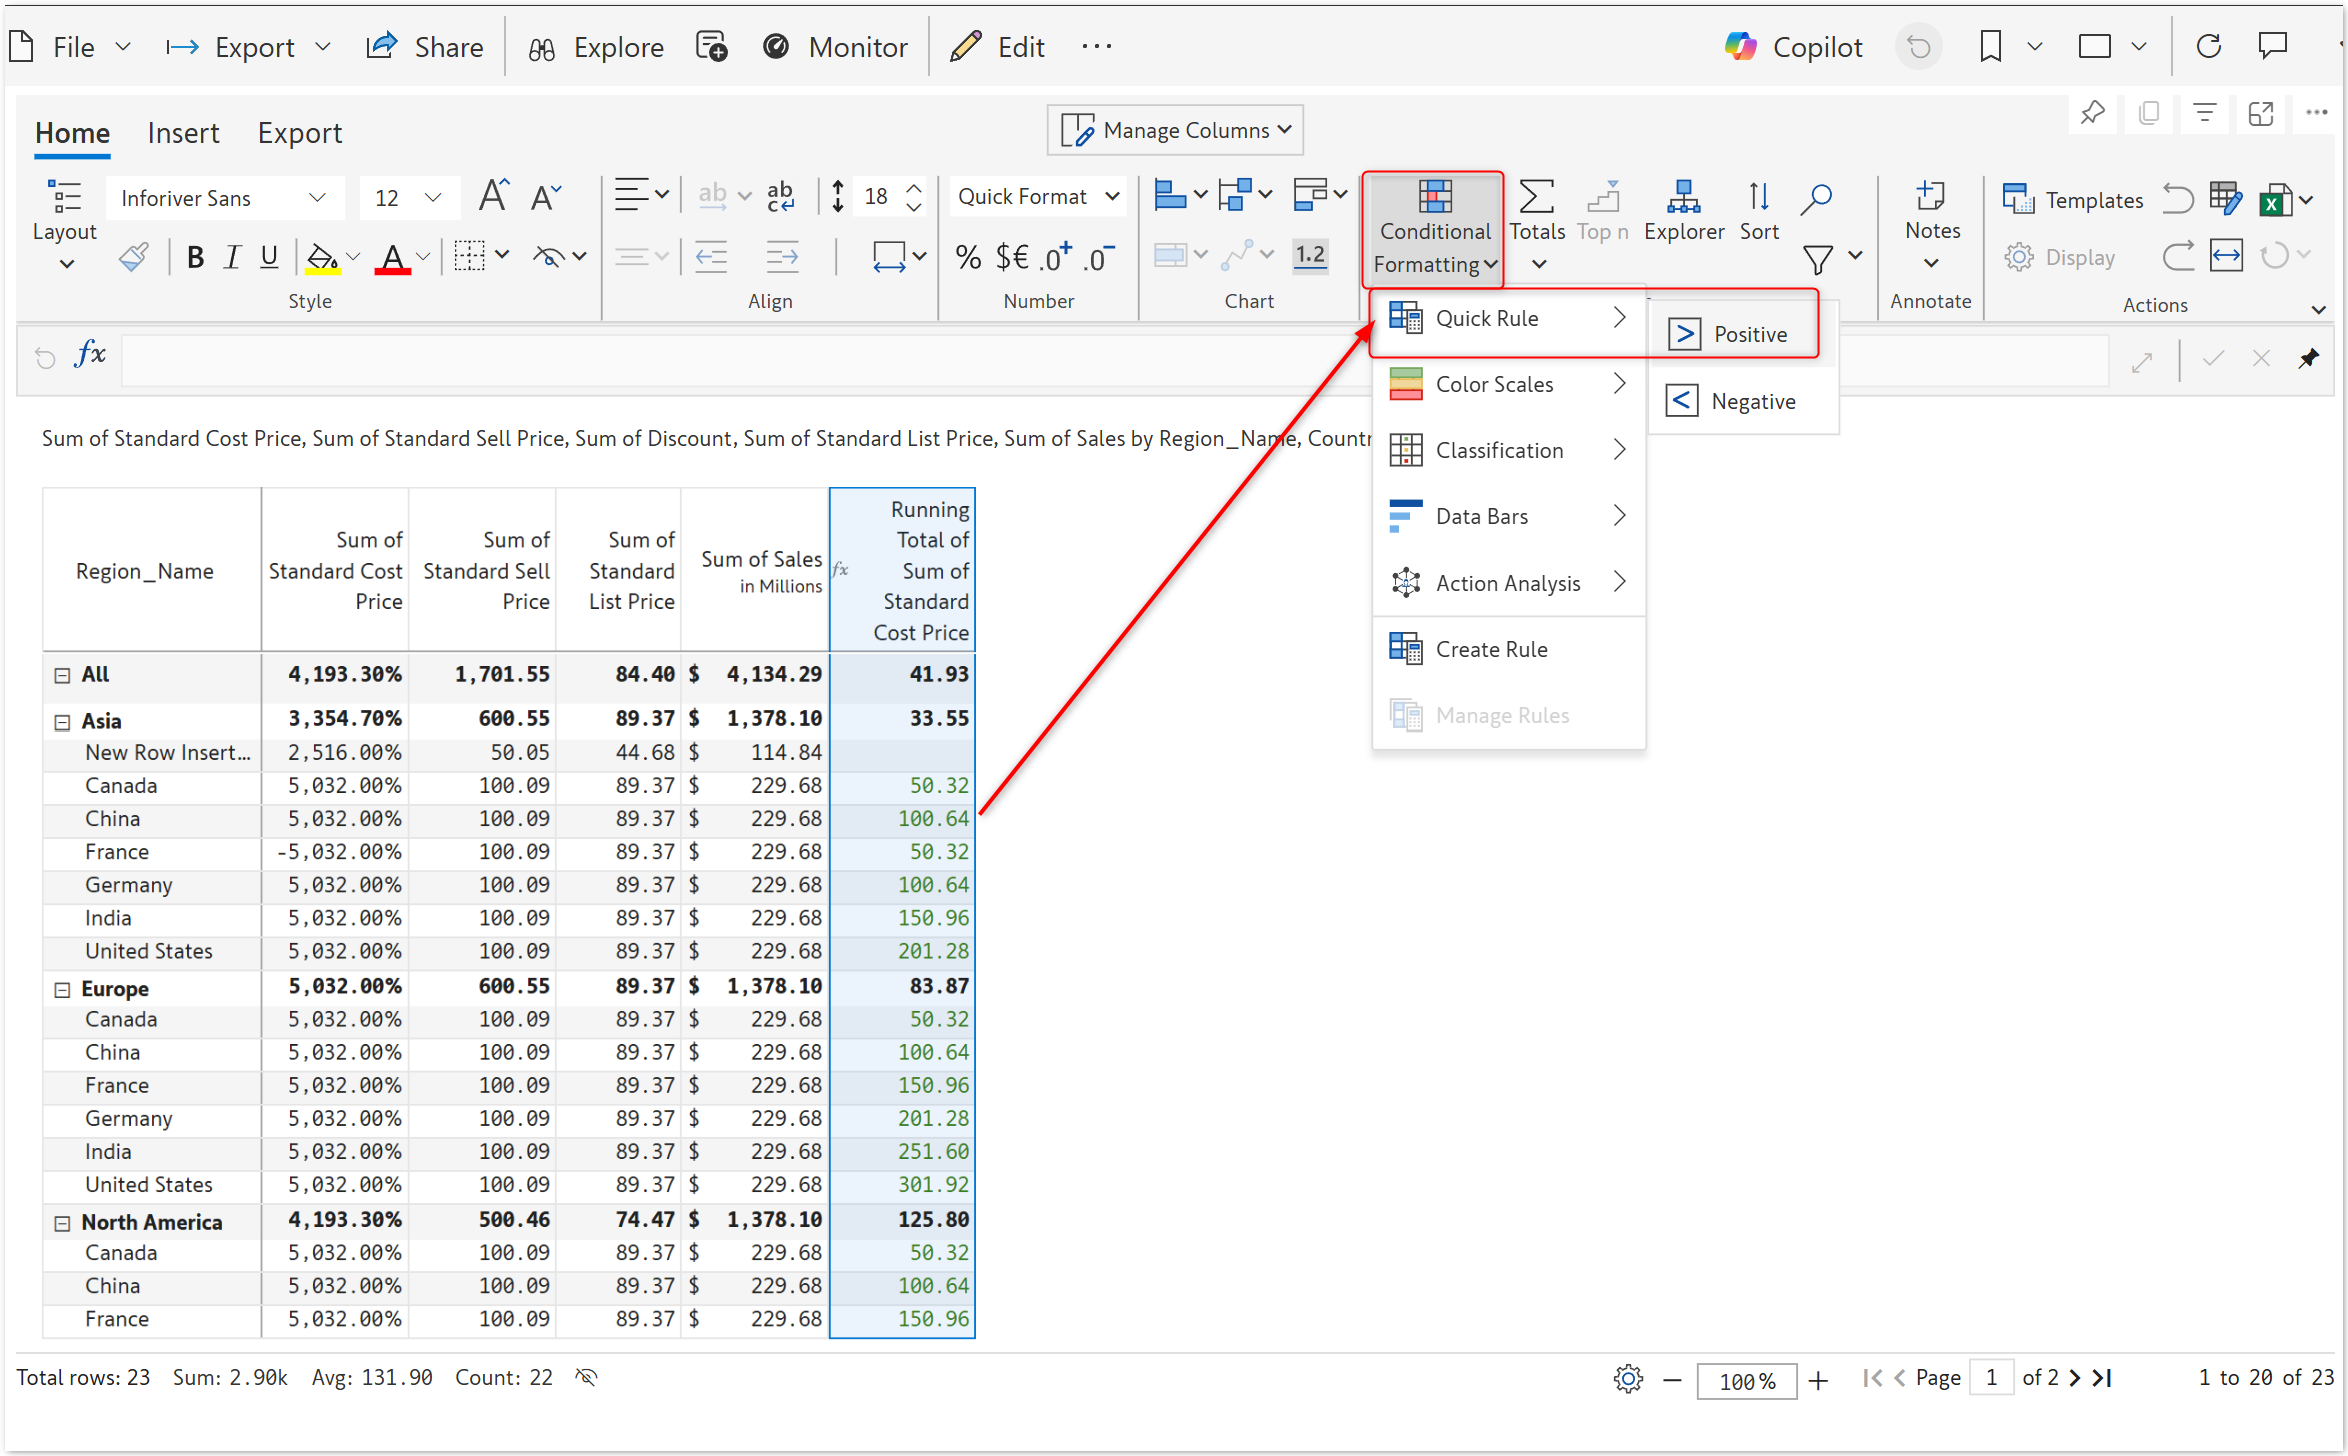
You can now give access to report users to insert and format the rows, columns, and cells in reading view.
Enable the Insert and Conditional Formatting toggle in the Allowed User Controls.
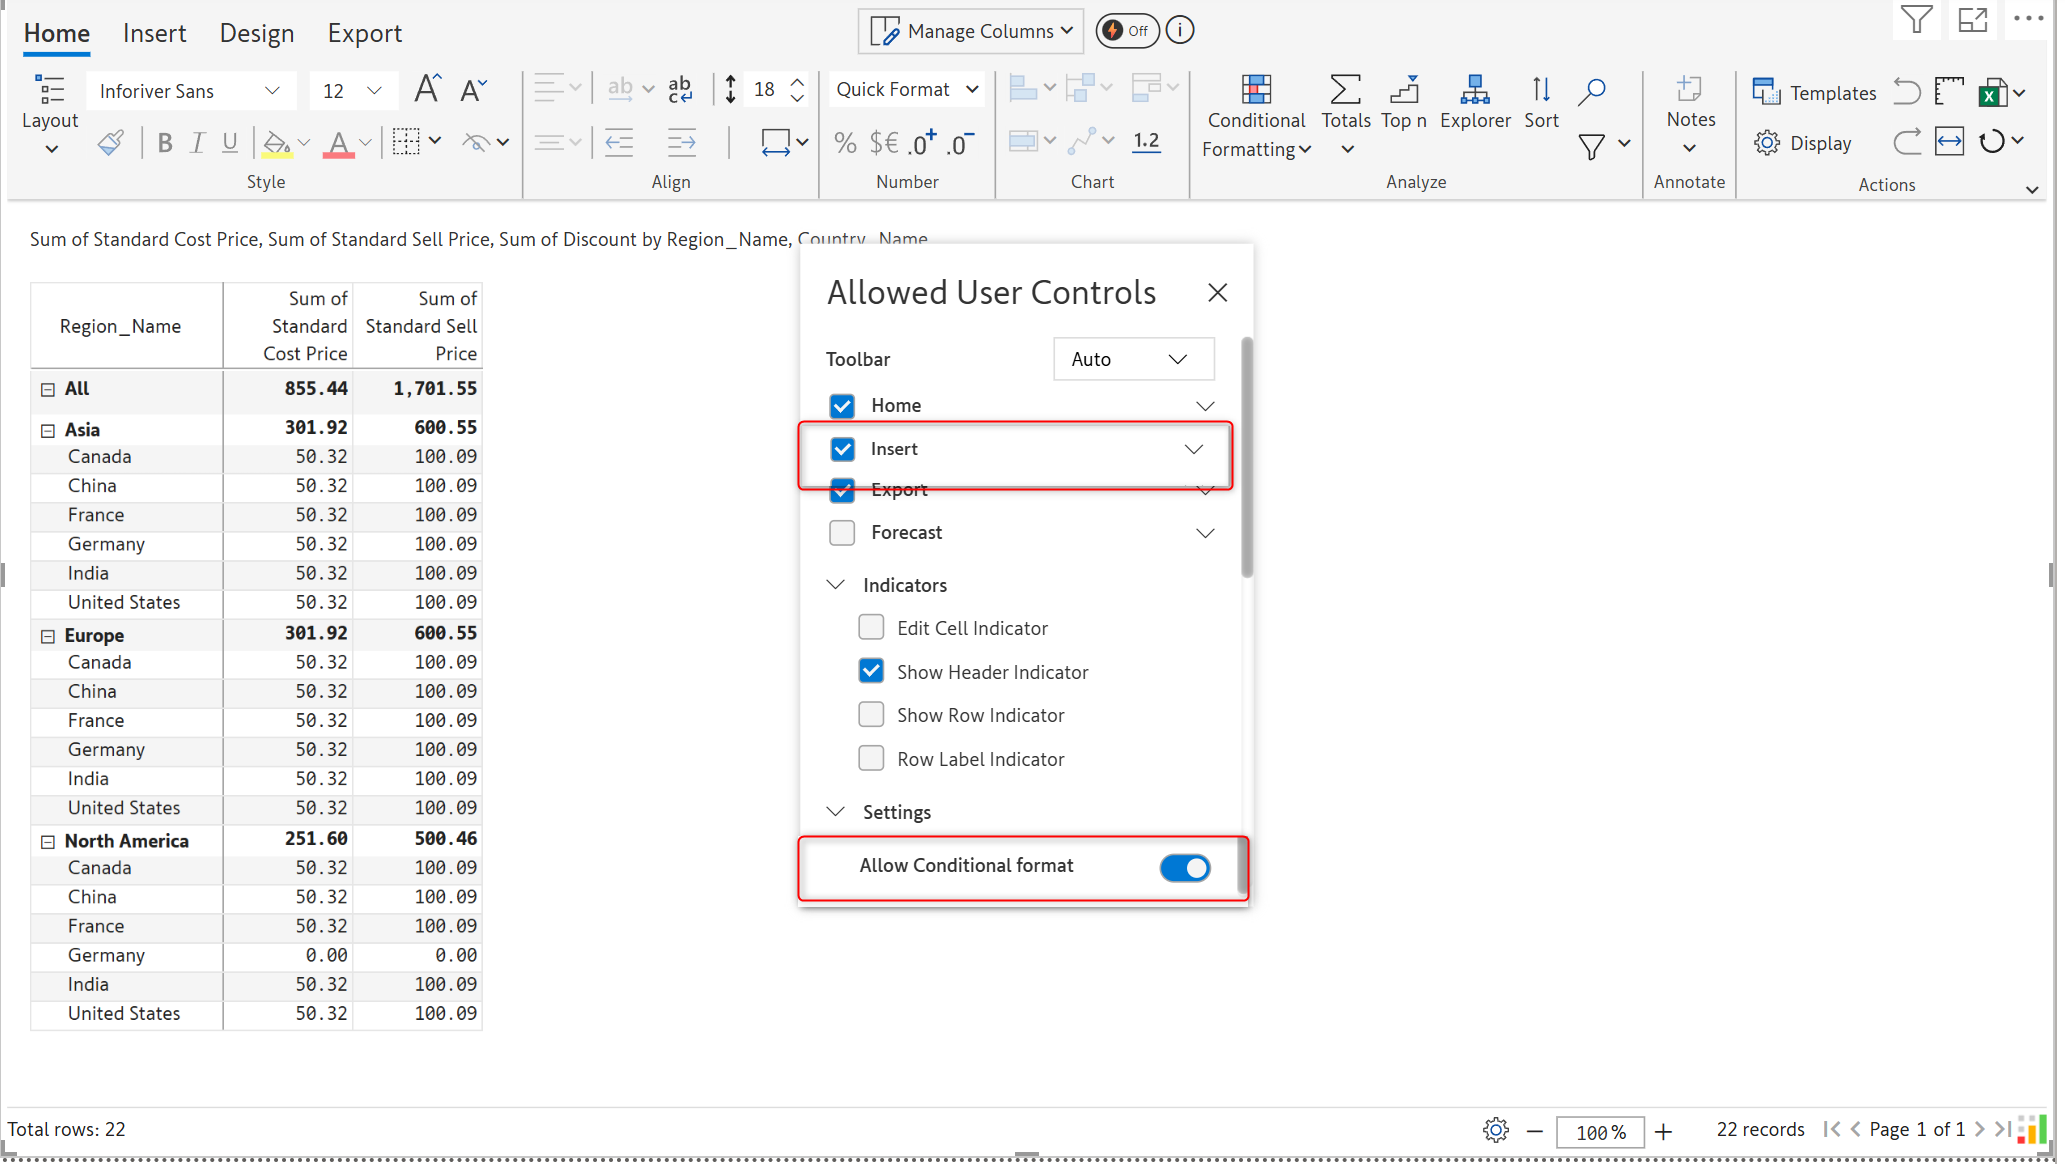
You can insert rows, columns, and invert them as well in the reading view. While these changes can be exported, they are not saved. When the page is refreshed or switched, these changes will not be saved in the backend.
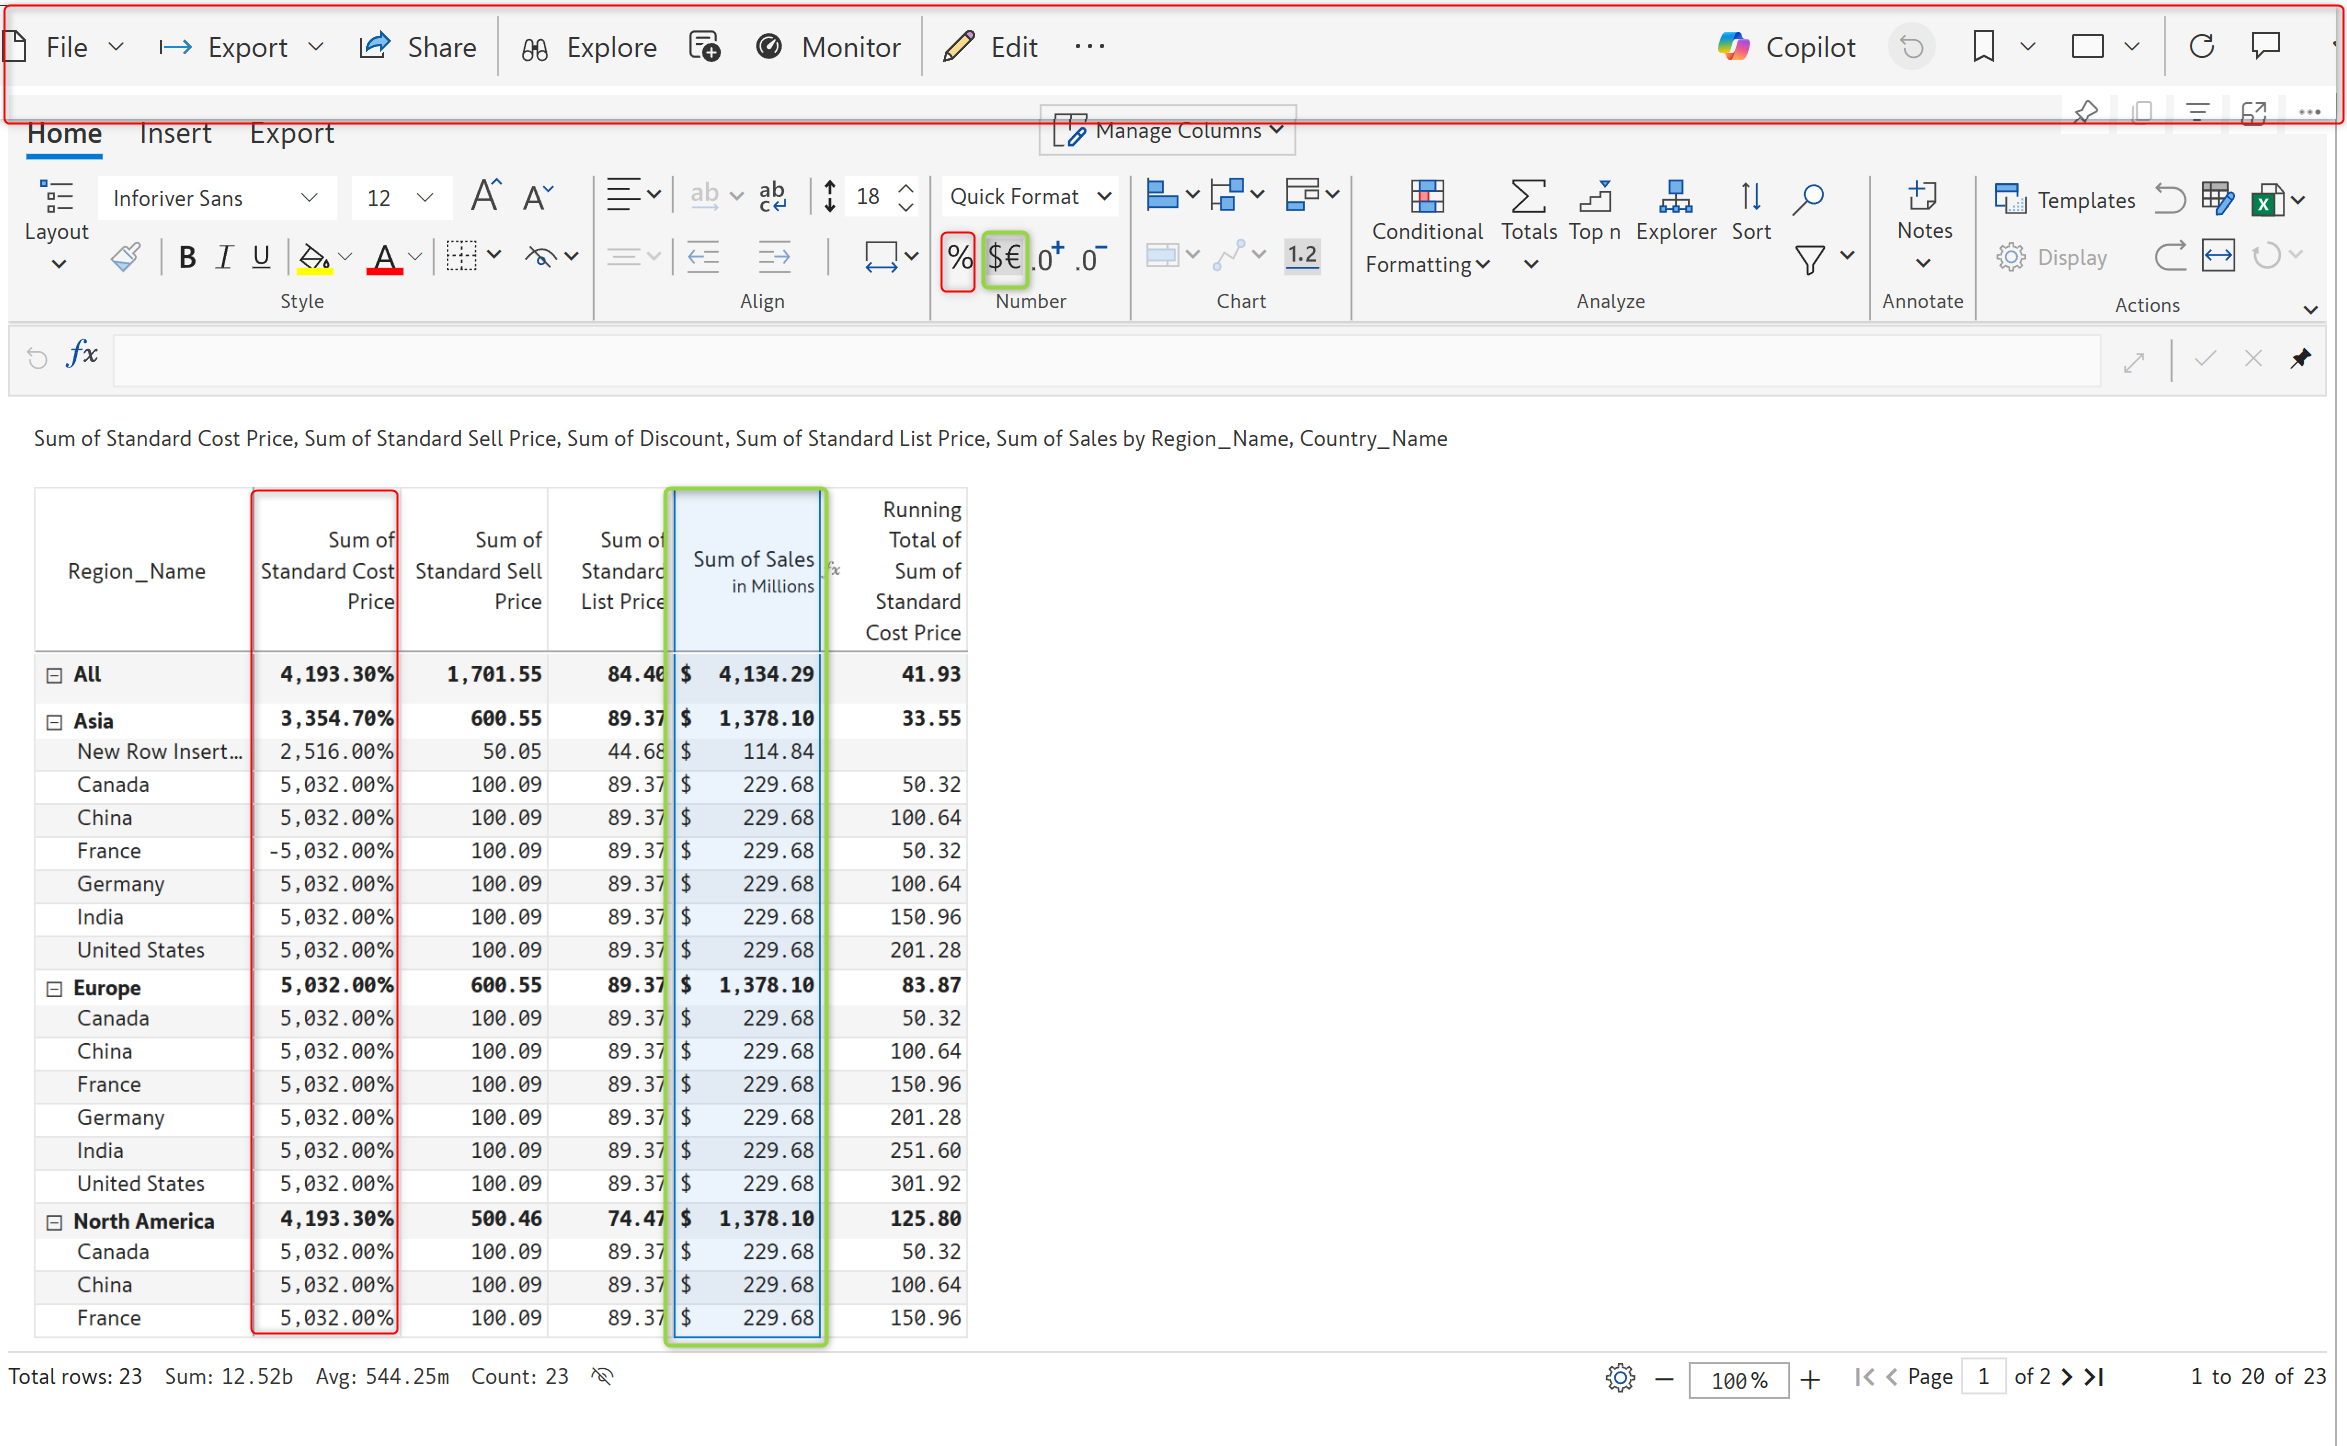
The image below shows the Conditional Formatting applied.
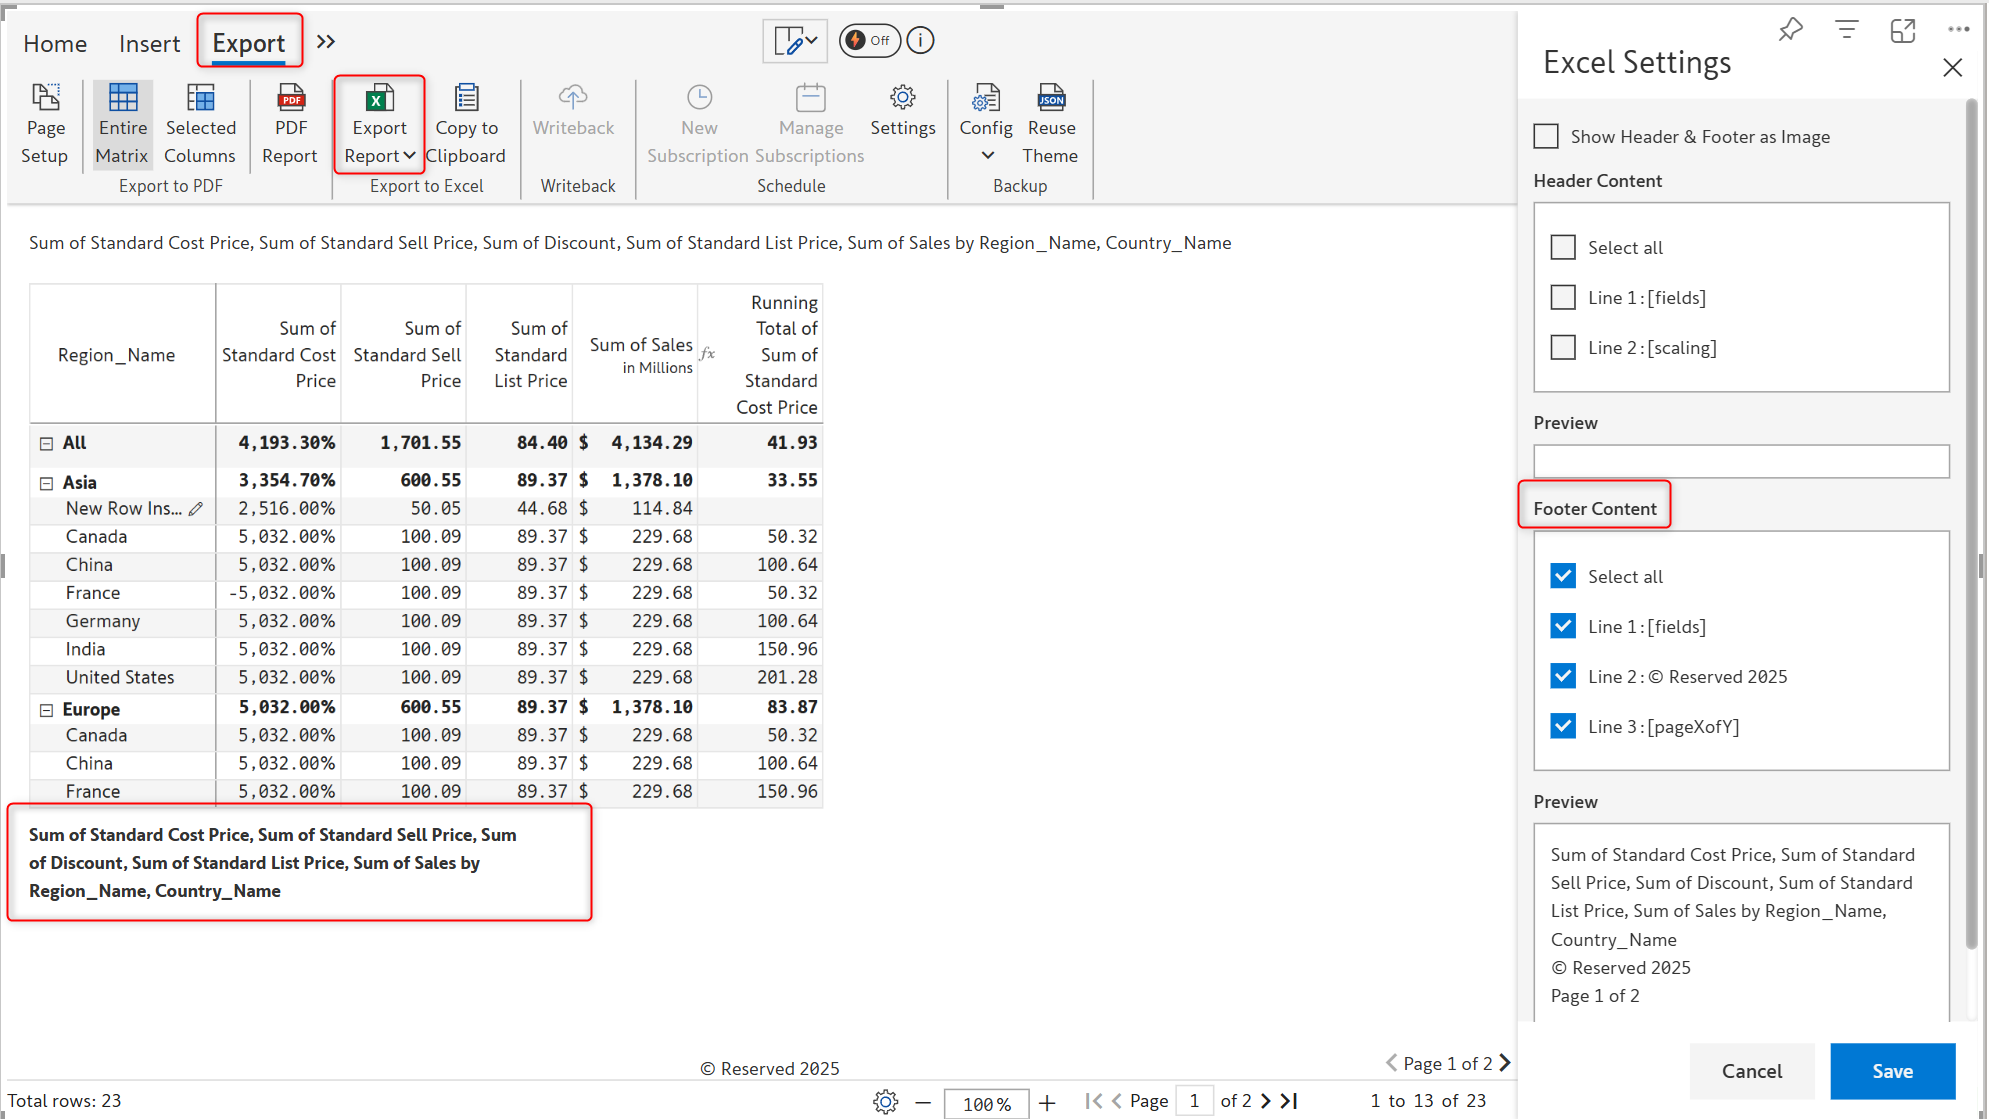
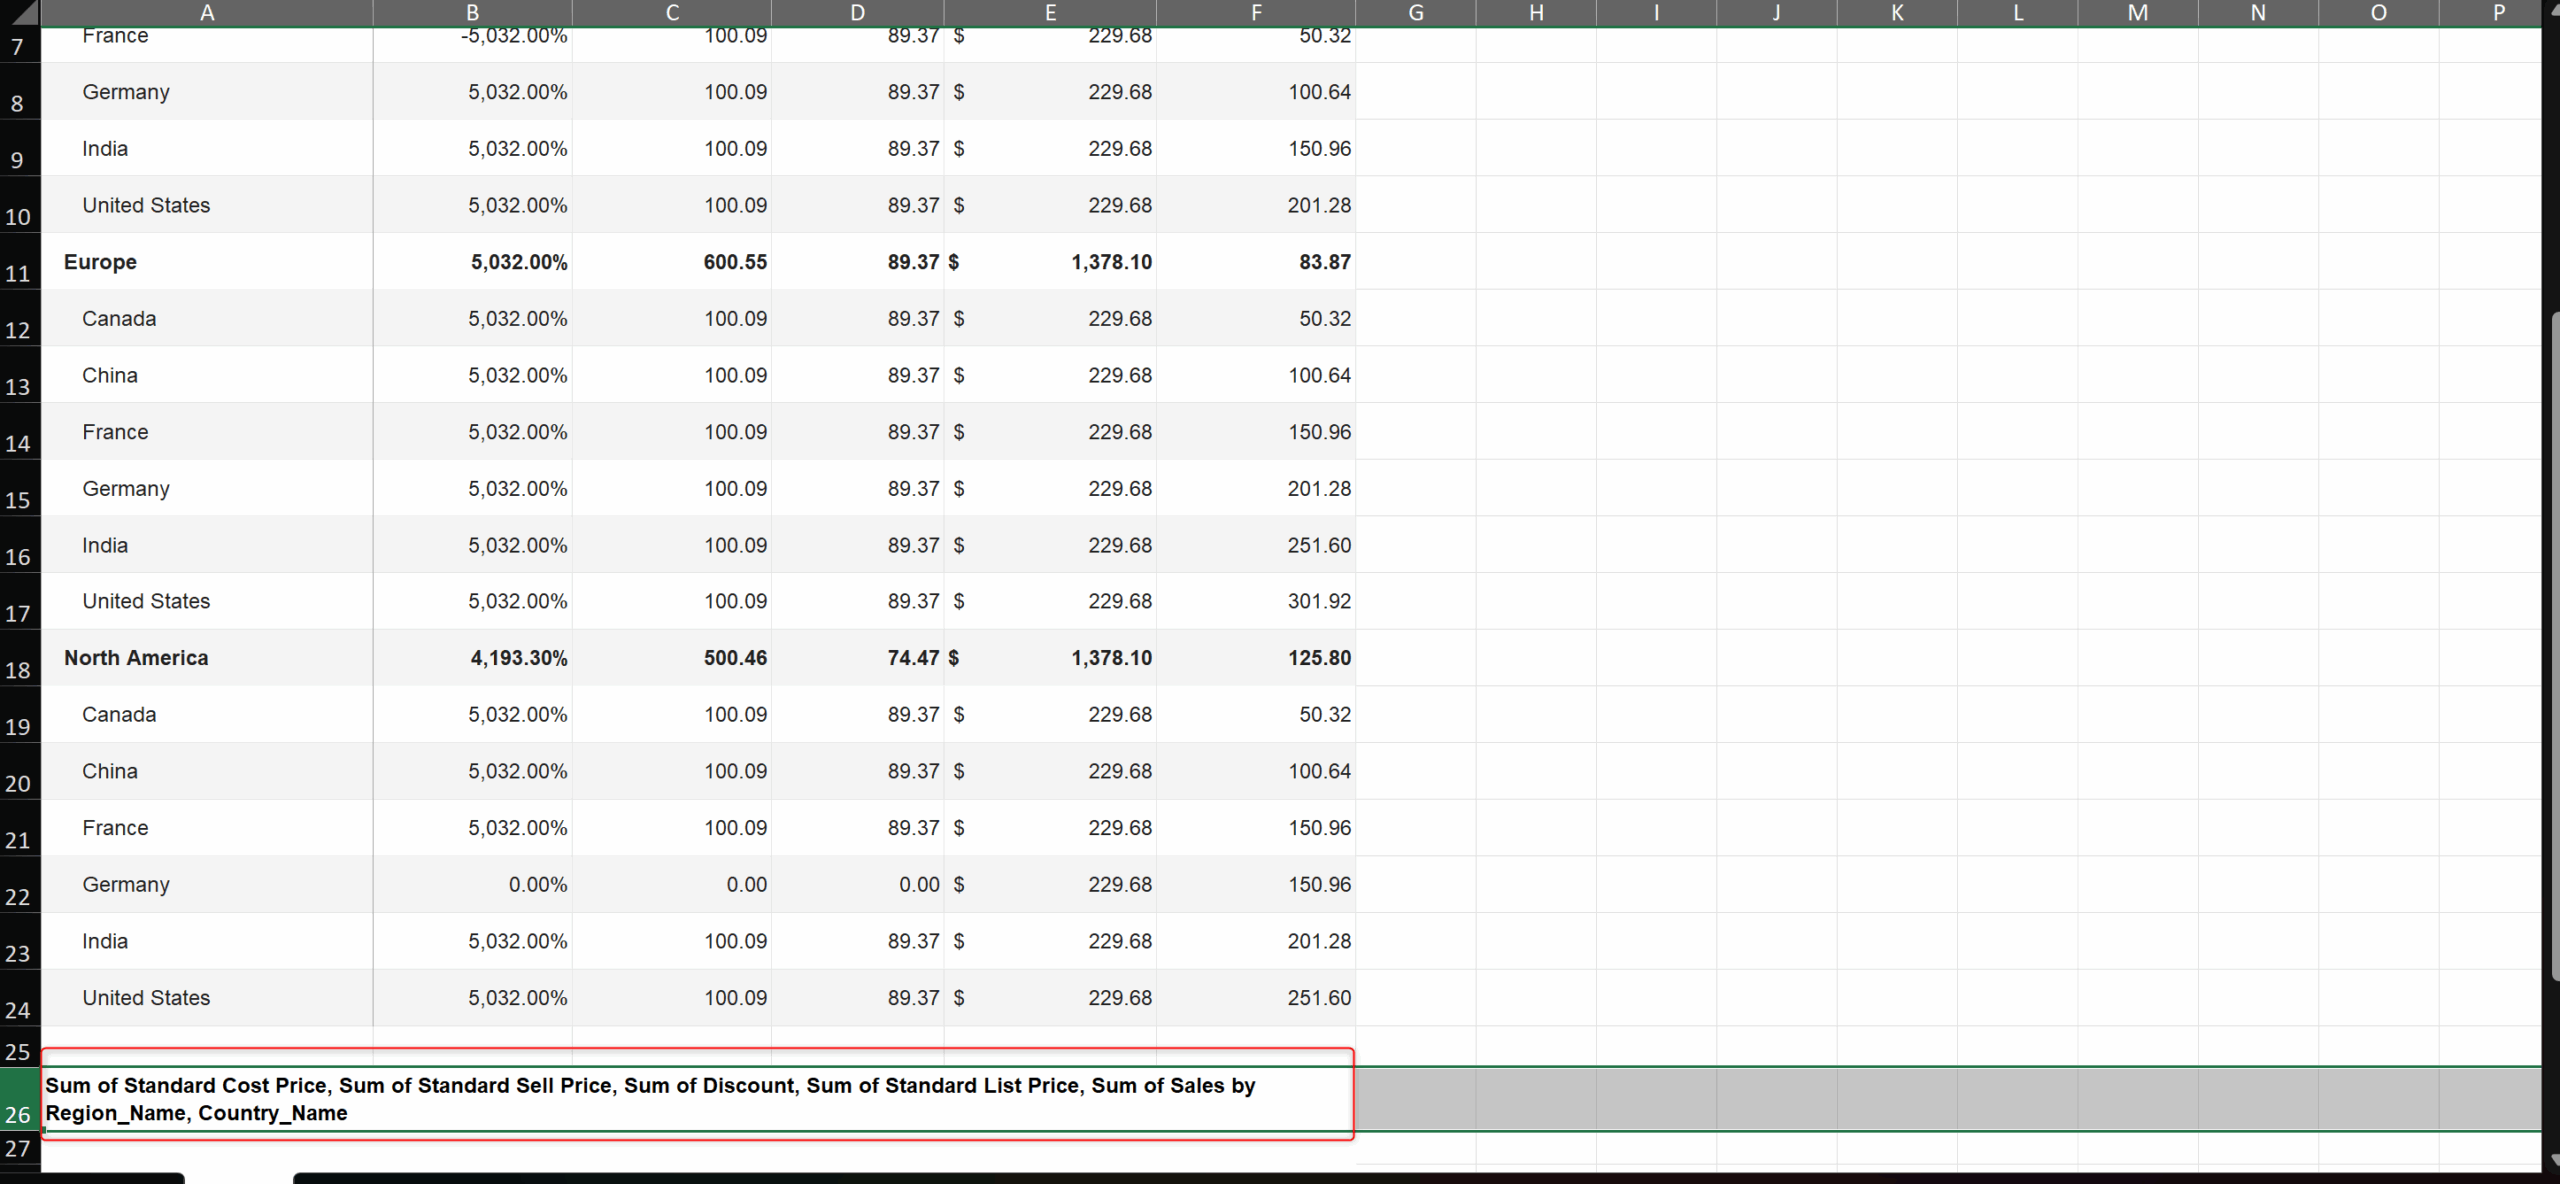
You can now include the footer while exporting. Go to Export > Export Report > Excel Settings. In Excel Settings, select the options to be exported under Footer content and click Save.
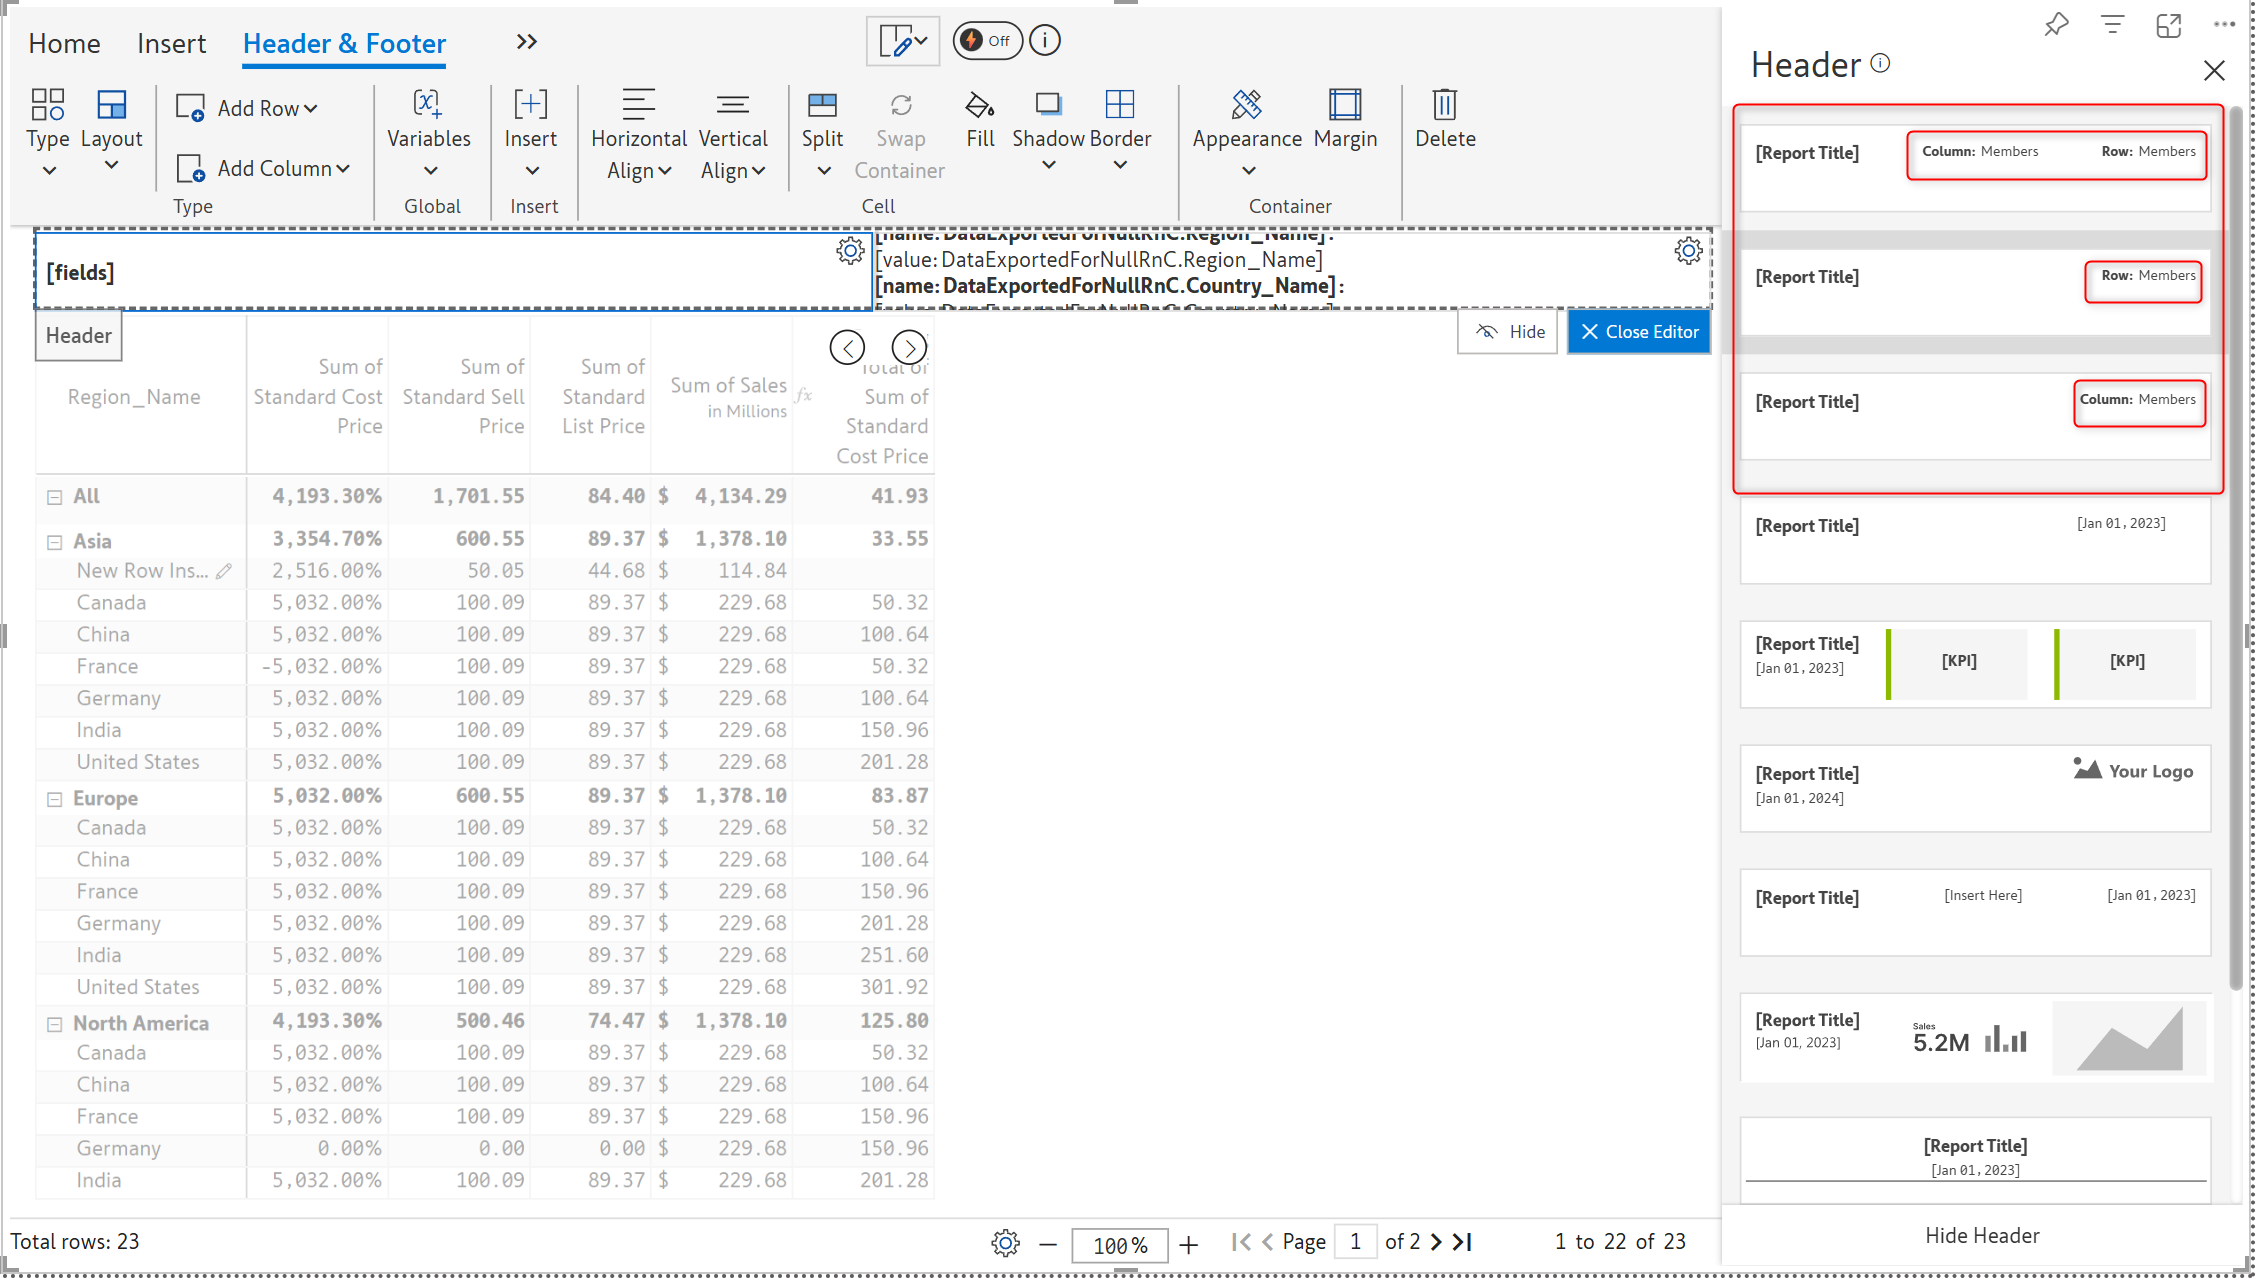
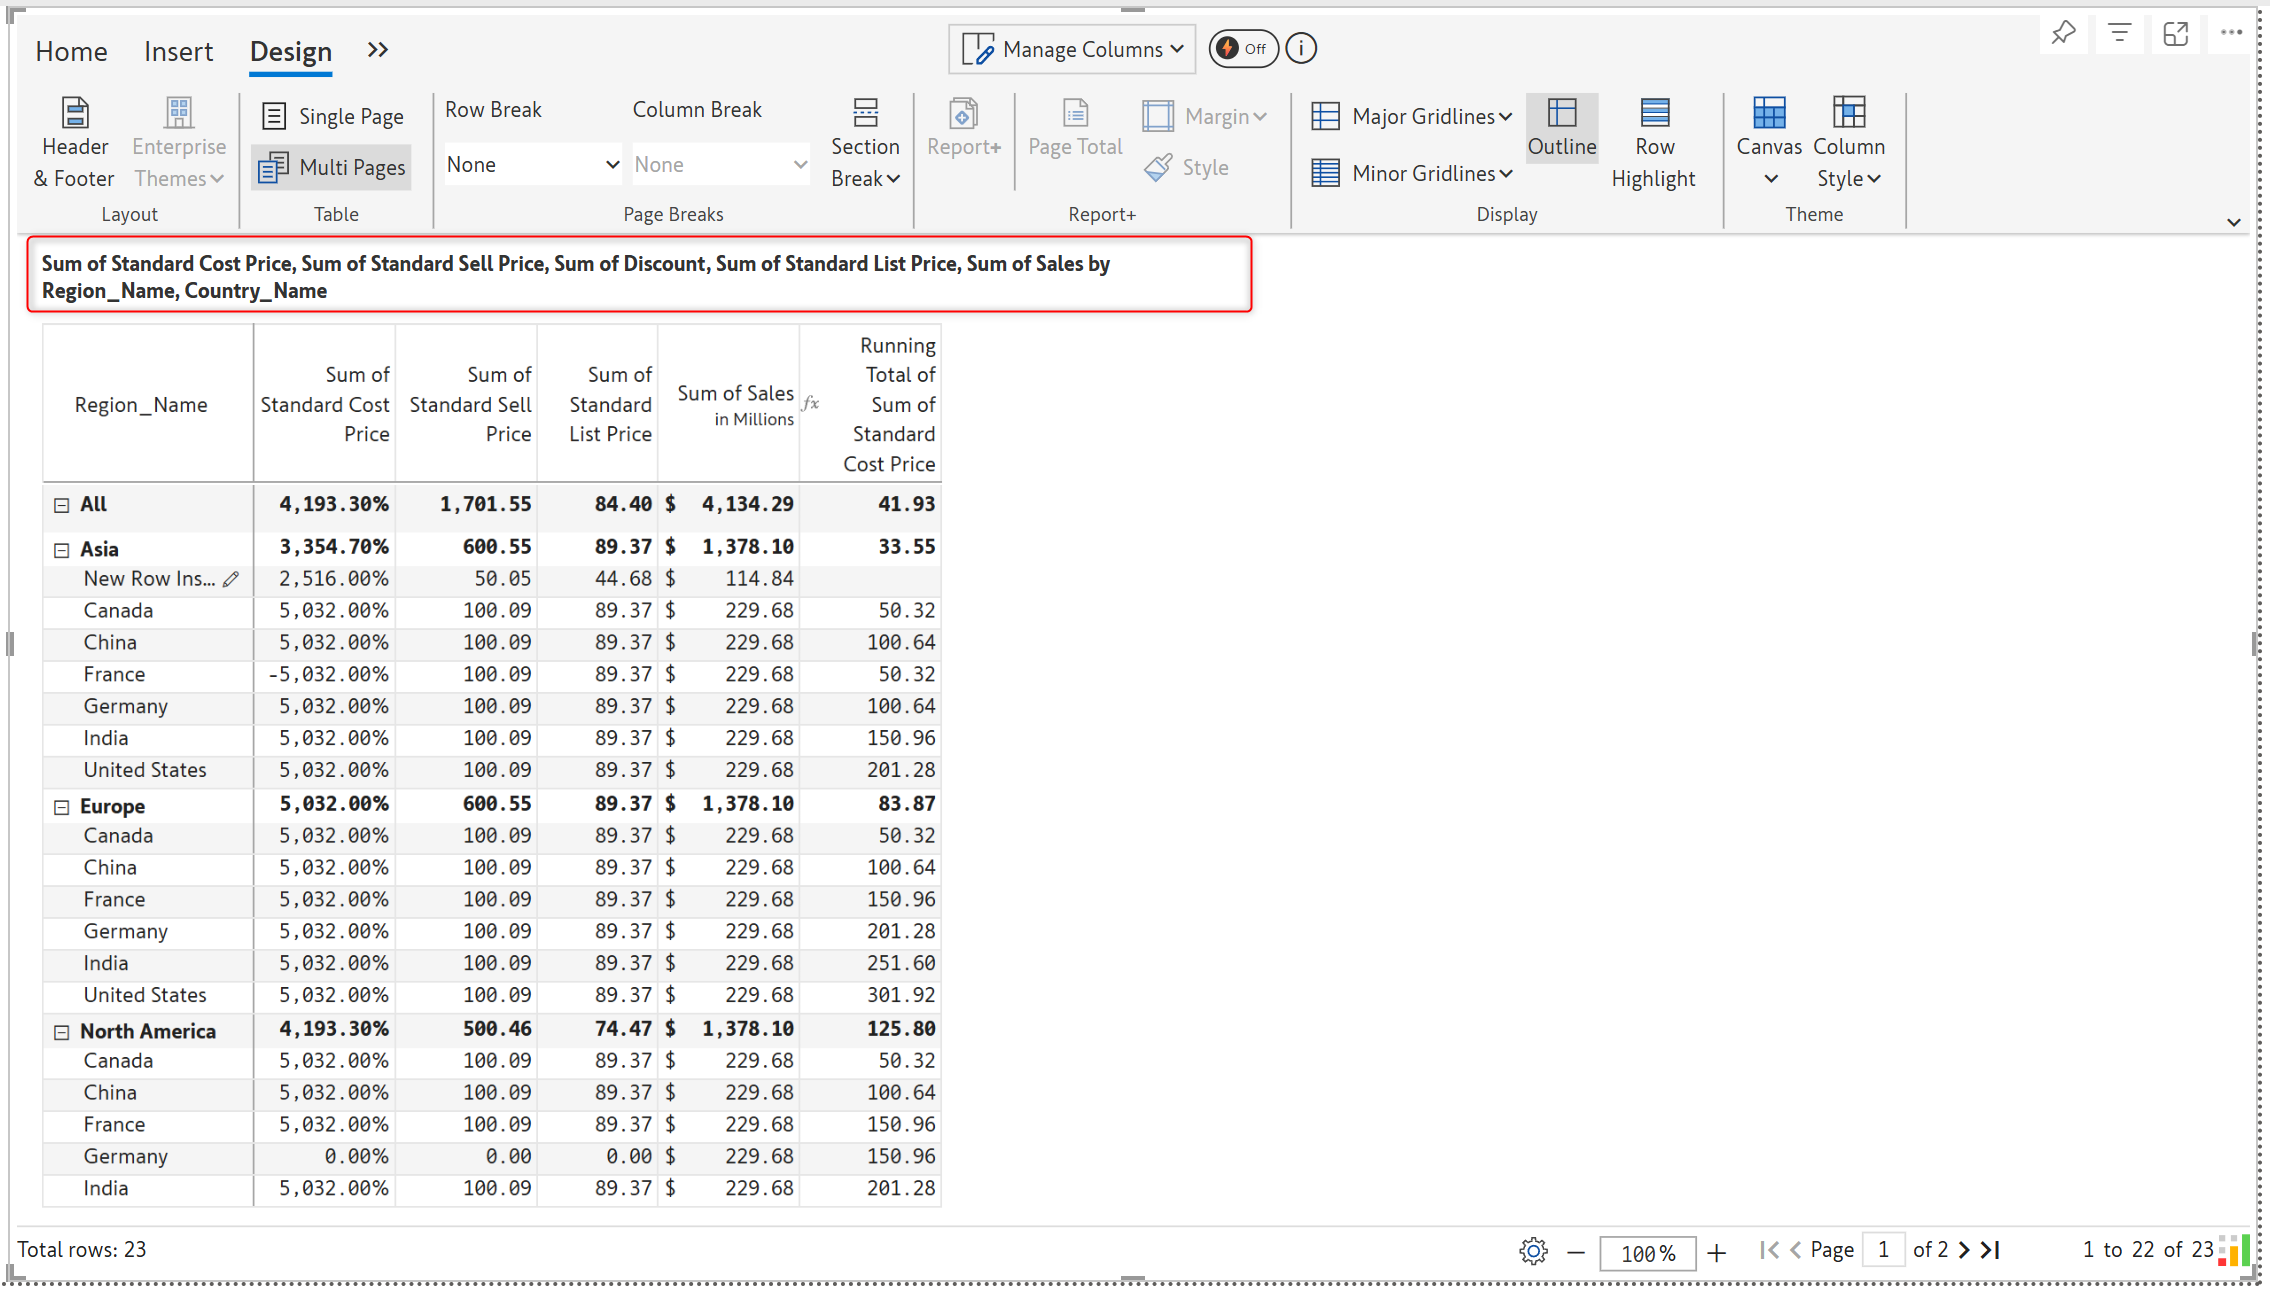
You now have row filter and column filter options in header presets to display row and column names in the header.
Please refer to our release notes for a comprehensive list of requirements, features, and enhancements.
Learn more about Inforiver
To learn more about the latest from Inforiver and why we are garnering recognition from industry experts, check out our newest brochure.
Inforiver and all our planning and analytics products continue to be updated to provide a diverse range of users with optimal performance. With continual improvements and innovations planned, we welcome your feedback.
If you’re ready to level up your planning, reporting, and analytics, try our products for free today.

Inforiver helps enterprises consolidate planning, reporting & analytics on a single platform (Power BI). The no-code, self-service award-winning platform has been recognized as the industry’s best and is adopted by many Fortune 100 firms.
Inforiver is a product of Lumel, the #1 Power BI AppSource Partner. The firm serves over 3,000 customers worldwide through its portfolio of products offered under the brands Inforiver, EDITable, ValQ, and xViz.