Upcoming webinar on 'Inforiver Charts : The fastest way to deliver stories in Power BI', Aug 29th , Monday, 10.30 AM CST. Register Now
Upcoming webinar on 'Inforiver Charts : The fastest way to deliver stories in Power BI', Aug 29th , Monday, 10.30 AM CST. Register Now
The Inforiver ecosystem is continuously evolving, driven by expert feedback from our customers, contributions from the Inforiver community, and innovations led by Inforiver developers. As we step into the new year, let’s reprise the top features we released in 2023.
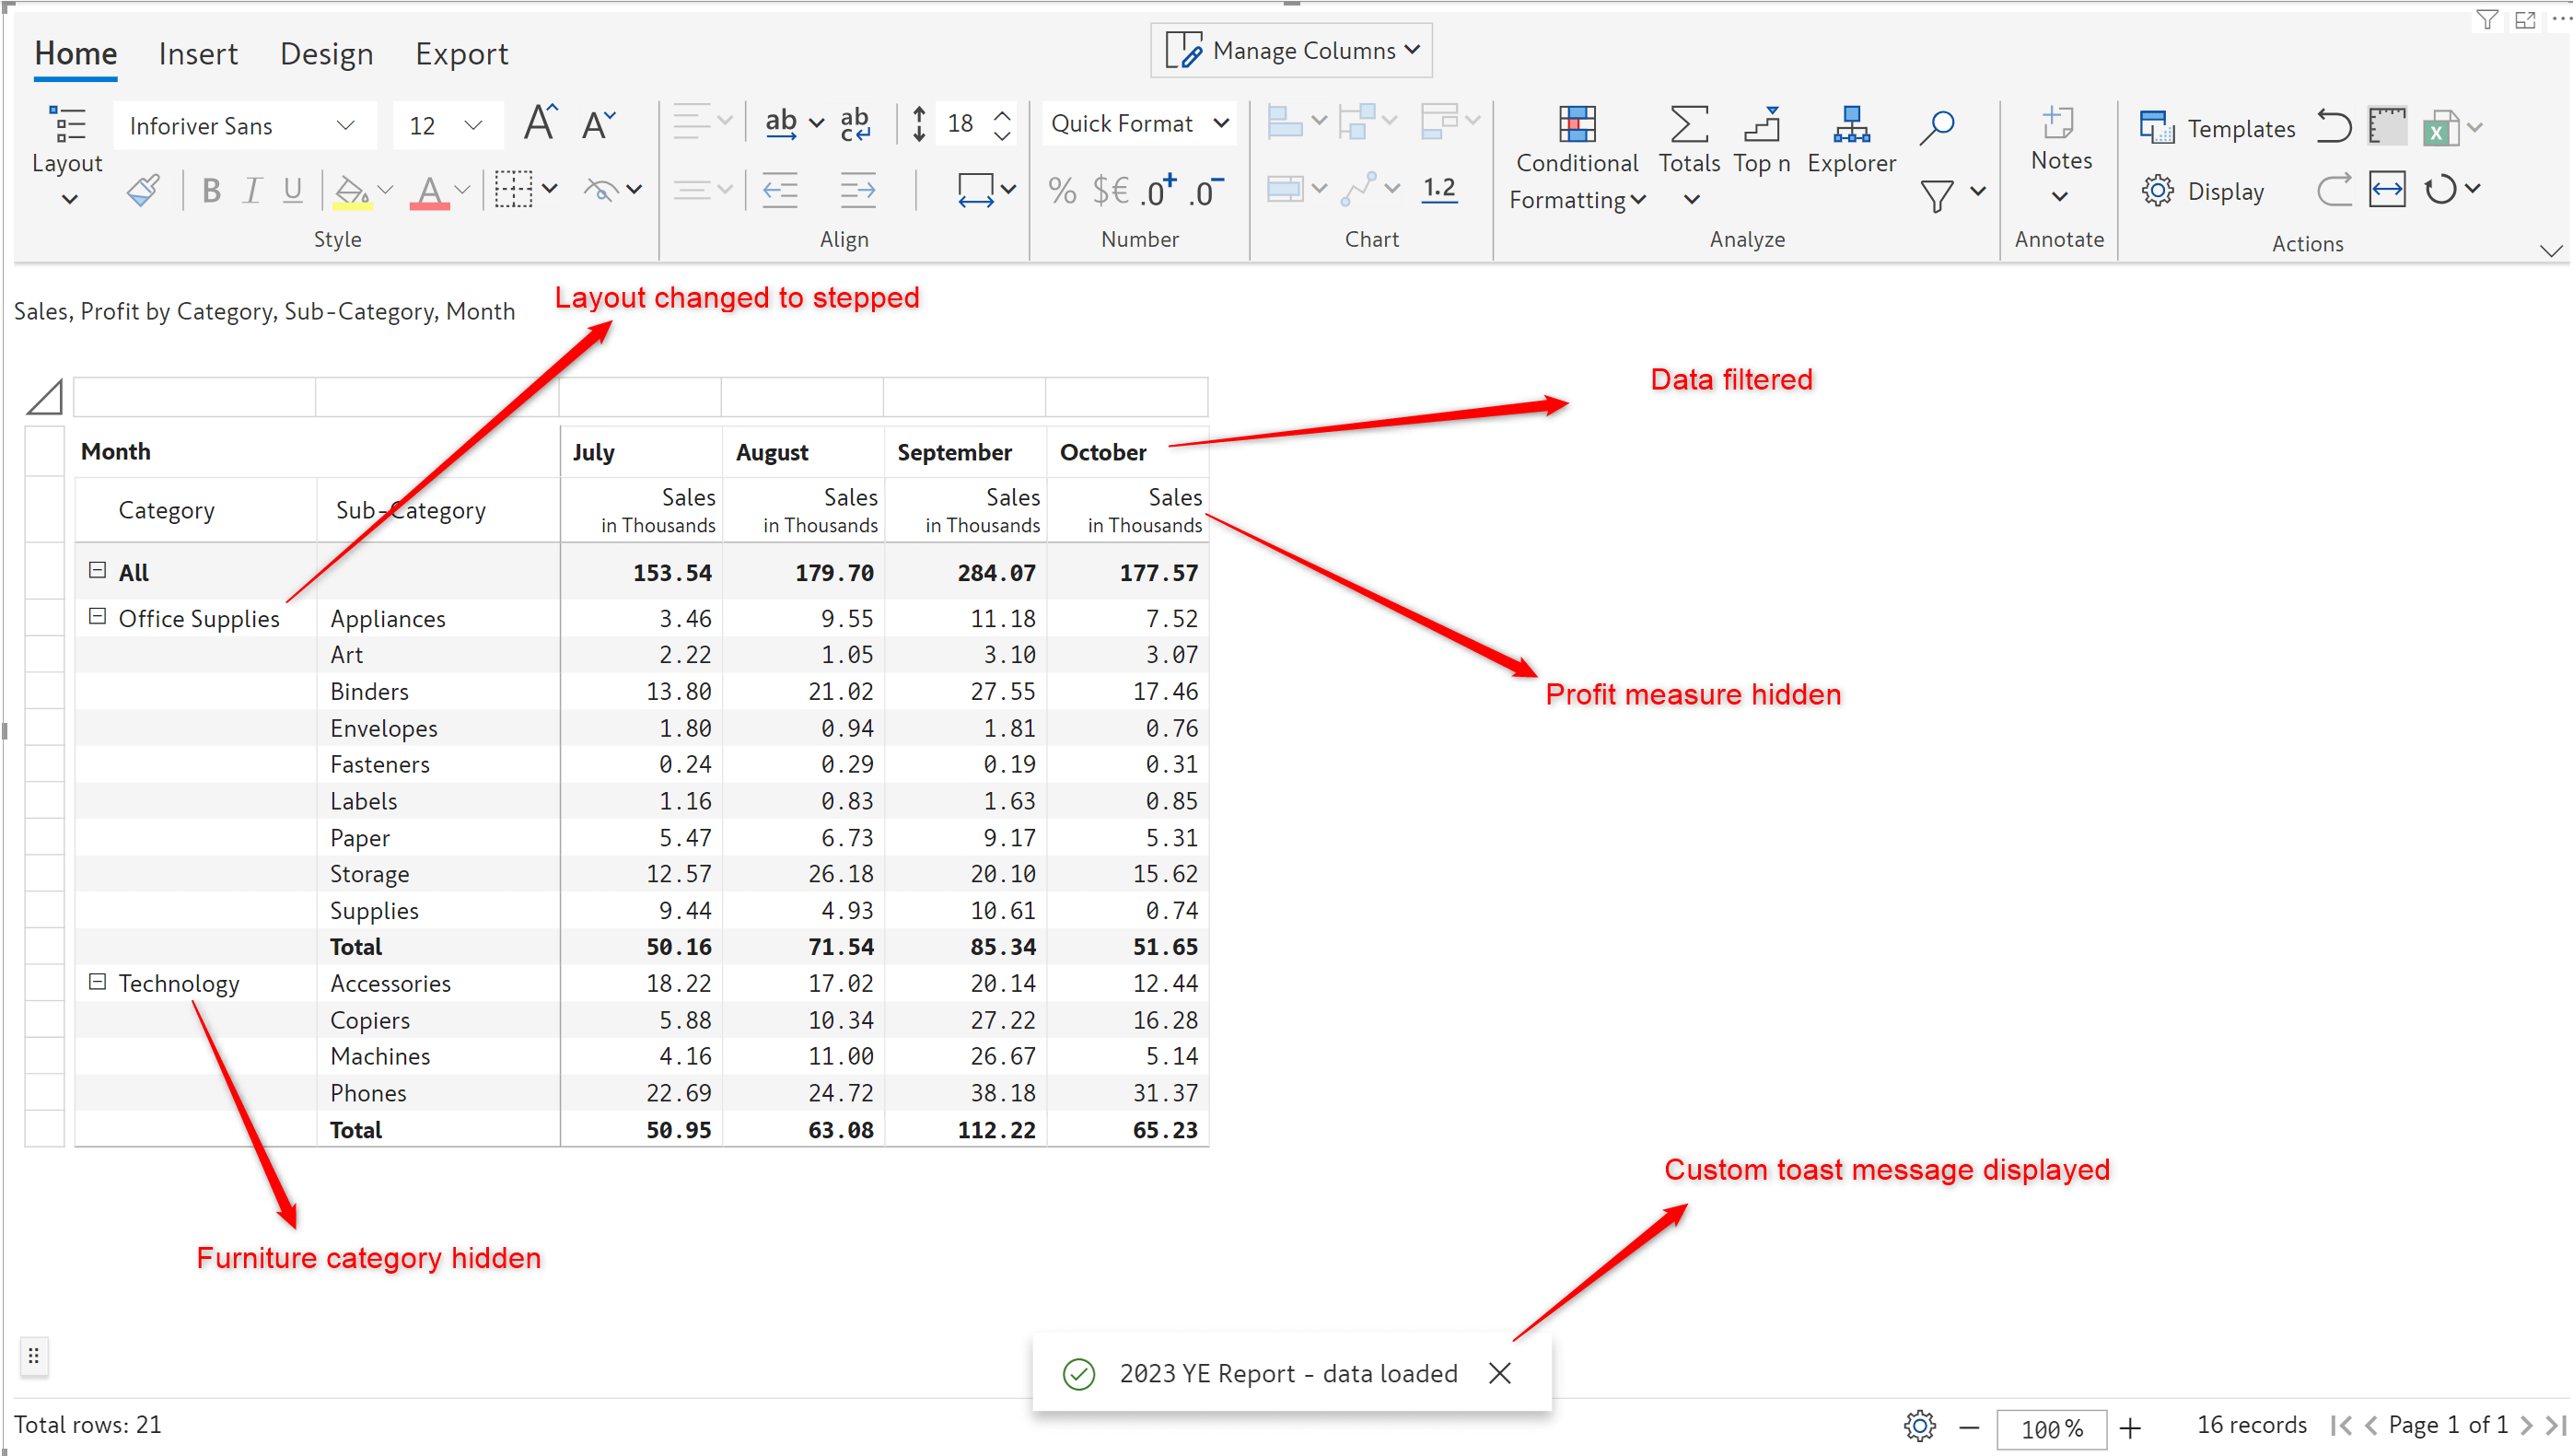
Inforiver’s new on-load scripting feature enables you to list a set of actions to be performed on loading the visual. You can display messages, set the layout, hide columns, or apply filters as the visual is loaded. The scripts will be executed when you open the report, switch to the tab containing the visual, or refresh the visual. Inforiver offers an array of built-in functions that you can use to set up scripts effortlessly.
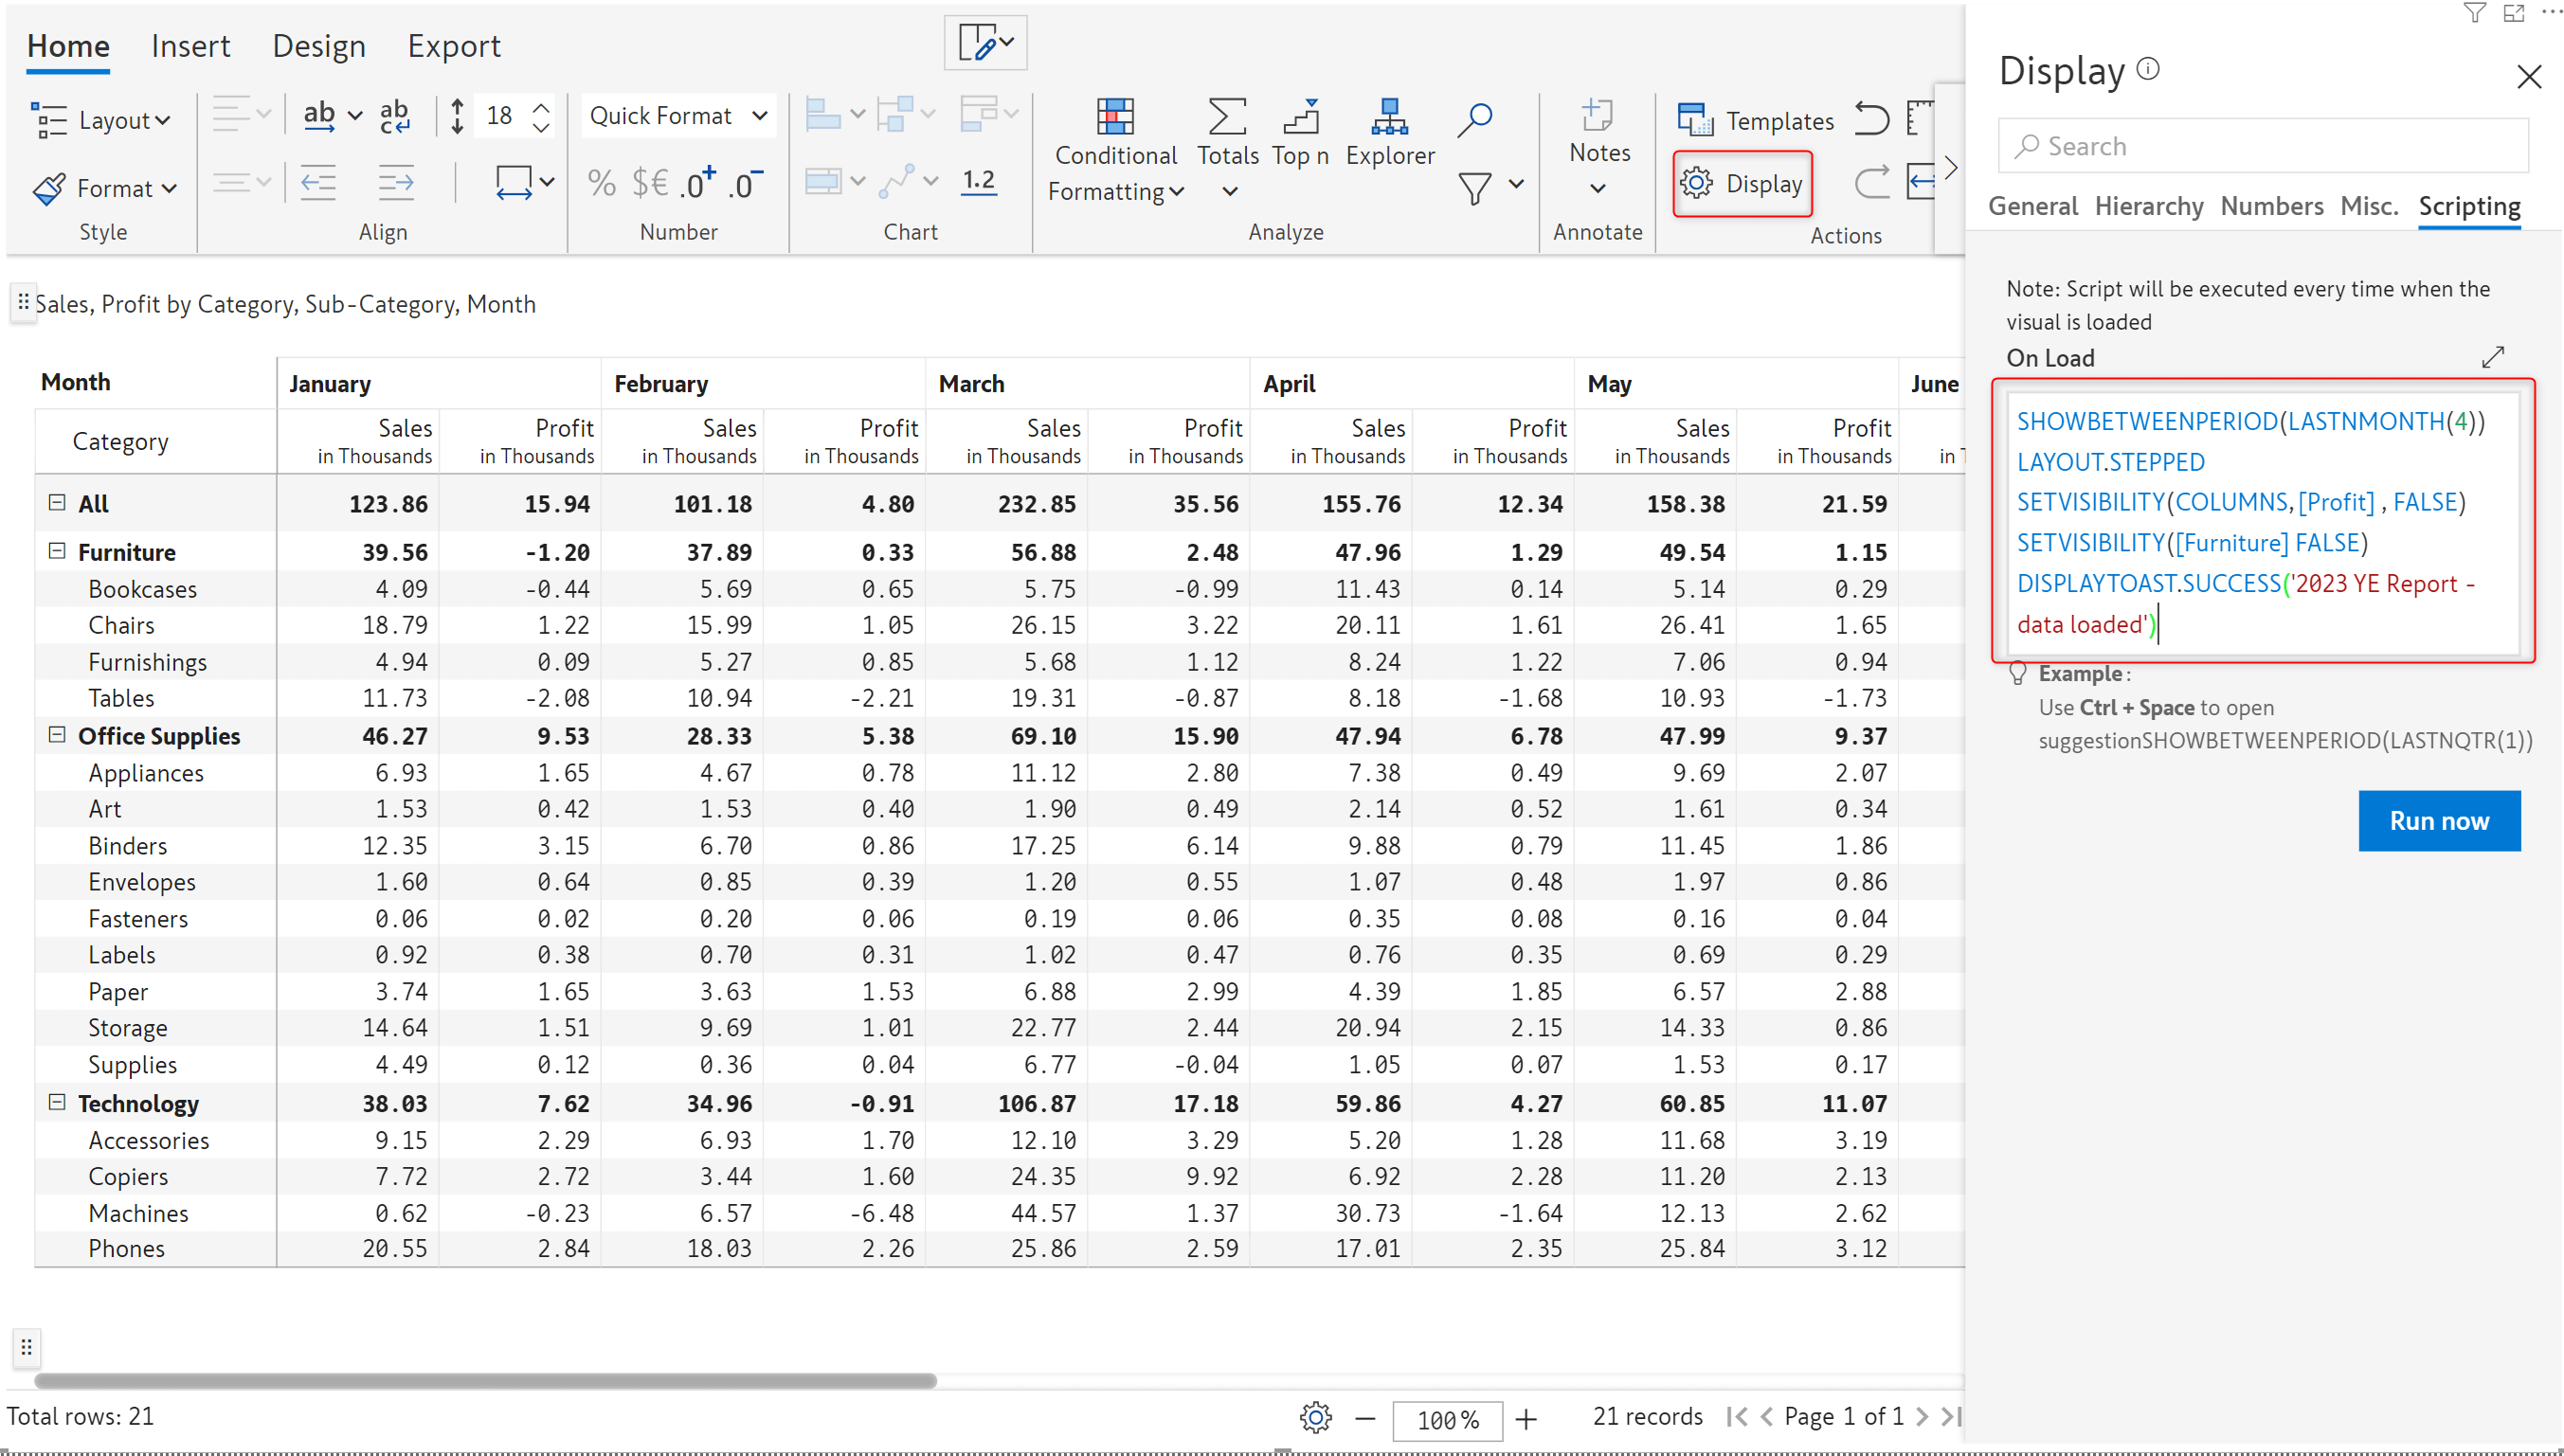
The scripts are executed when the visual is loaded, boosting performance.
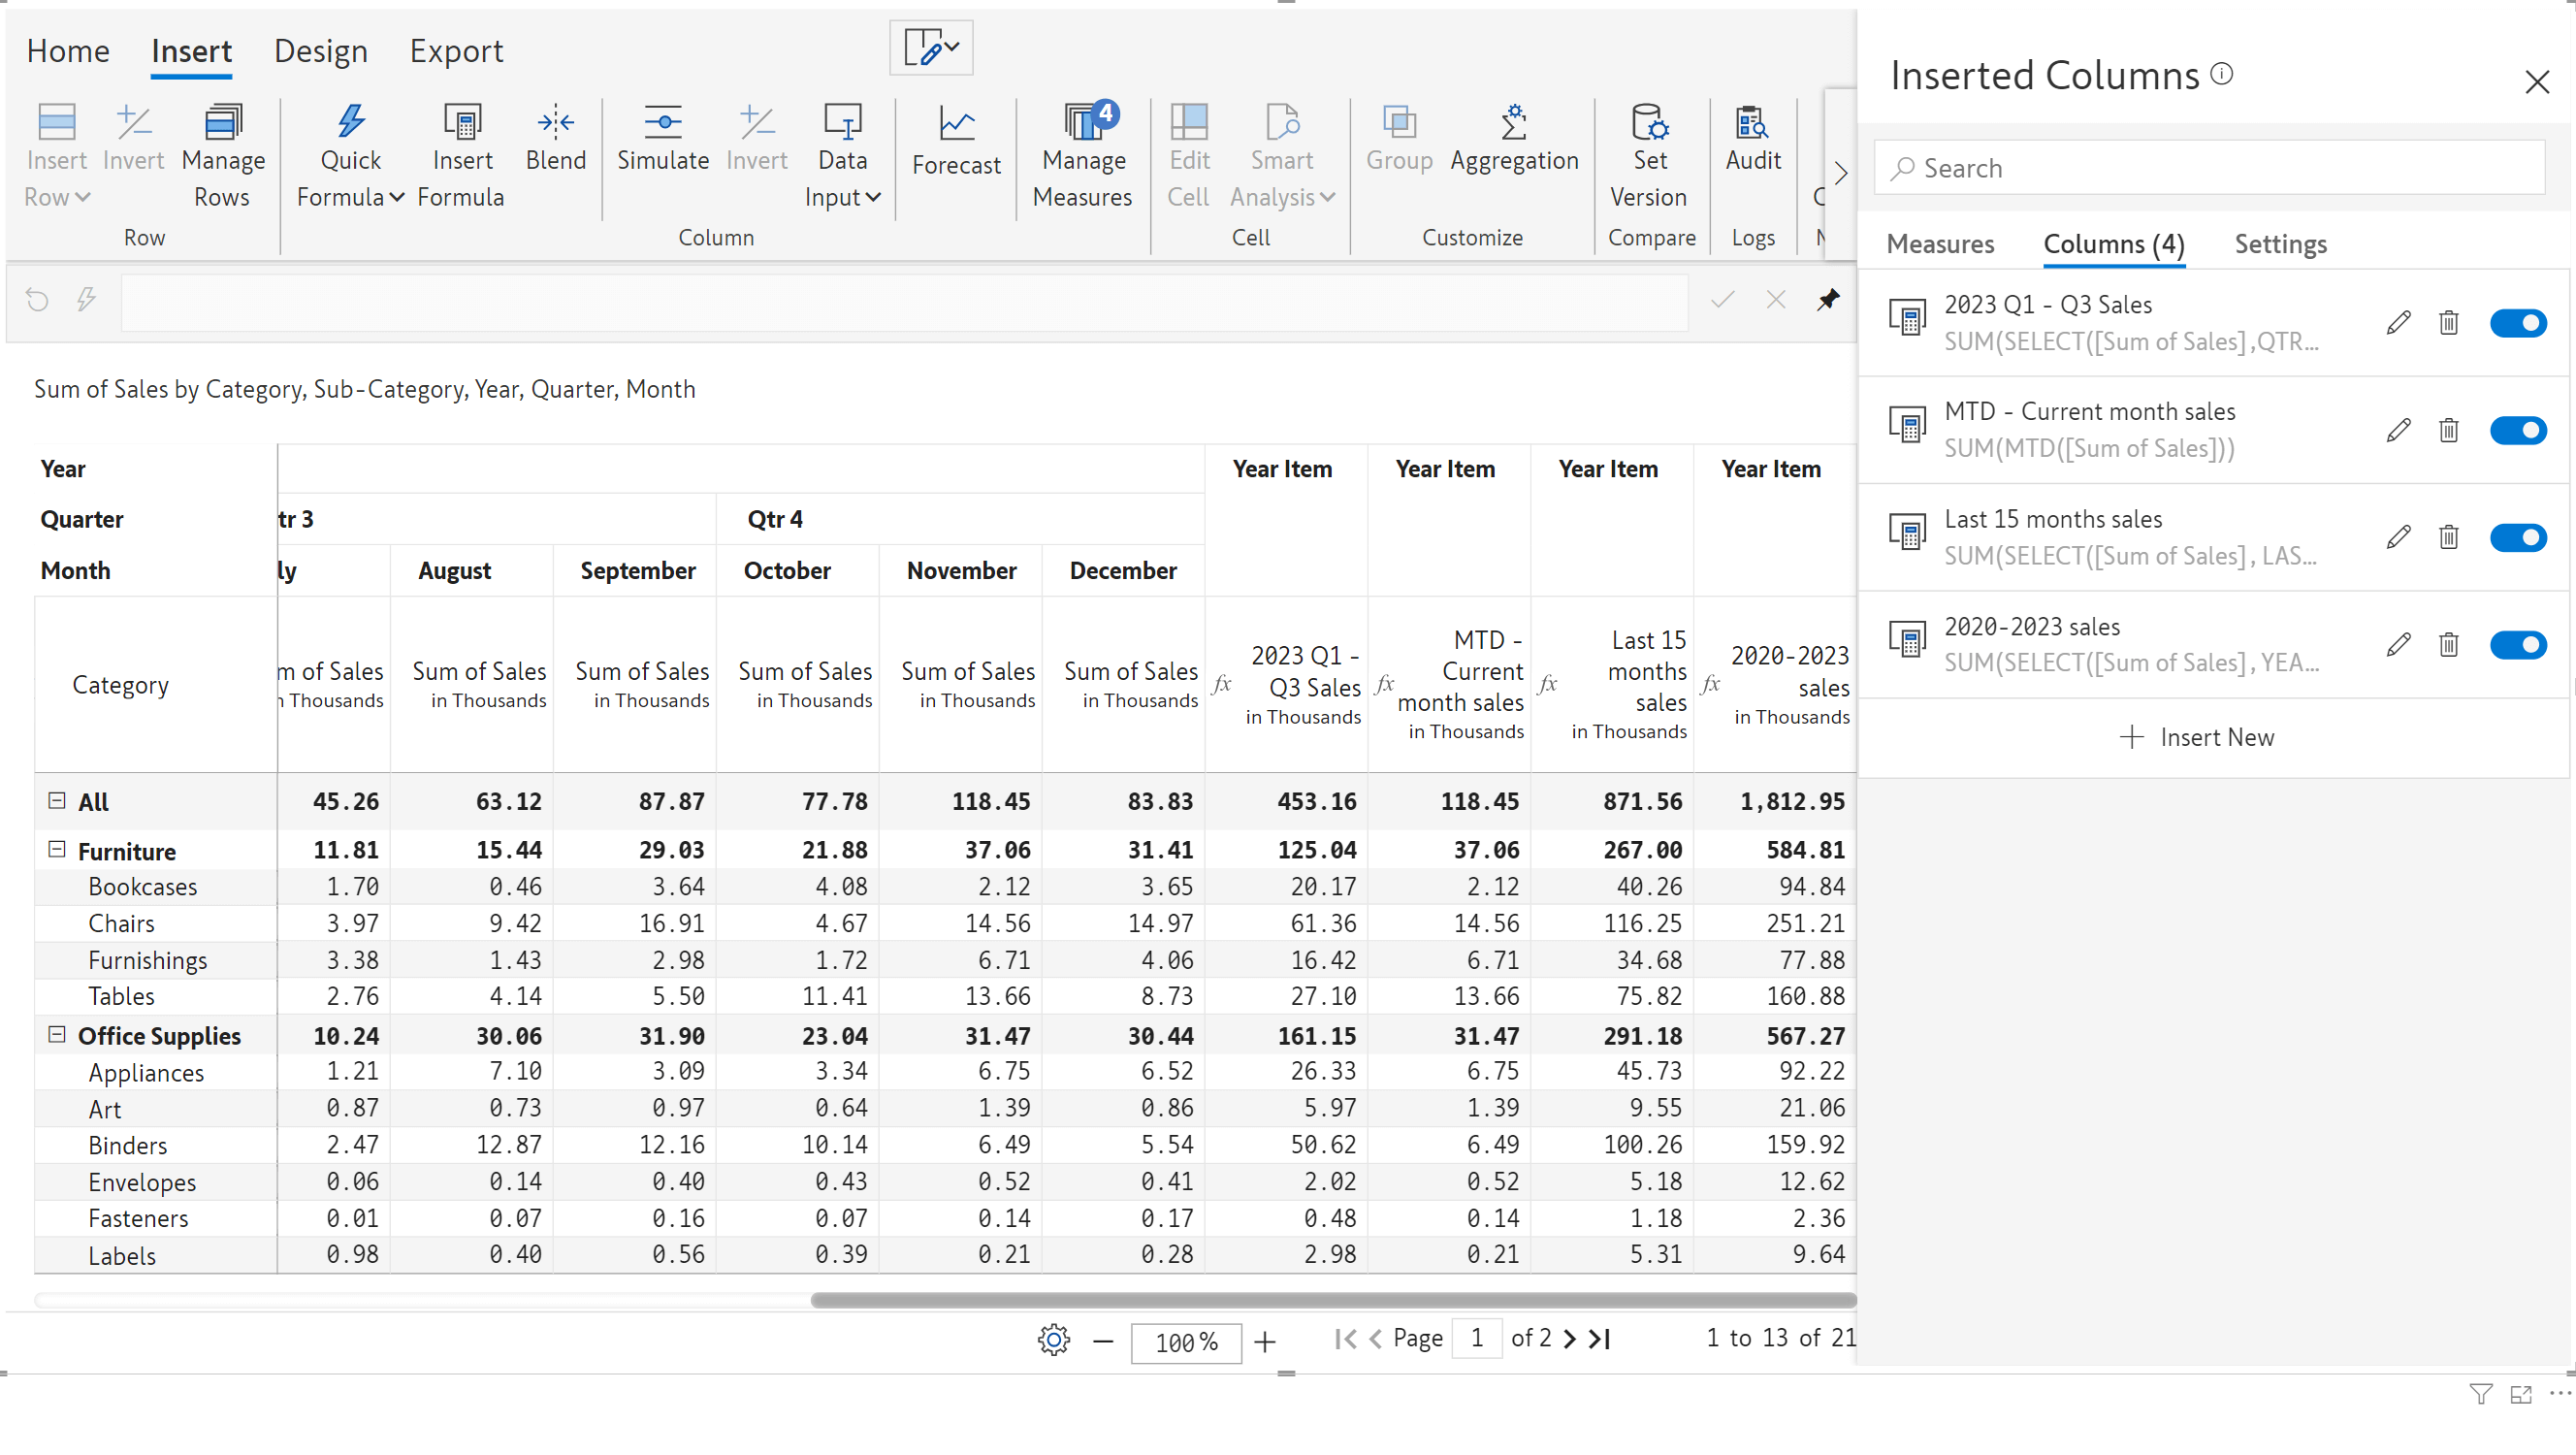
Inforiver offers additional time-intelligence-based calculation capabilities. Your formulae can now reference YTD, Quarter period, and Last N months. Learn more about time intelligence functions.
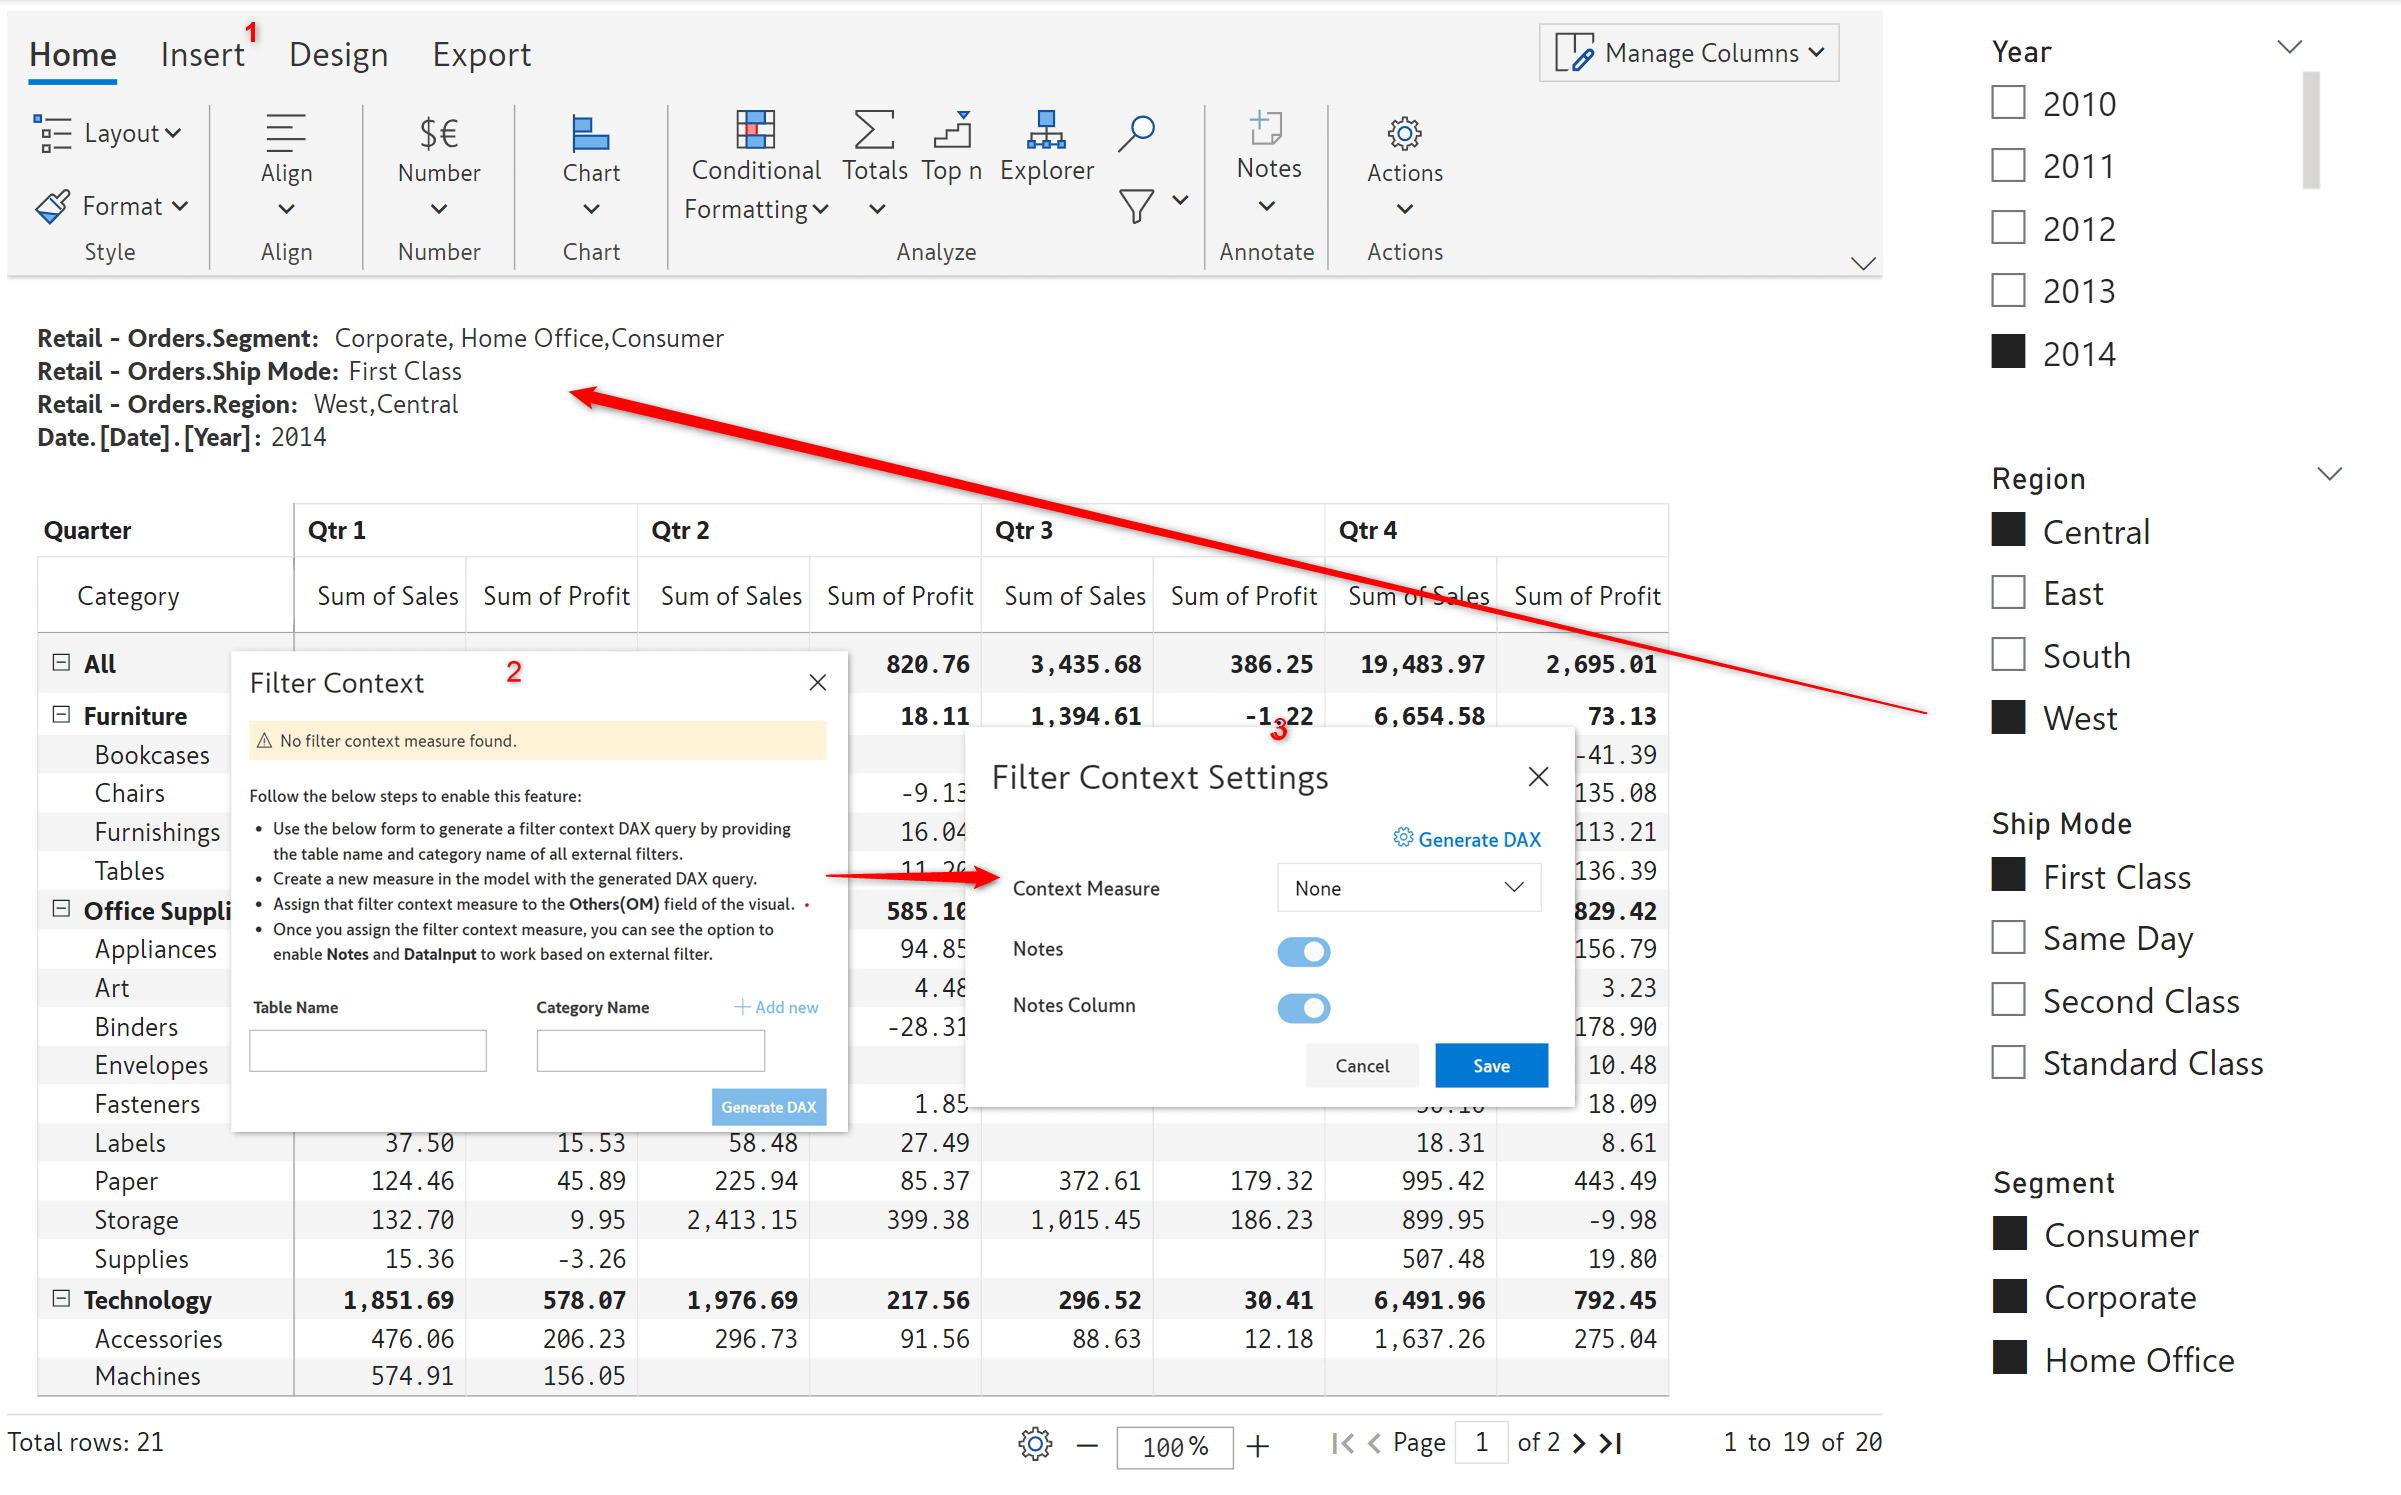
We introduced context awareness – the Inforiver visual is responsive to changes made in external filters/slicers. Comments and headers are dynamically updated based on the filter selection. .
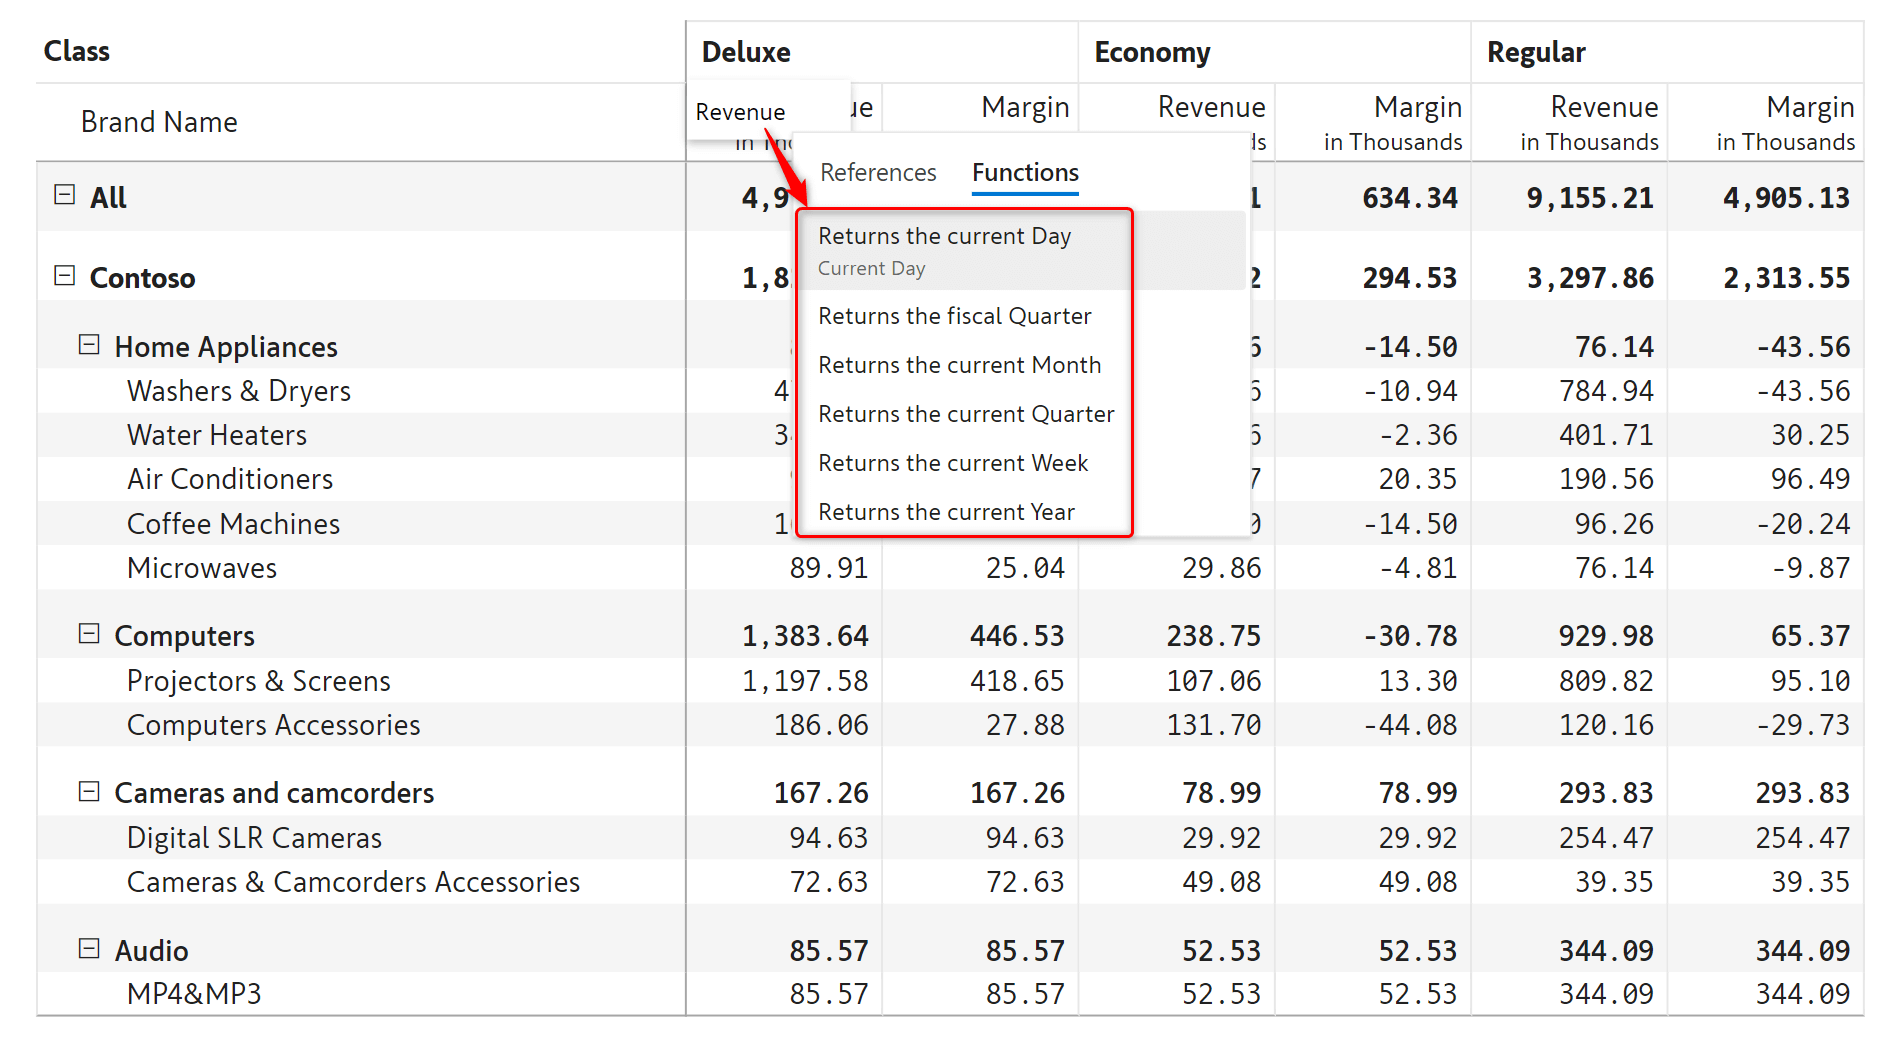
Inforiver allows you to customize the header names for measures using functions or references. To enable the function list, double-click on the measure and click on Ctrl and Space. Simple operations such as + and – can be used to reference future or past periods. For instance, MONTH()-1 returns the previous month, and YEAR()+1 returns the following year.
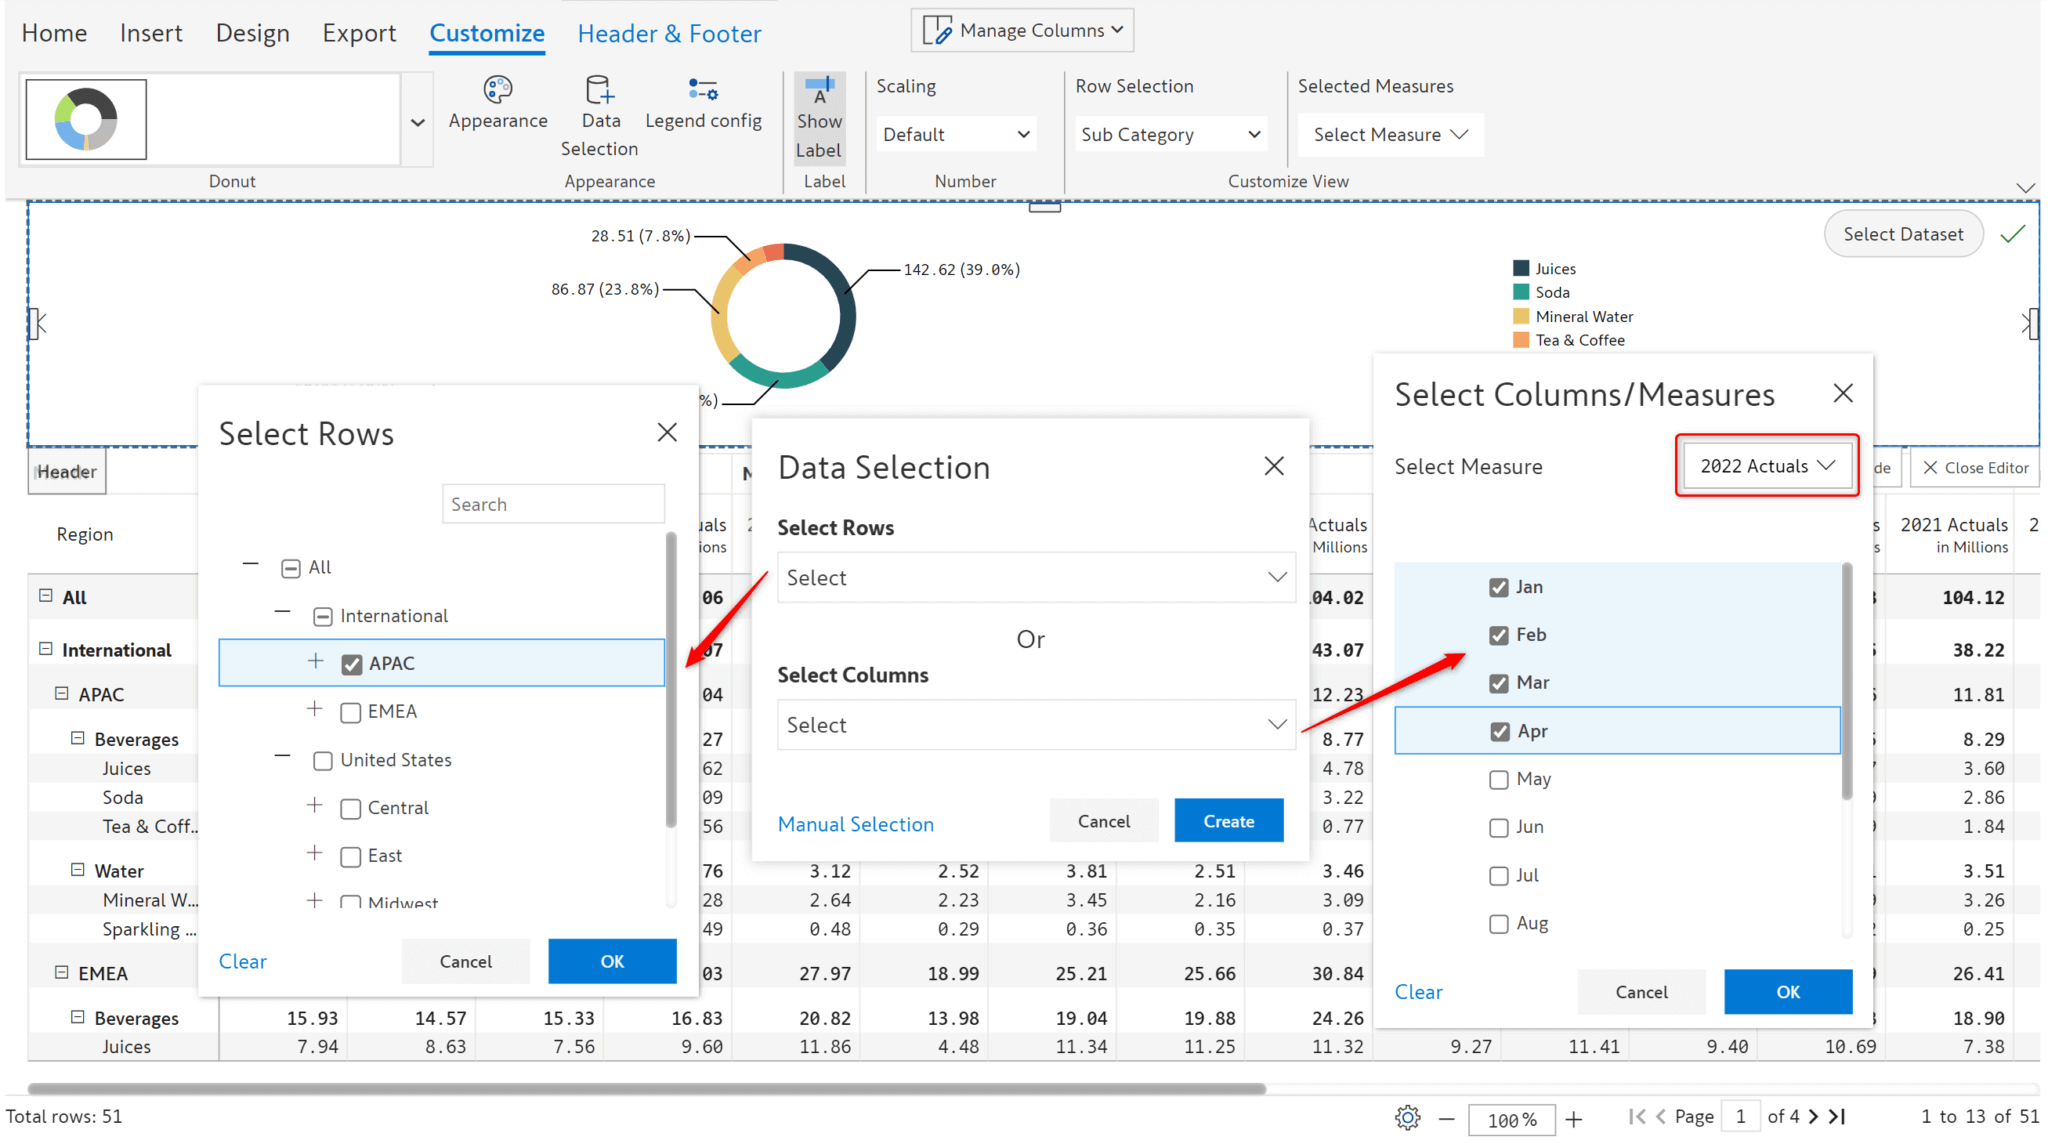
We added various options to customize the header and footer, such as data selection, positioning, ungroup, and applying custom formatting for KPIs and single-click container splitting, to name a few.
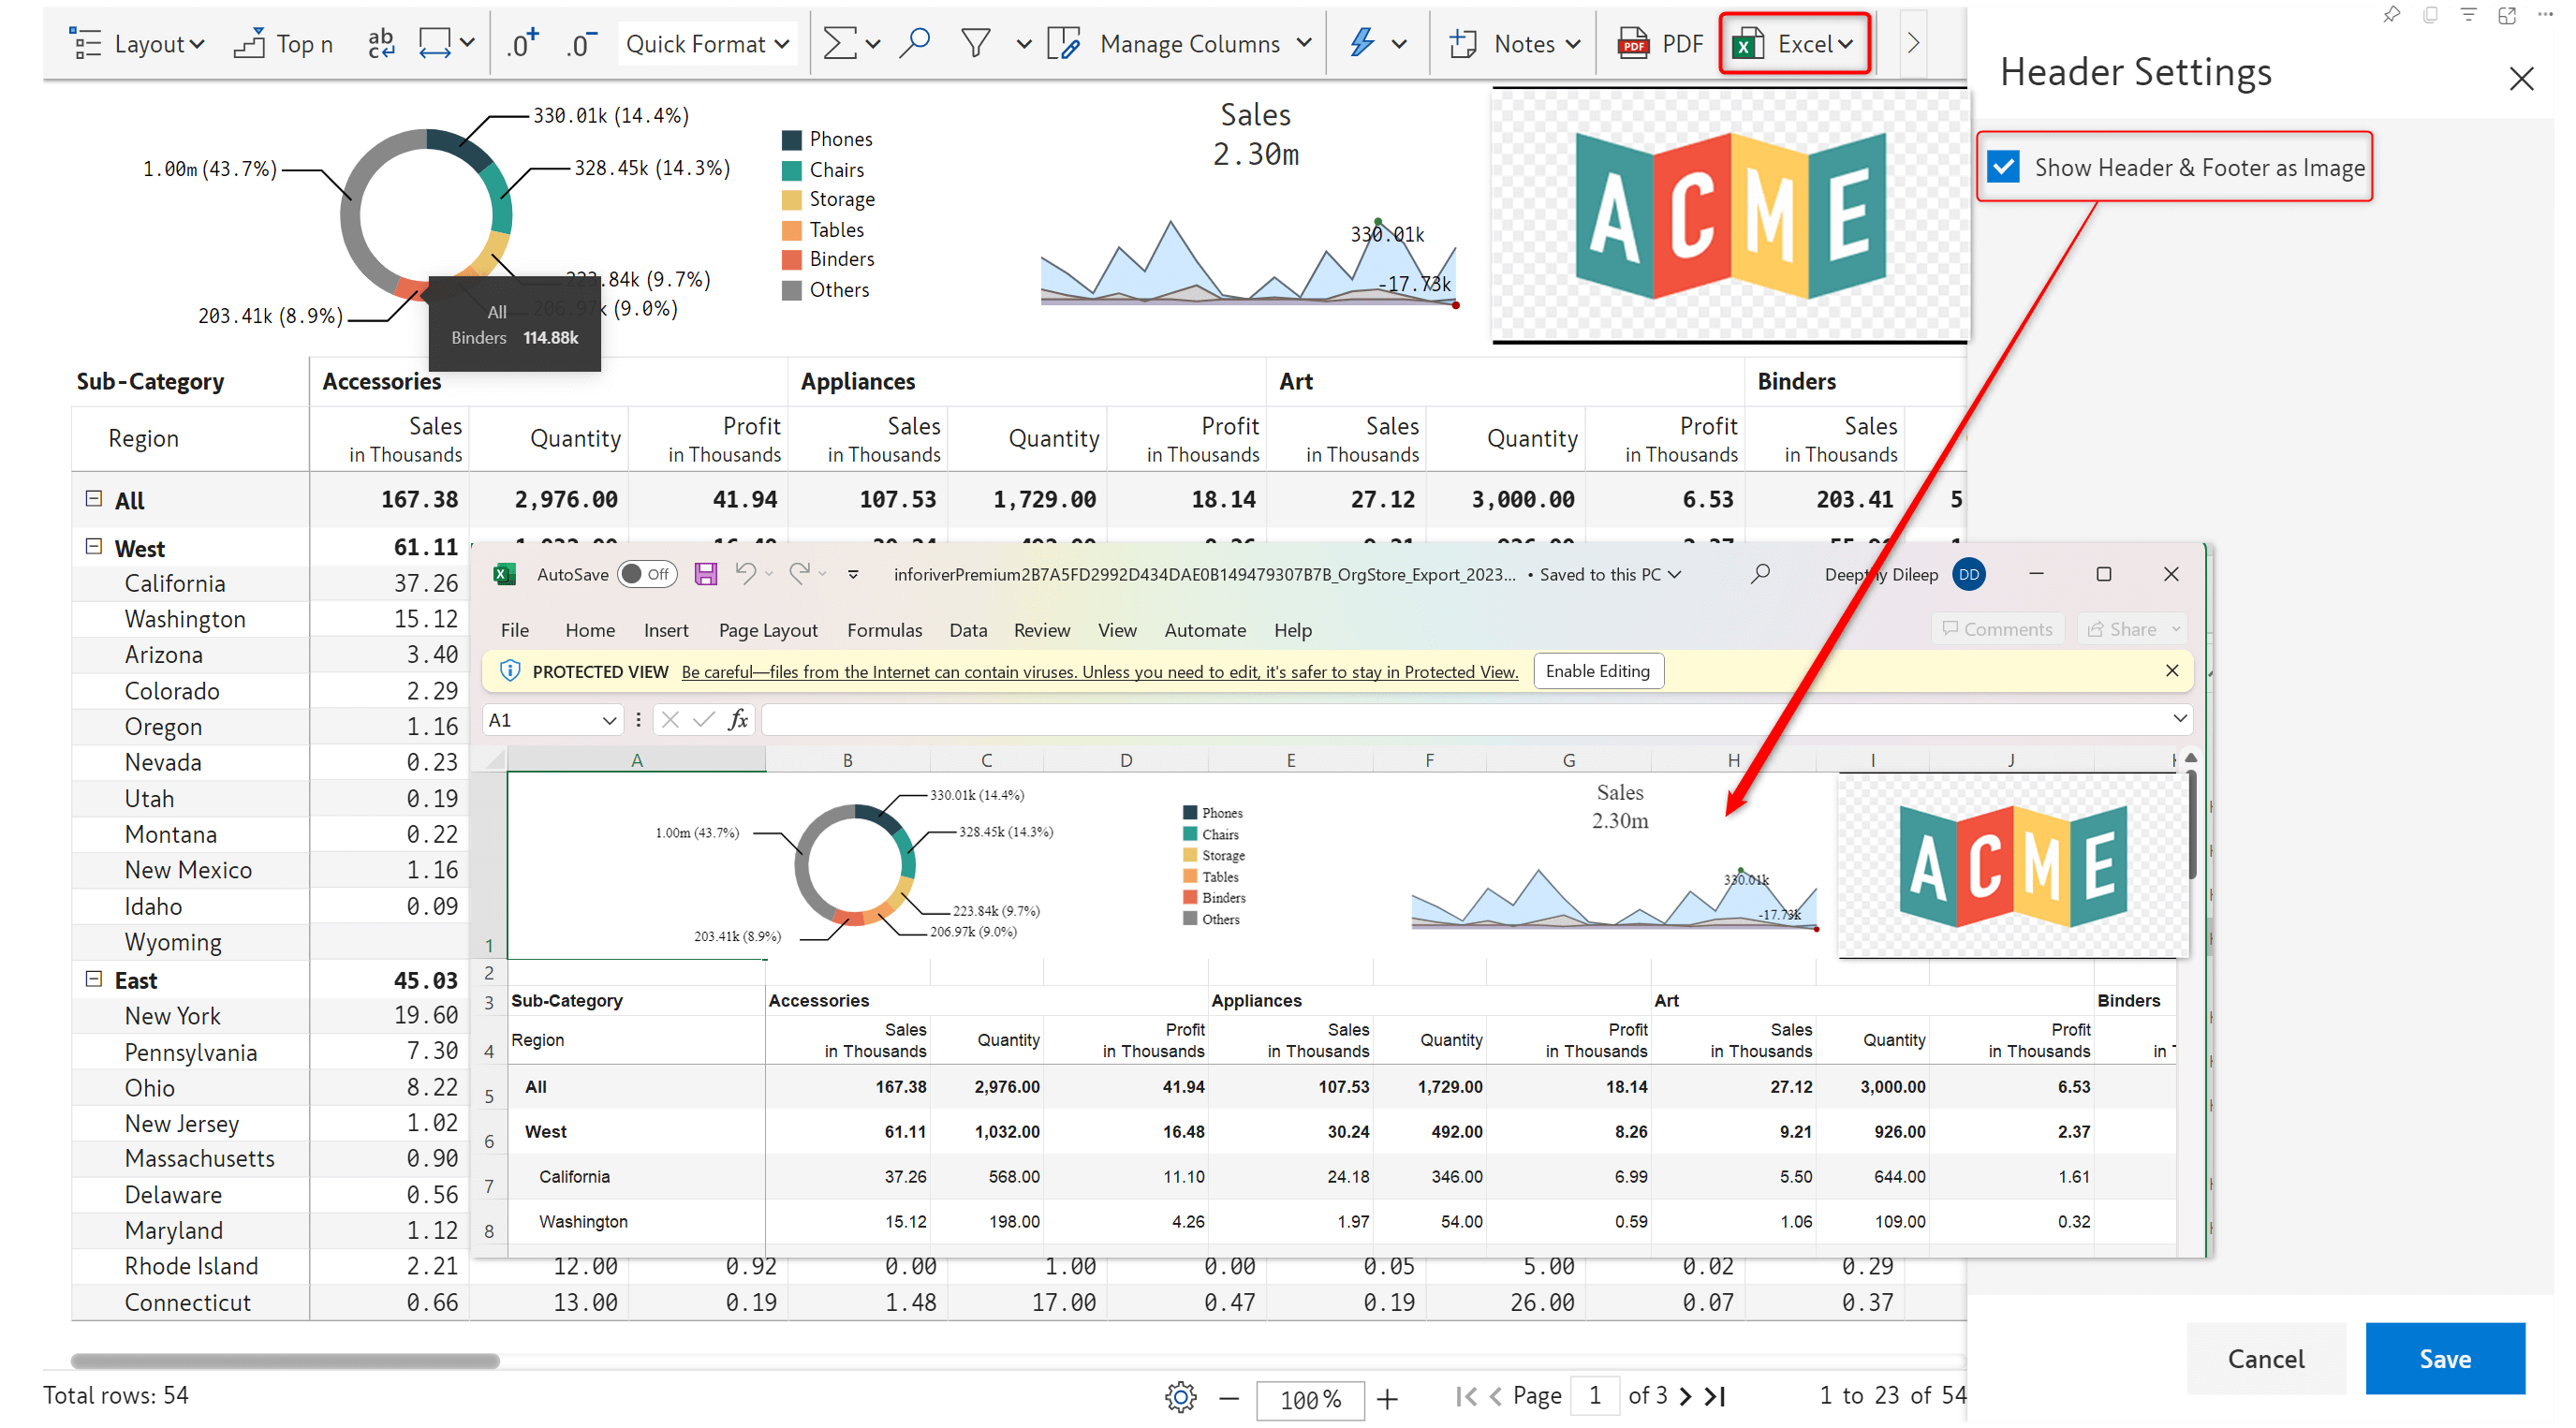
Inforiver provides extended support for exporting header elements such as dates and symbols. From the new header settings UI, you can quickly select the lines of the header that you want to export to an Excel file. If your reports use charts or images in the header and footer, Inforiver enables you to export them as an image to an Excel file.
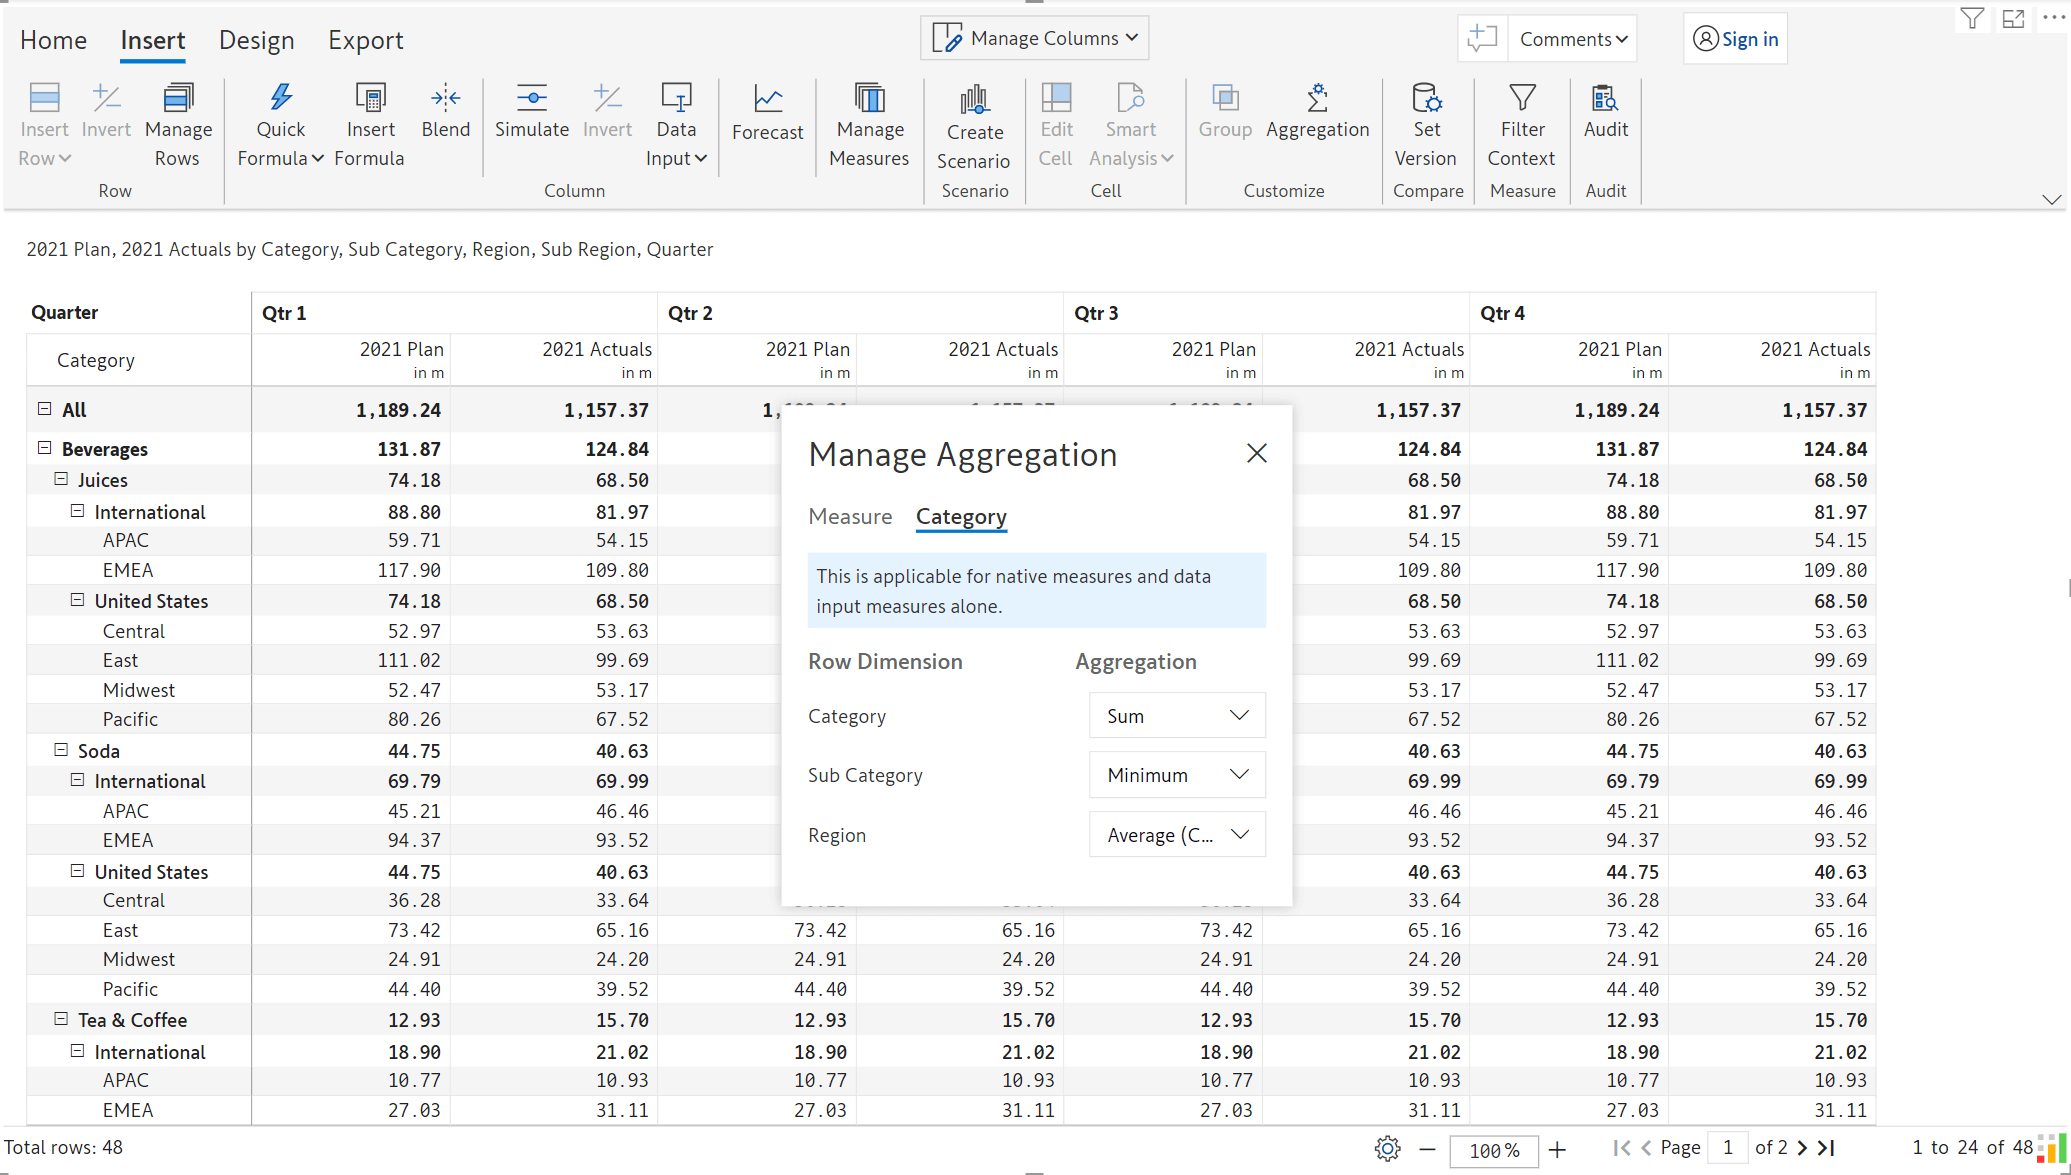
Inforiver provides the capability to set custom aggregation at the report, measure, or hierarchy (row category) level. We consolidated all the aggregation options in a centralized window, enabling you to configure aggregations in a single location.
Aggregation settings in earlier versions:
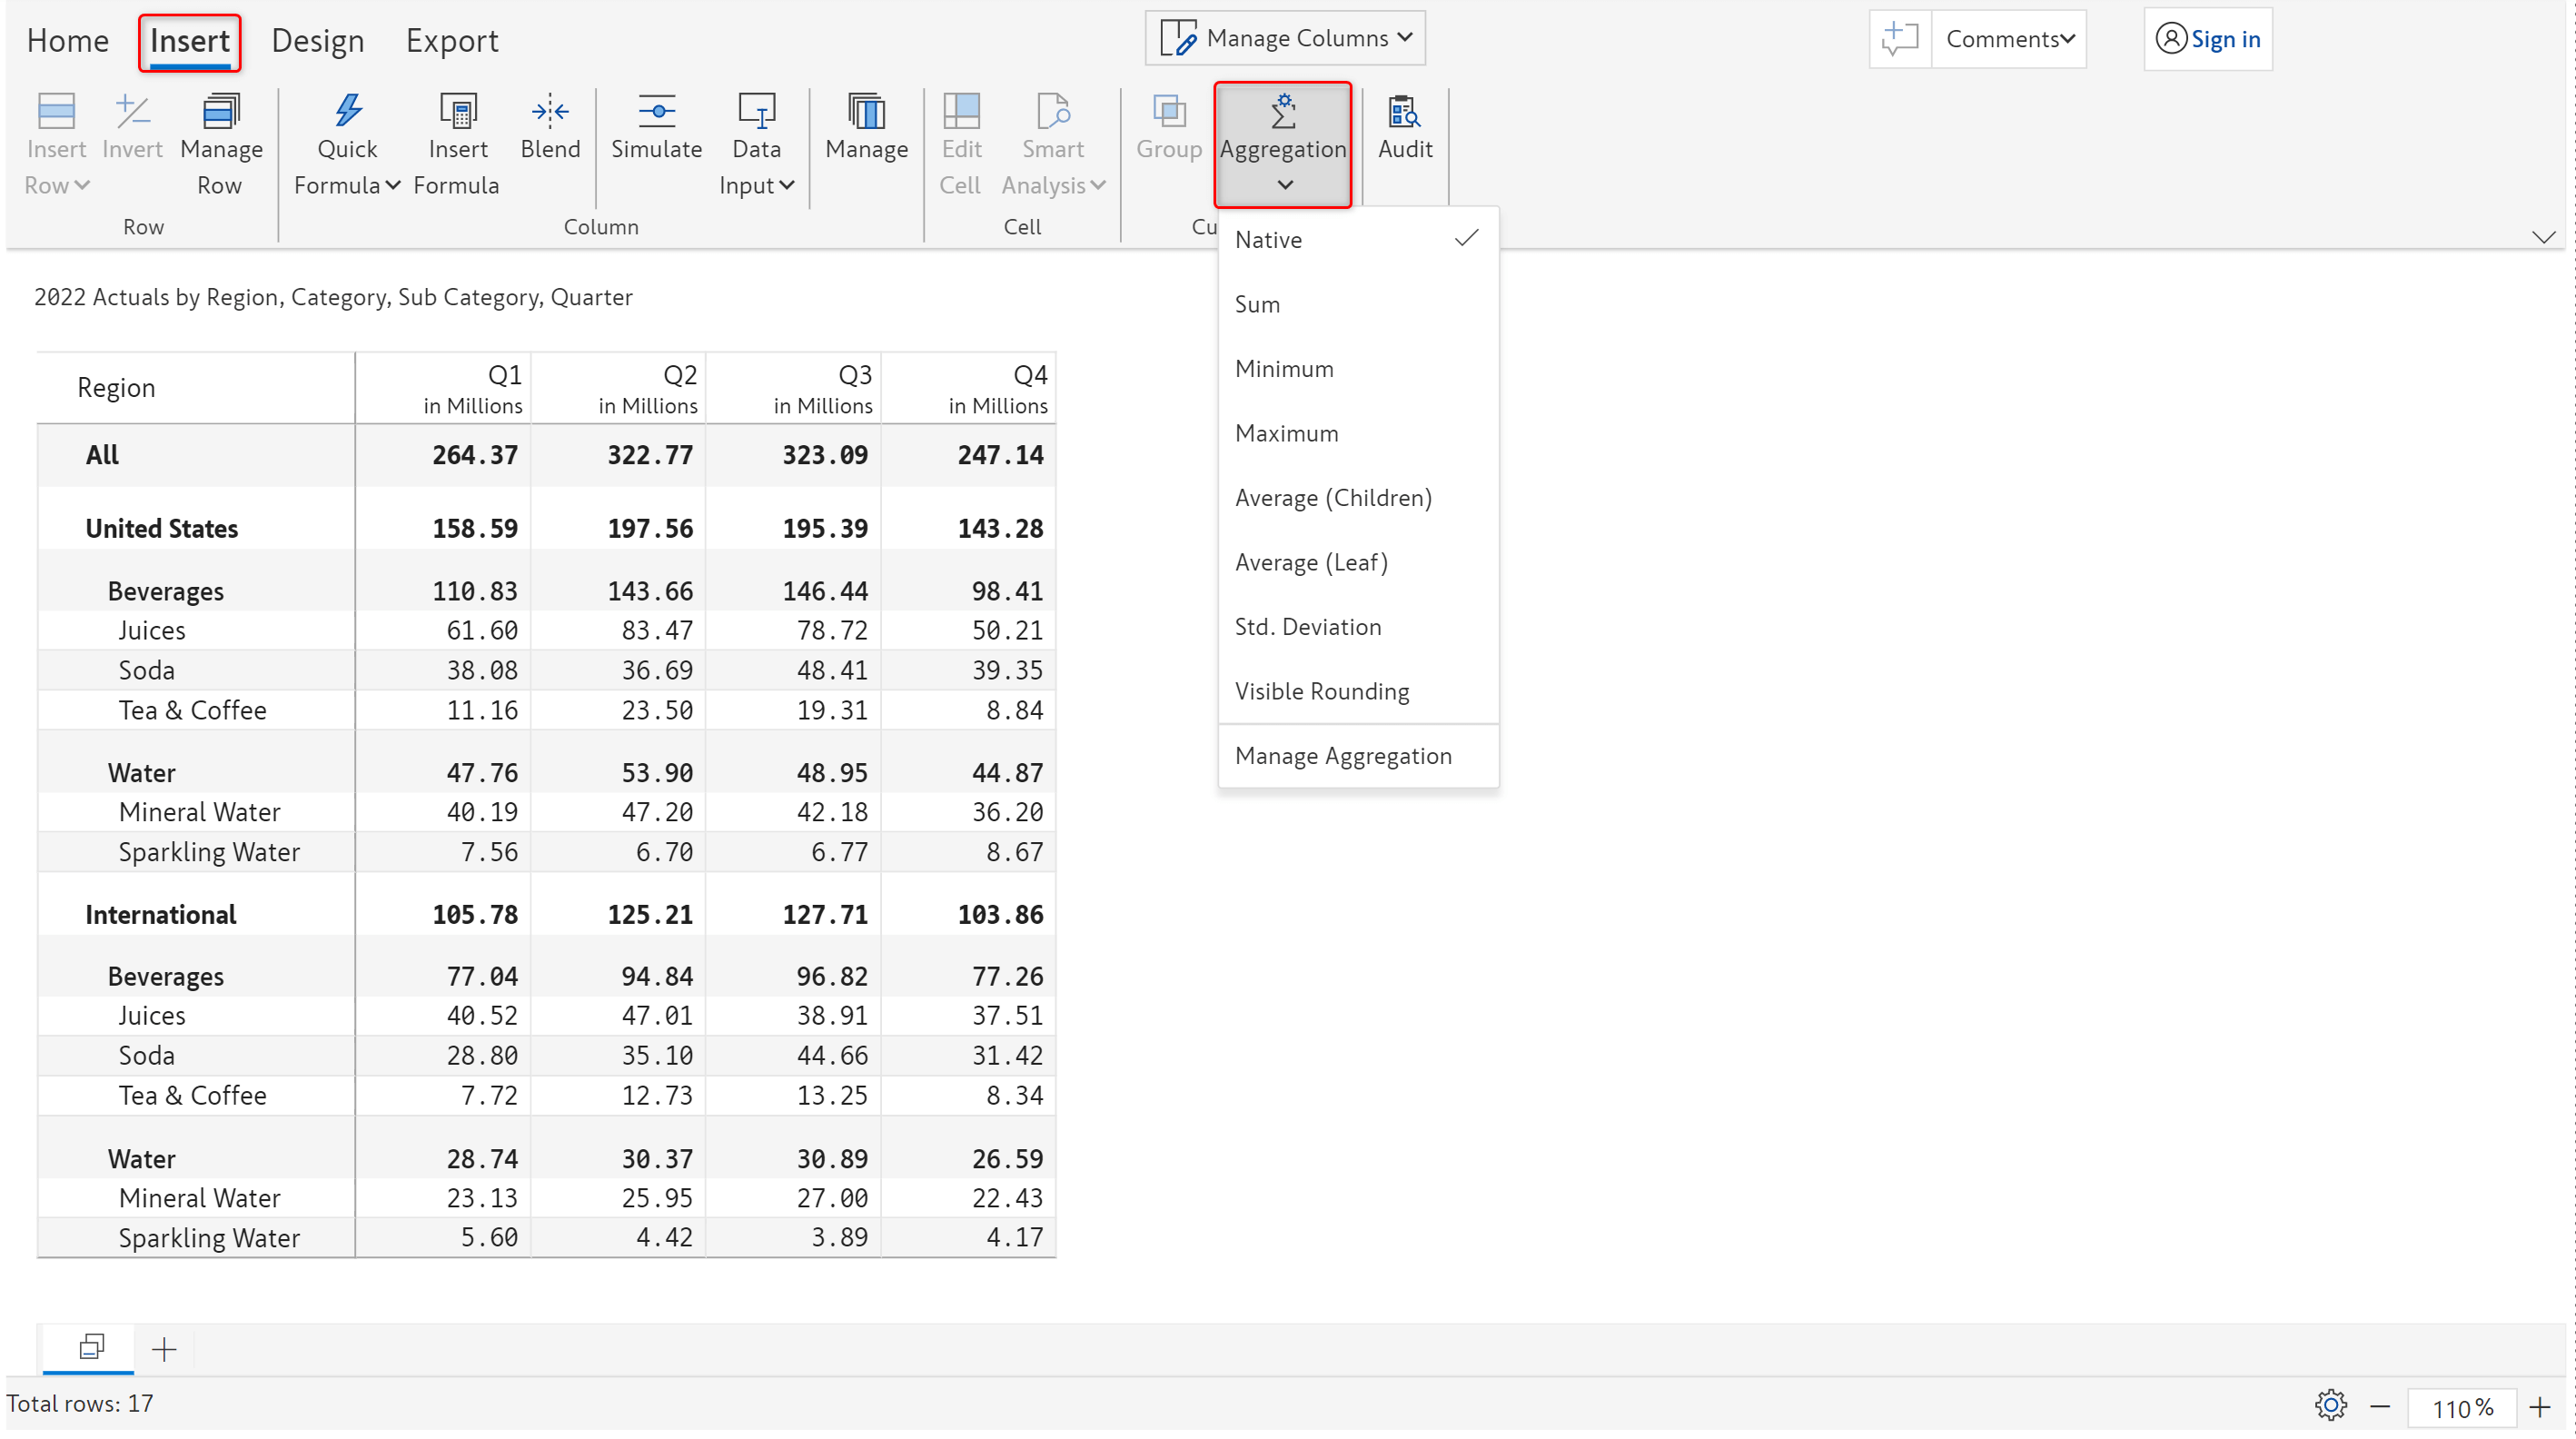
The new unified interface:
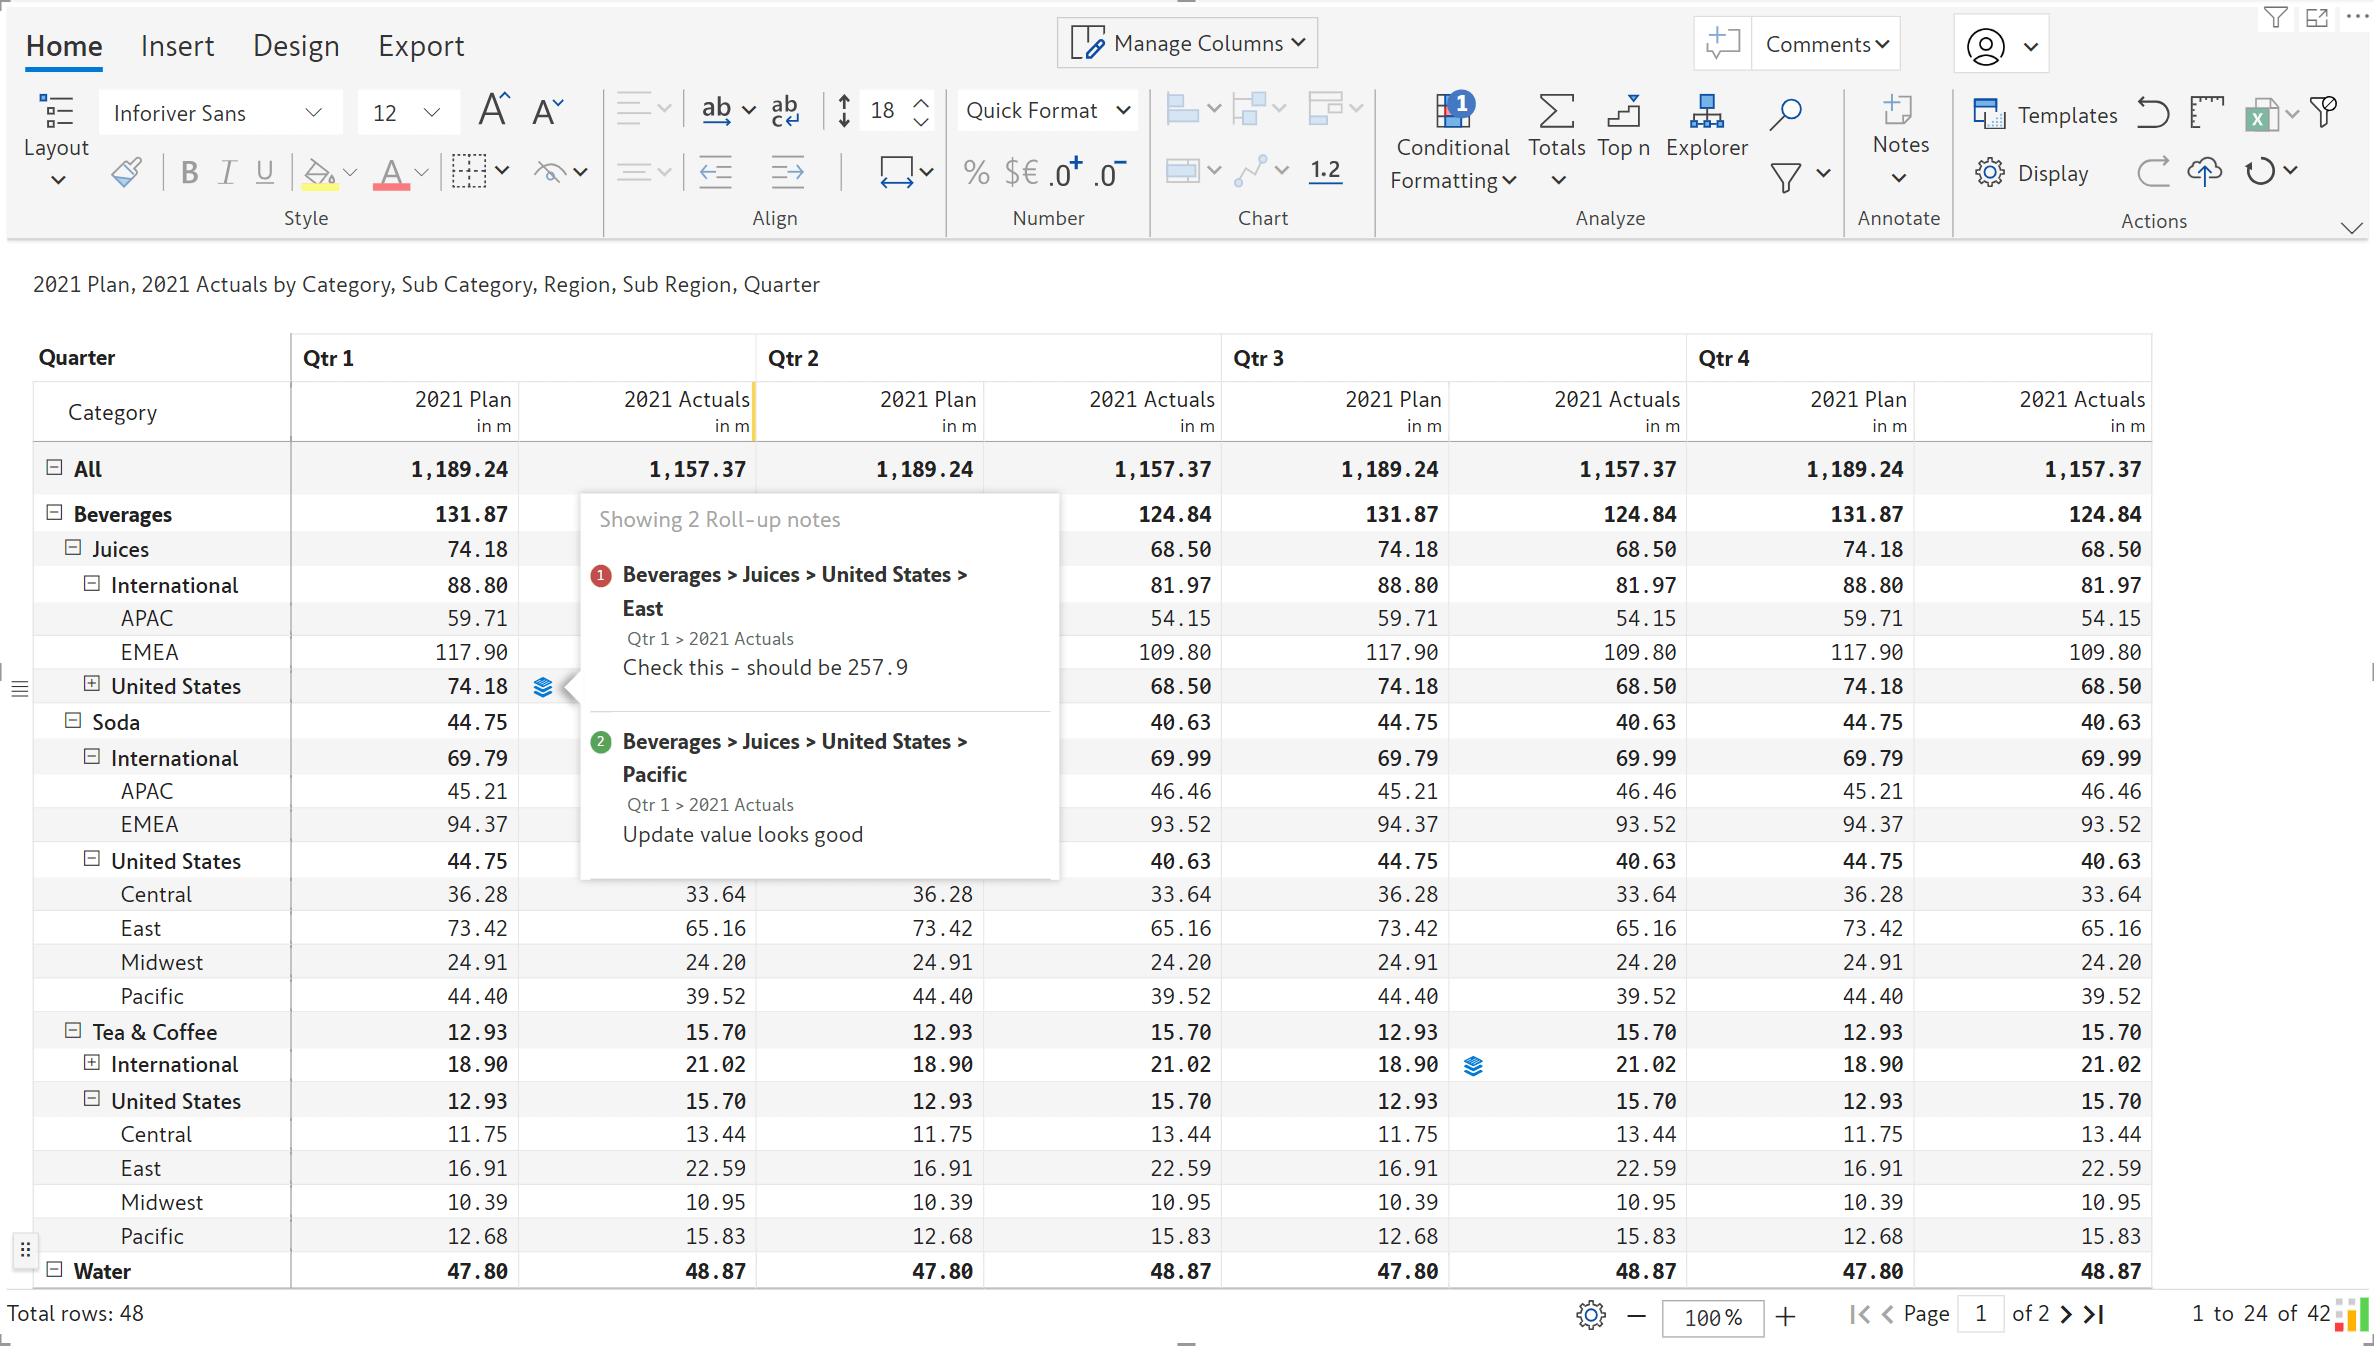
You can add context to your reports with Inforiver’s notes capability. In the April release, we introduced roll-up notes. In reports with many hierarchies, you can see notes rolled up at the subtotal and grand total levels, even if the hierarchies are collapsed.
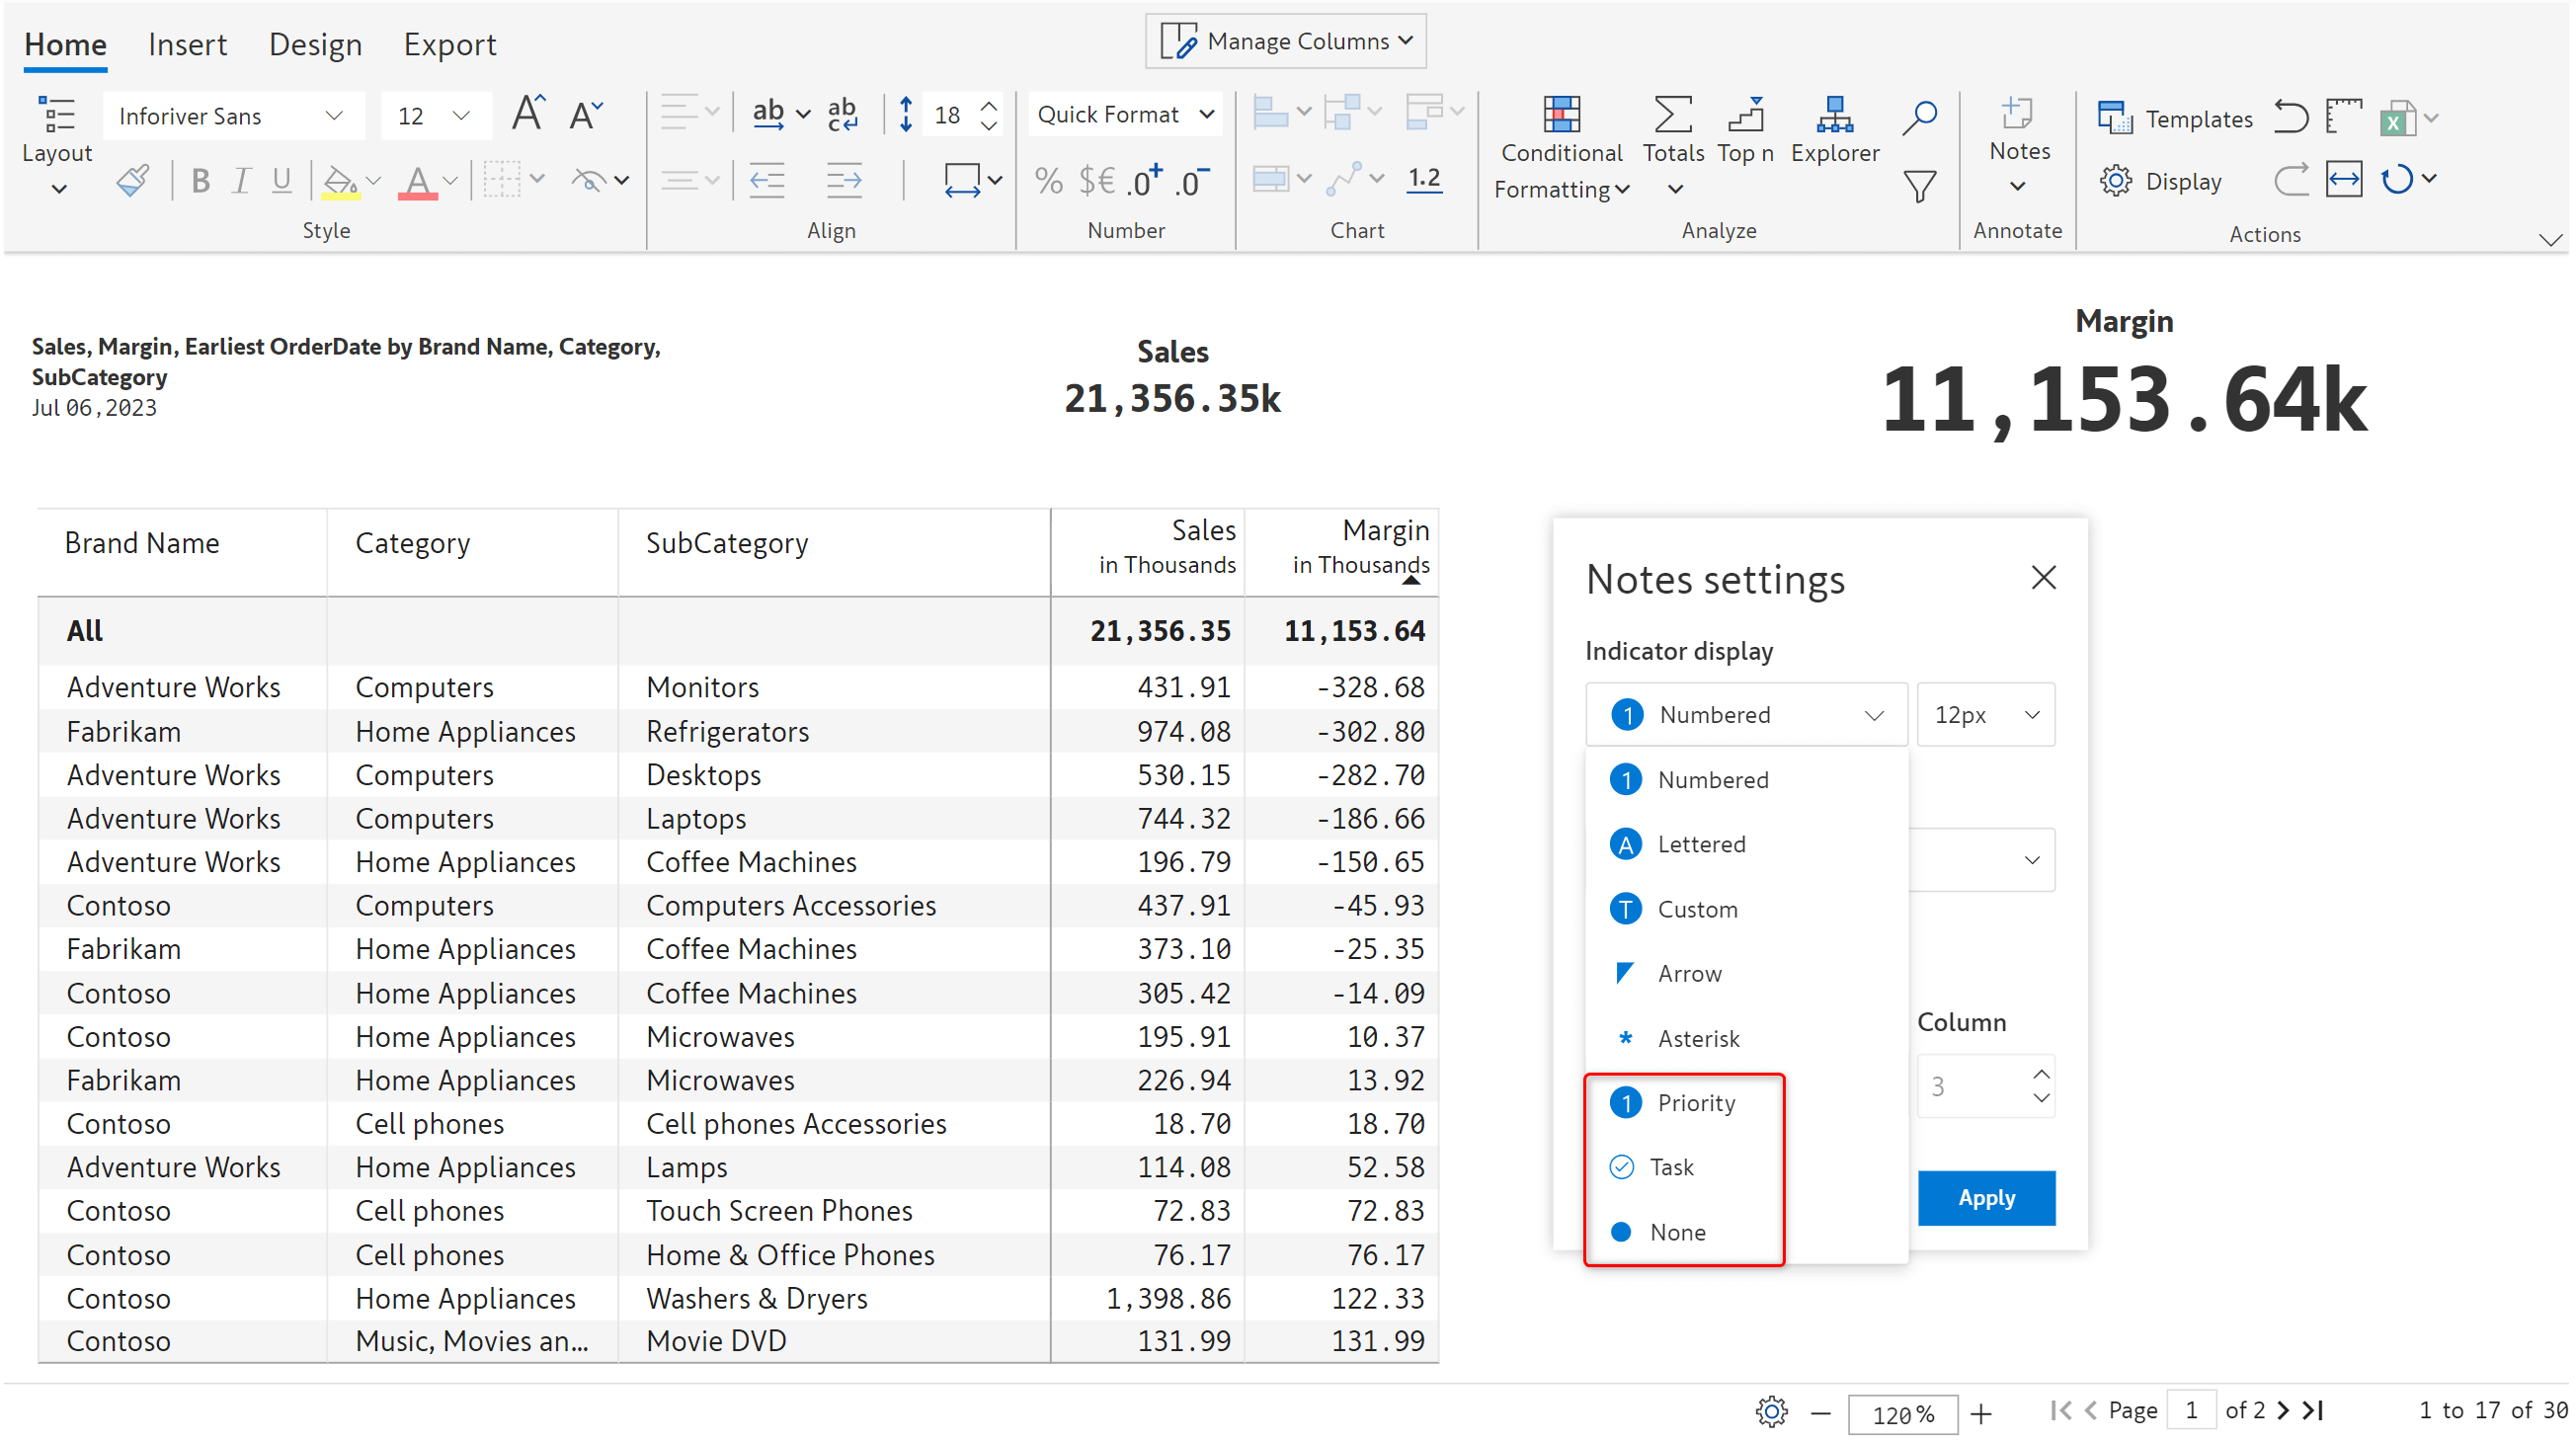
We also added new notes indicator types like priority, task, and none.
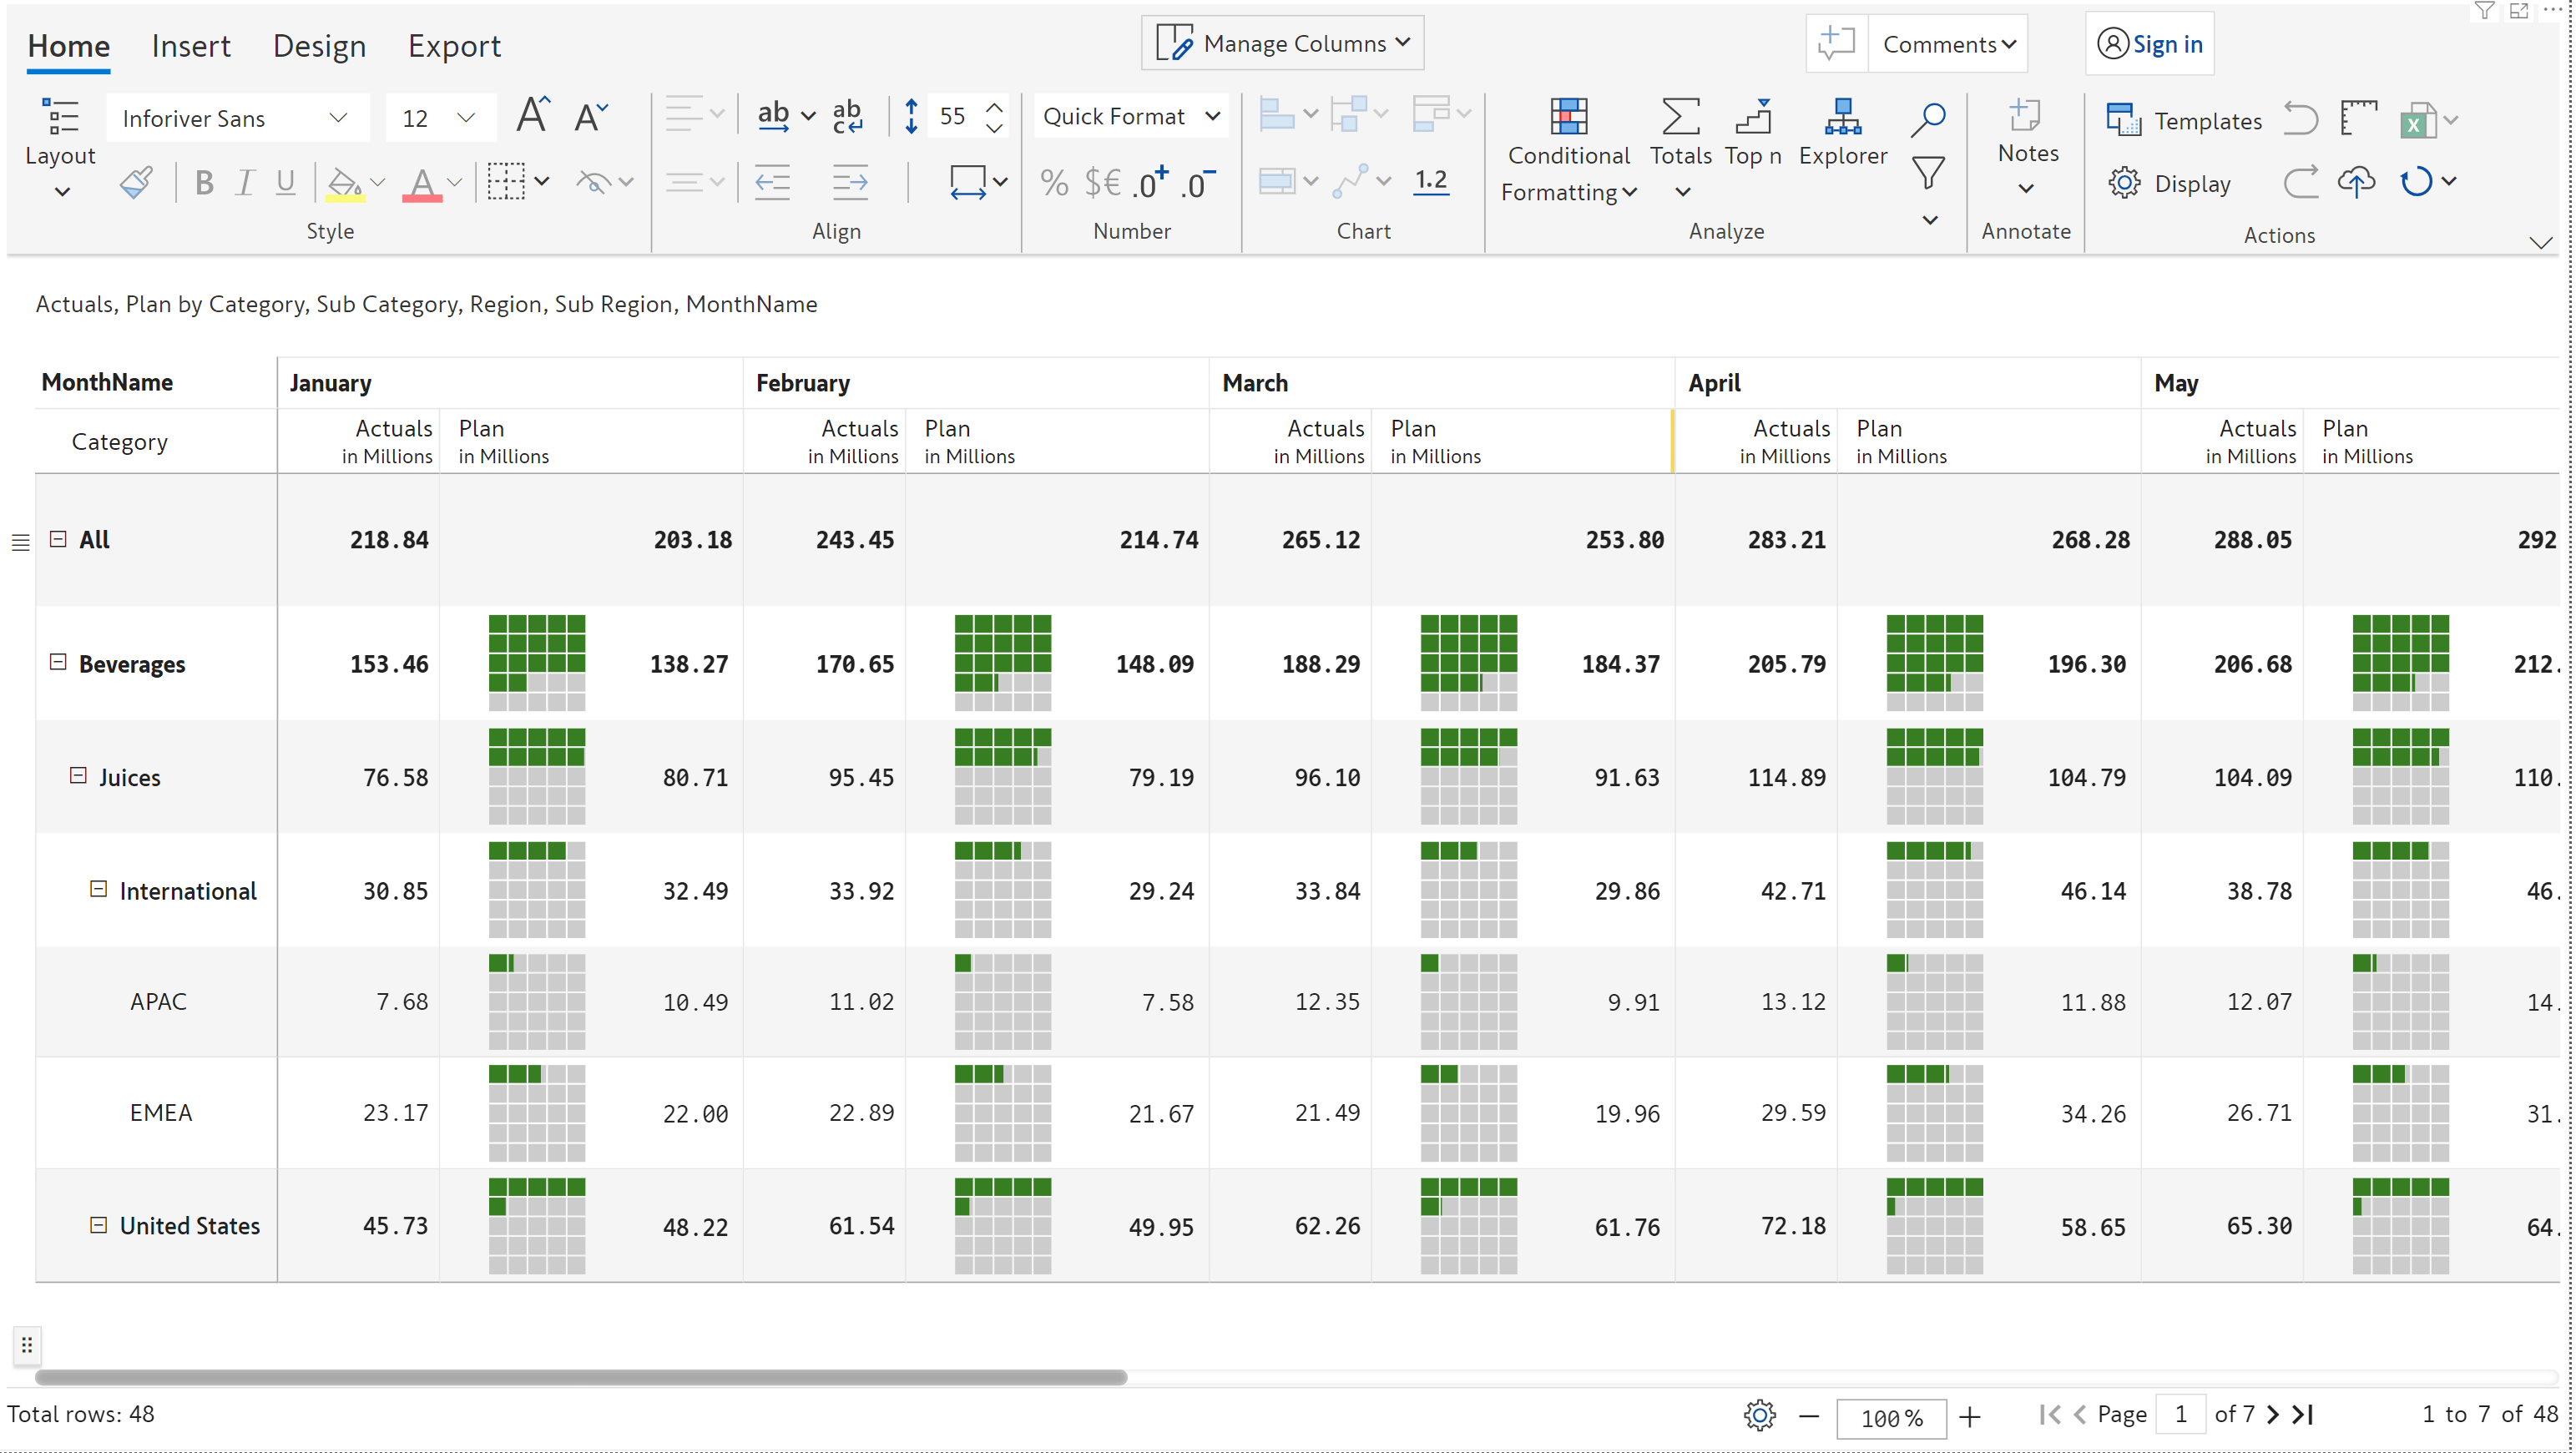
You can enrich your matrix reports with two new chart types: the waffle and range bar.
The refinements that we continuously make to Inforiver were only possible with your support and feedback. We look forward to receiving your suggestions and have many more exciting innovations lined up for 2024! Visit the Inforiver Community to share your ideas, vote on other submissions, and interact with other users.
Inforiver helps enterprises consolidate planning, reporting & analytics on a single platform (Power BI). The no-code, self-service award-winning platform has been recognized as the industry’s best and is adopted by many Fortune 100 firms.
Inforiver is a product of Lumel, the #1 Power BI AppSource Partner. The firm serves over 3,000 customers worldwide through its portfolio of products offered under the brands Inforiver, EDITable, ValQ, and xViz.