
Upcoming webinar on 'Inforiver Charts : The fastest way to deliver stories in Power BI', Aug 29th , Monday, 10.30 AM CST. Register Now
Upcoming webinar on 'Inforiver Charts : The fastest way to deliver stories in Power BI', Aug 29th , Monday, 10.30 AM CST. Register Now
Welcome to the Inforiver Enterprise 2.6 release update!
We are thrilled to announce several new features and key enhancements most anticipated by Inforiver user community – including writeback, forecasting, data input, scenarios, and collaboration!
Key enhancements in this release are listed below. Feel free to use the shortcuts to jump to any specific section!
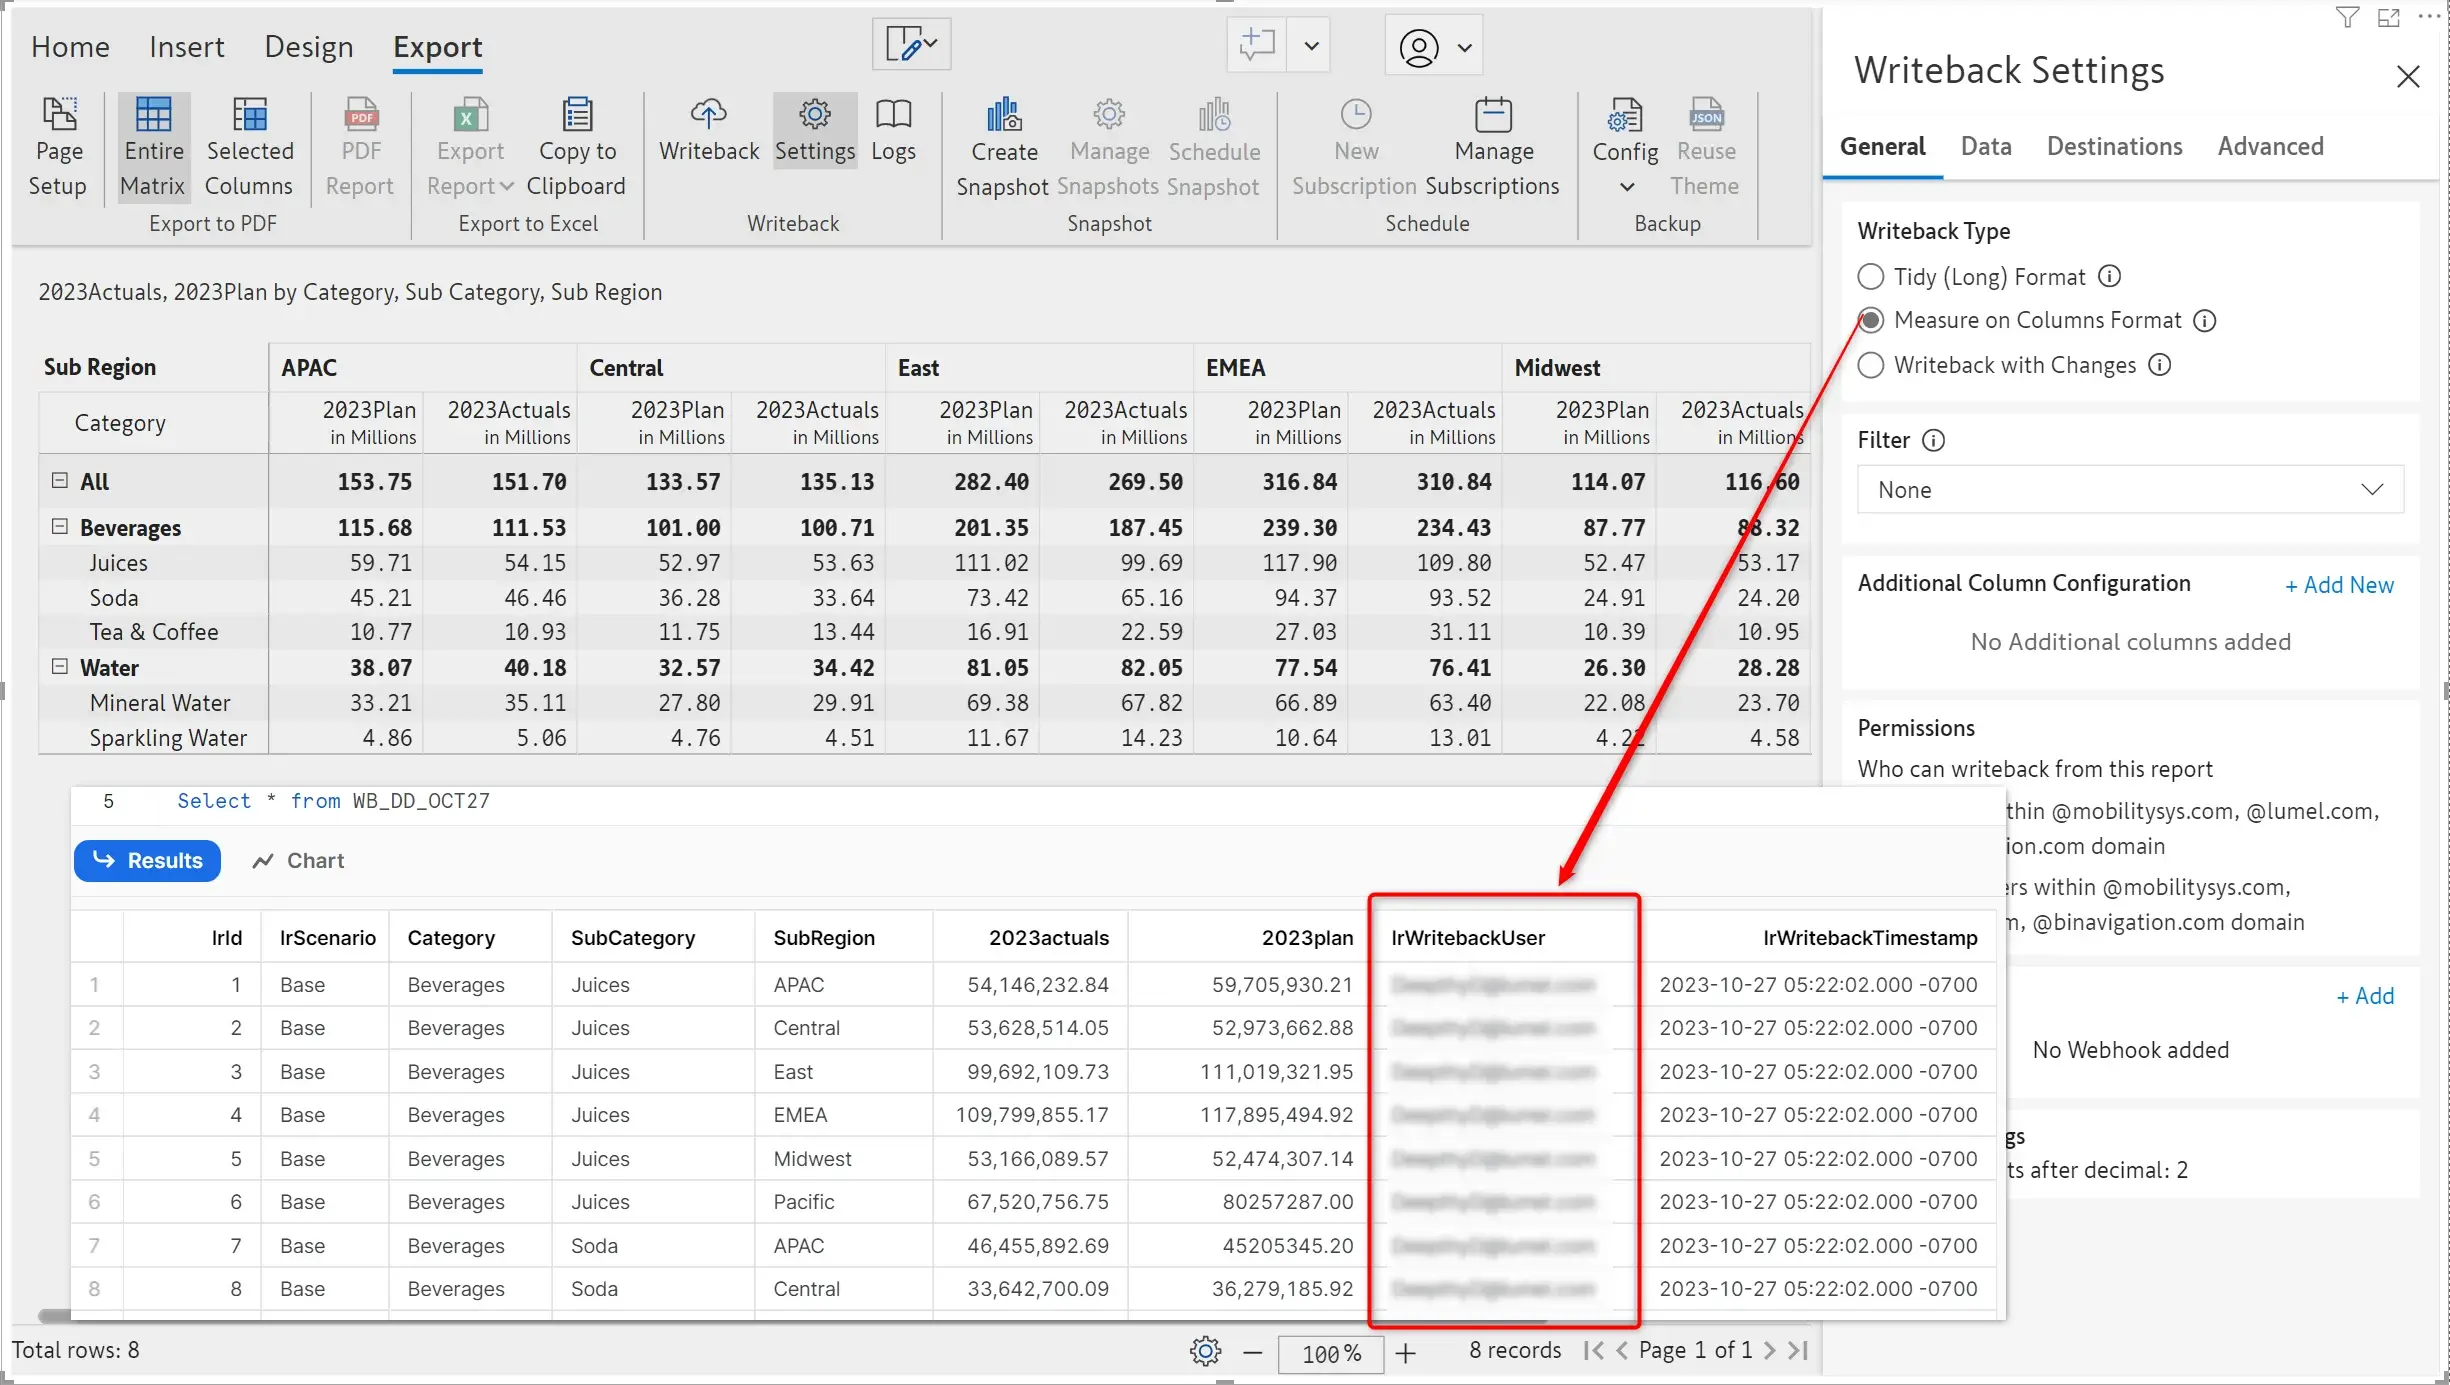
With this release, Inforiver tracks which user performed the writeback in a separate housekeeping column. Note that the user is recorded only when you write back using the ‘Measure on Columns’ format (i.e., when each measure is captured in a separate column in the backend).
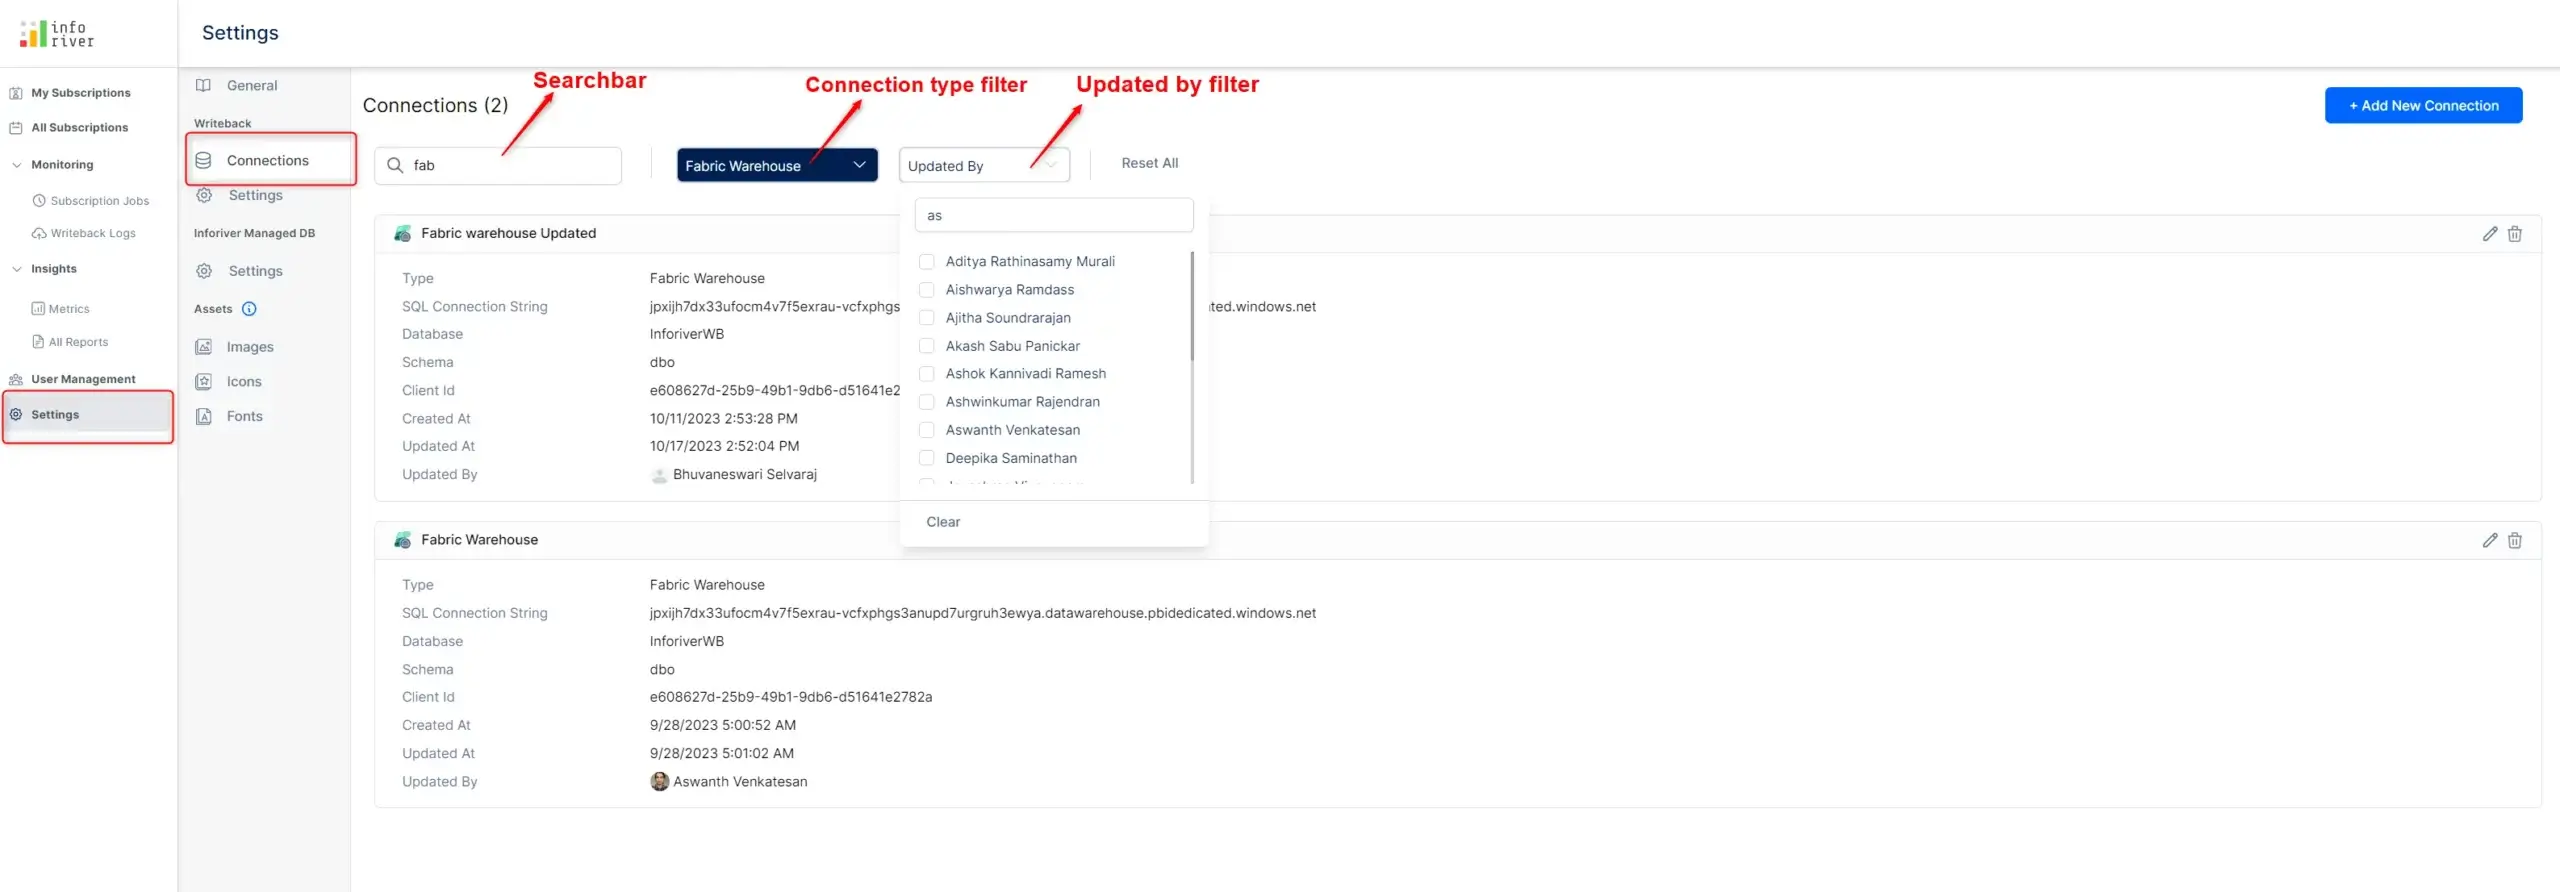
If you are working with multiple writeback connections used by multiple reports to write to multiple destinations, you can access these writeback connections in a much simpler way. Inforiver now provides comprehensive filters and search bars to access your connections quickly.
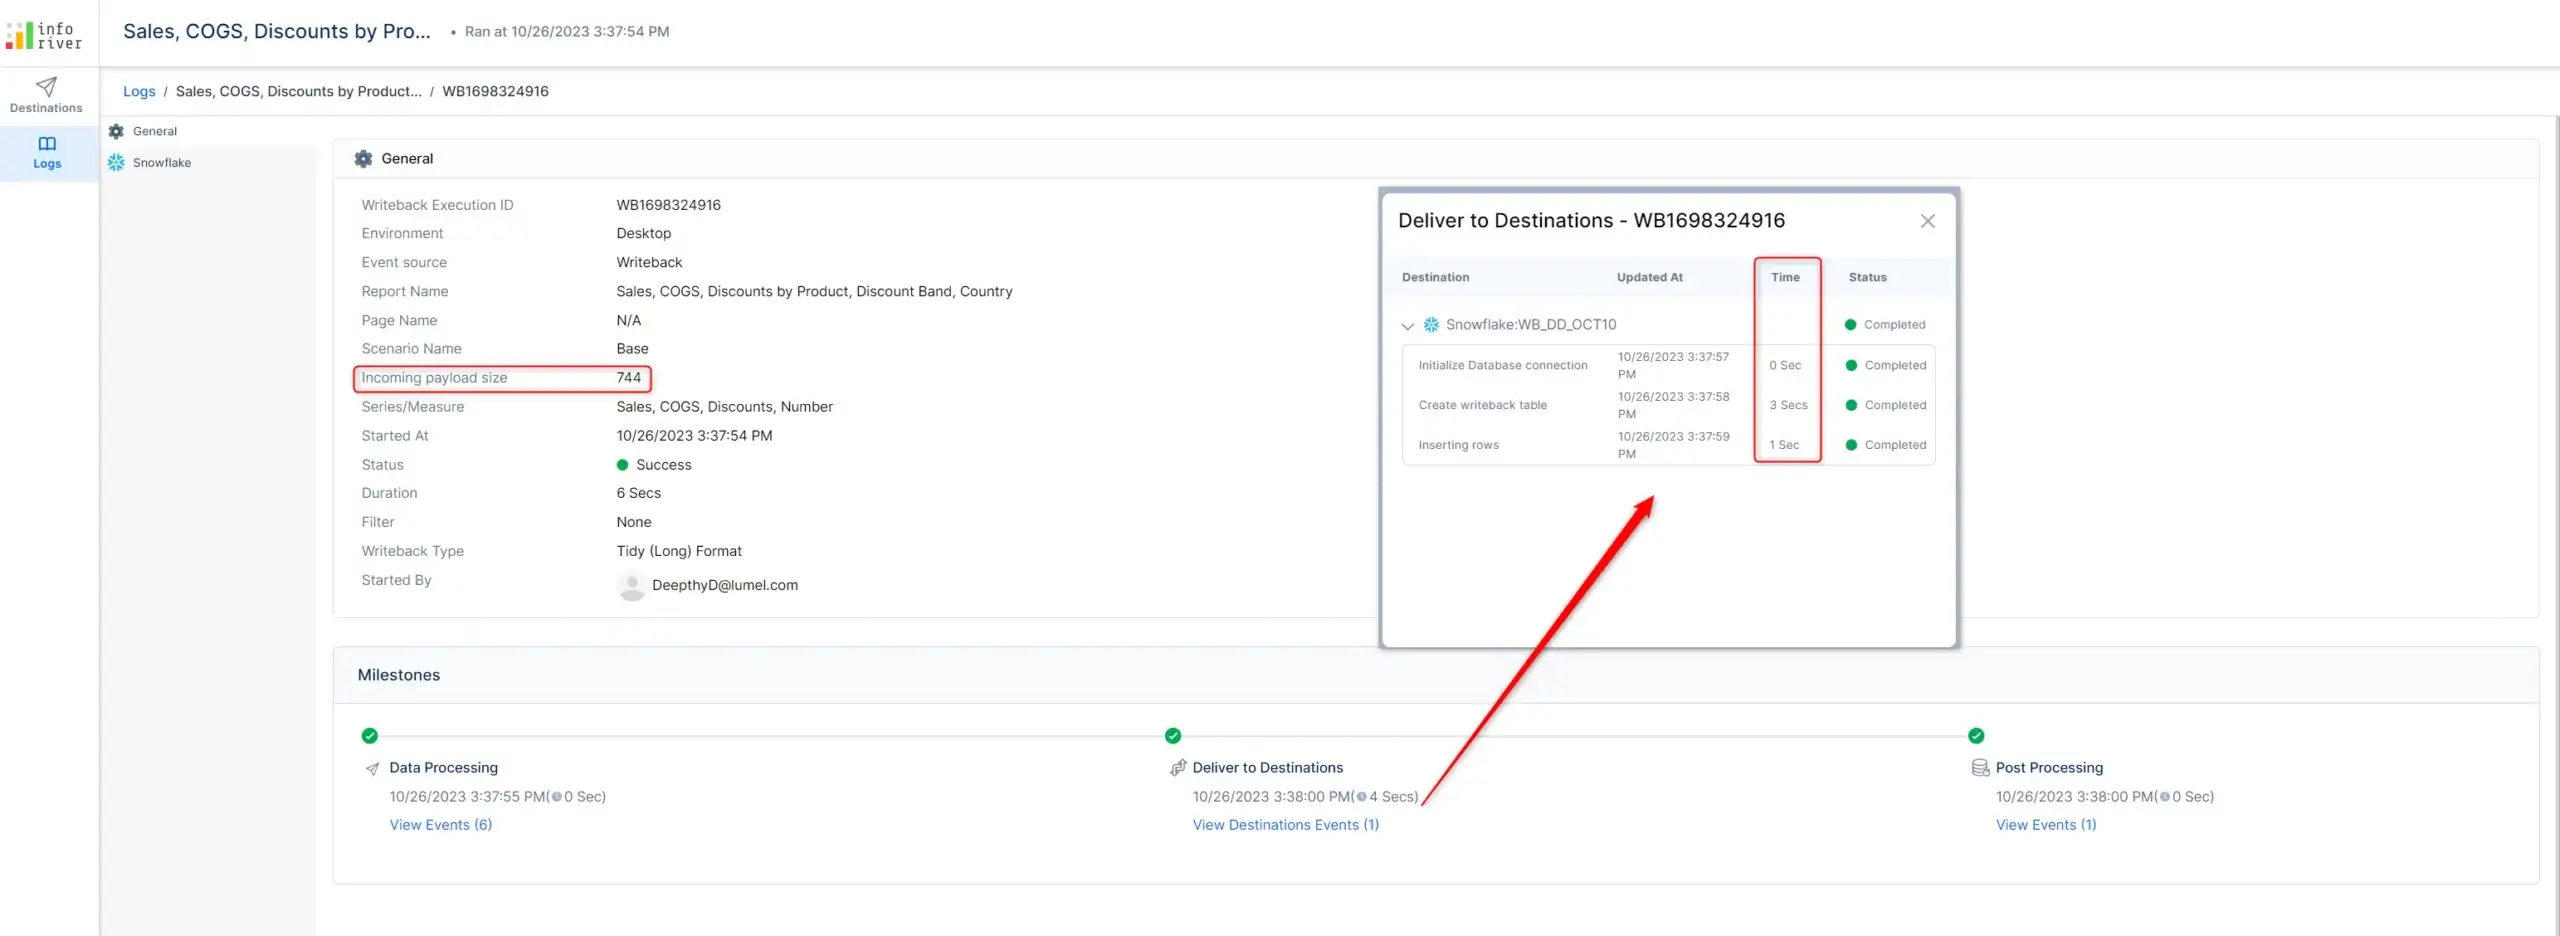
From this release, Inforiver tracks the payload size (number of records) and the amount of time it took to execute each milestone during writeback.
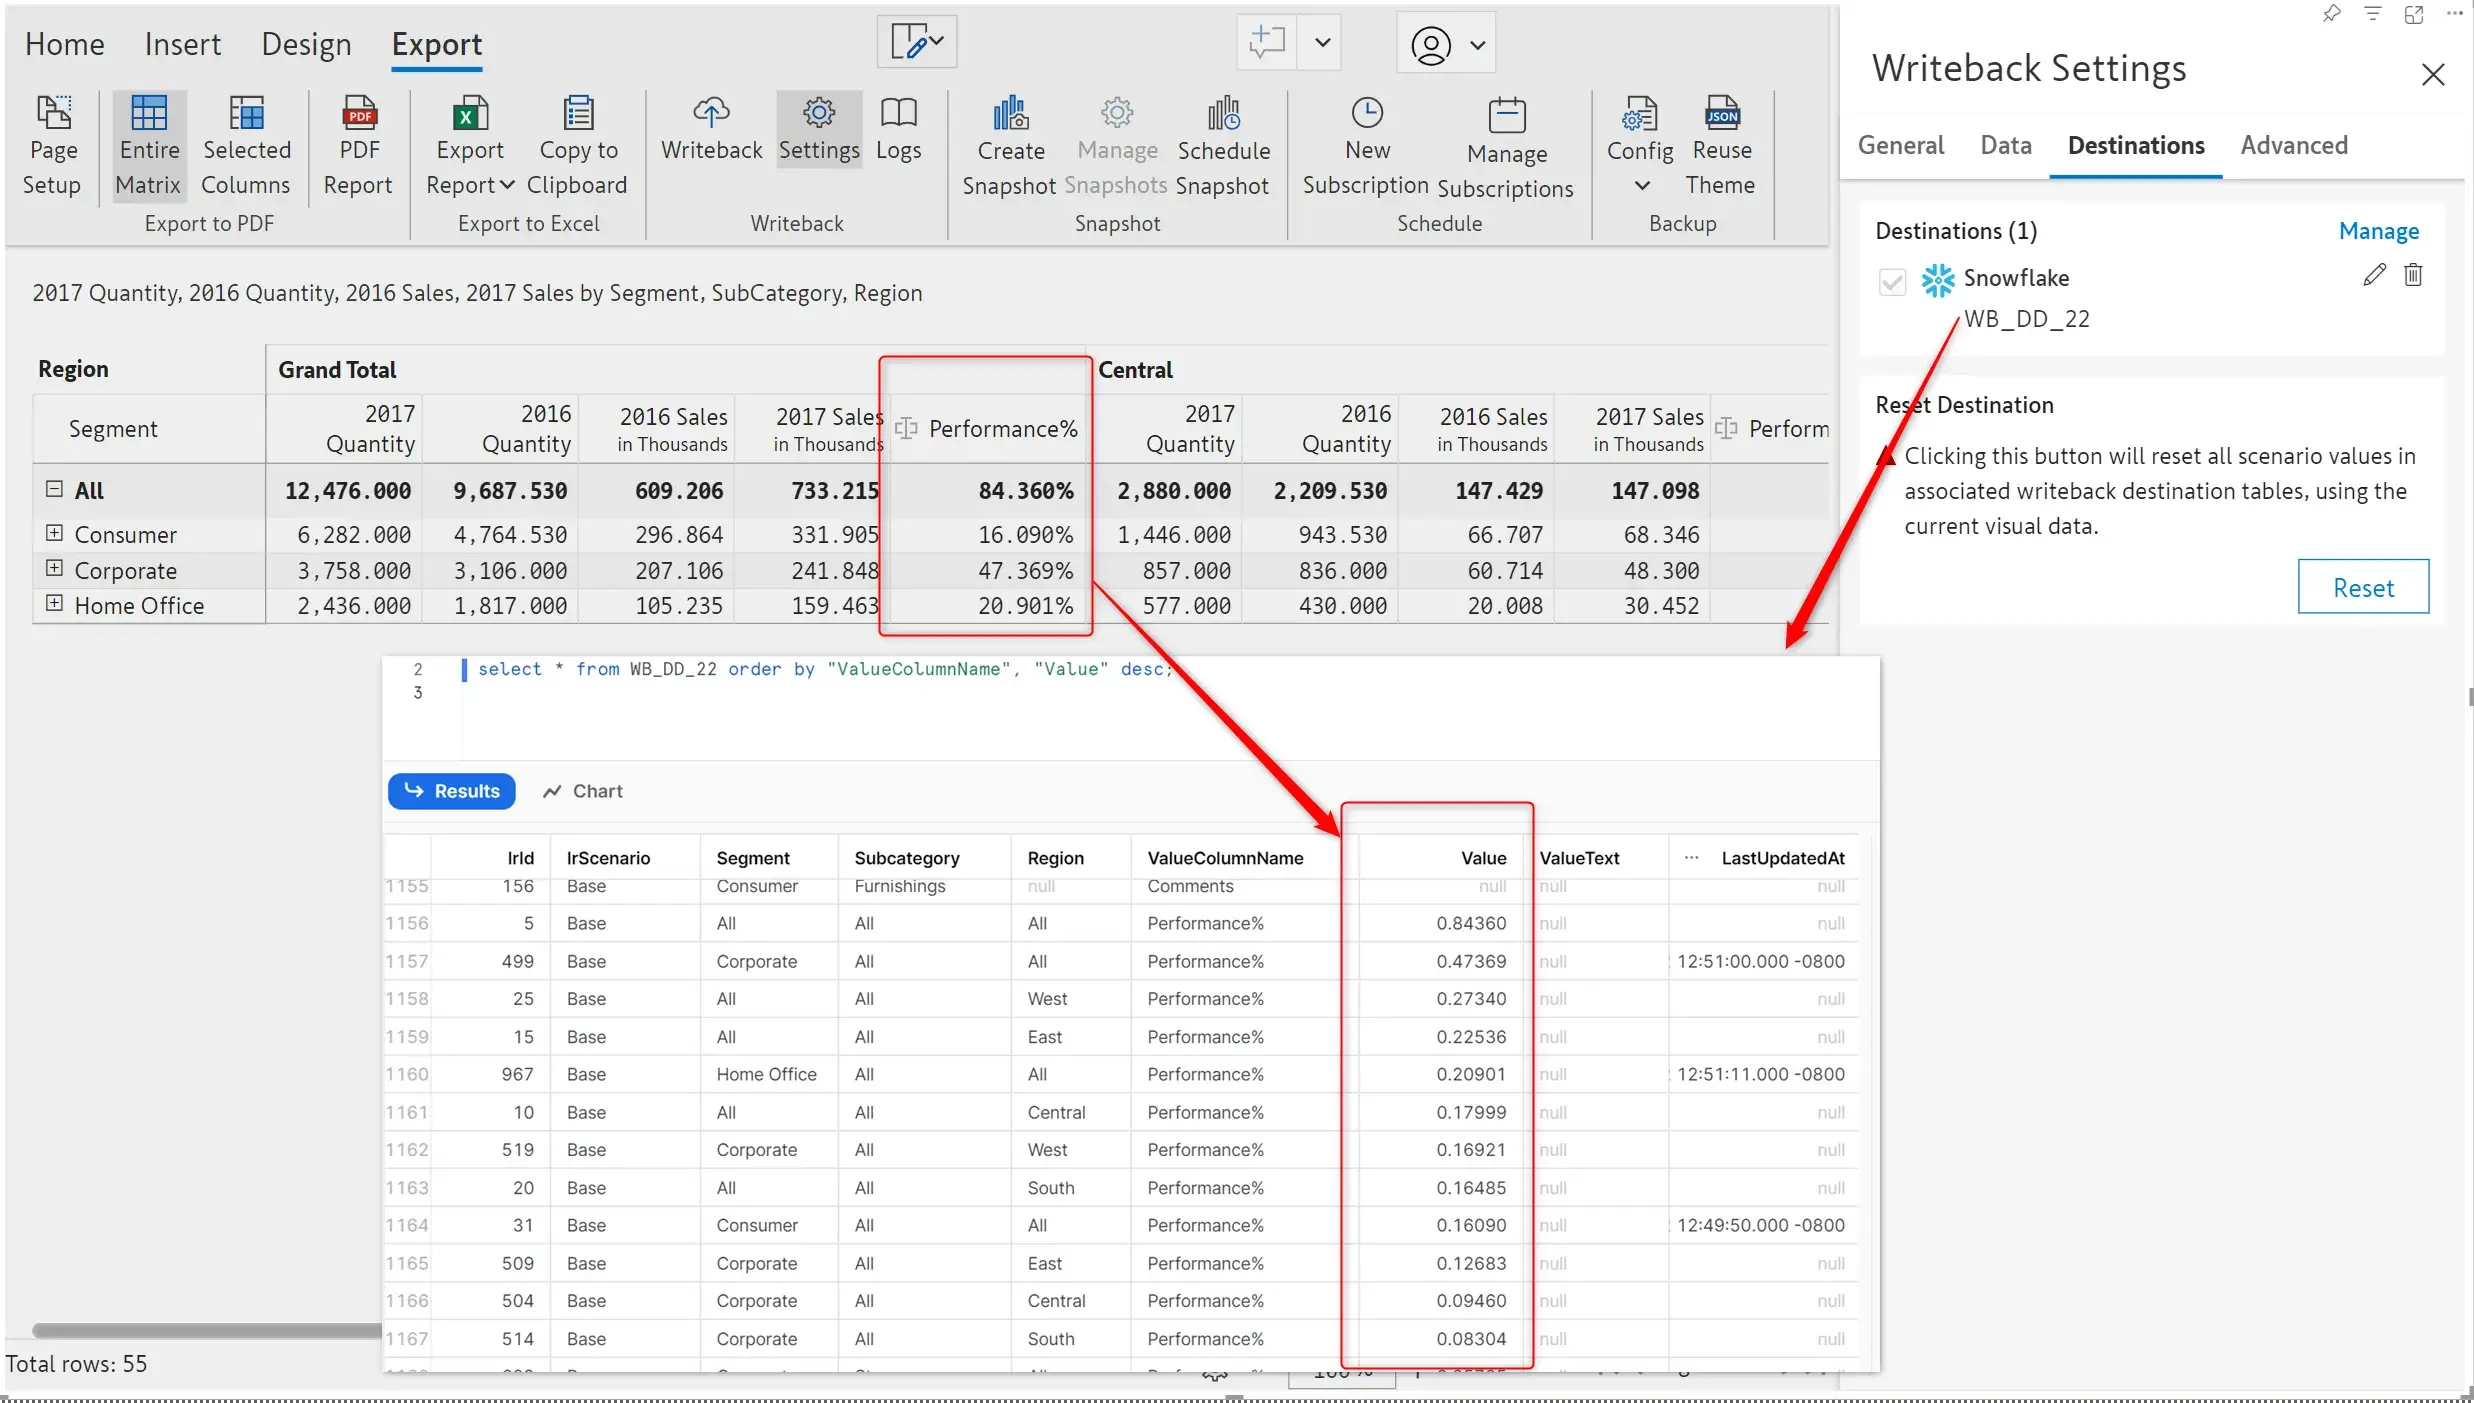
With the latest release, during writeback, Inforiver rounds off all numeric values including percentages to a specified number of decimal points as per your configuration instructions. When you create the first connection, you can specify decimal precision for all connections in that report.
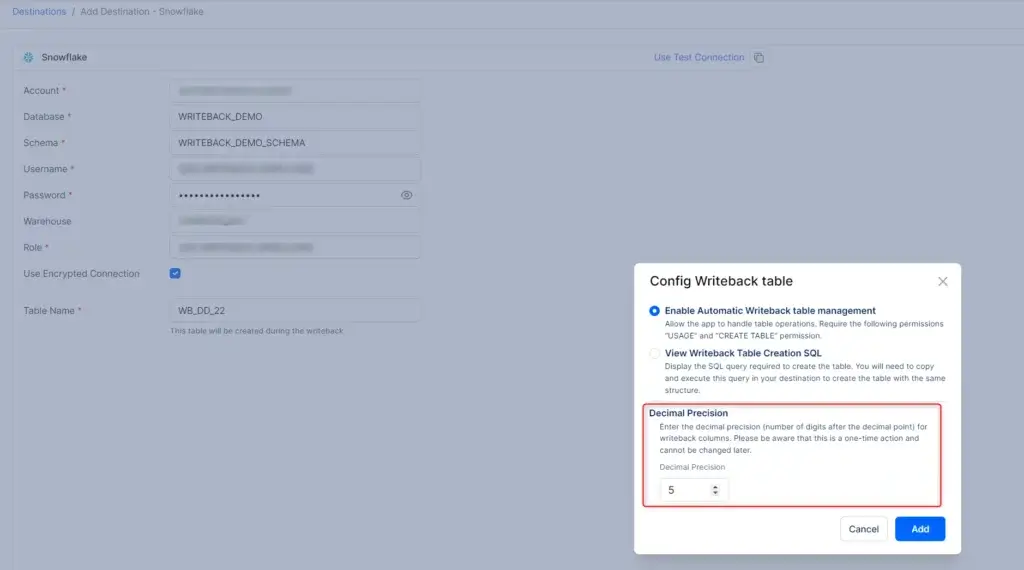
When you apply the settings as shown in the image above (5 decimal places) Inforiver writes back values (in Snowflake) as shown below.
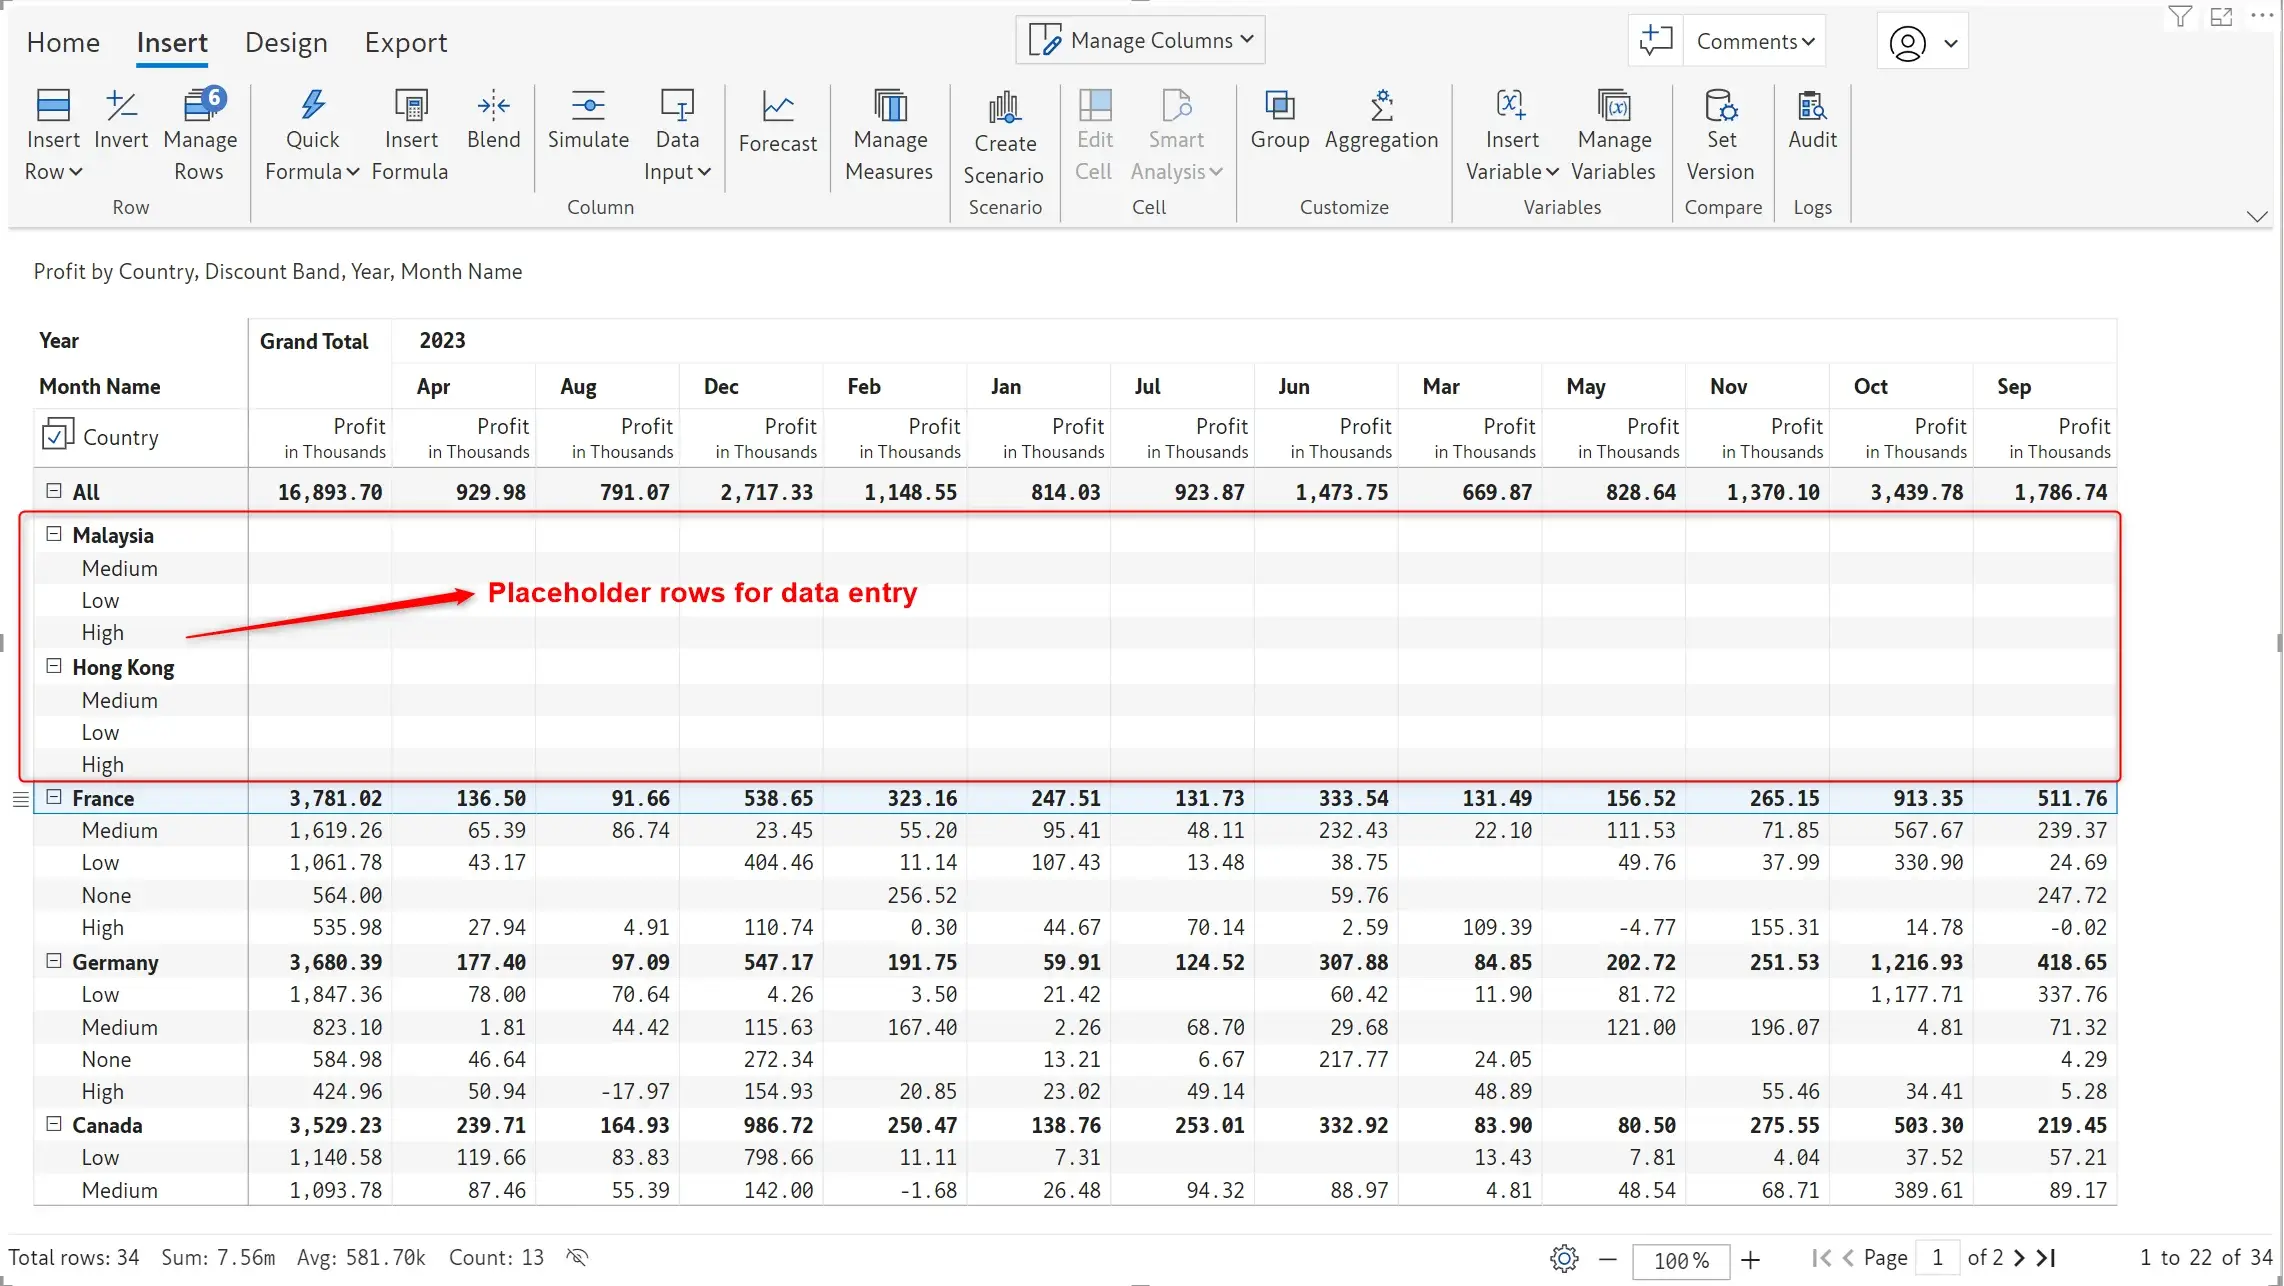
Inforiver has been providing the ability to insert rows where you can enter data manually. But what if you need to enter an entire hierarchy in your table with parents and descendants? Inforiver makes it easier for you so that you can enter an entire hierarchy in one go, rather than repeating the action. Use the ‘Multiple Static Row’ under the ‘Insert Row’ option to create a multi-level custom hierarchy with ease.
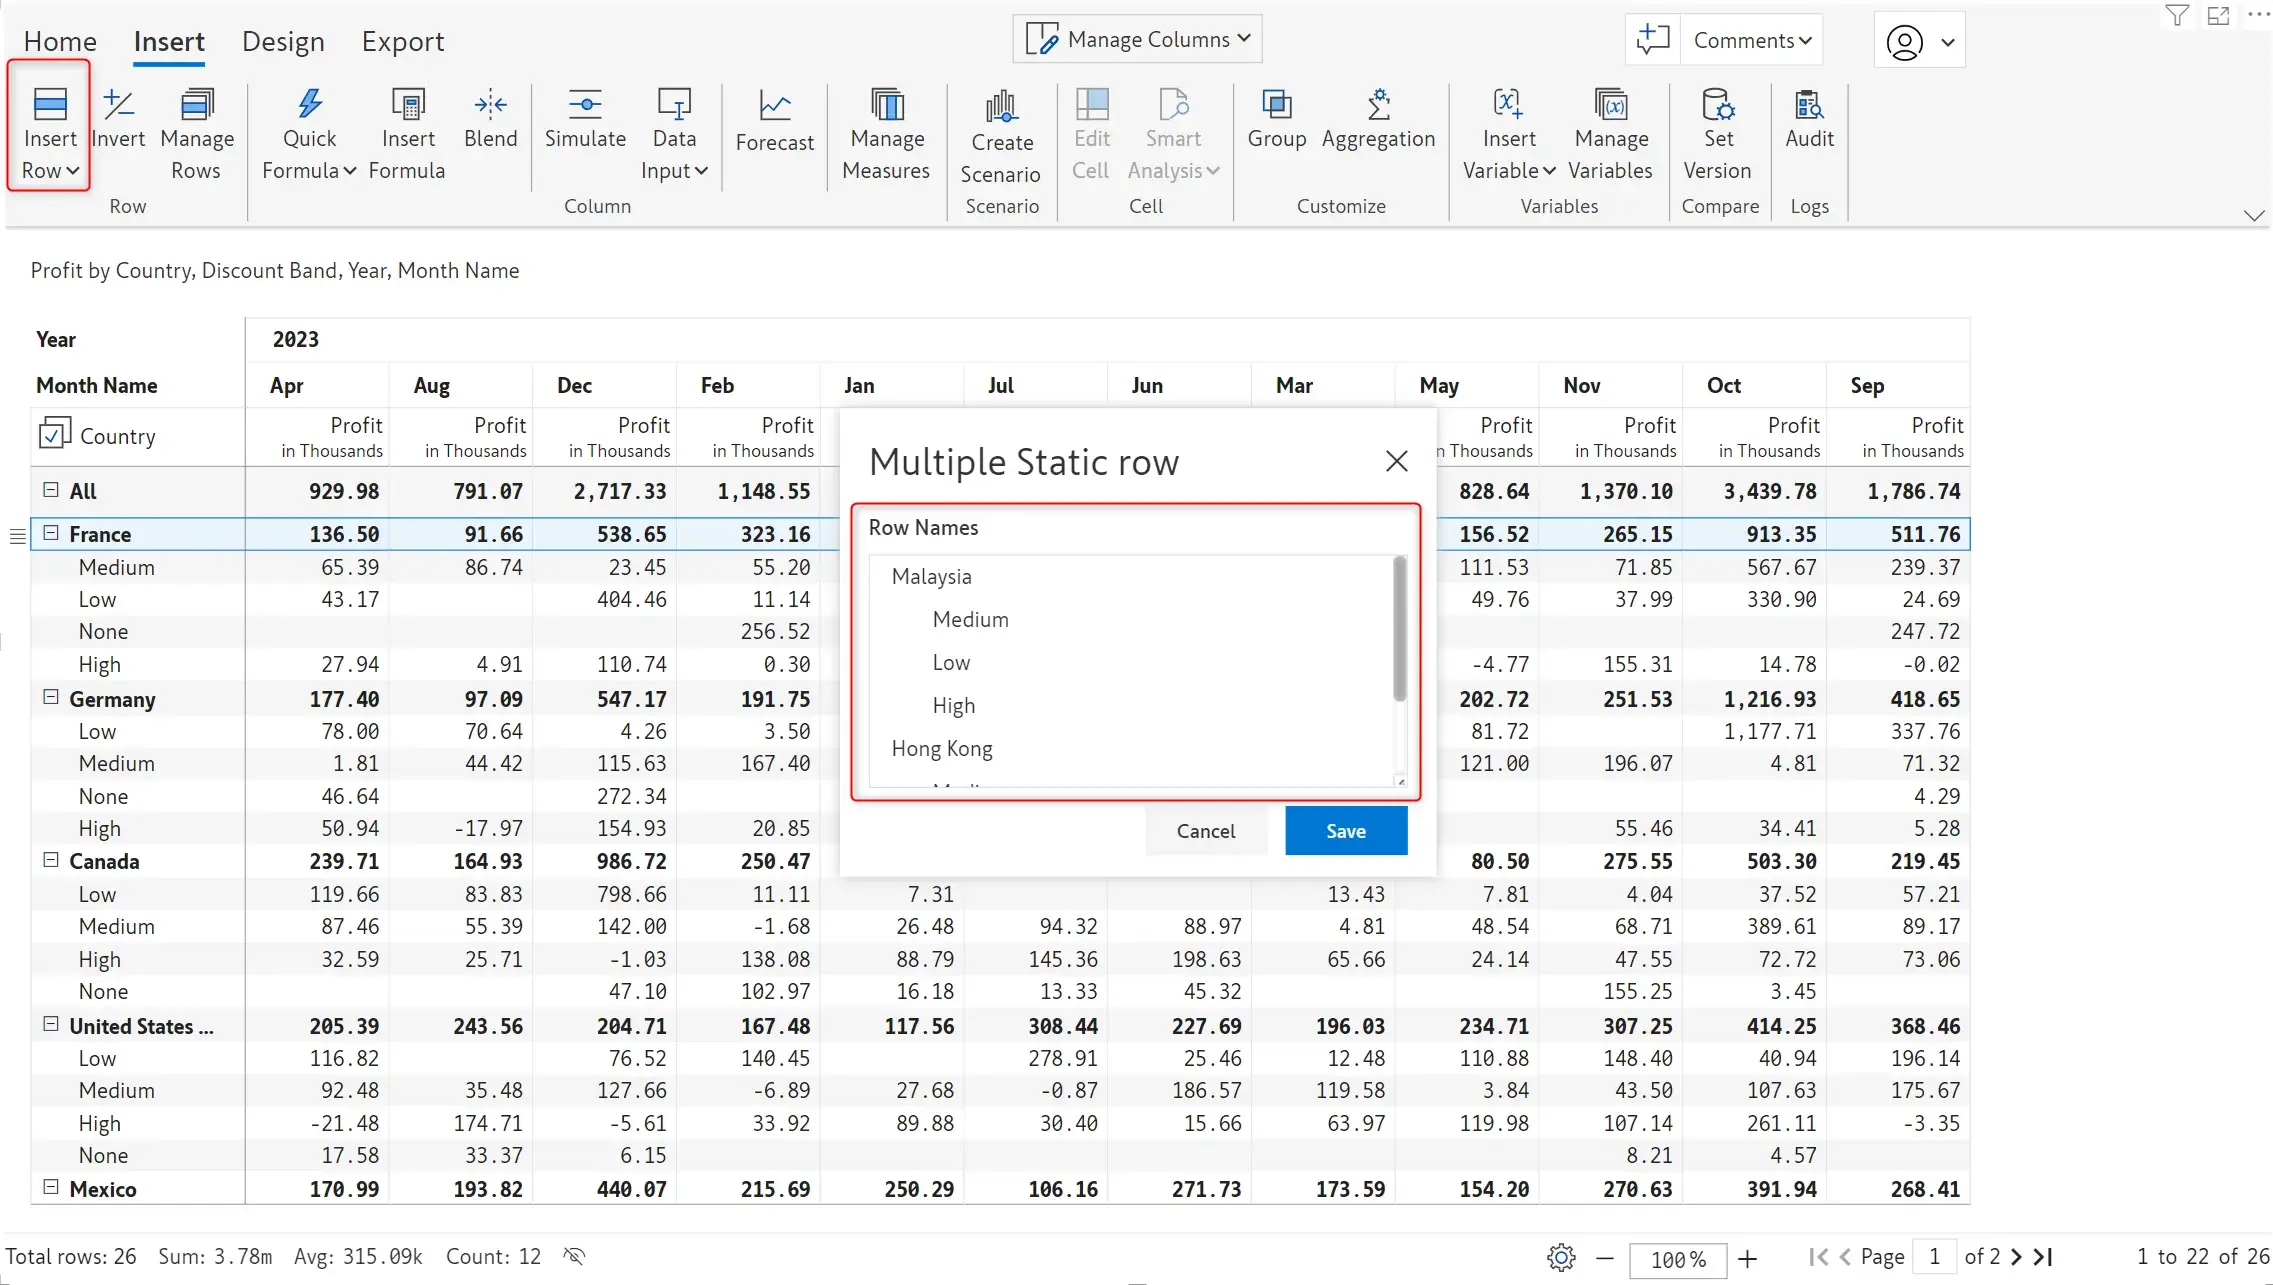
These rows can be subsequently inserted in your matrix after which you can enter data.
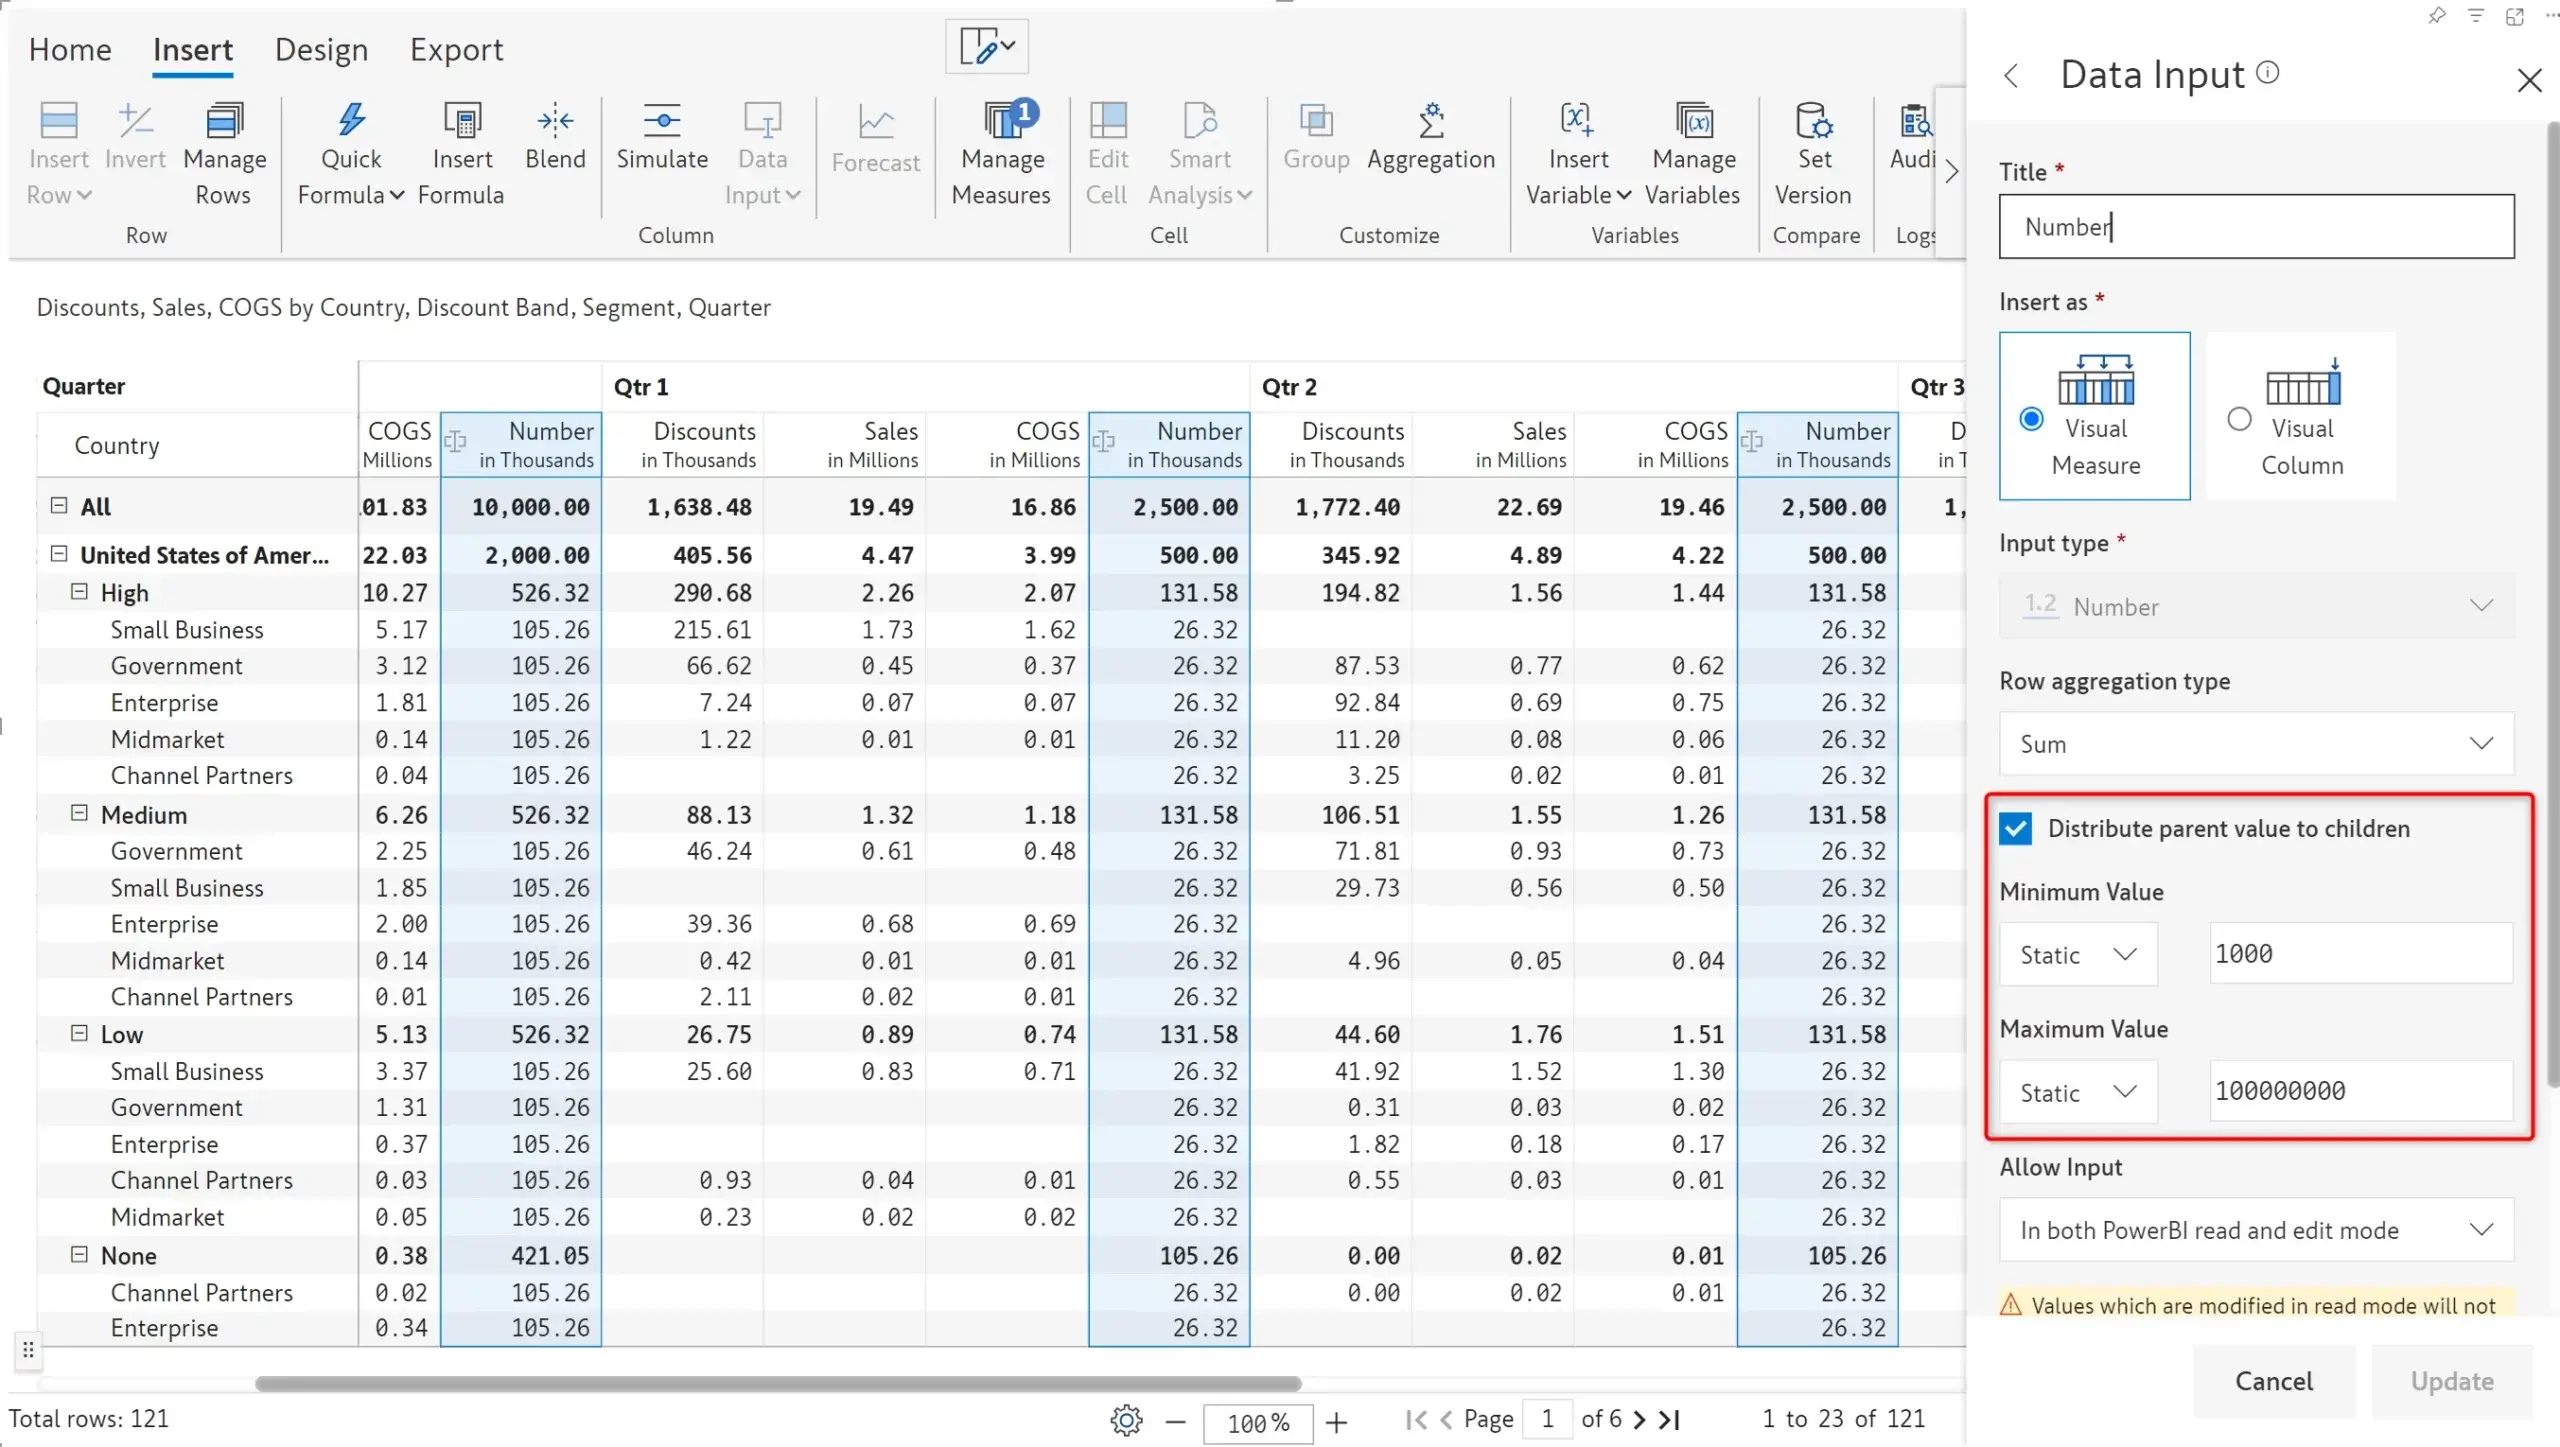
When you enter a value at parent level, Inforiver allows you to spread/allocate/distribute values to its descendants based on weights of other measures/columns. With this release, Inforiver also allows you to specify min/max thresholds for certain measures. This is useful when you want to place restrictions (e.g., headcount addition can be between 50 to 100) while planning & budgeting. If any user enters a value that violates this threshold, Inforiver generates a warning message.
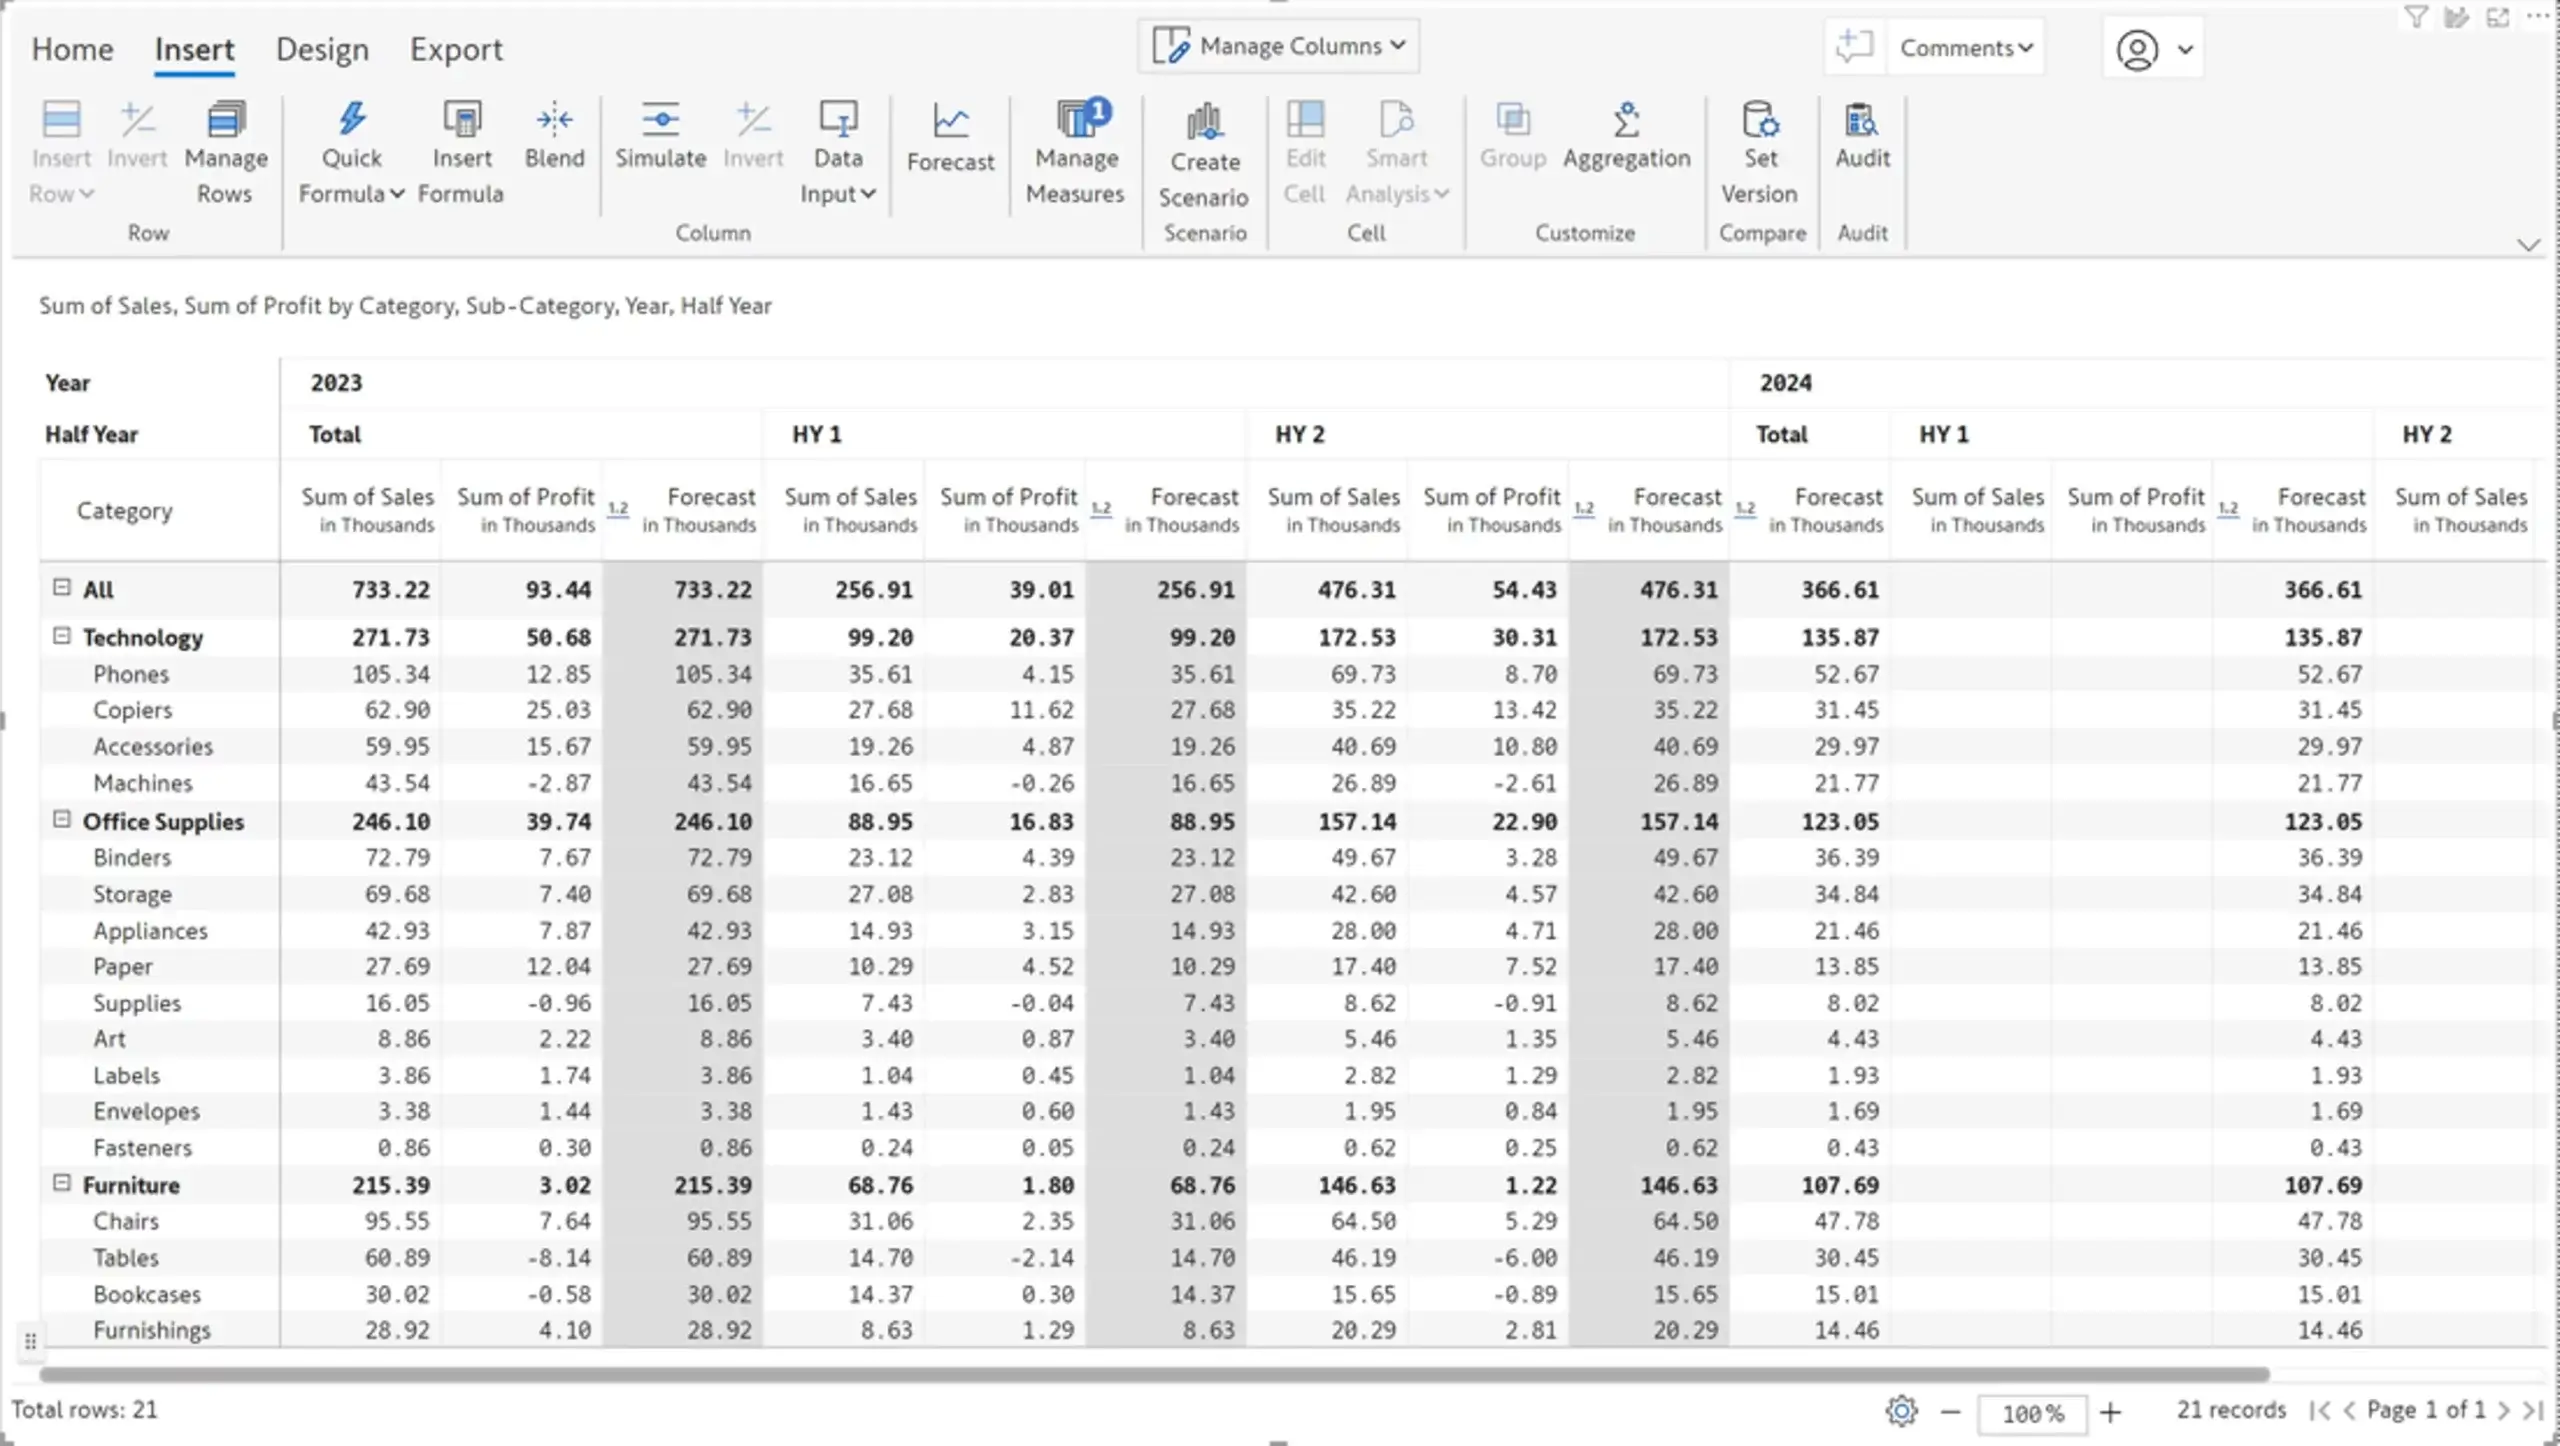
Half-yearly projections are commonly used in financial reporting. Inforiver's time intelligence engine now detects half-year formats against which you can enter your forecasts. You can also add half-year periods for the future manually in the visual (using the ‘Forecast’ feature) in case you do not have them available in the data model.
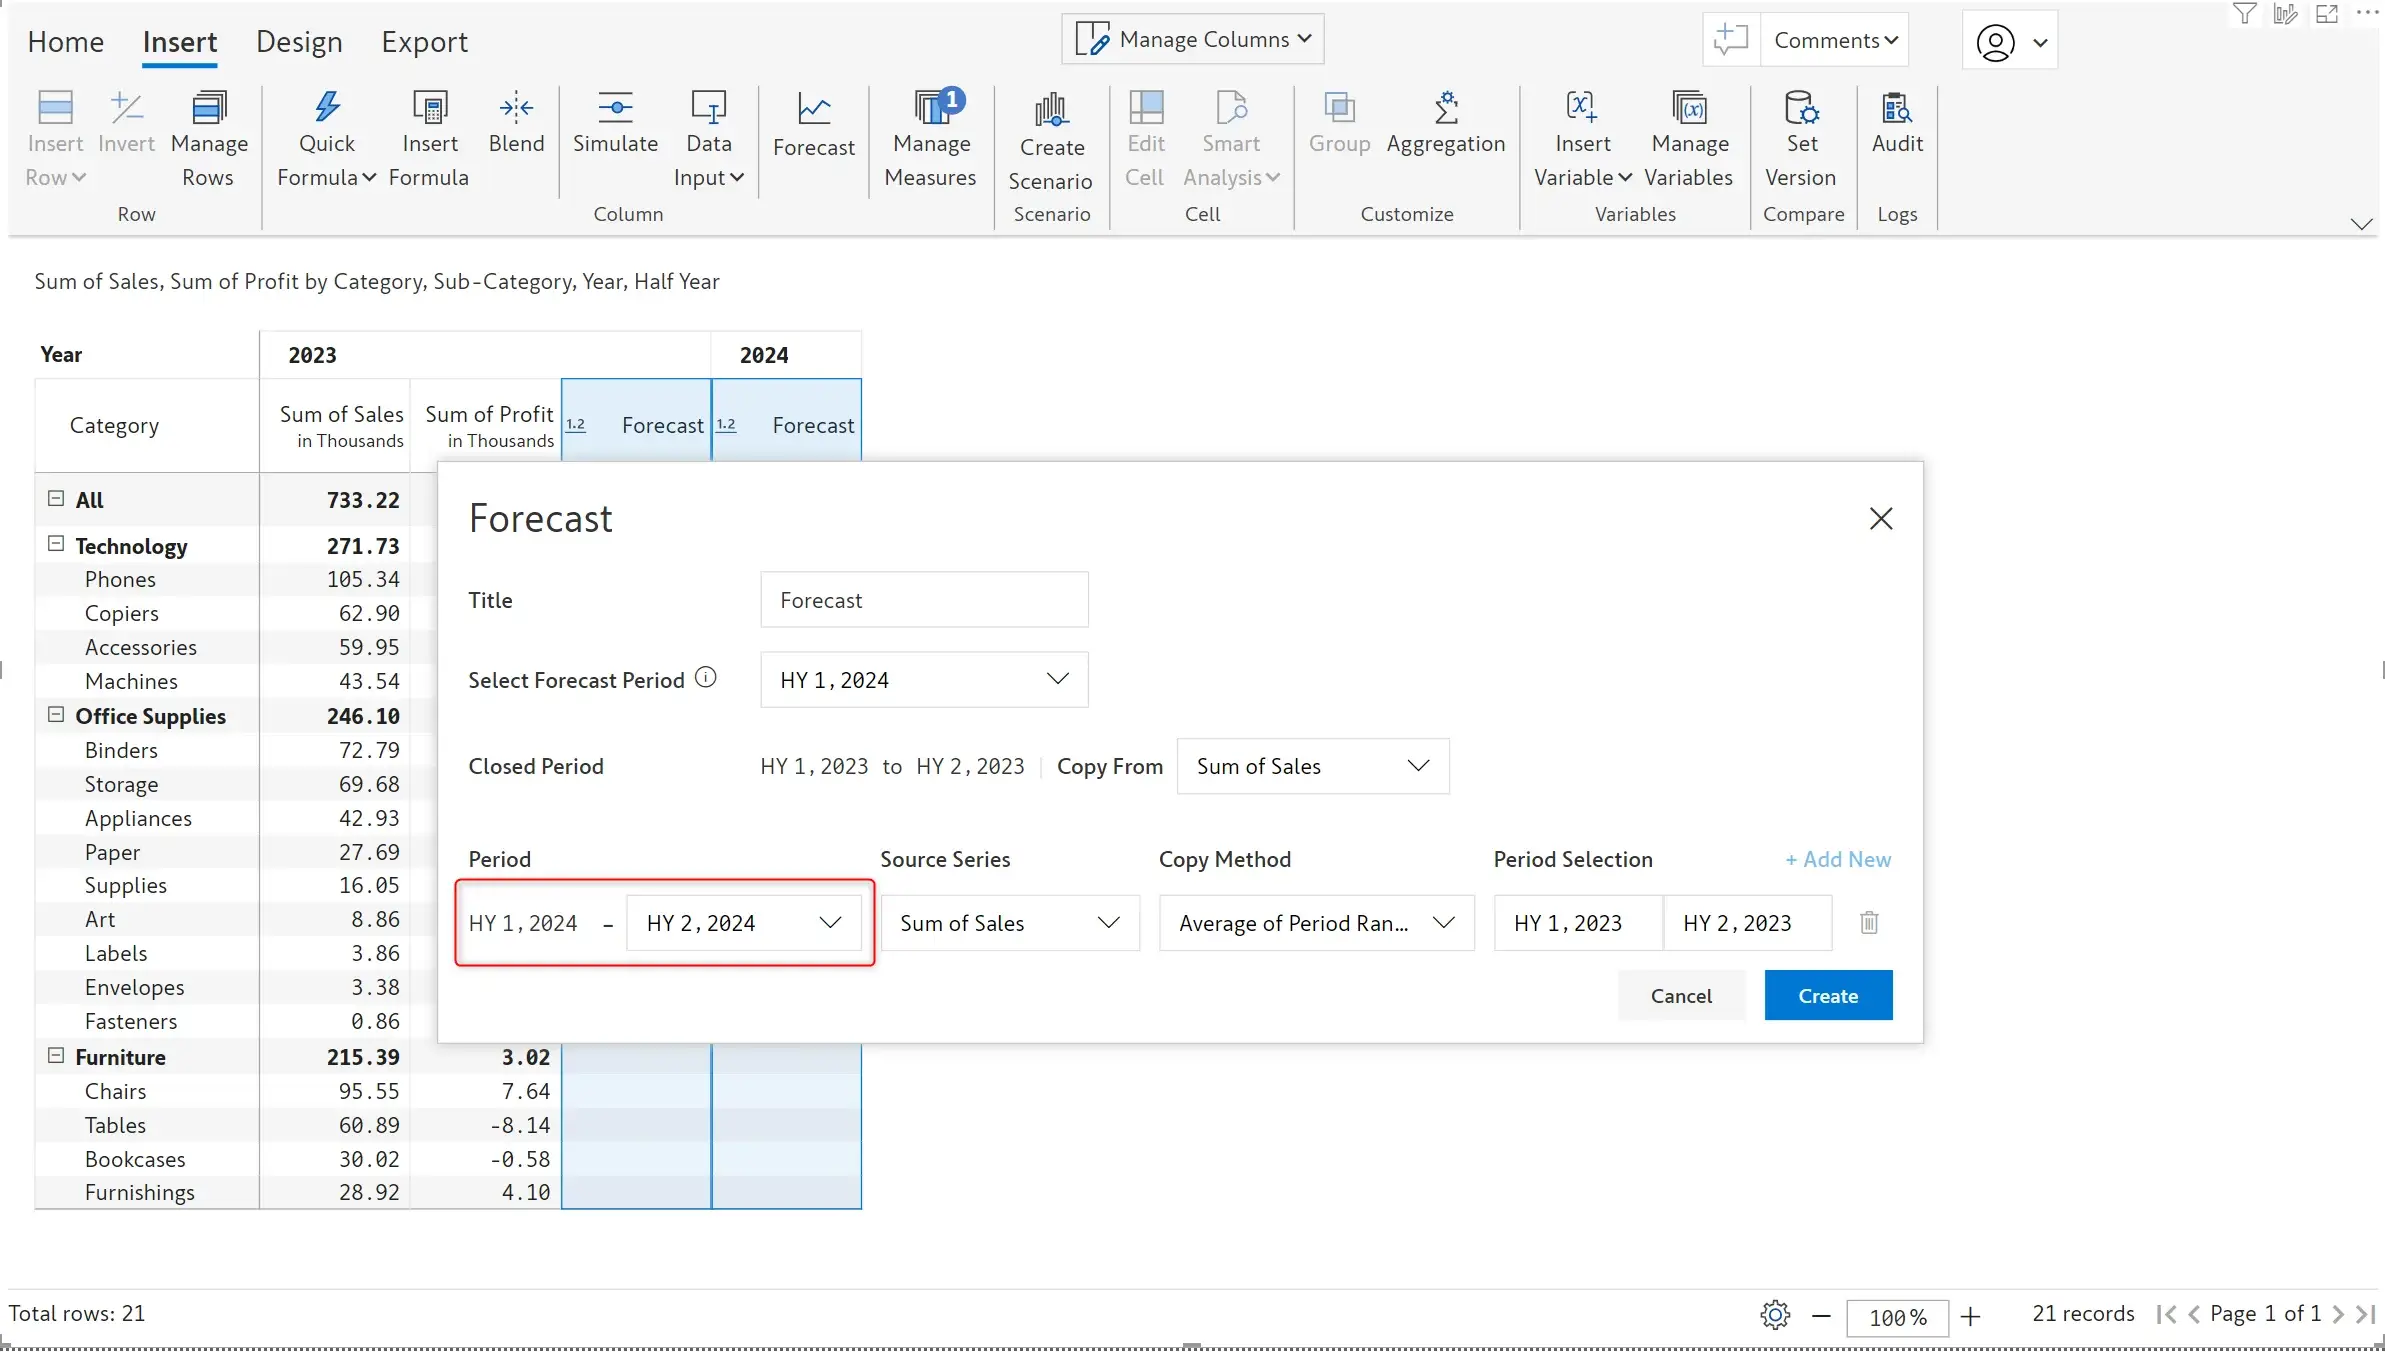
As per the image above, the table adds two half-year periods for 2024 – HY 1 and HY 2.
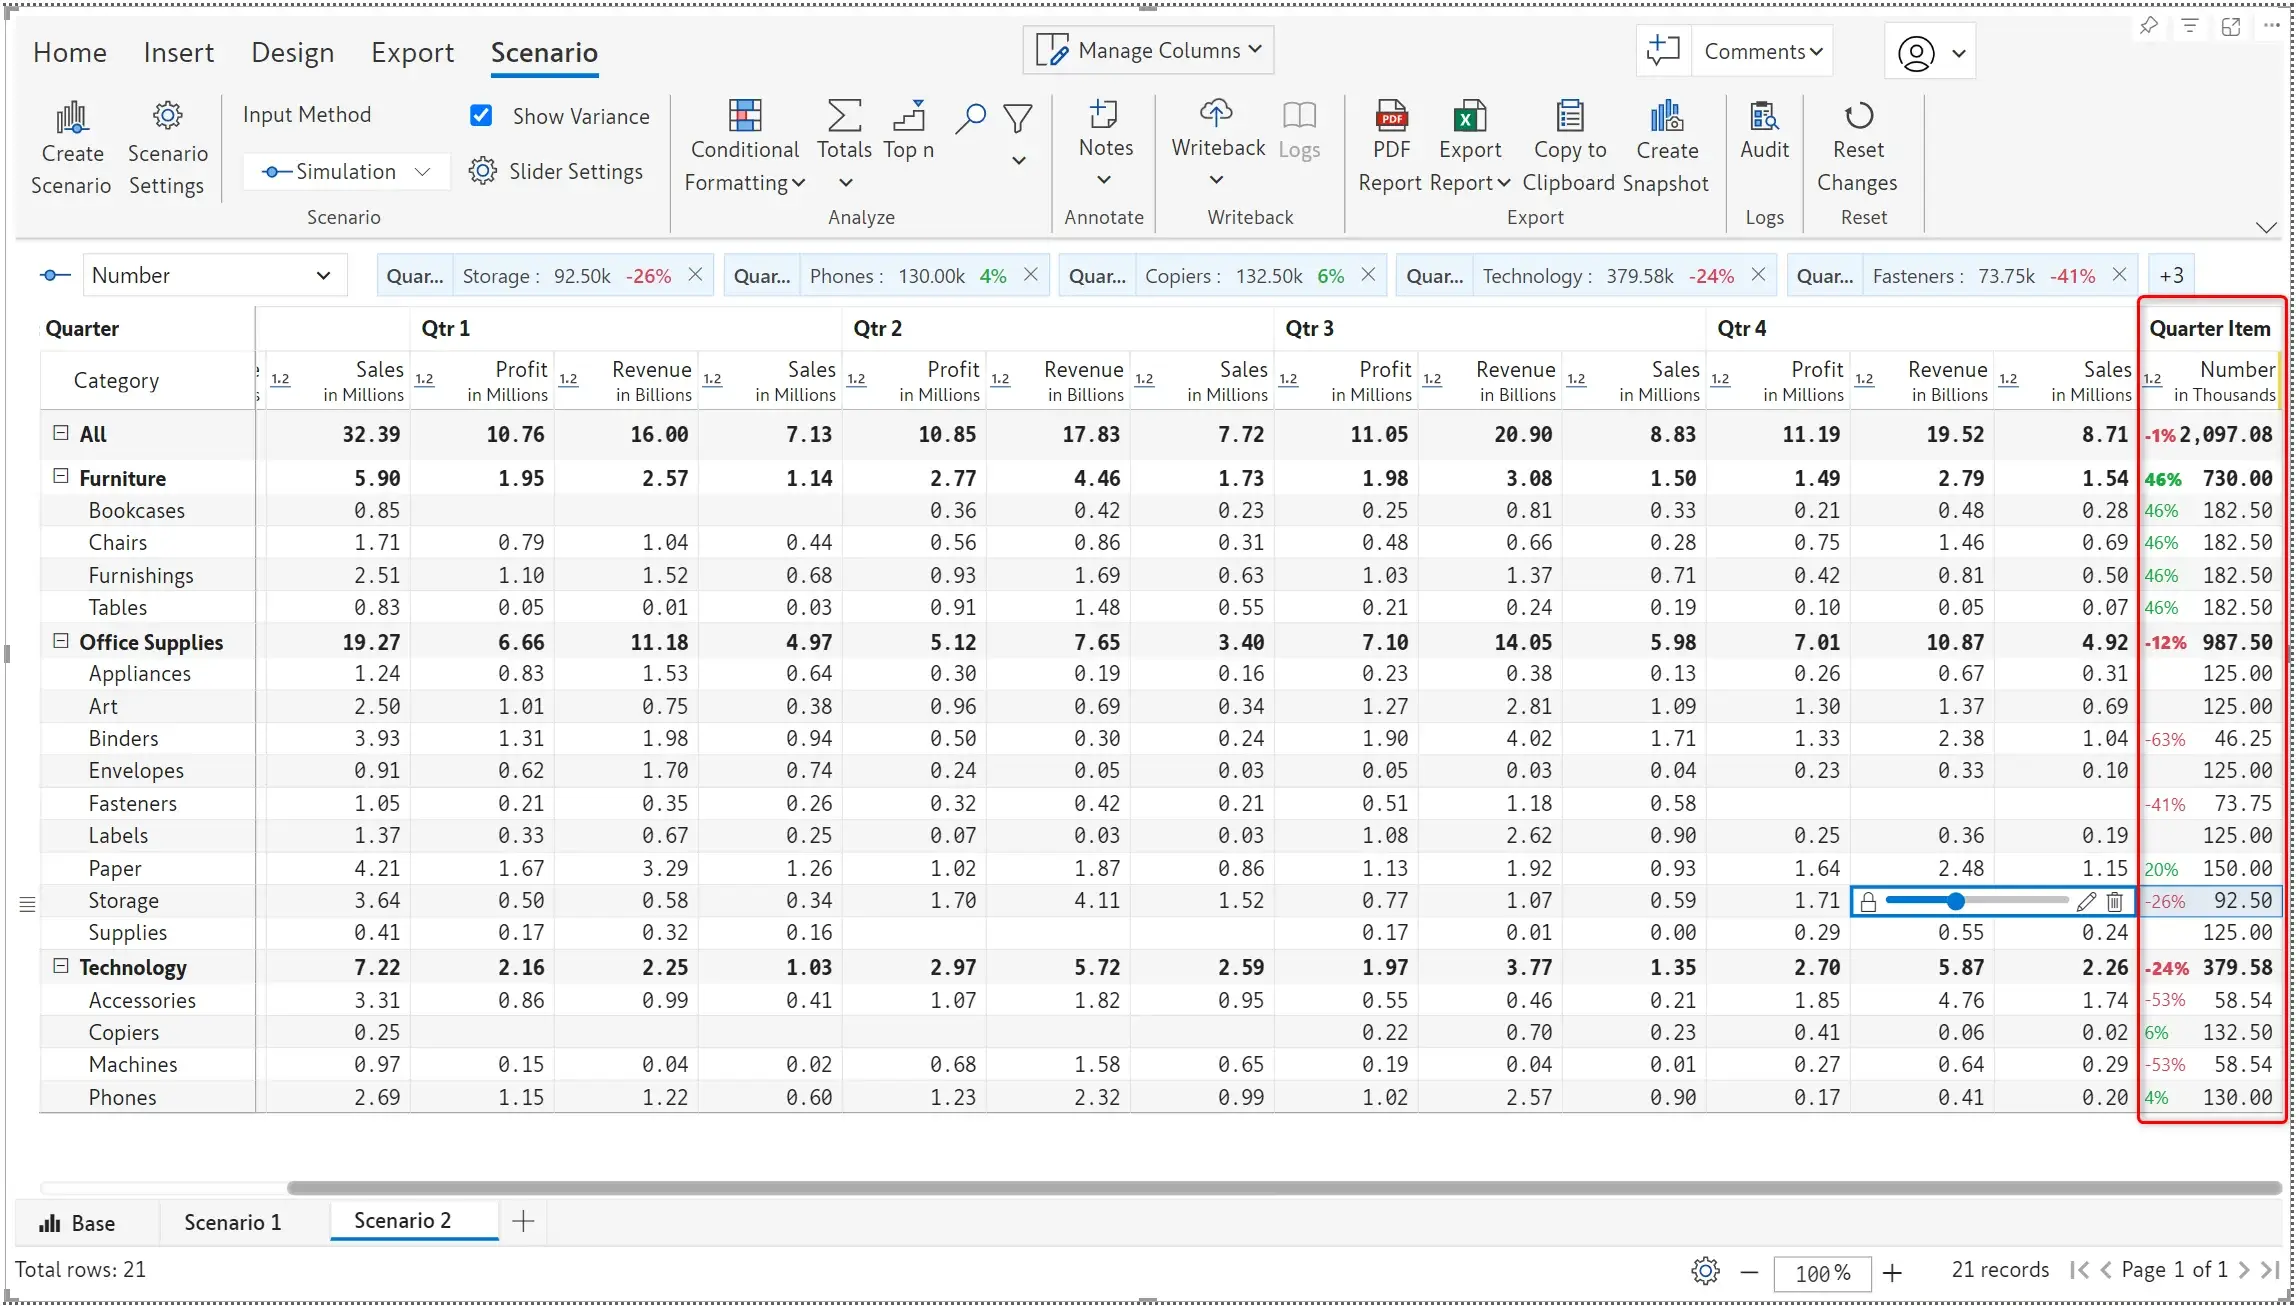
Inforiver 2.6. enables you to create numeric data input columns and run simulations within a specific scenario. Previously, only data input visual measures could be used in scenarios, with the current release, visual columns can also be added. In the example below, we have created a column for YTD profits which shows up in the ‘Scenario 2’ tab.
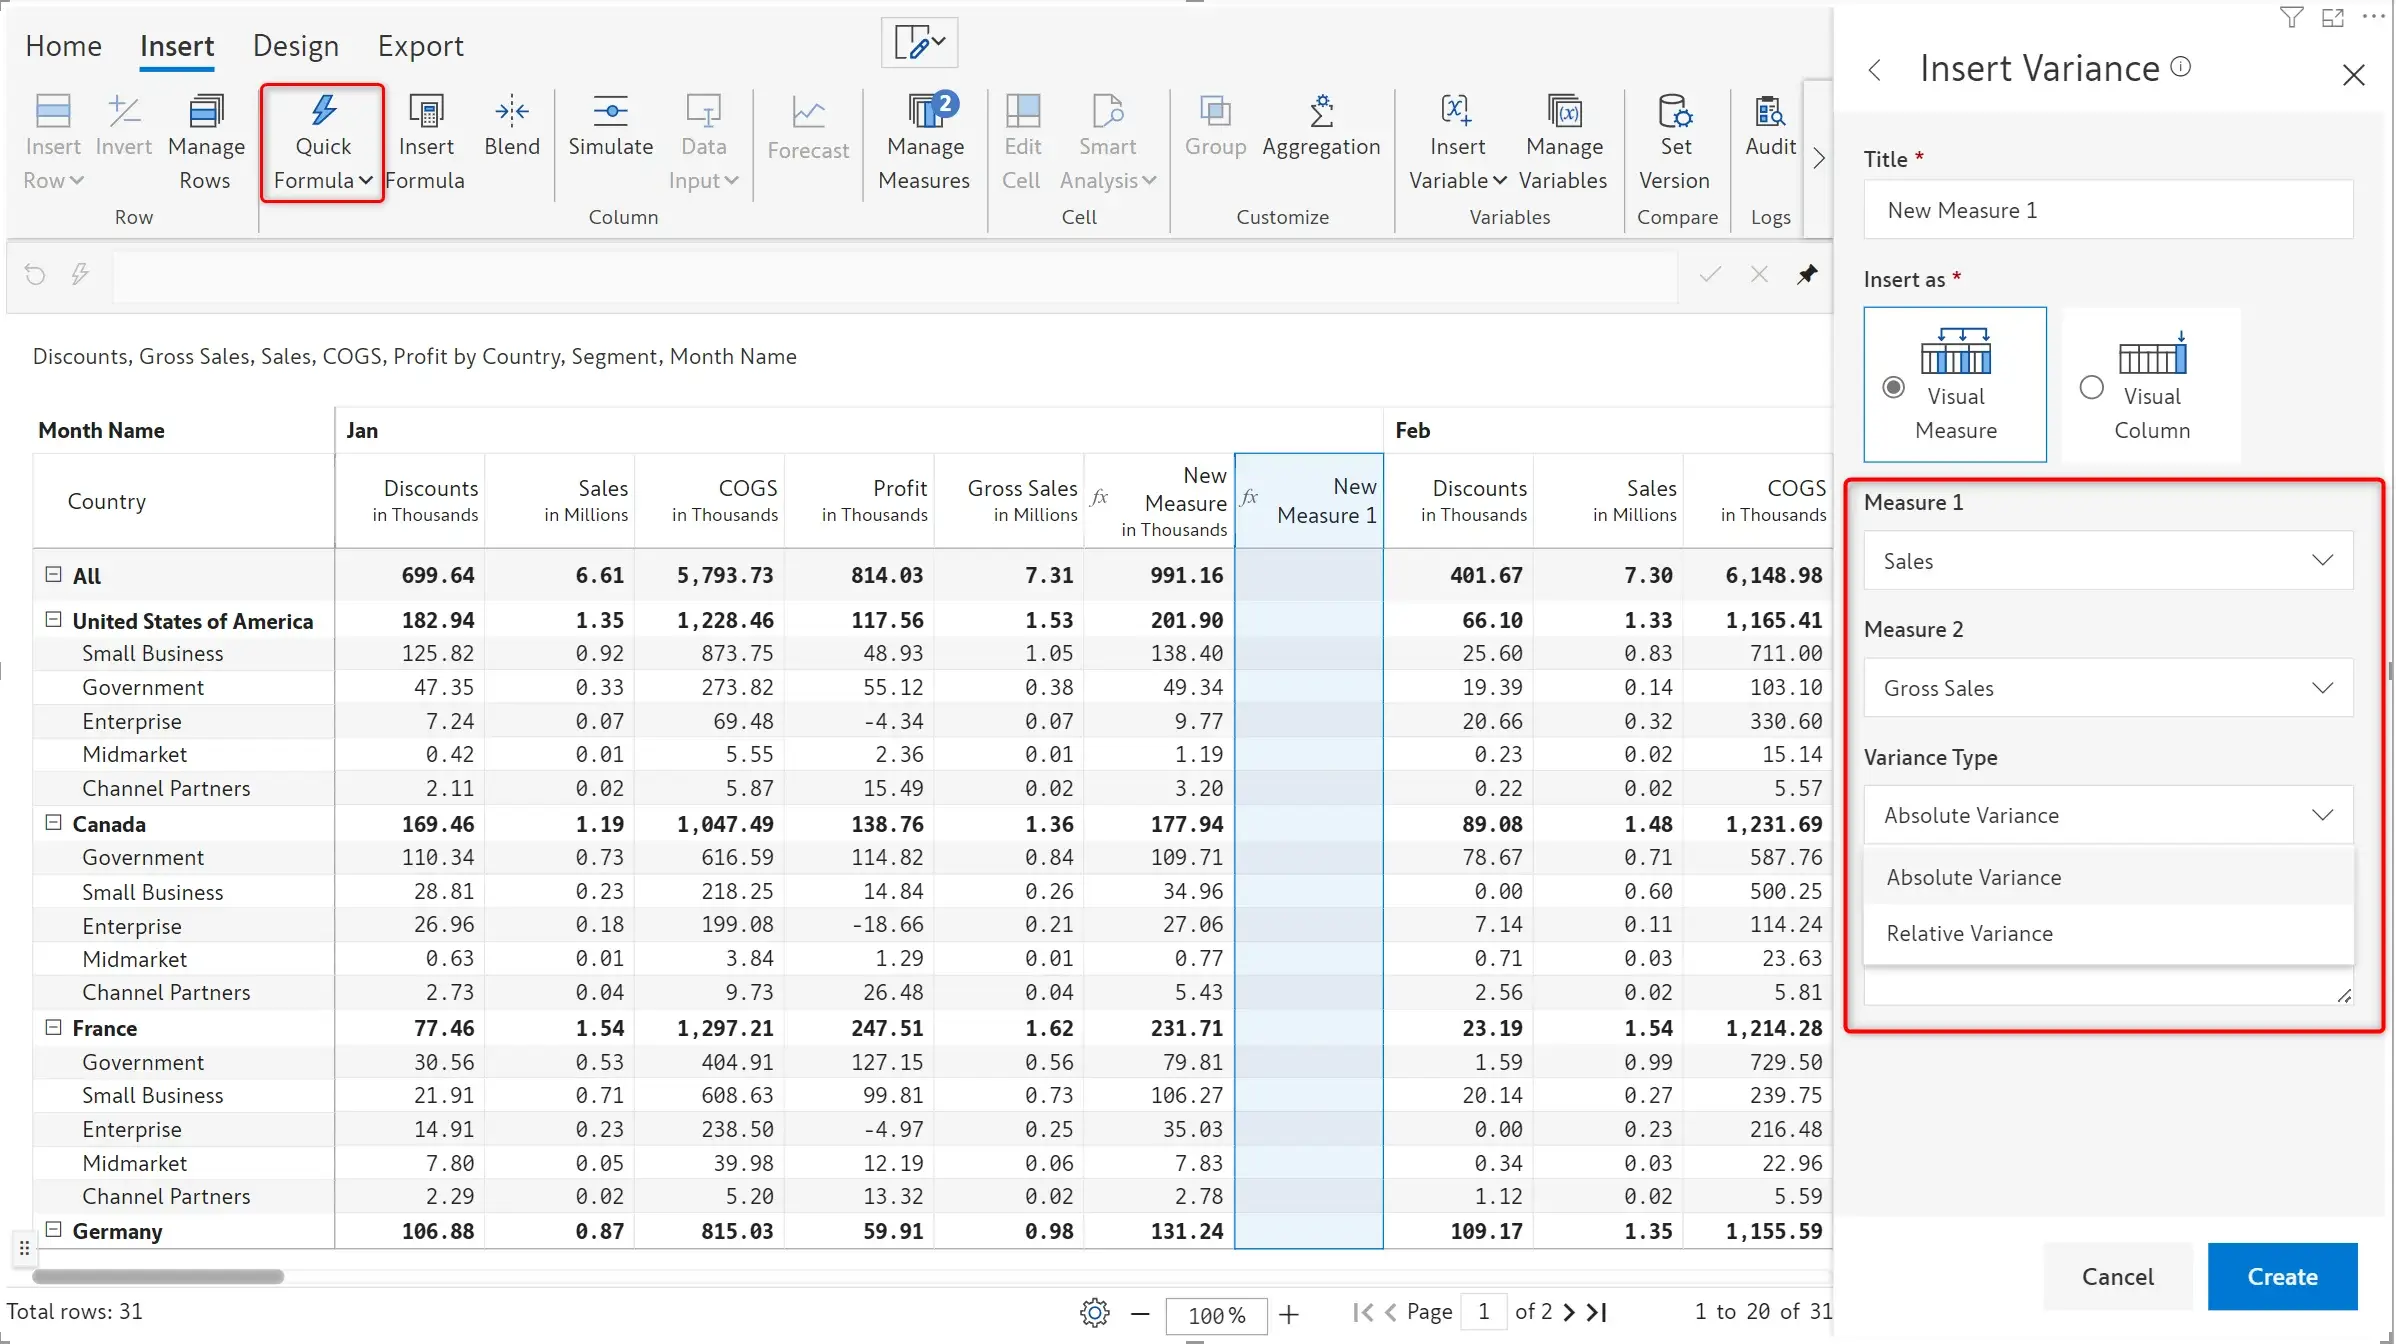
Till now, Inforiver auto-calculated variances between first measure pairs from the AC/PY/PL/FC fields (e.g., Actuals vs Forecast, Forecast vs. Budget, etc). However, to calculate variances between two measures within the same field (e.g., Forecast v1 and v2) or two measures across fields where one of measures is not the ‘first measure’ (e.g., Actuals vs. Forecast v3), you had to create a new formula measure and type in the formula.
With Inforiver 2.6, you can create such variances quickly using the Insert Variance quick formula to effortlessly calculate the variance between any pair of measures (including measures added using a formula) in your report. You can display both the absolute and relative variance.
Inforiver offers additional time-intelligence-based calculation capabilities. Your formulae can now include references to YTD, Quarter period and Last N months. Learn more about time intelligence functions.
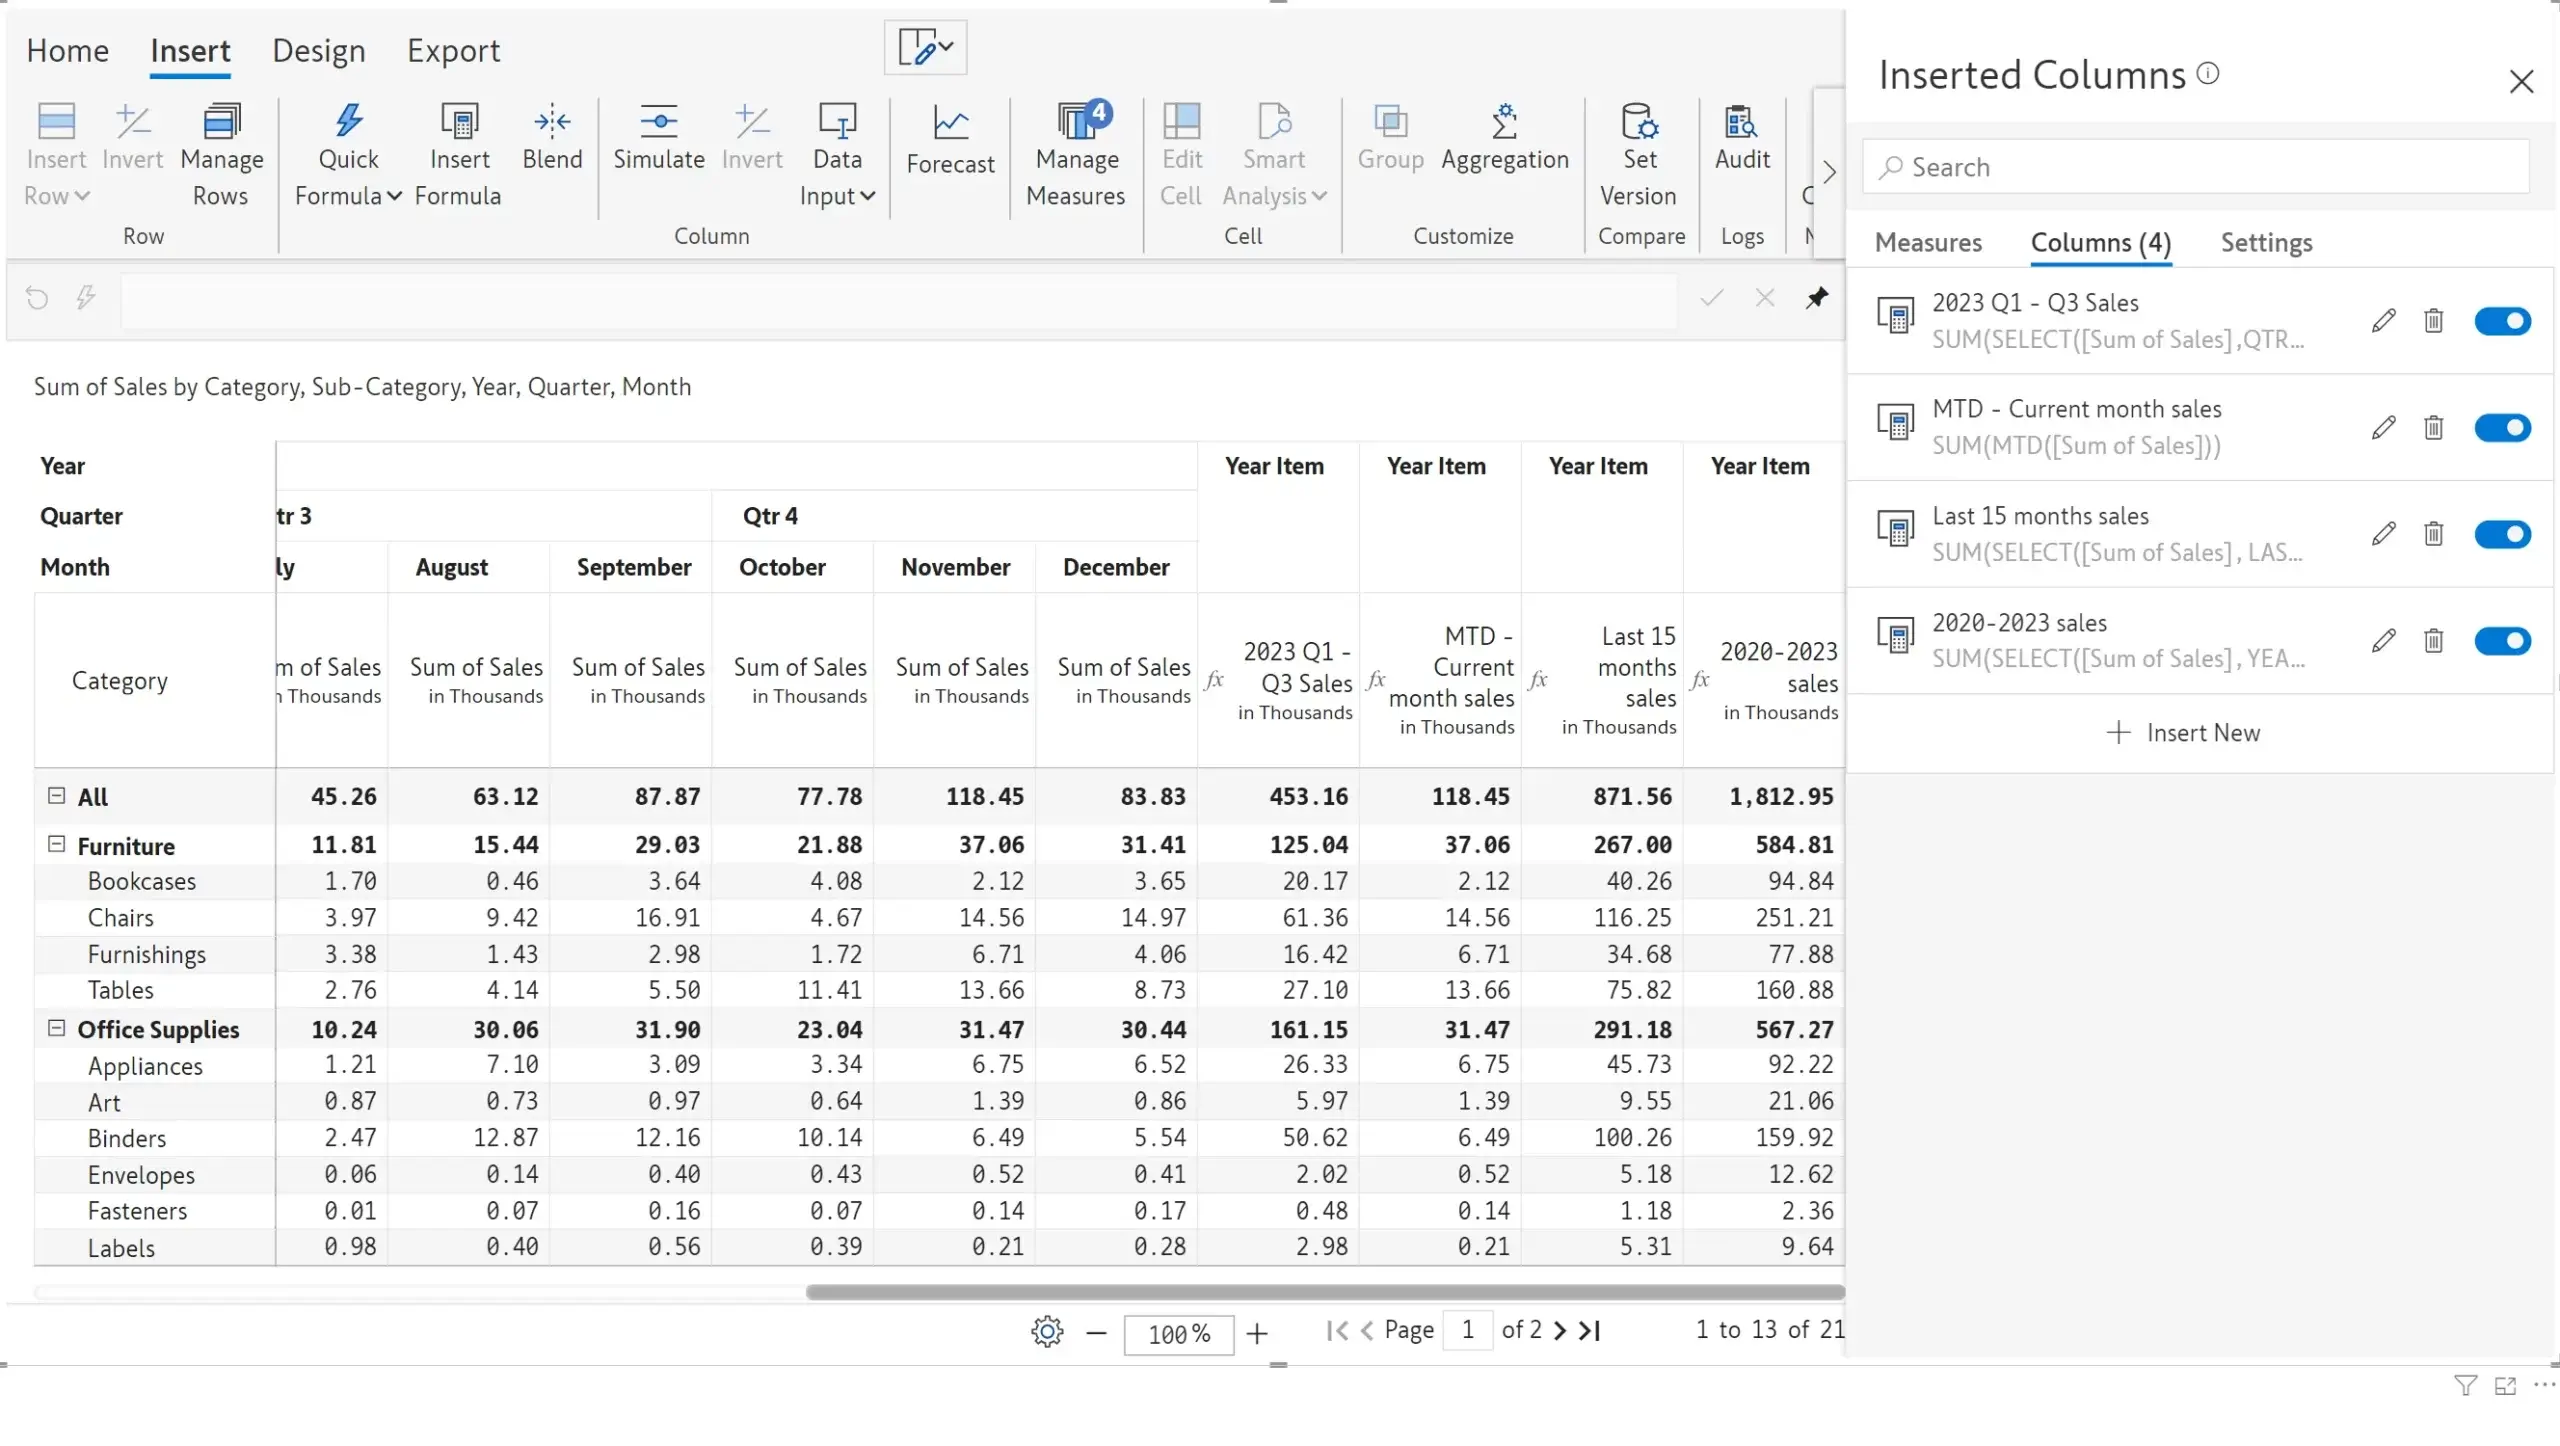
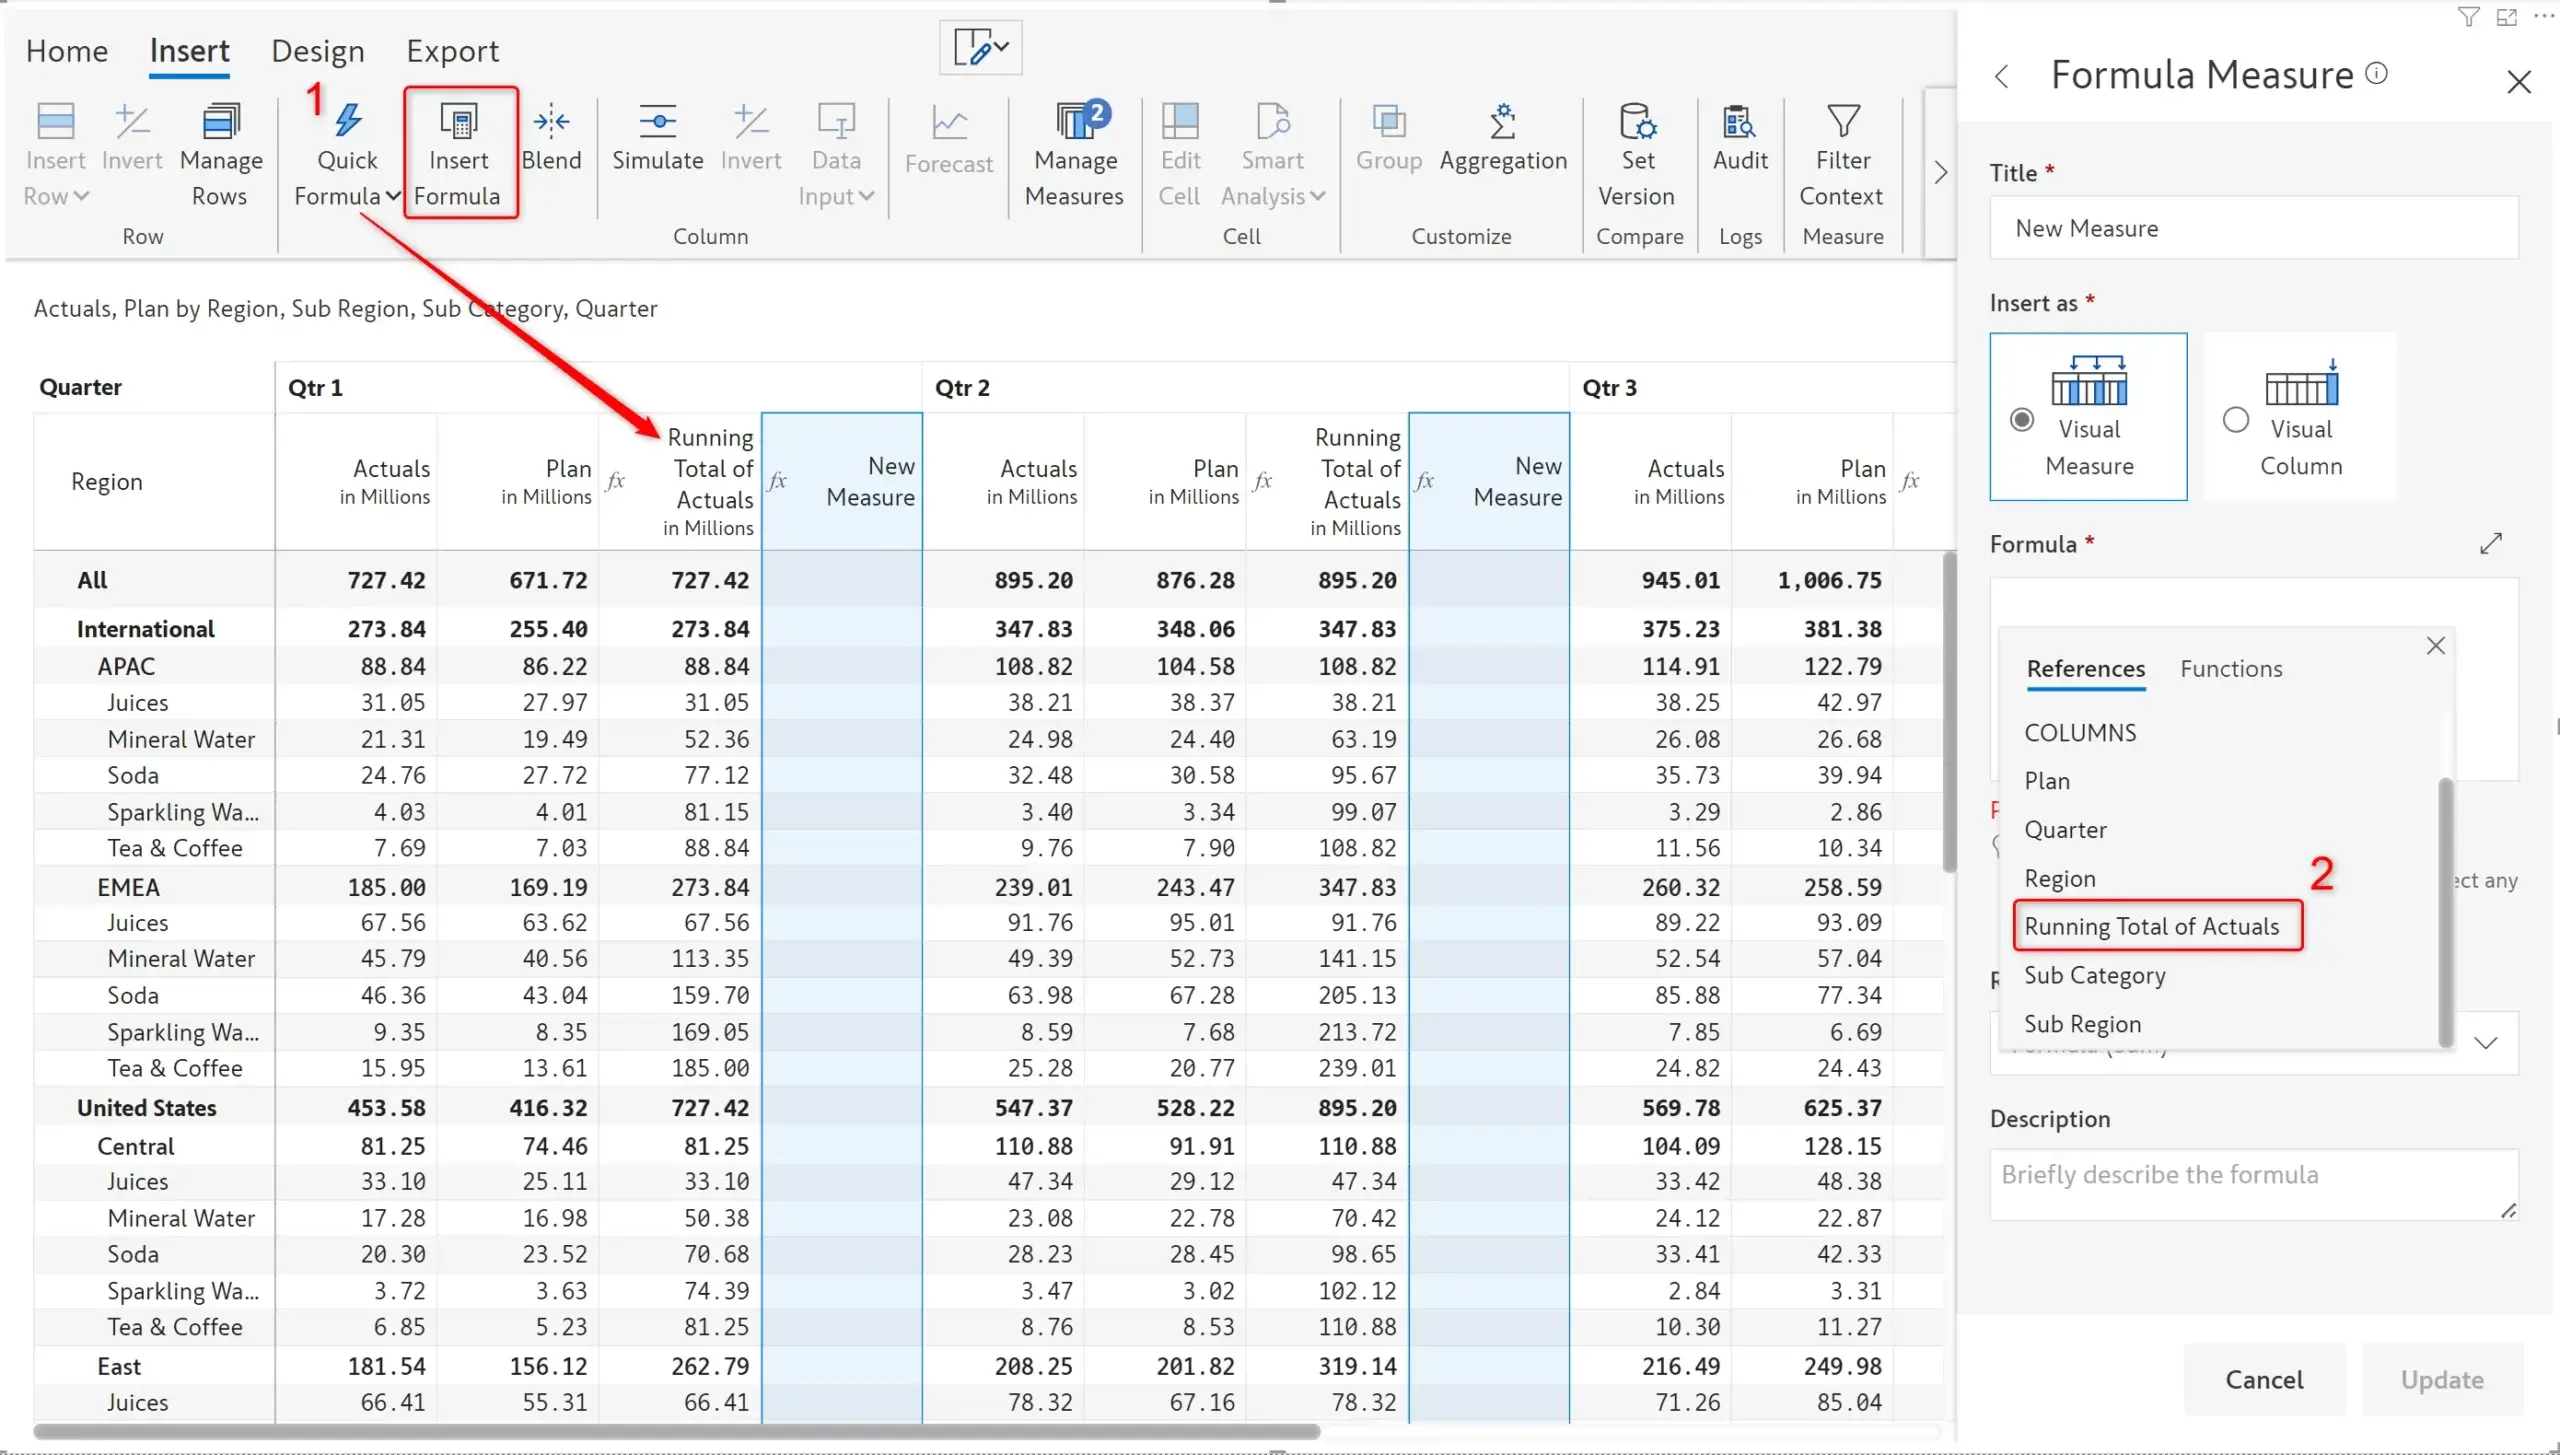
Inforiver now supports references to quick formula measures while writing a custom formula.
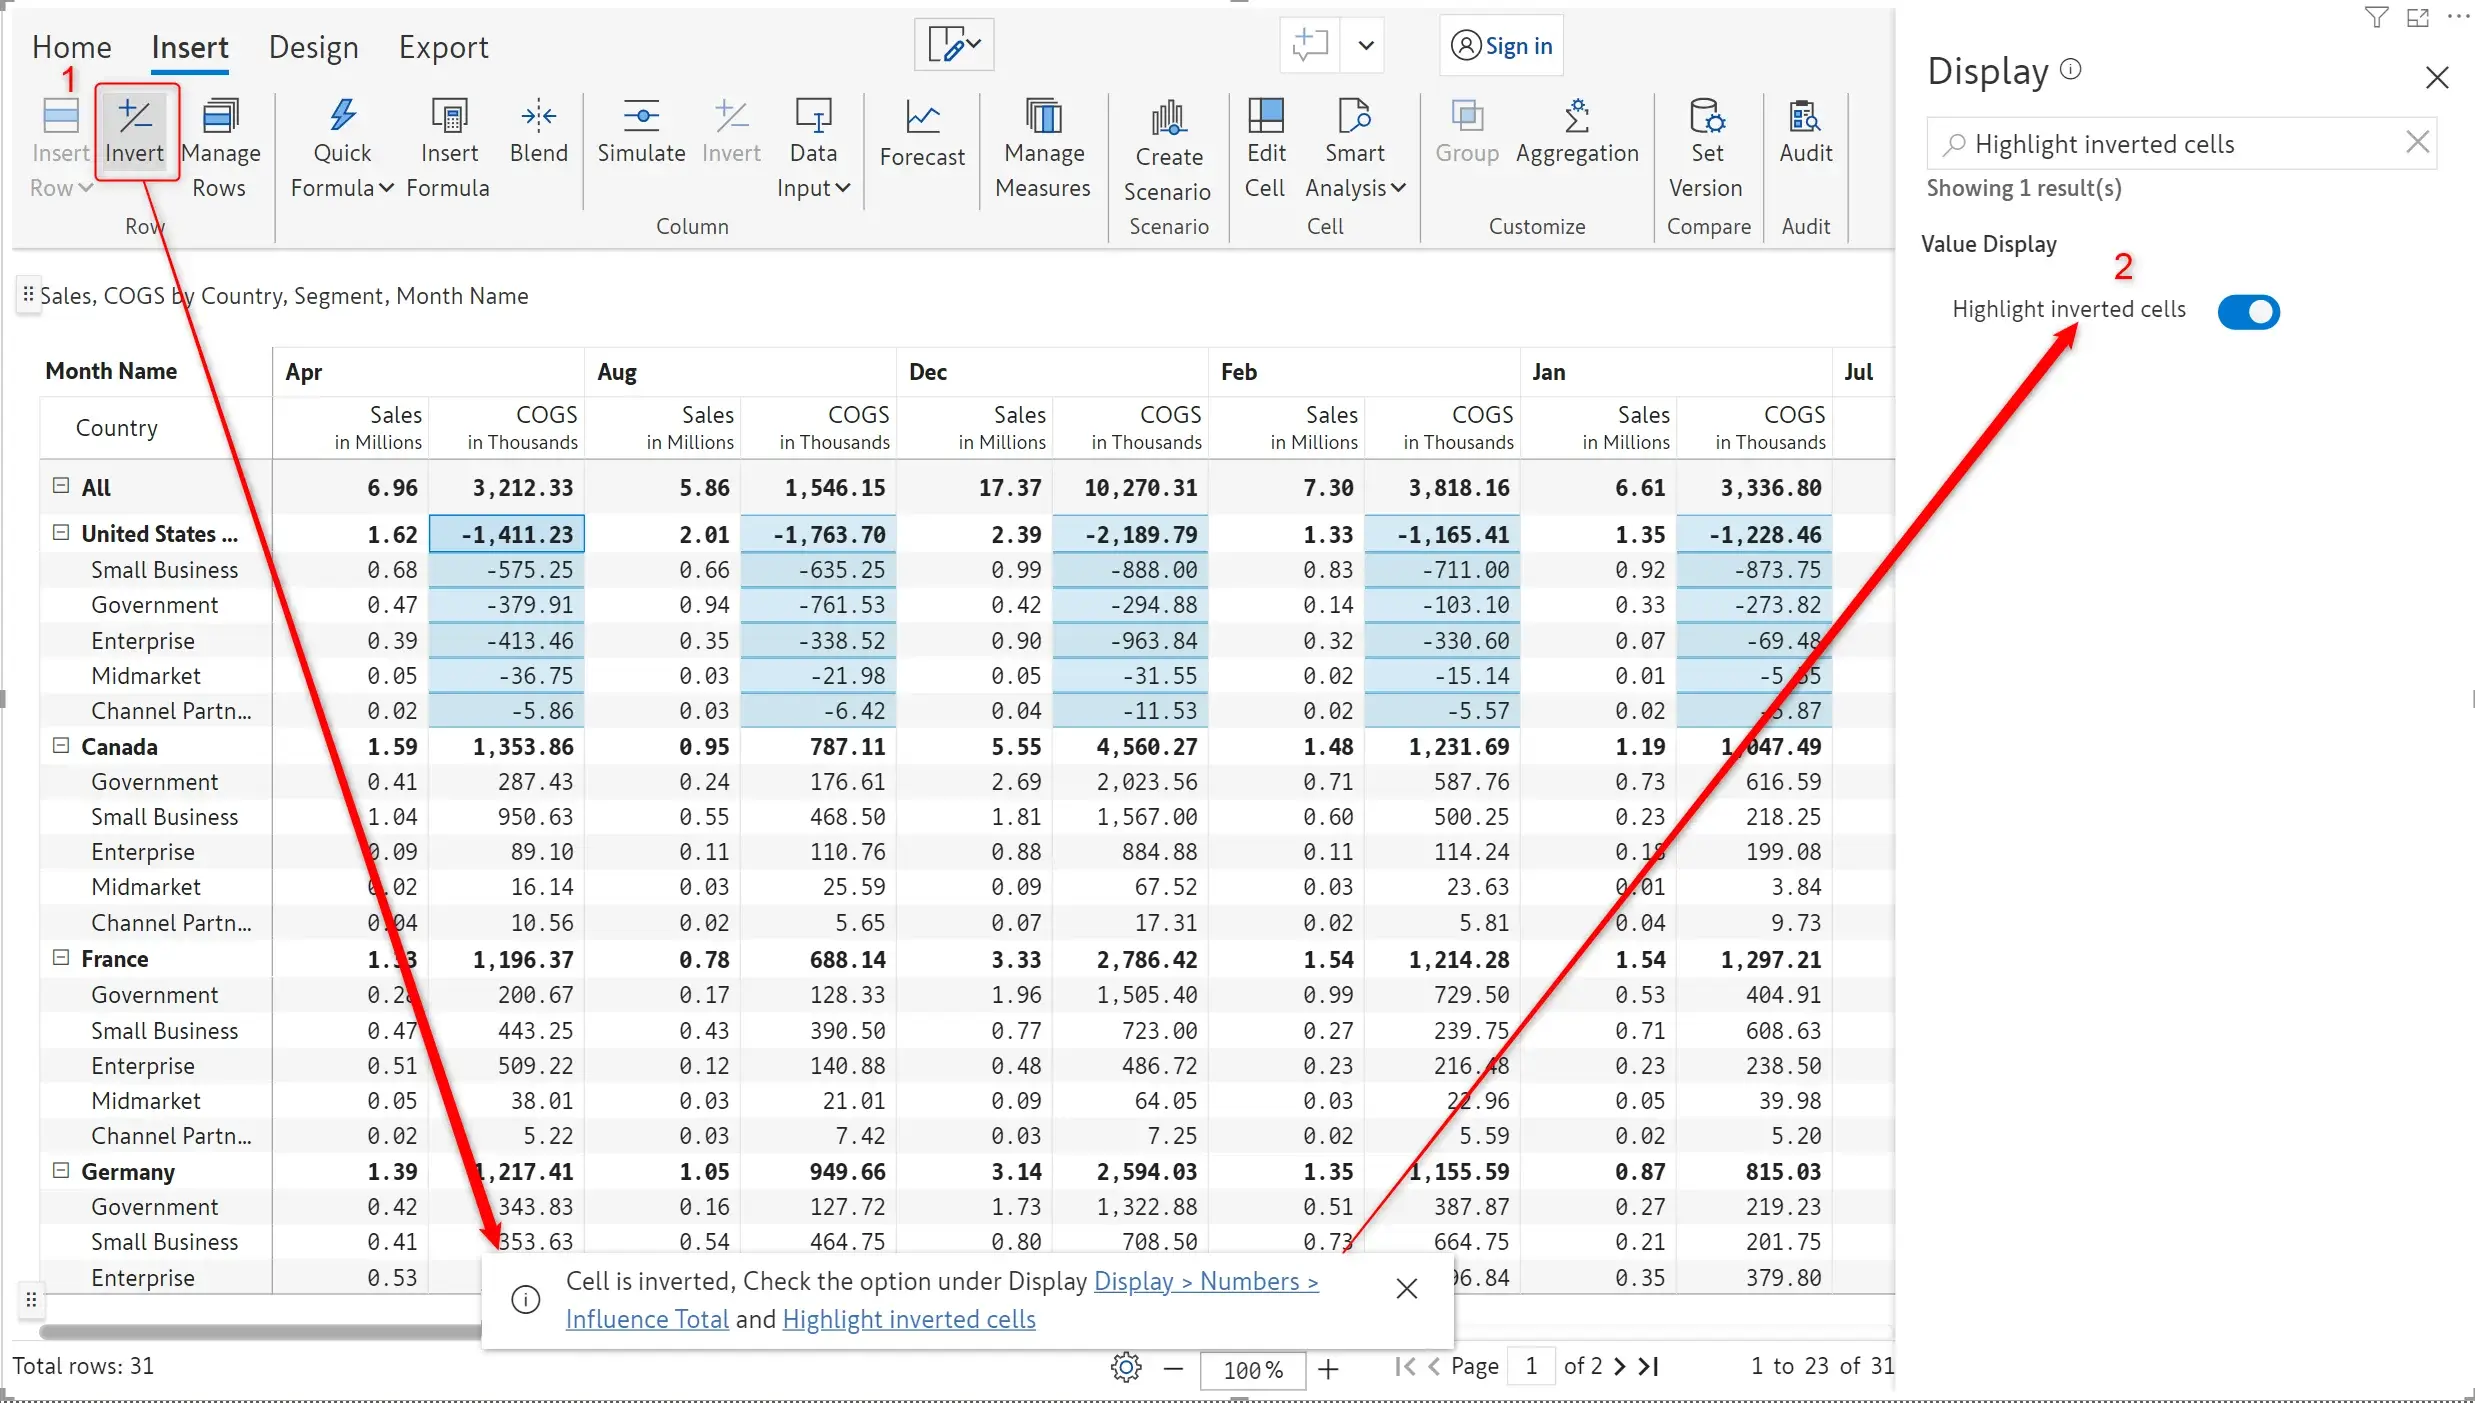
You may have manually inverted the values in your reports, for instance, in an expense account. You can now choose to highlight these inverted values, indicating that manual updates have been made to the dataset.
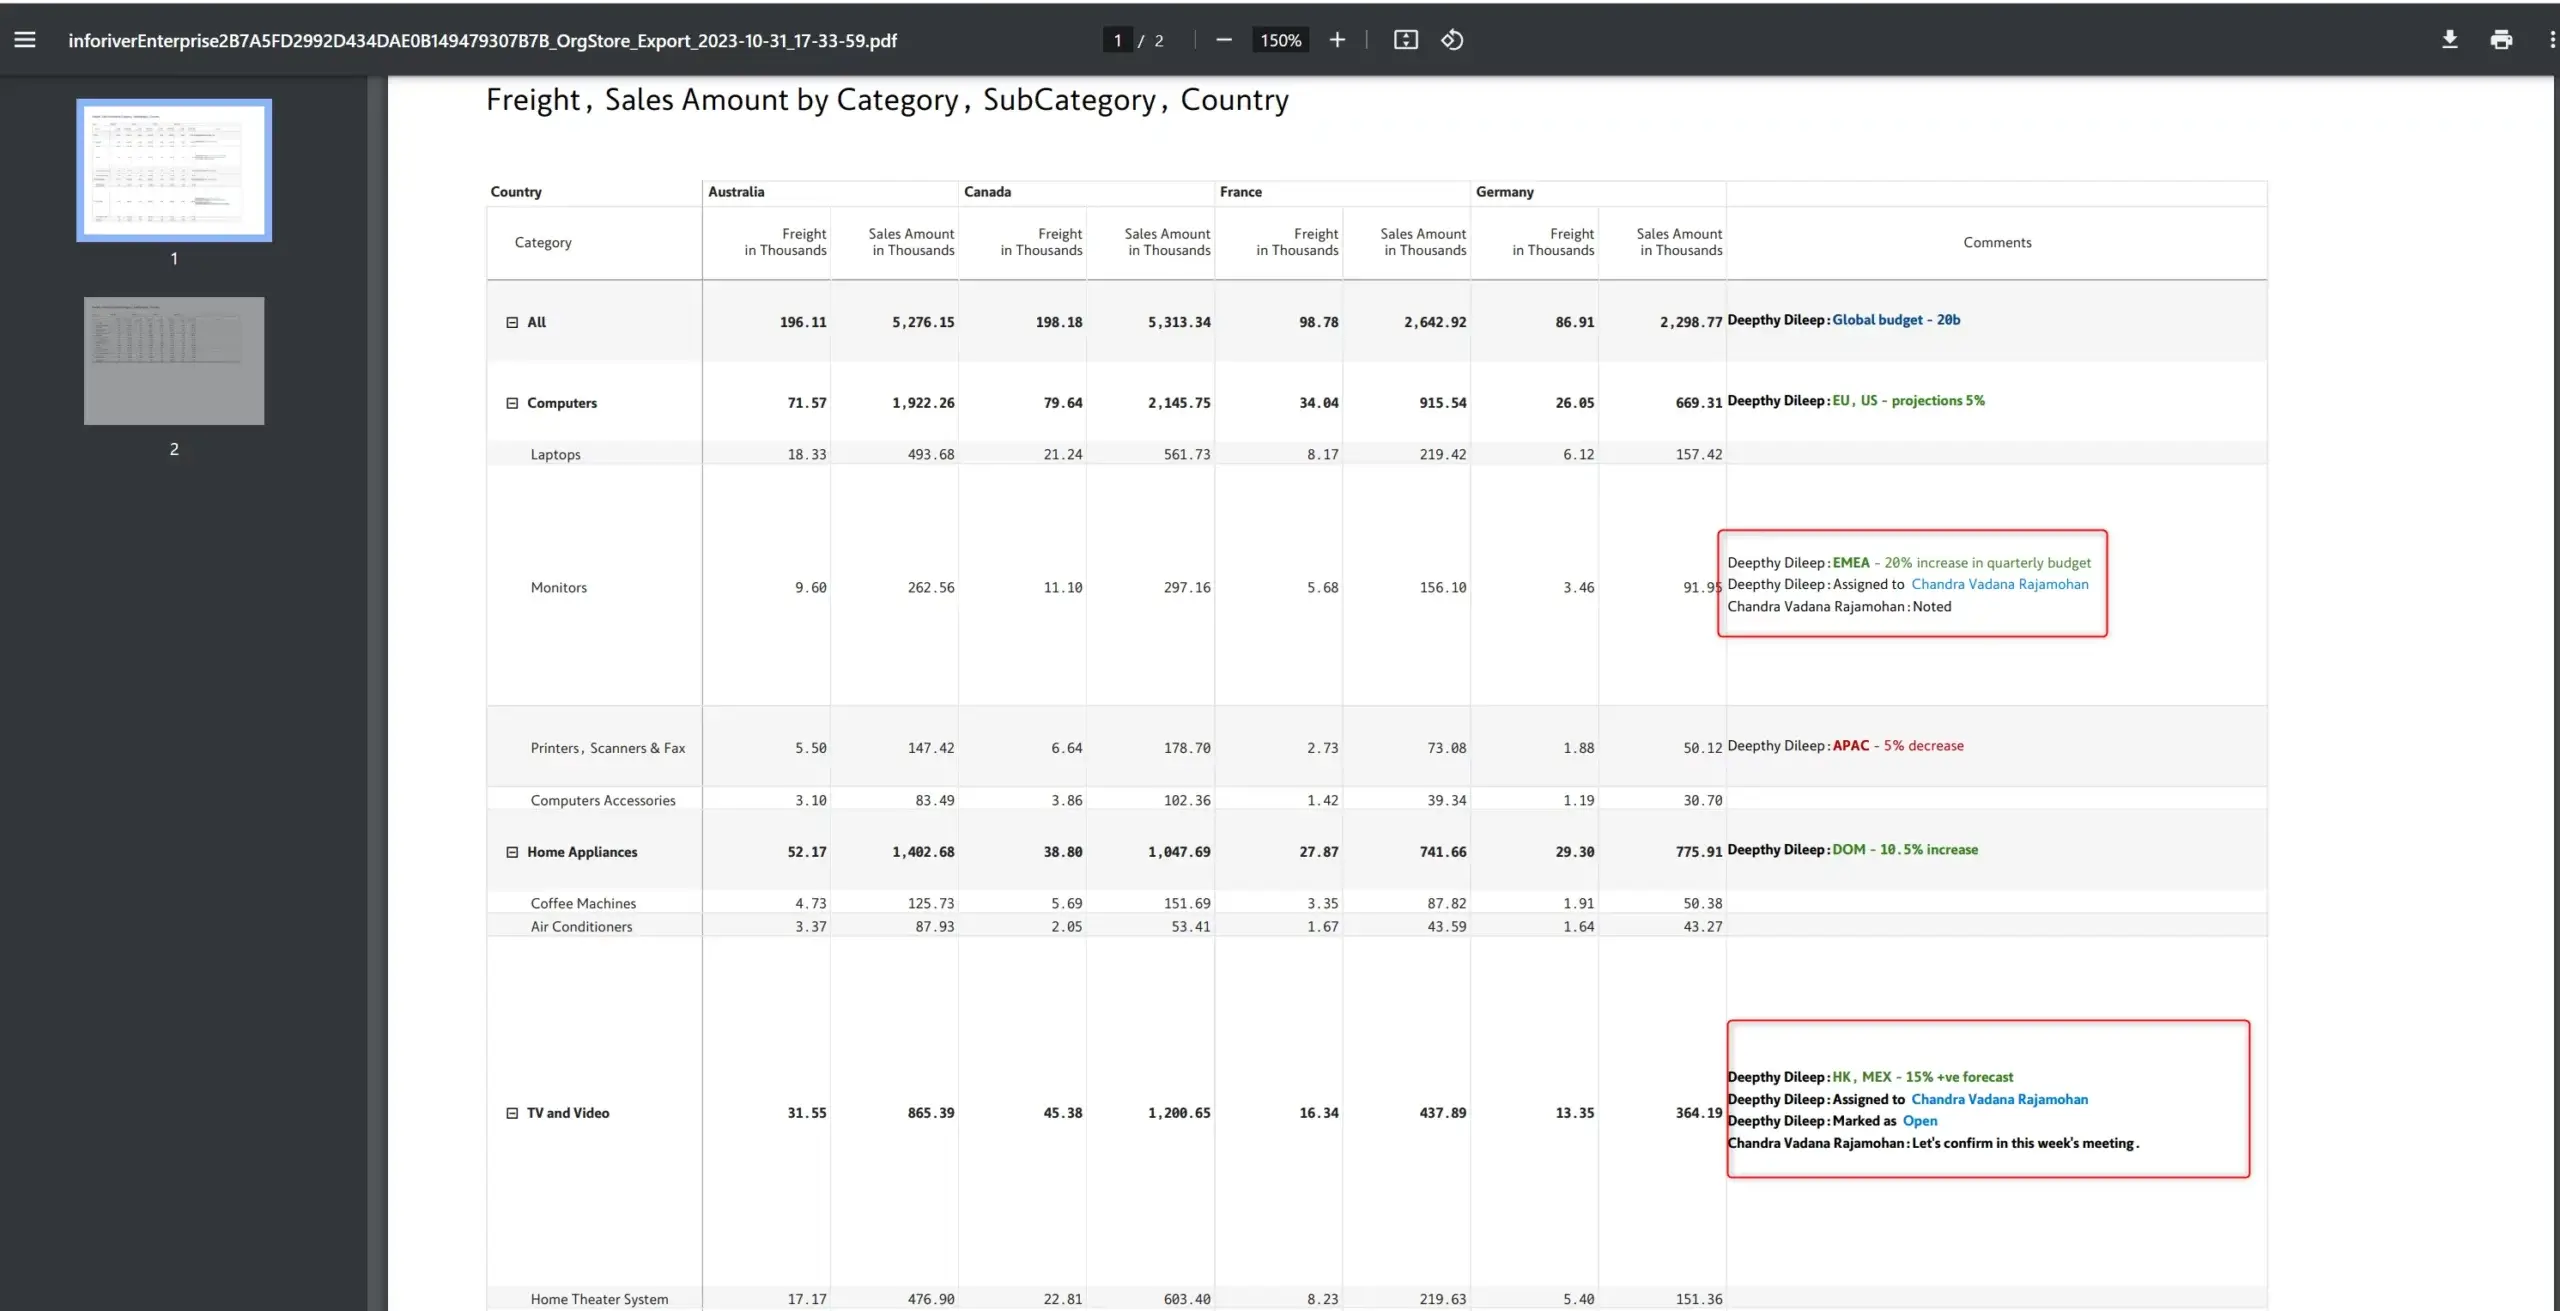
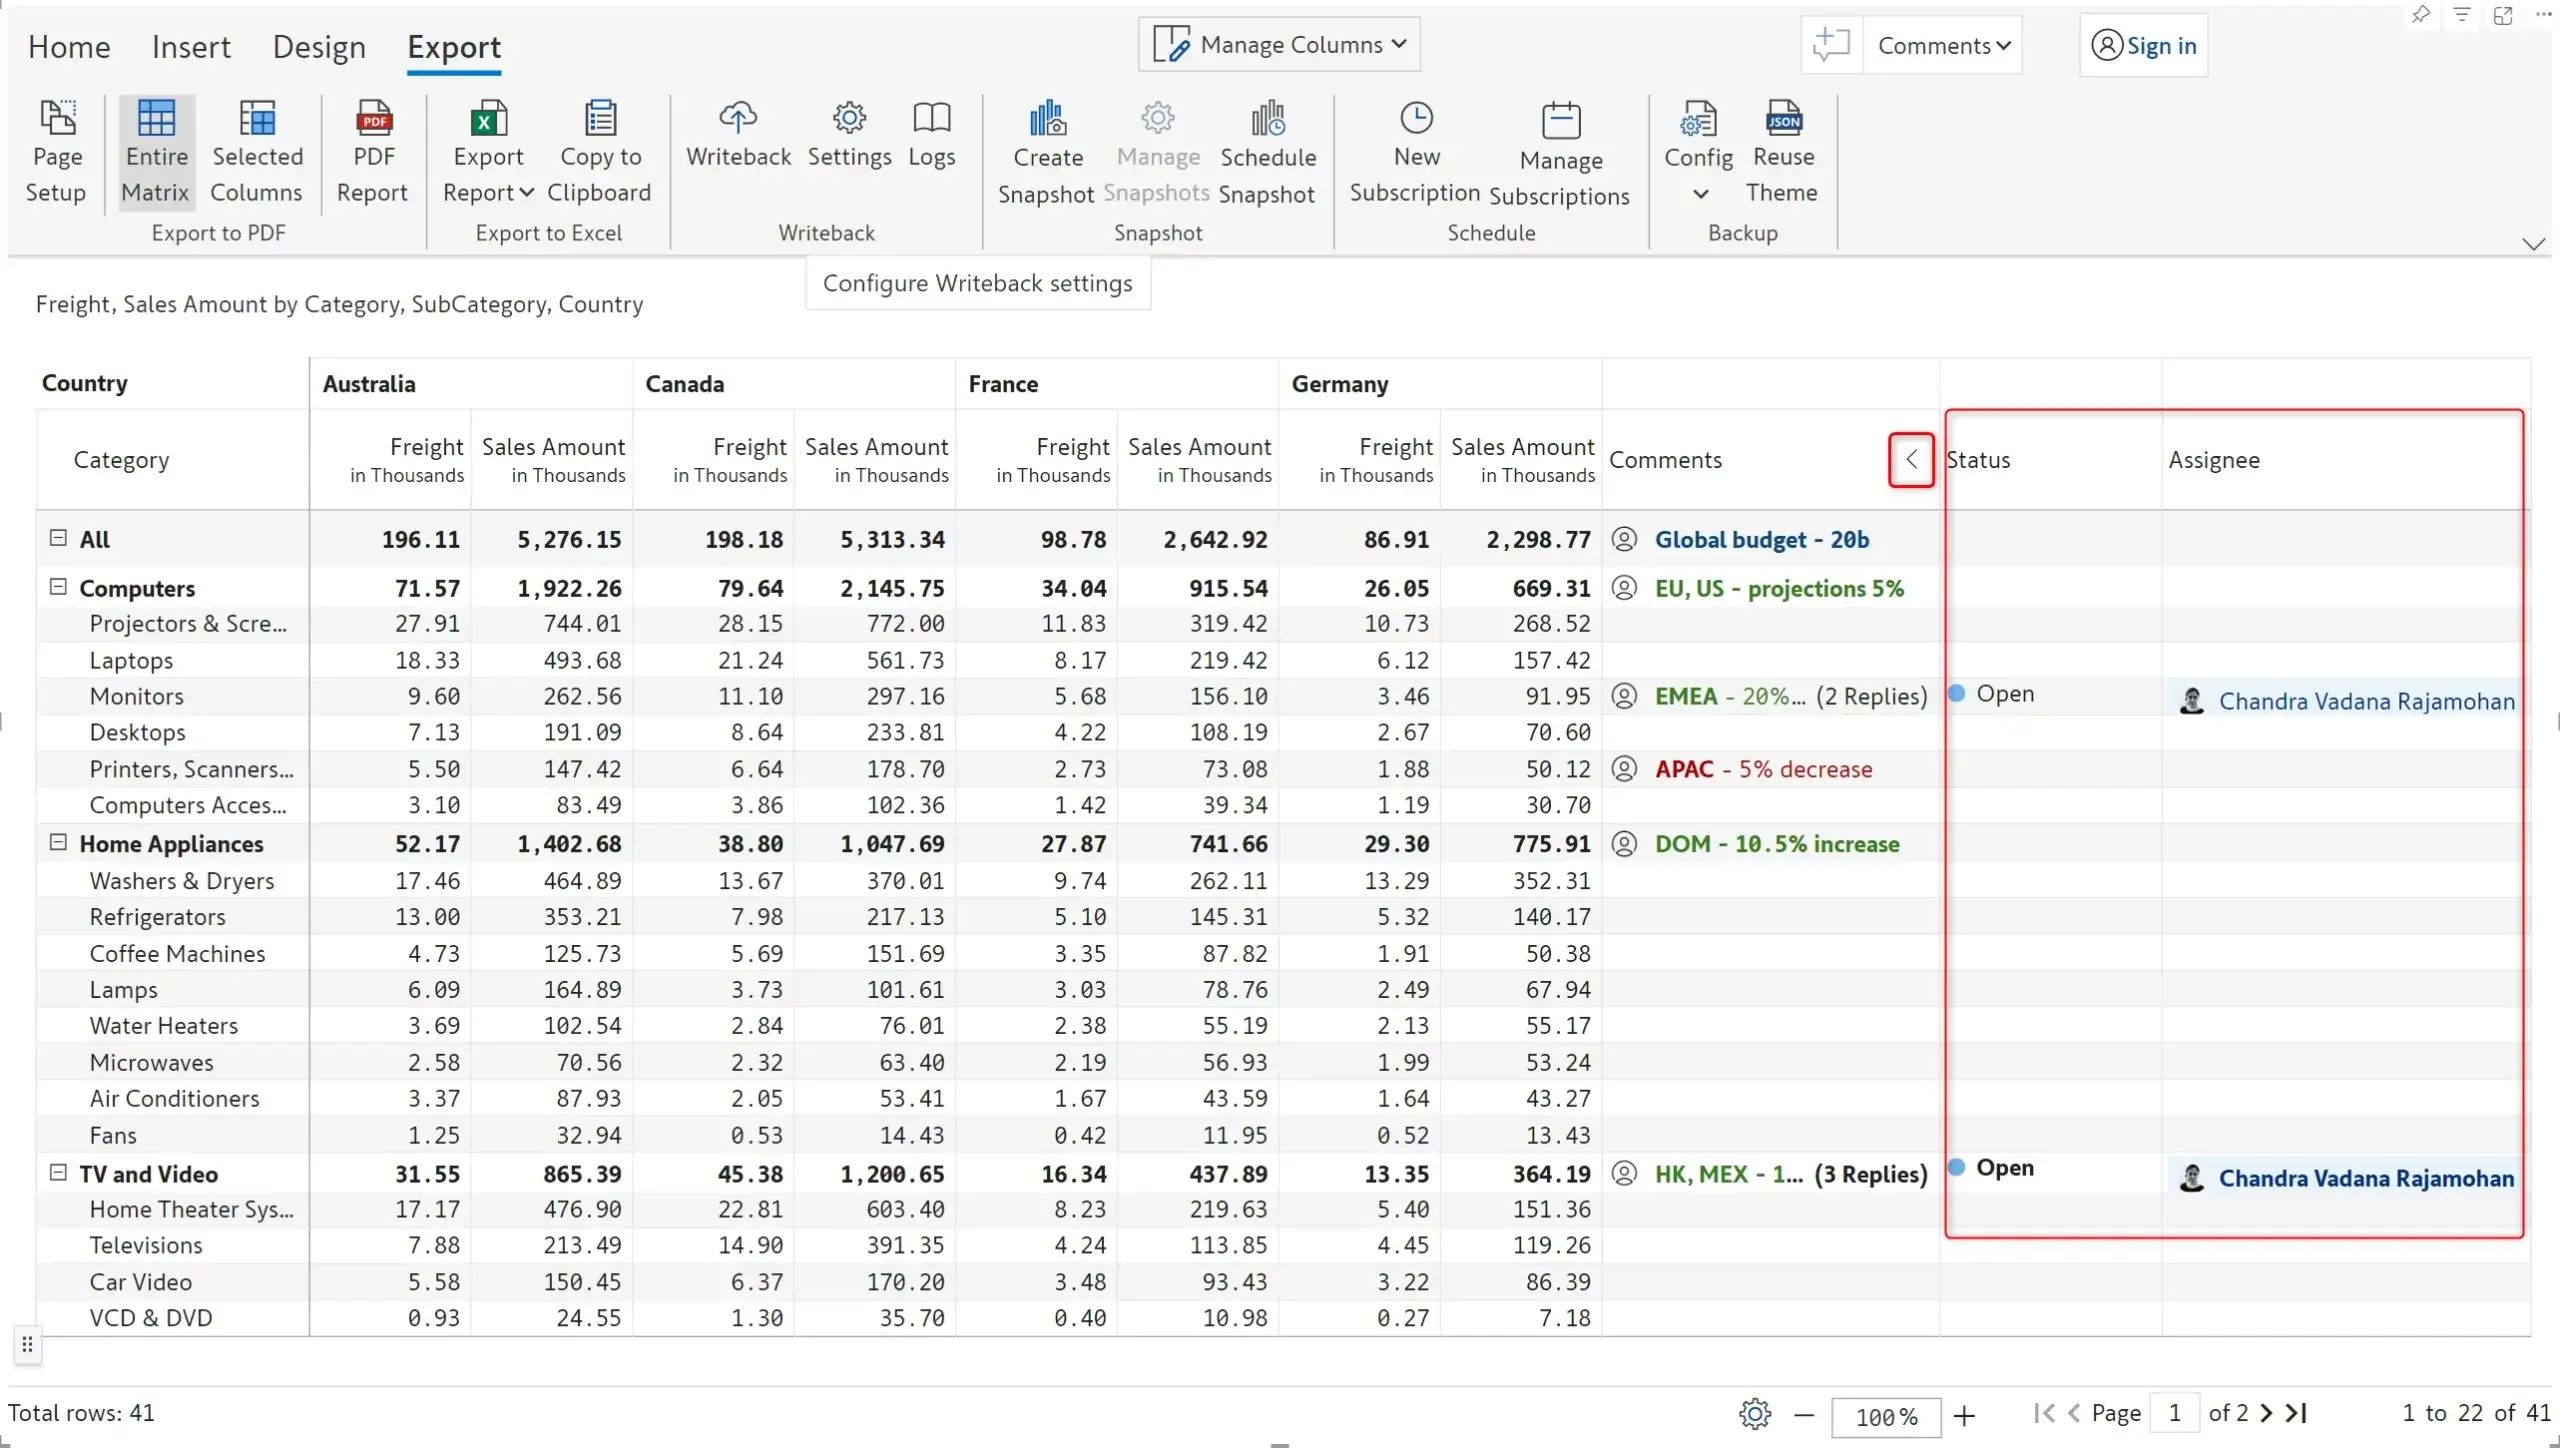
With the 2.6. release, you can capture comments and replies in the fully formatted PDF exports. To export replies, enable the Include comment replies option in Export > Page Setup
You can easily view the status of comments as well as the assignee as separate fields when you expand the Comments column.
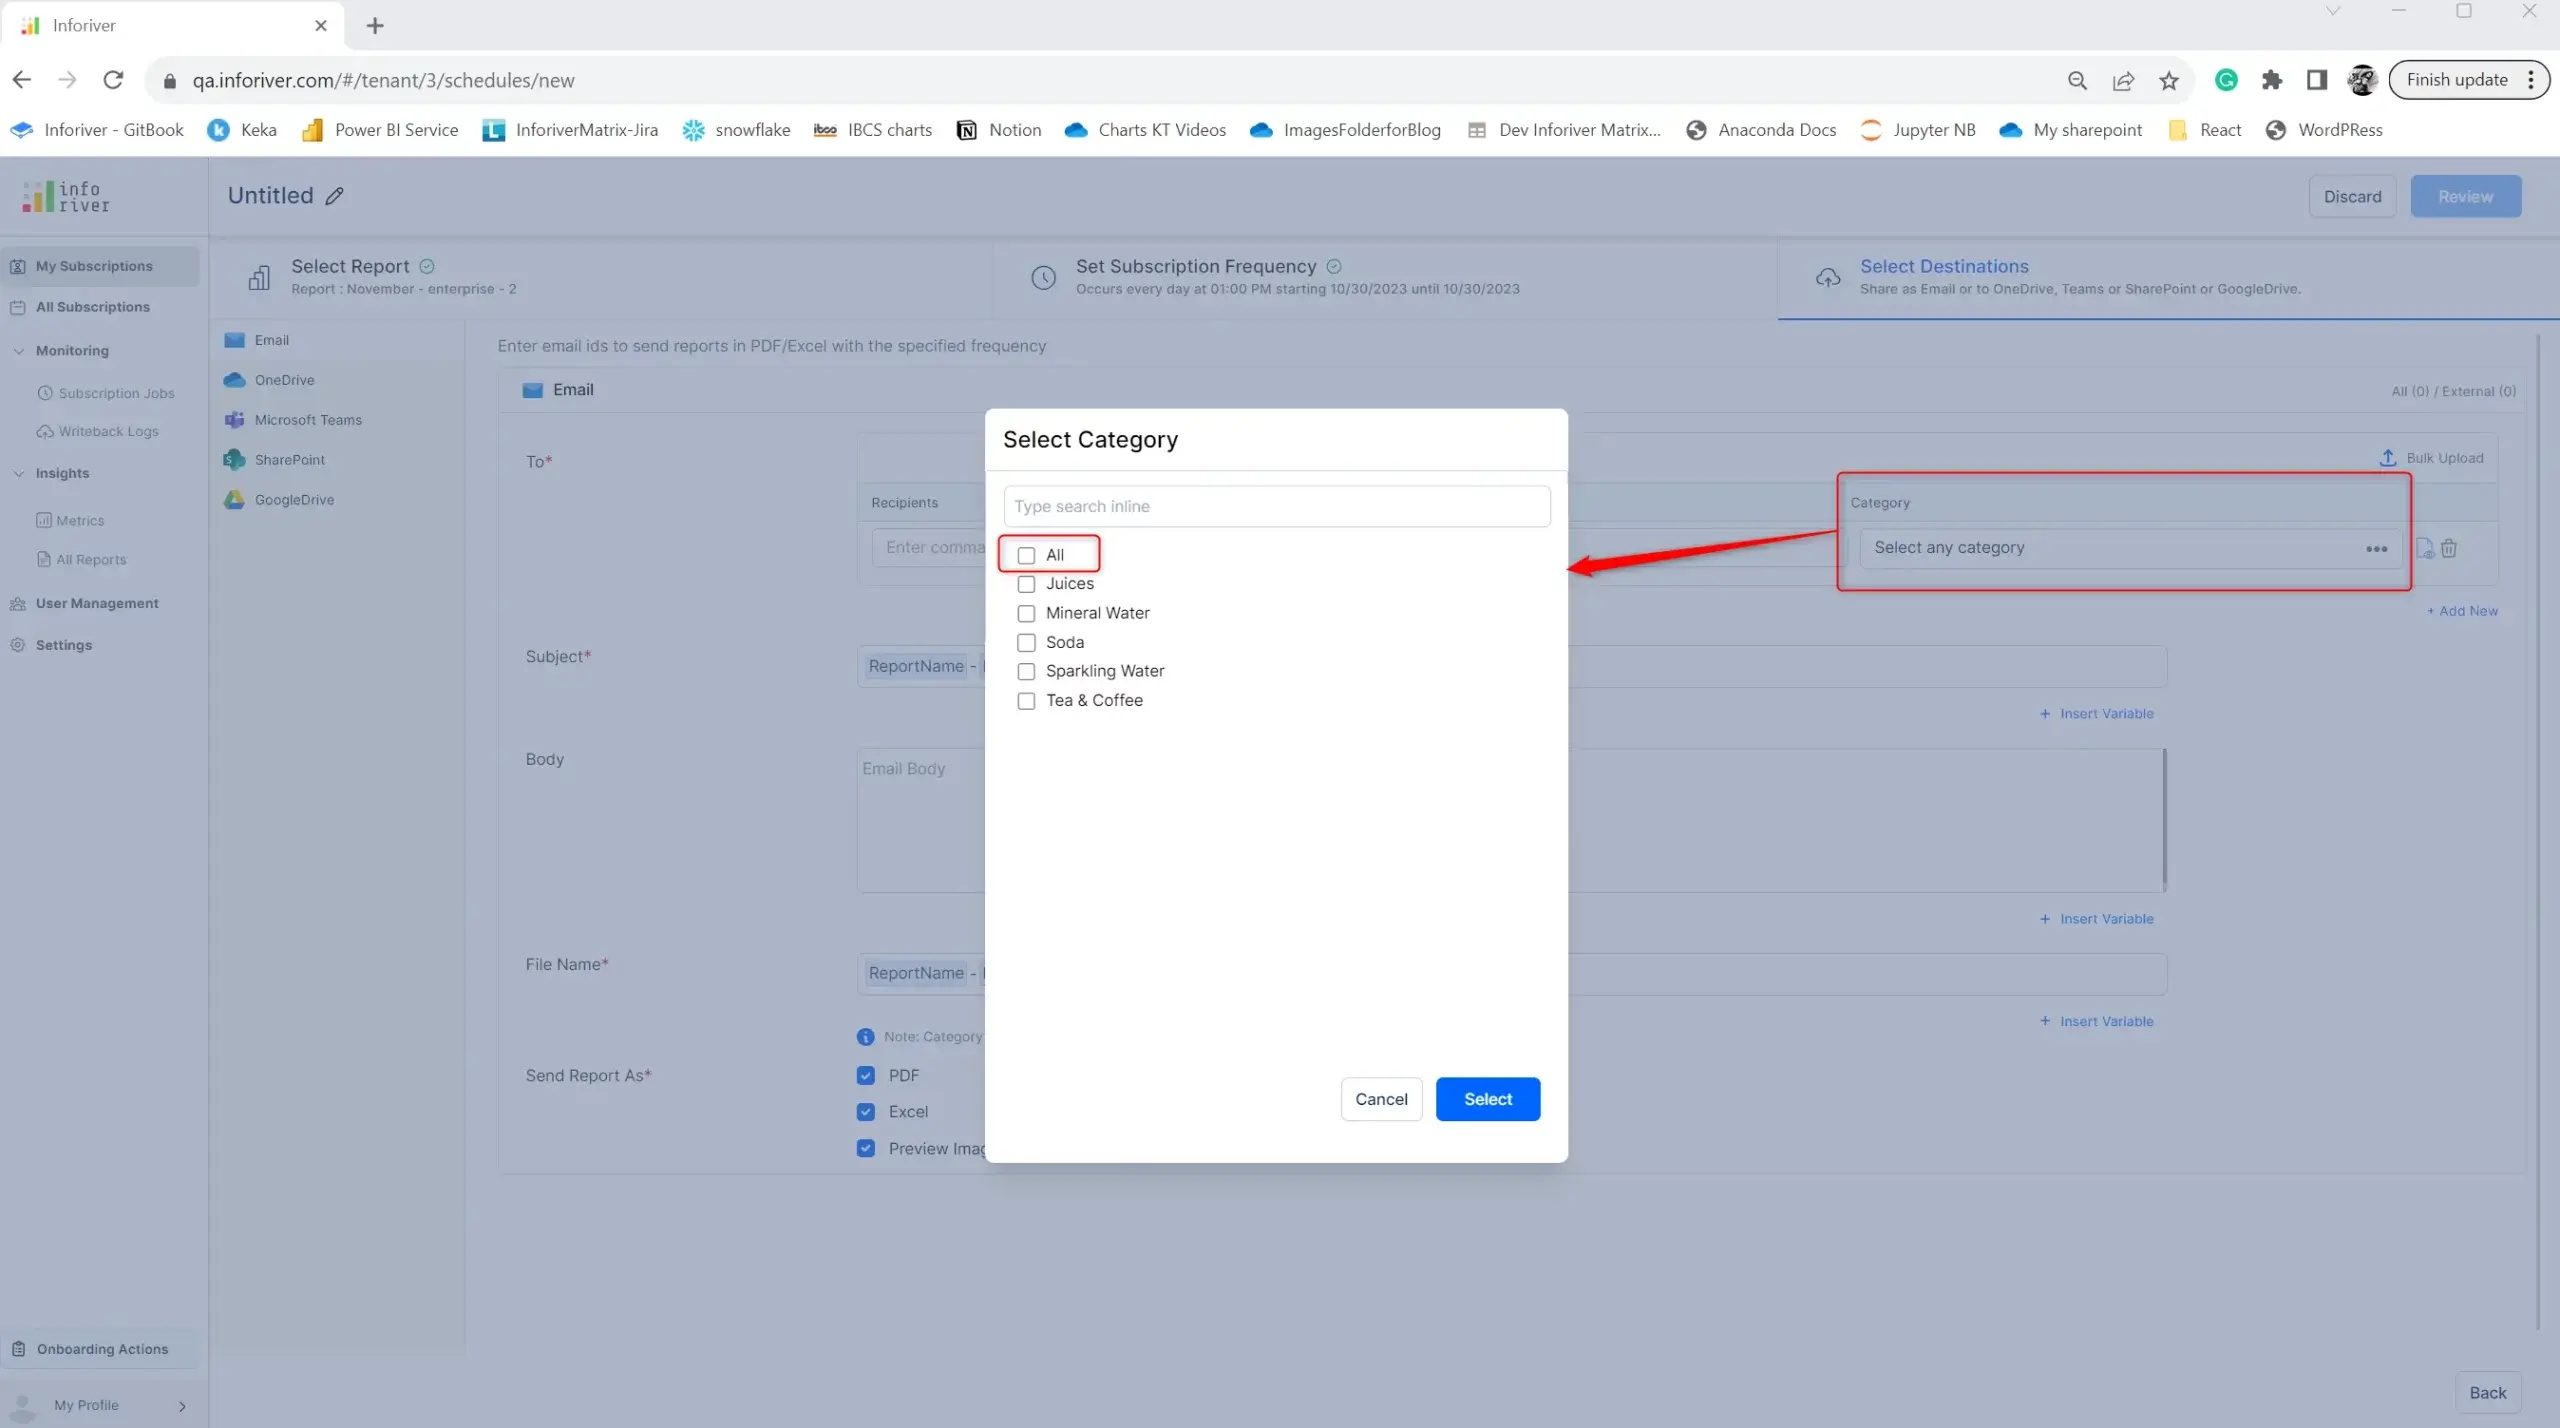
If your report uses Inforiver’s Report+ layouts, you can schedule reports in such a way that specific users receive details only on specific categories in their schedule reports. E.g., US Regional Manager will receive sales details only for the US region. But you had to select these categories one by one while scheduling. In 2.6, the scheduler has a convenient ‘All’ option to select all the categories in your dataset.
Inforiver’s new on-load scripting feature enables you to list a set of actions to be performed on loading the visual. You can display messages, set the layout, hide columns or apply filters as the visual is loaded. The scripts will be executed when you open the report, switch to the tab containing the visual or refresh the visual. Inforiver offers an array of built-in functions that you can use to effortlessly set up scripts.
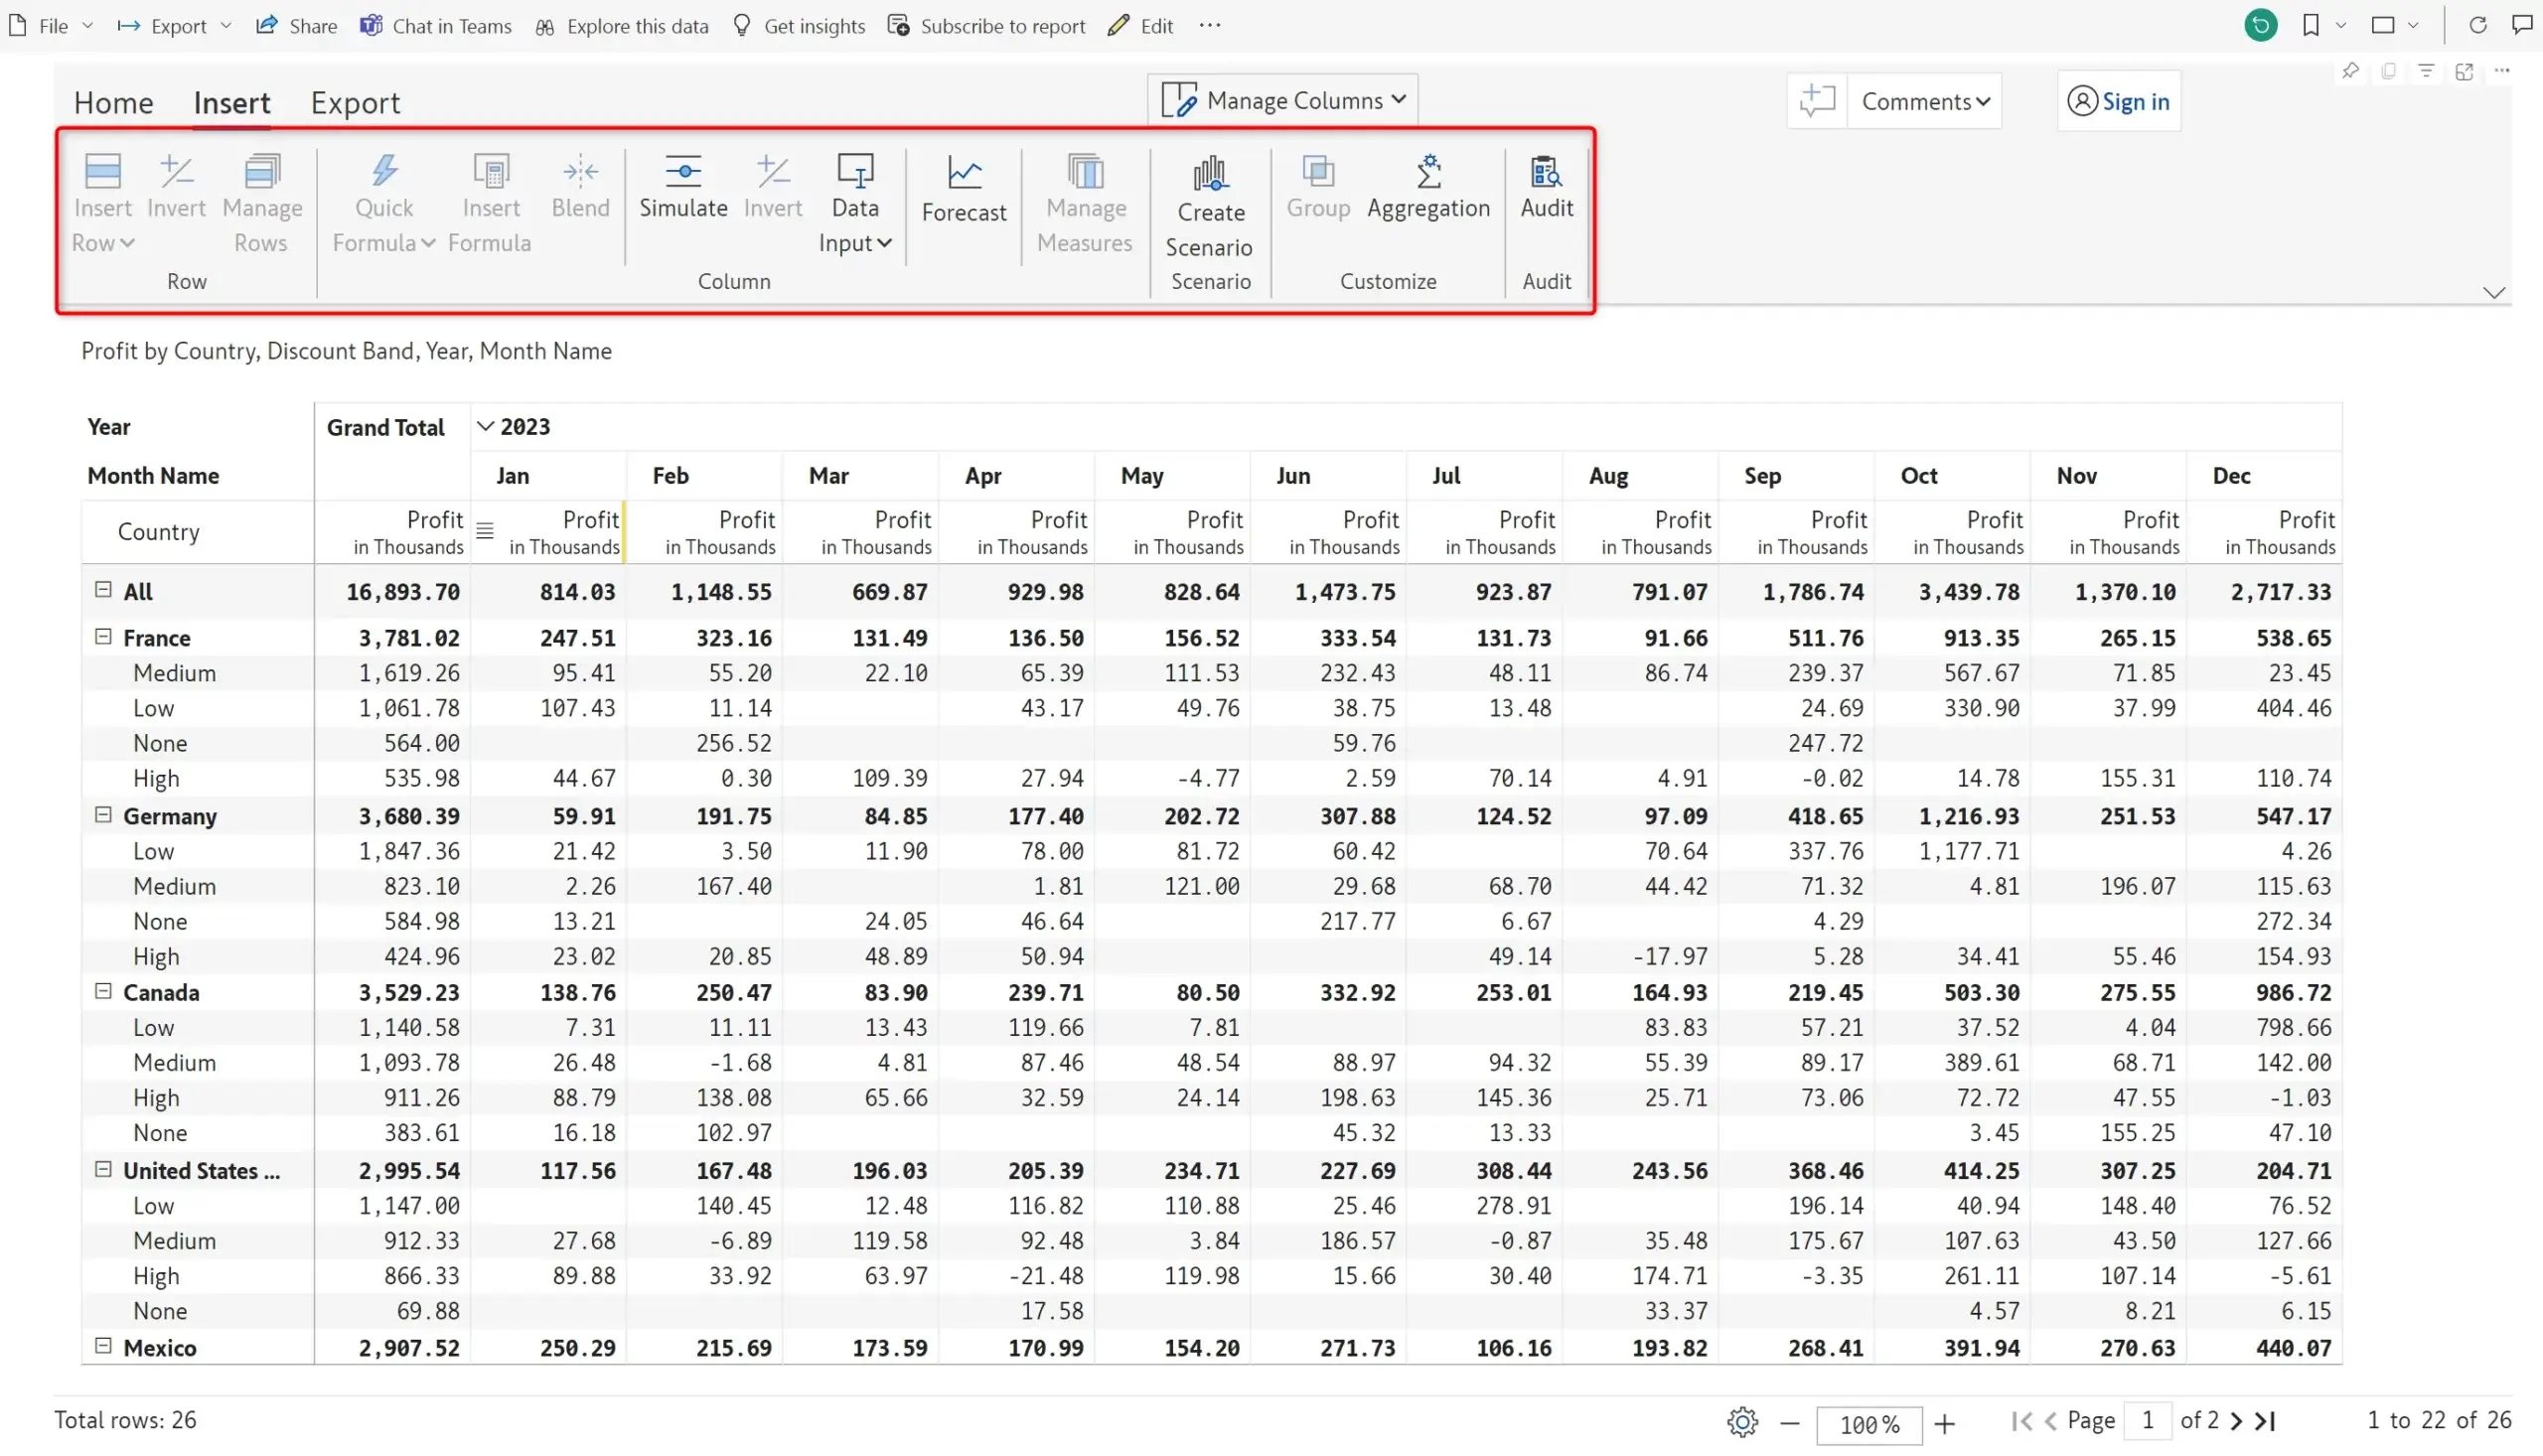
Inforiver 2.6 increases the number of actions users can perform in the reading mode. Toolbar items in the Insert tab, such as Data input, Simulations, Aggregations, Forecasts, Scenarios etc, can now be leveraged in reading mode. You can also control which of these features will be made available in the reading view from the Allowed User Controls window.
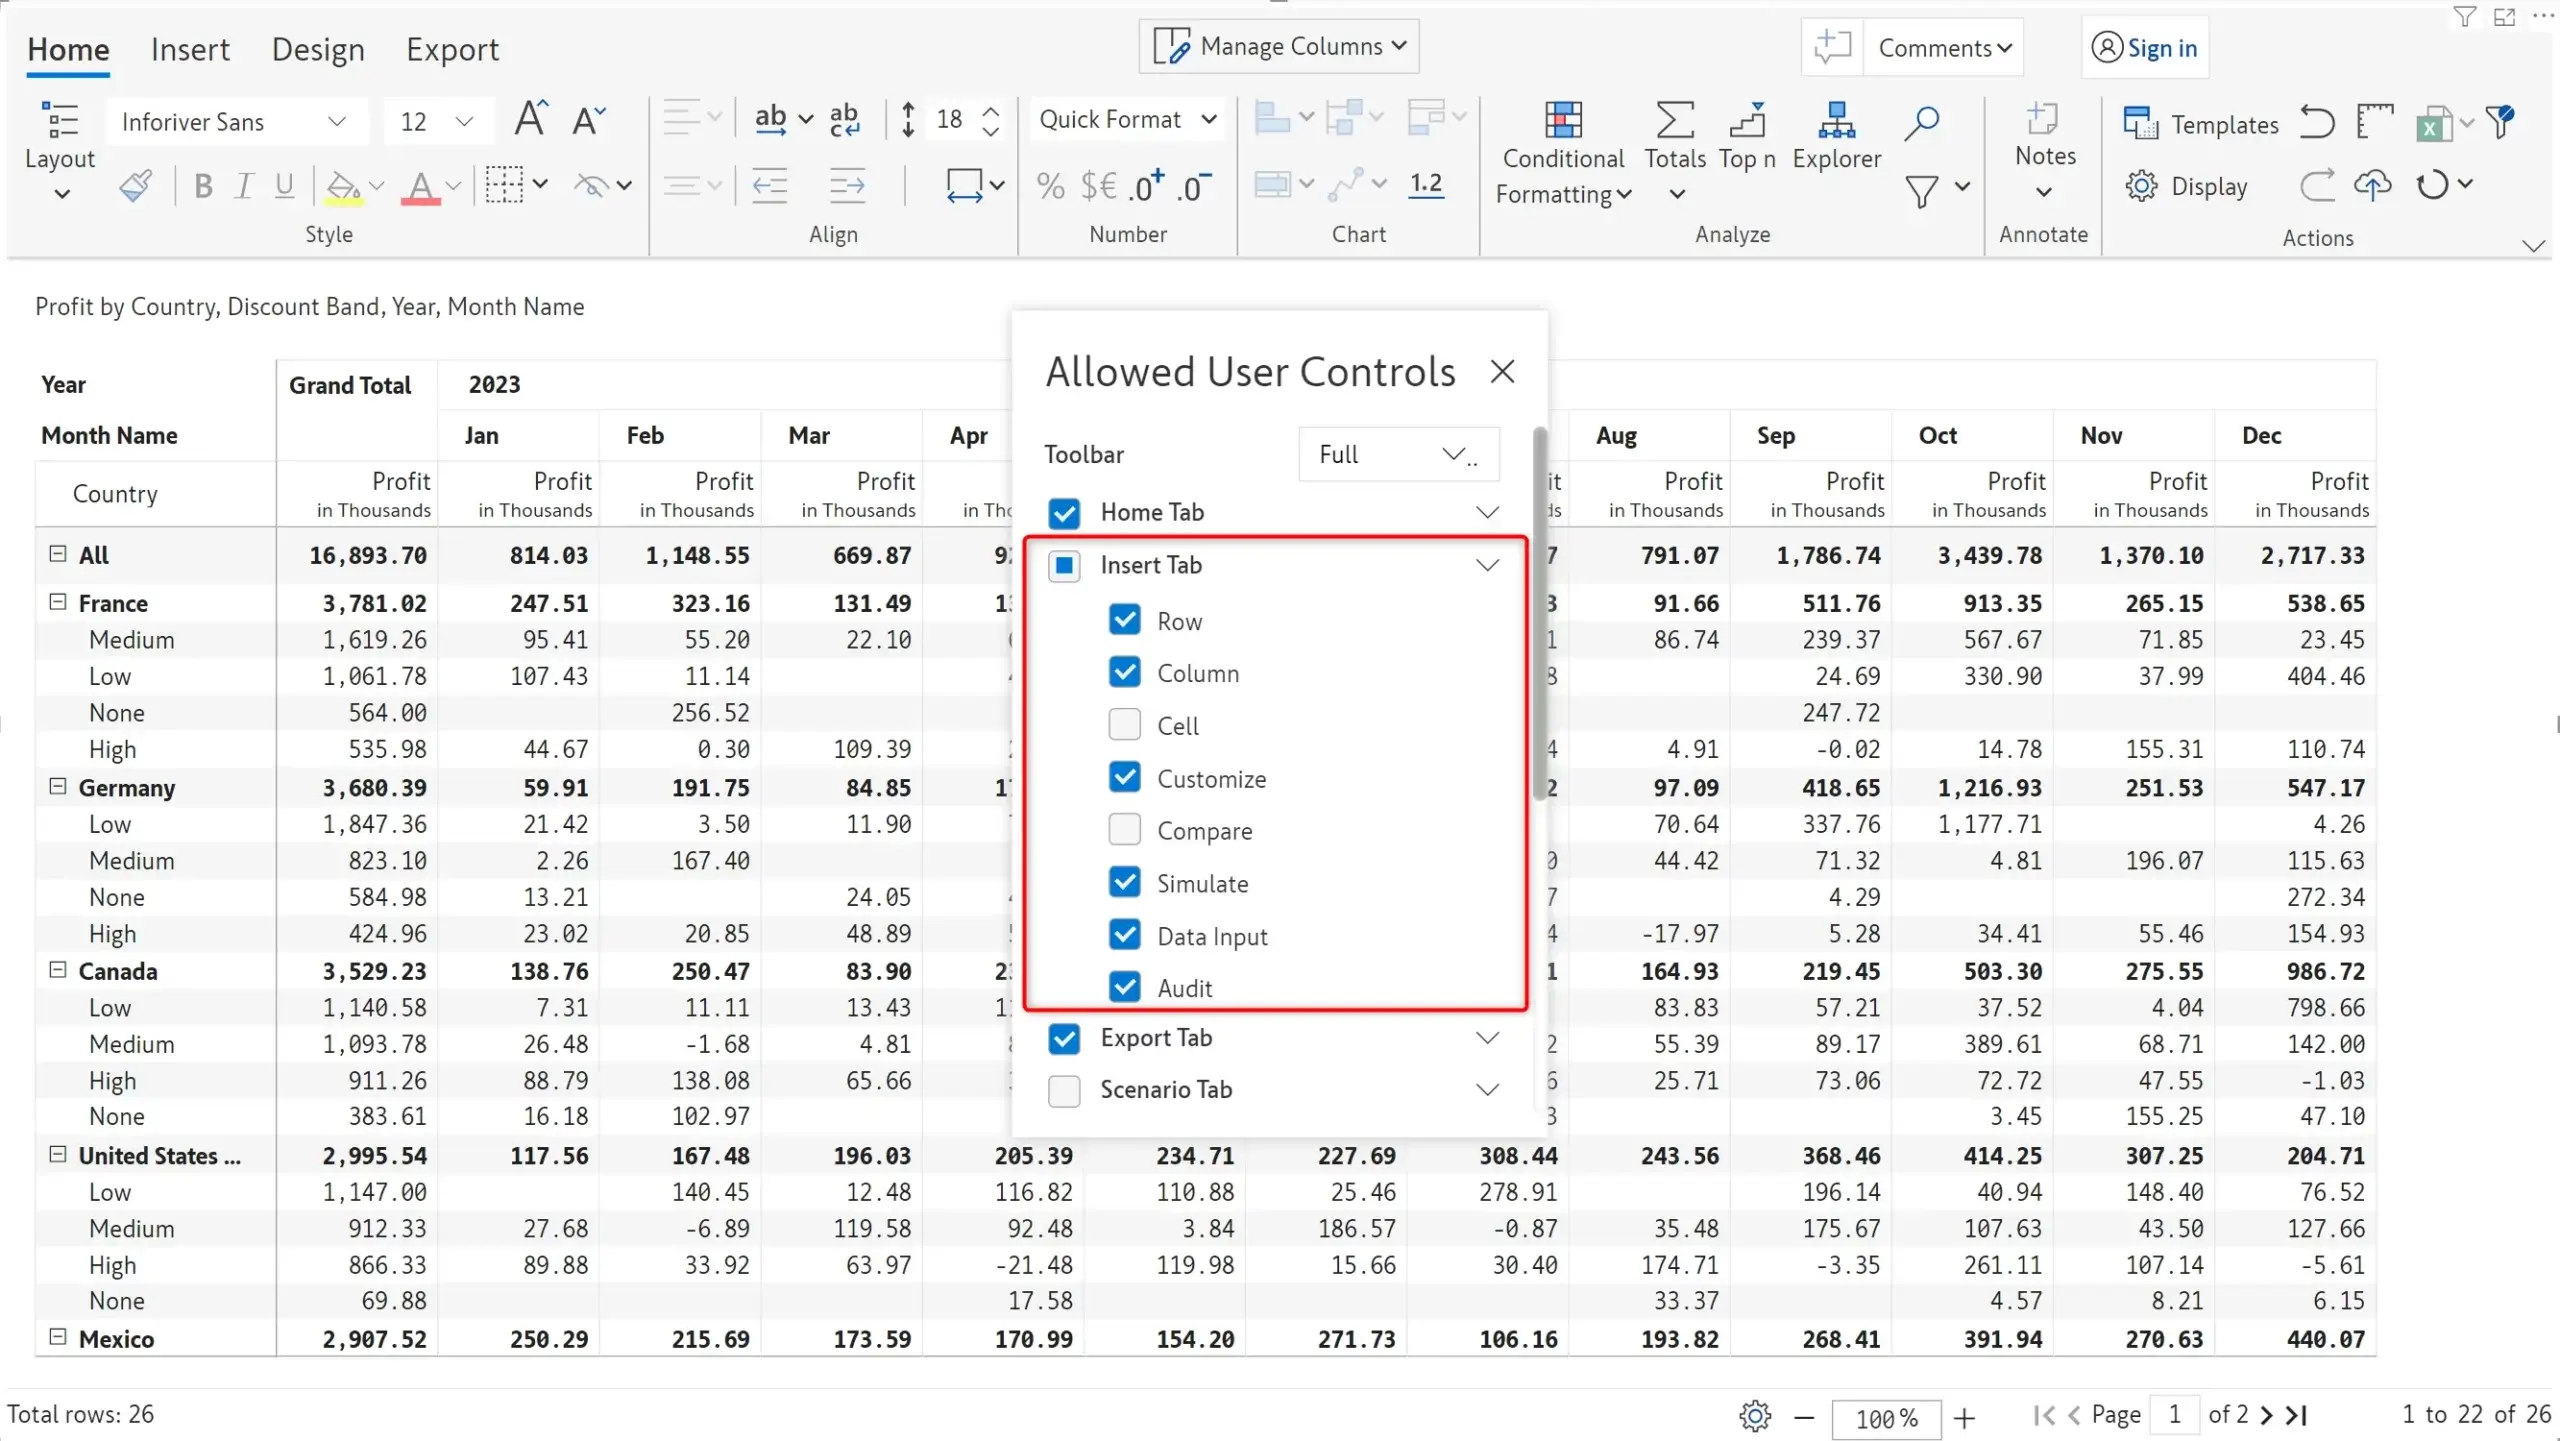
Note: Row operations and column operations such as Formulae and Blend are not available for reading view configuration and they will be made available in subsequent releases. In the 2.6. version, these buttons are disabled in the reading view.
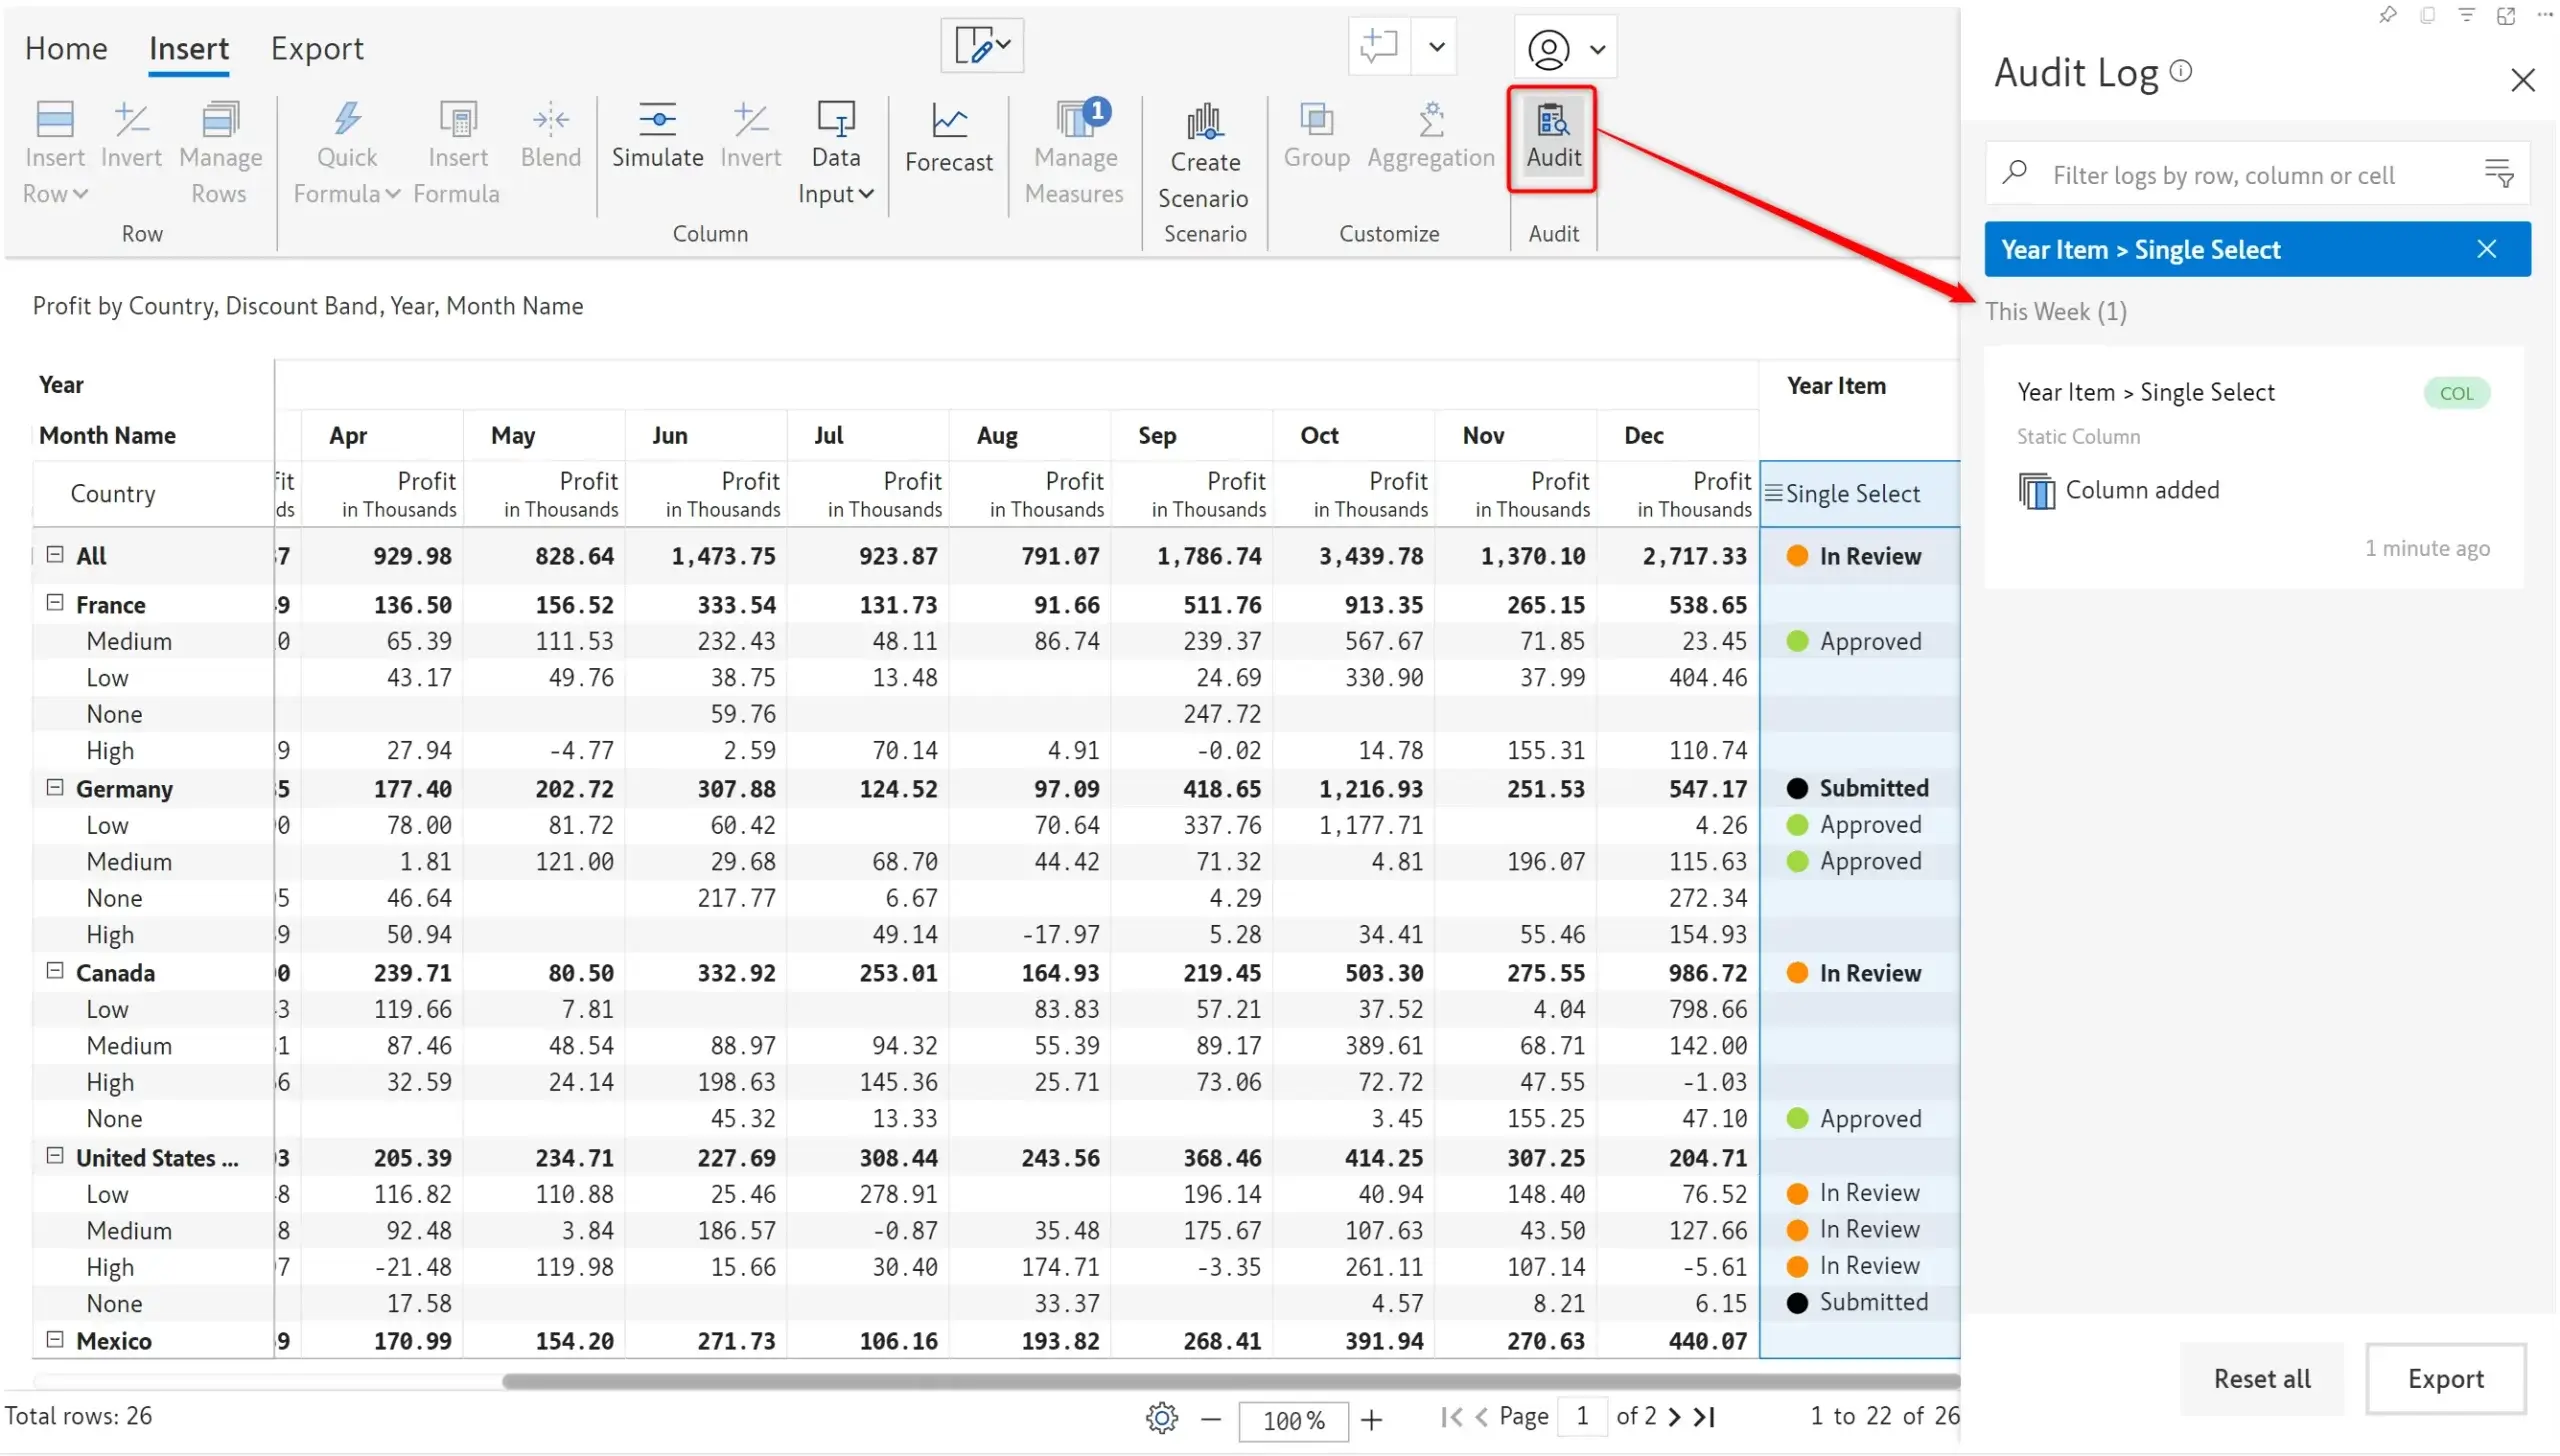
An Audit button has also been added to the Reading view pane, allowing uses to view, search and keep track of changes made to the report.
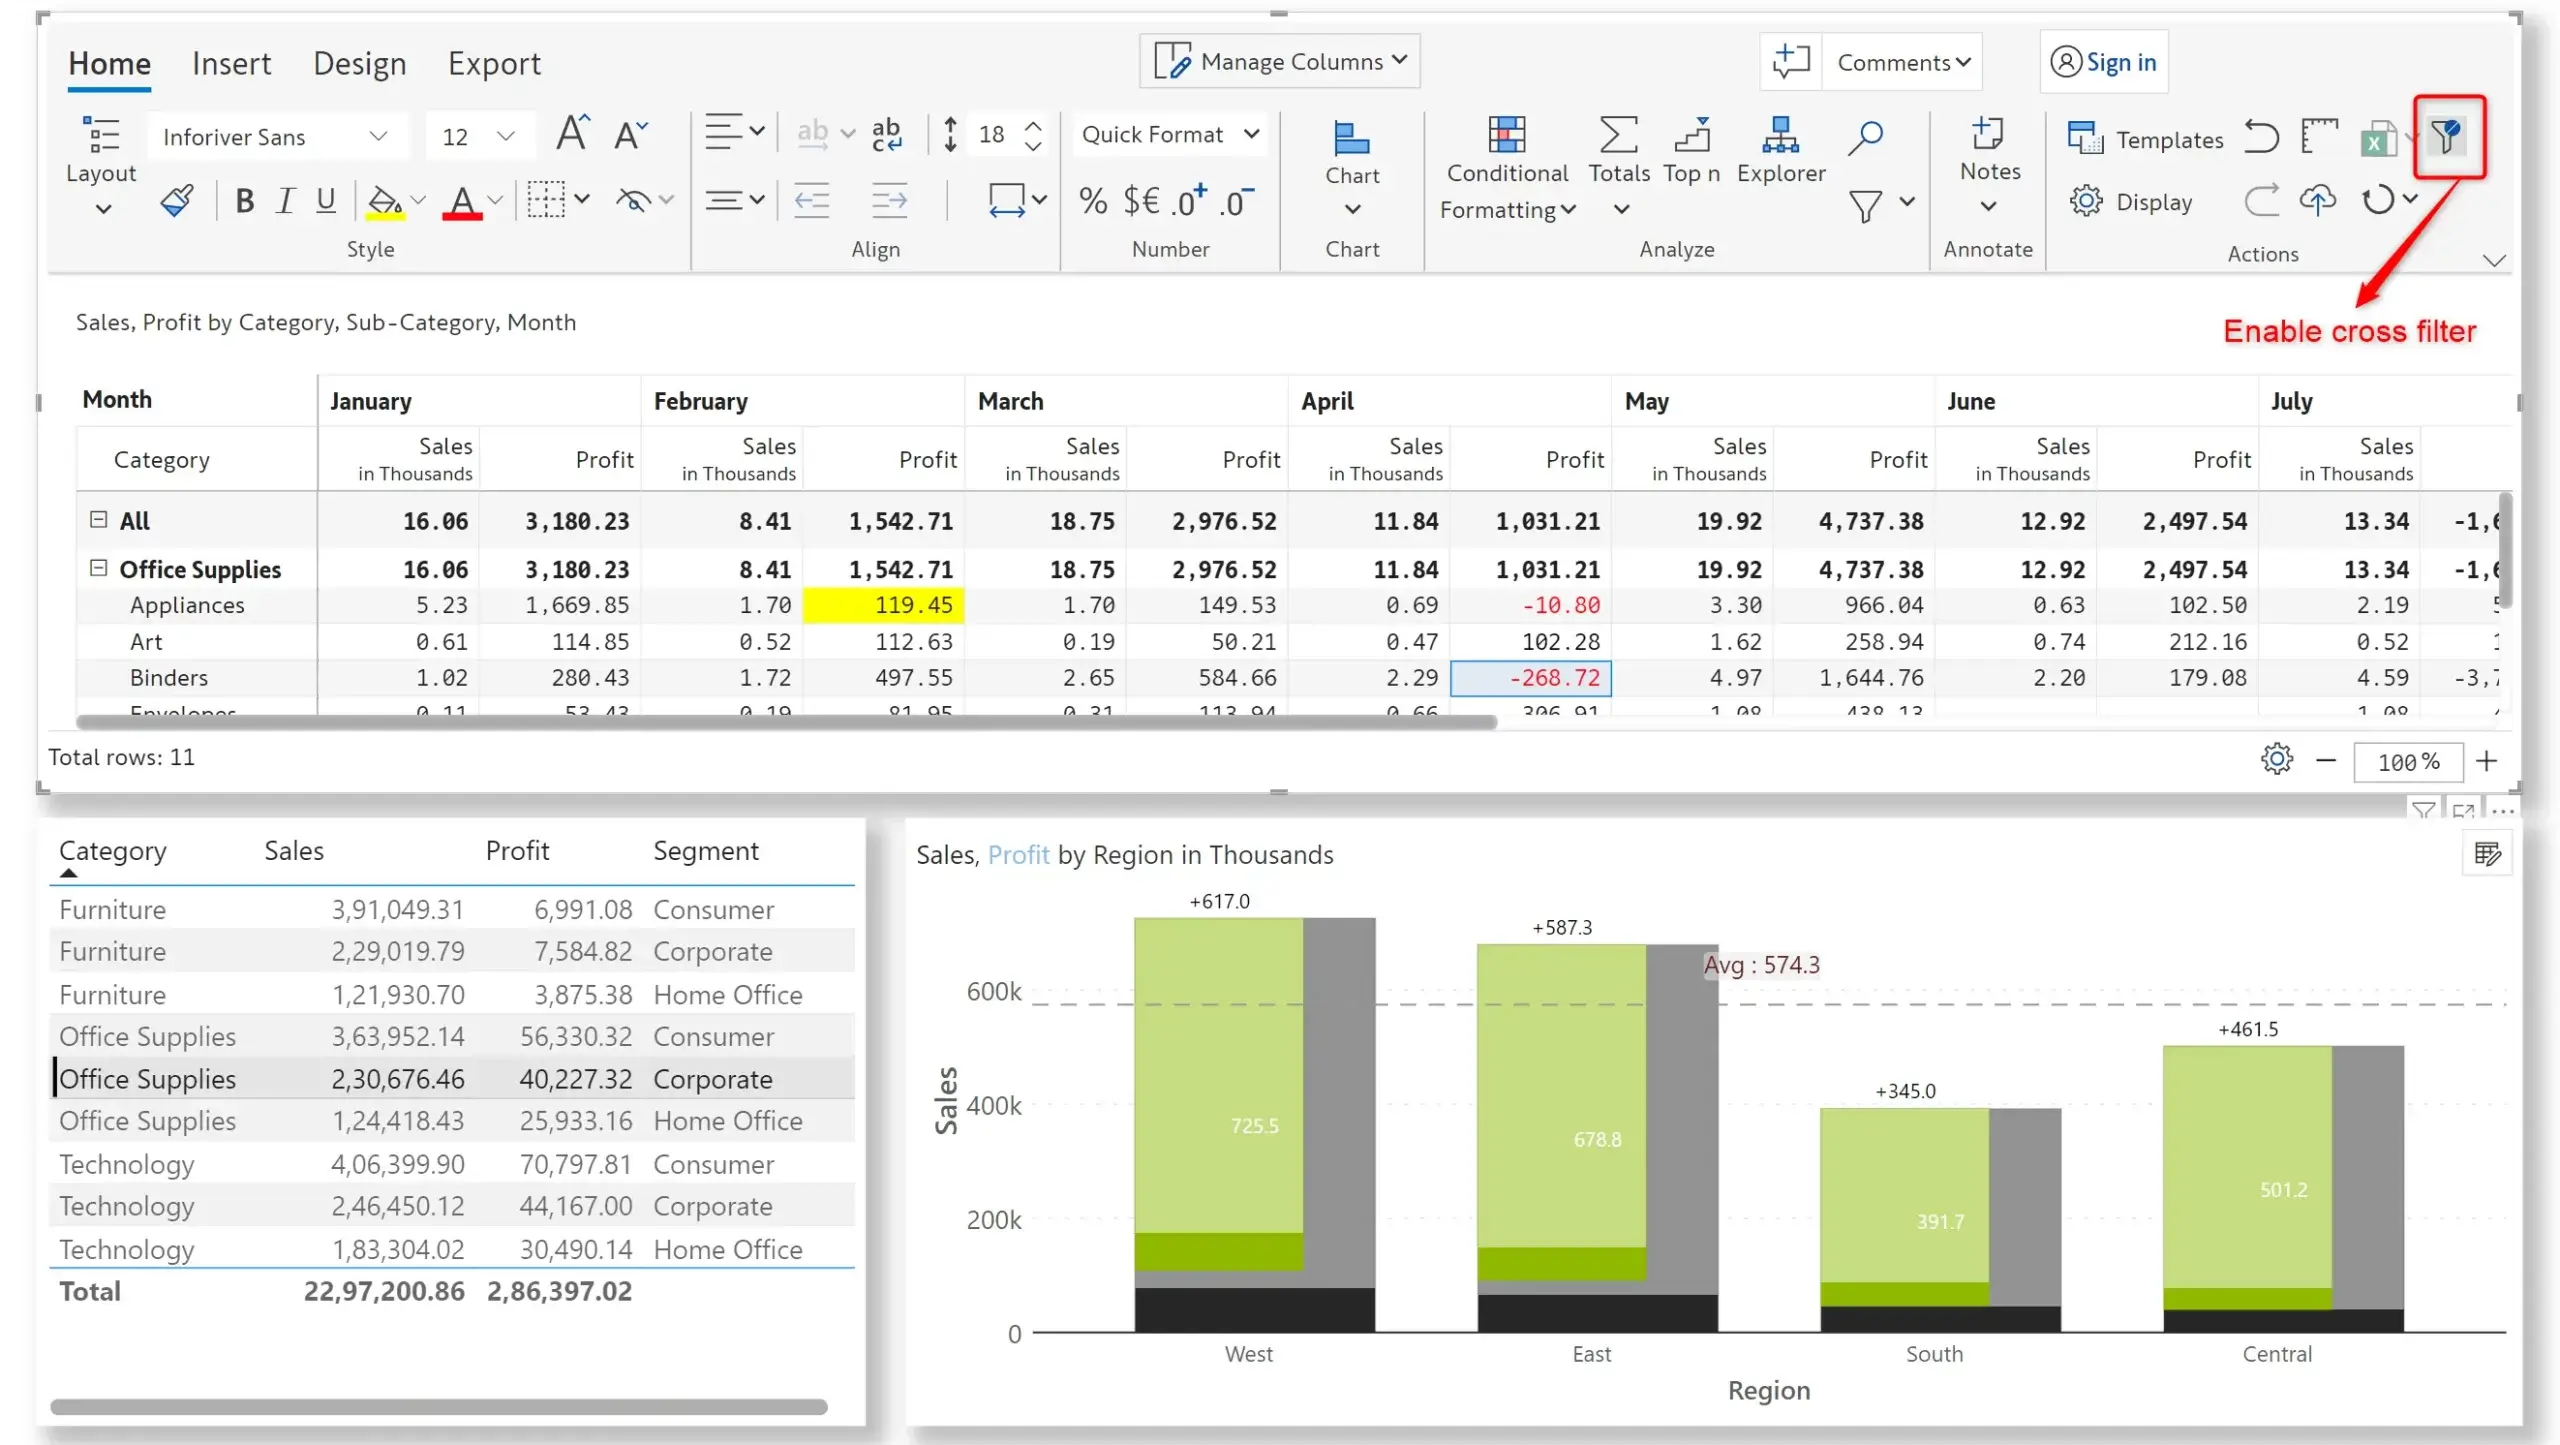
Dashboards often contain multiple visuals that interact with each other. Inforiver has a new ‘Cross Filter Selection’ option that allows you to retain filtered data while using features within the Matrix. In earlier versions, clicking inside the Matrix visual would remove any external filters and all the data would be displayed.
In the image below, the filter on office supplies from the table visual is retained while formatting changes are made in the Reporting Matrix visual. You can use all the capabilities available in the Matrix, including applying formulae or running simulations or even changing the layout.
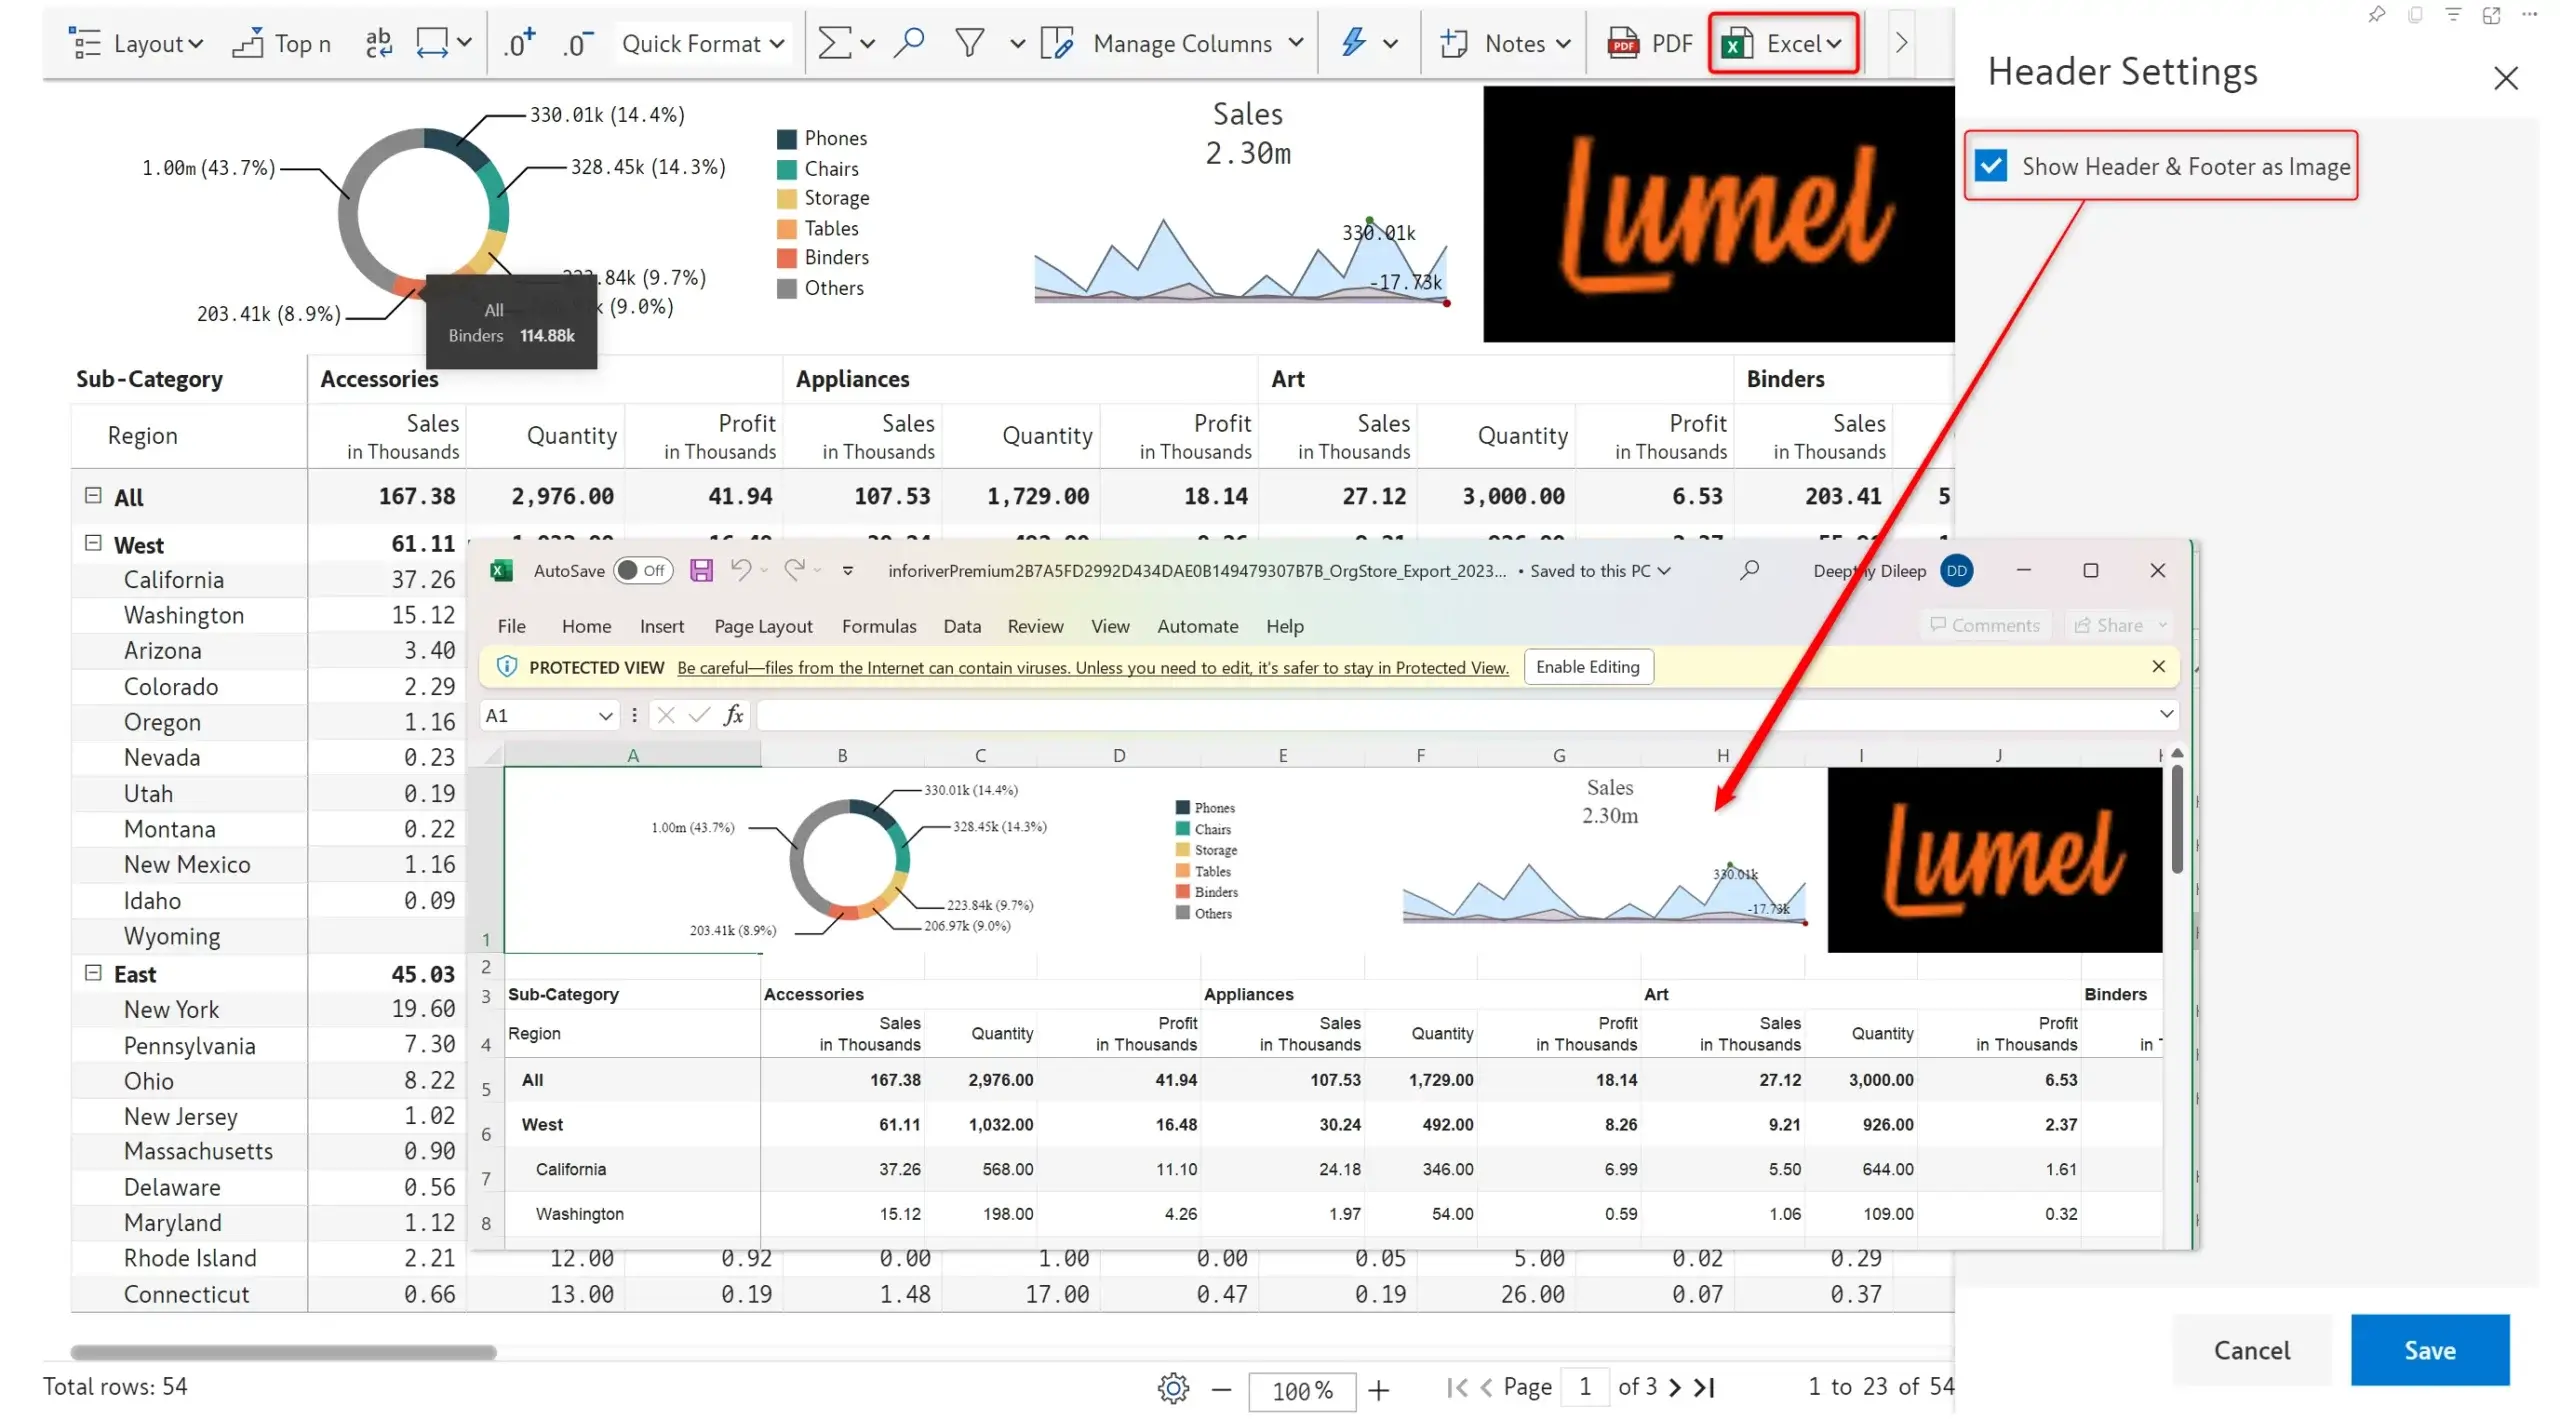
The latest 2.6. release provides extended support for exporting header elements such as dates and symbols. From the new header settings UI, you can quickly select the lines of the header which you want exported to an excel file.
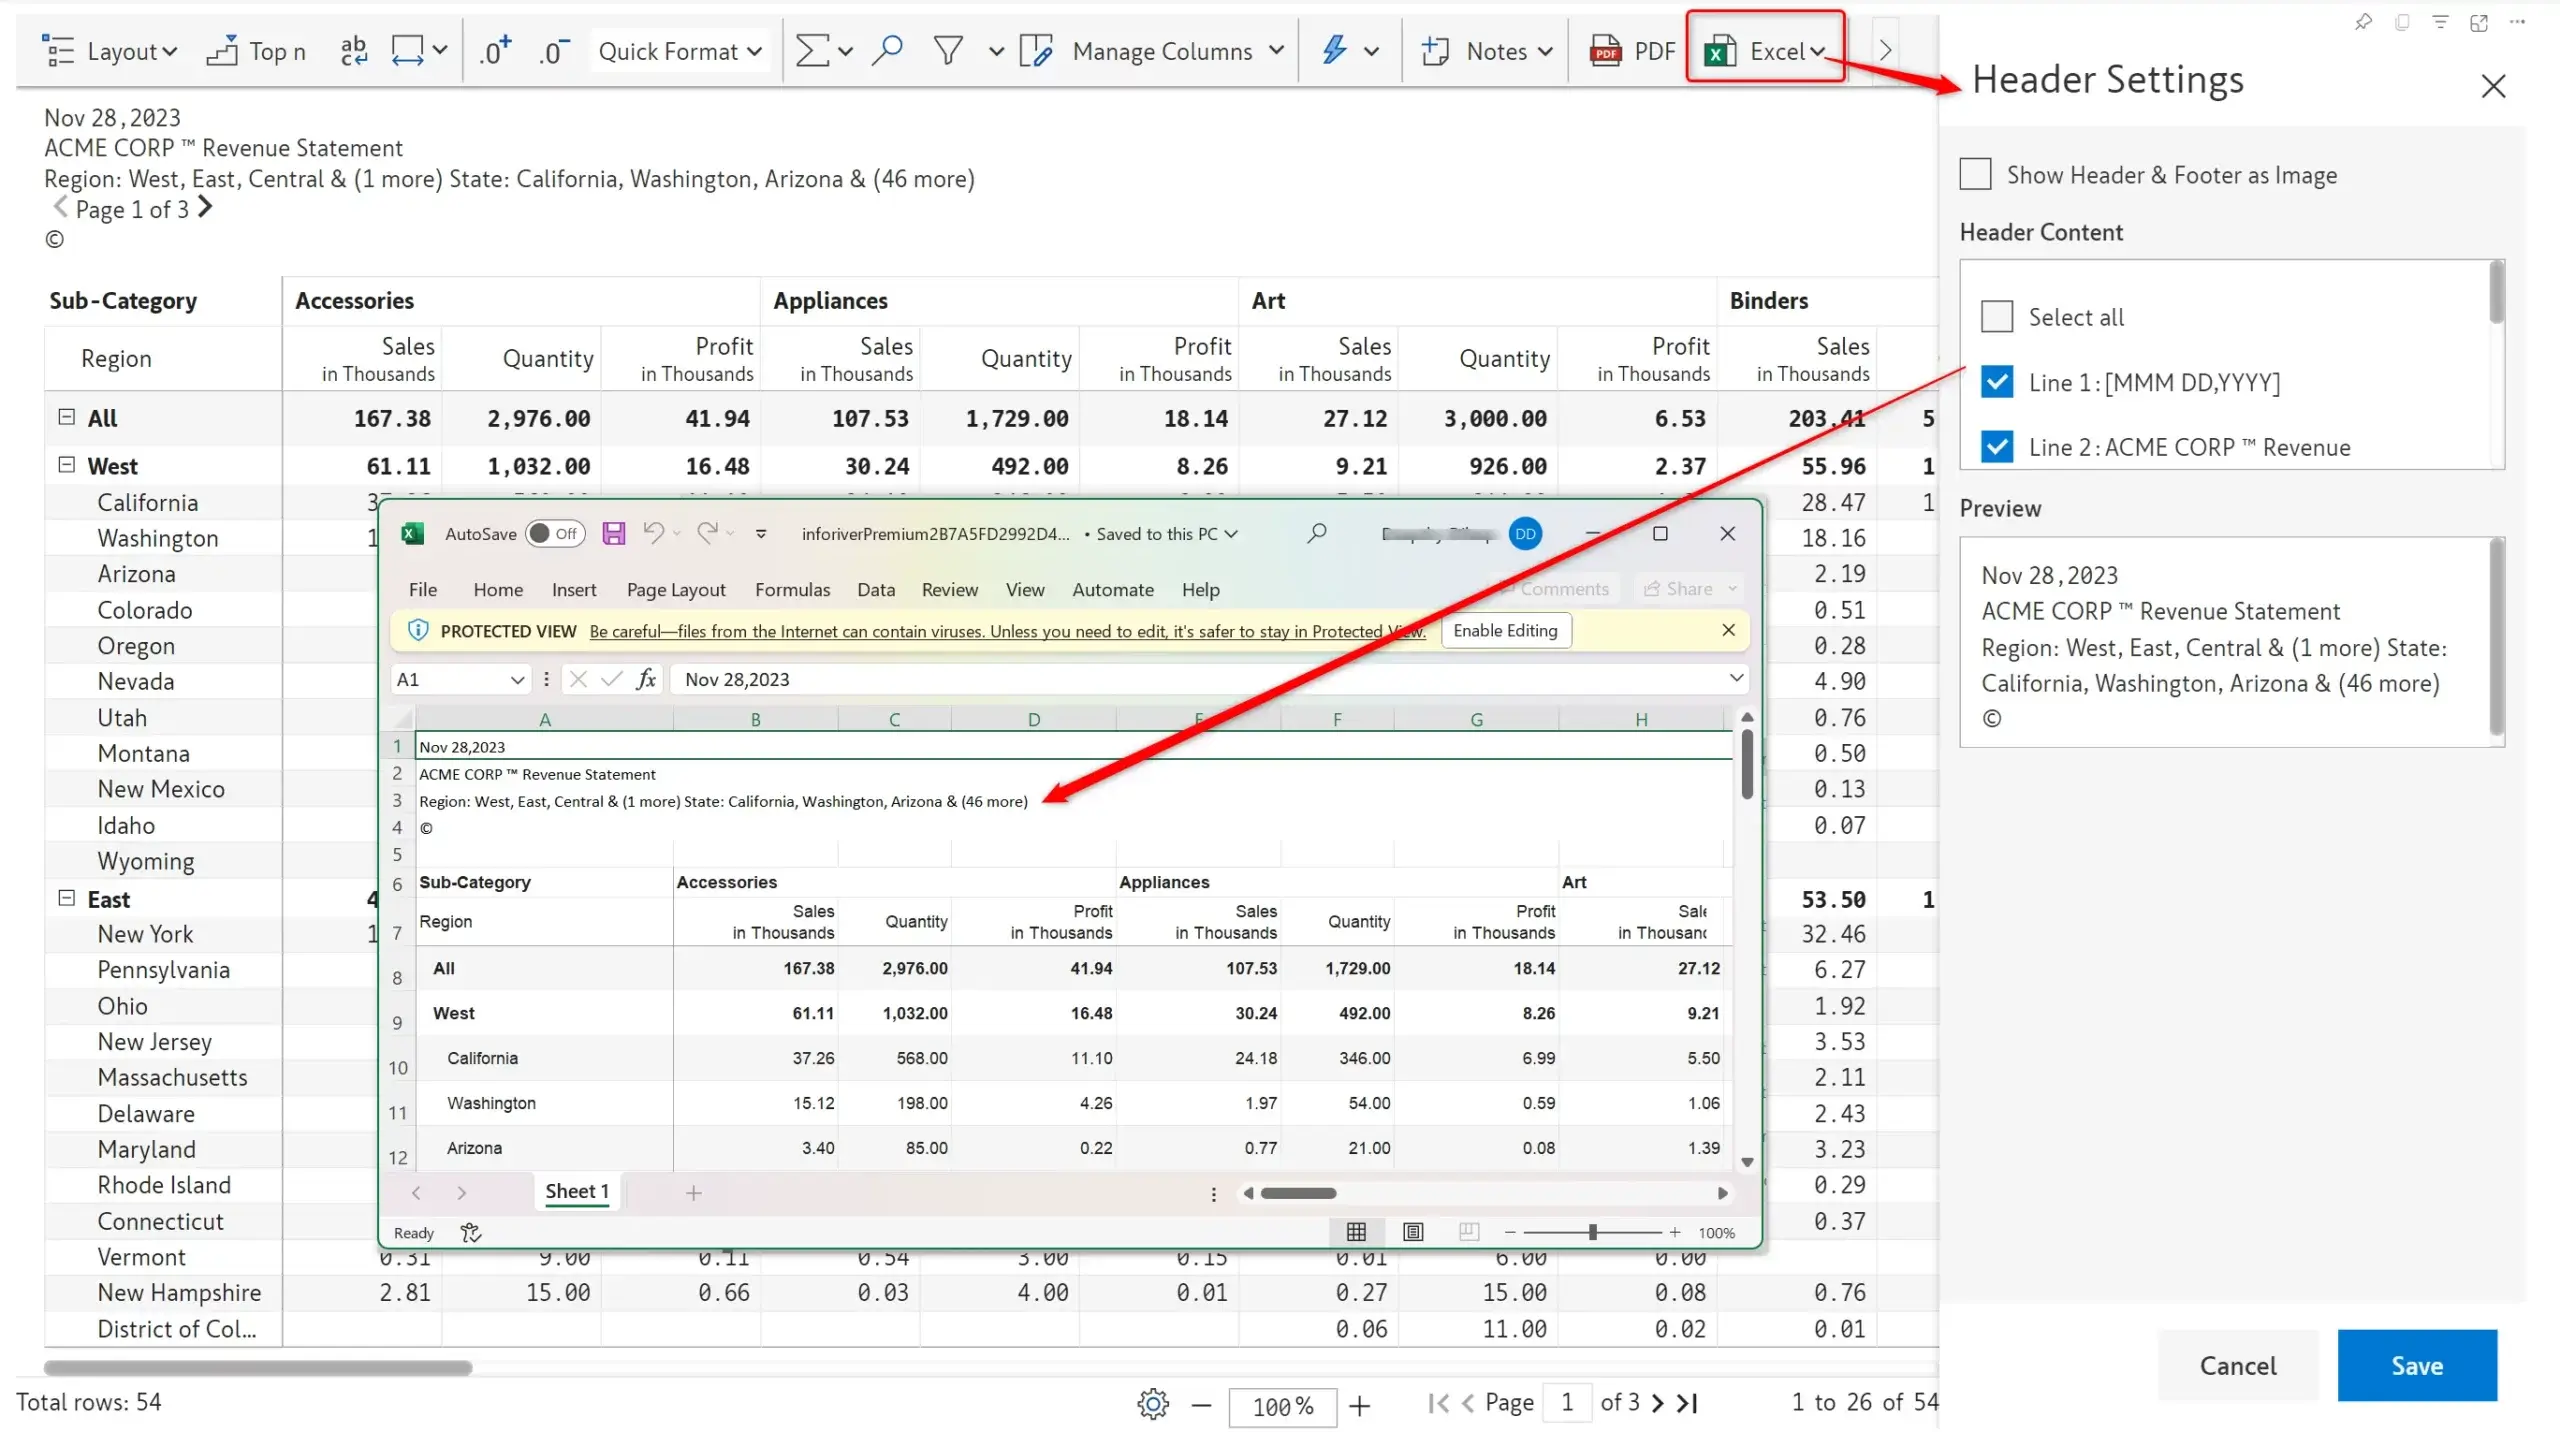
If your reports use charts or images in the header and footer, Inforiver enables you to export them as an image to an excel file.
We'd love to hear your ideas for Inforiver – be it a cool new feature or an improvement on existing features. Visit the Inforiver Community to share your ideas, vote on other submissions, and interact with other users.

Inforiver helps enterprises consolidate planning, reporting & analytics on a single platform (Power BI). The no-code, self-service award-winning platform has been recognized as the industry’s best and is adopted by many Fortune 100 firms.
Inforiver is a product of Lumel, the #1 Power BI AppSource Partner. The firm serves over 3,000 customers worldwide through its portfolio of products offered under the brands Inforiver, EDITable, ValQ, and xViz.
 Transform Power BI dashboards into decision-driving tools. Discover data visualization best practices tailored for Power BI users.