Upcoming webinar on 'Inforiver Charts : The fastest way to deliver stories in Power BI', Aug 29th , Monday, 10.30 AM CST. Register Now
Upcoming webinar on 'Inforiver Charts : The fastest way to deliver stories in Power BI', Aug 29th , Monday, 10.30 AM CST. Register Now
Welcome to the Inforiver Enterprise 2.6.5 release update!
The December release ships with exciting new features like snapshot comparison and scheduling Analytics+ visuals using Inforiver Scheduler. We also have enhancements across writeback, forecasting, and commenting - most anticipated by the Inforiver user community!
Key enhancements in this release are listed below. Feel free to use the shortcuts to jump to any specific section.
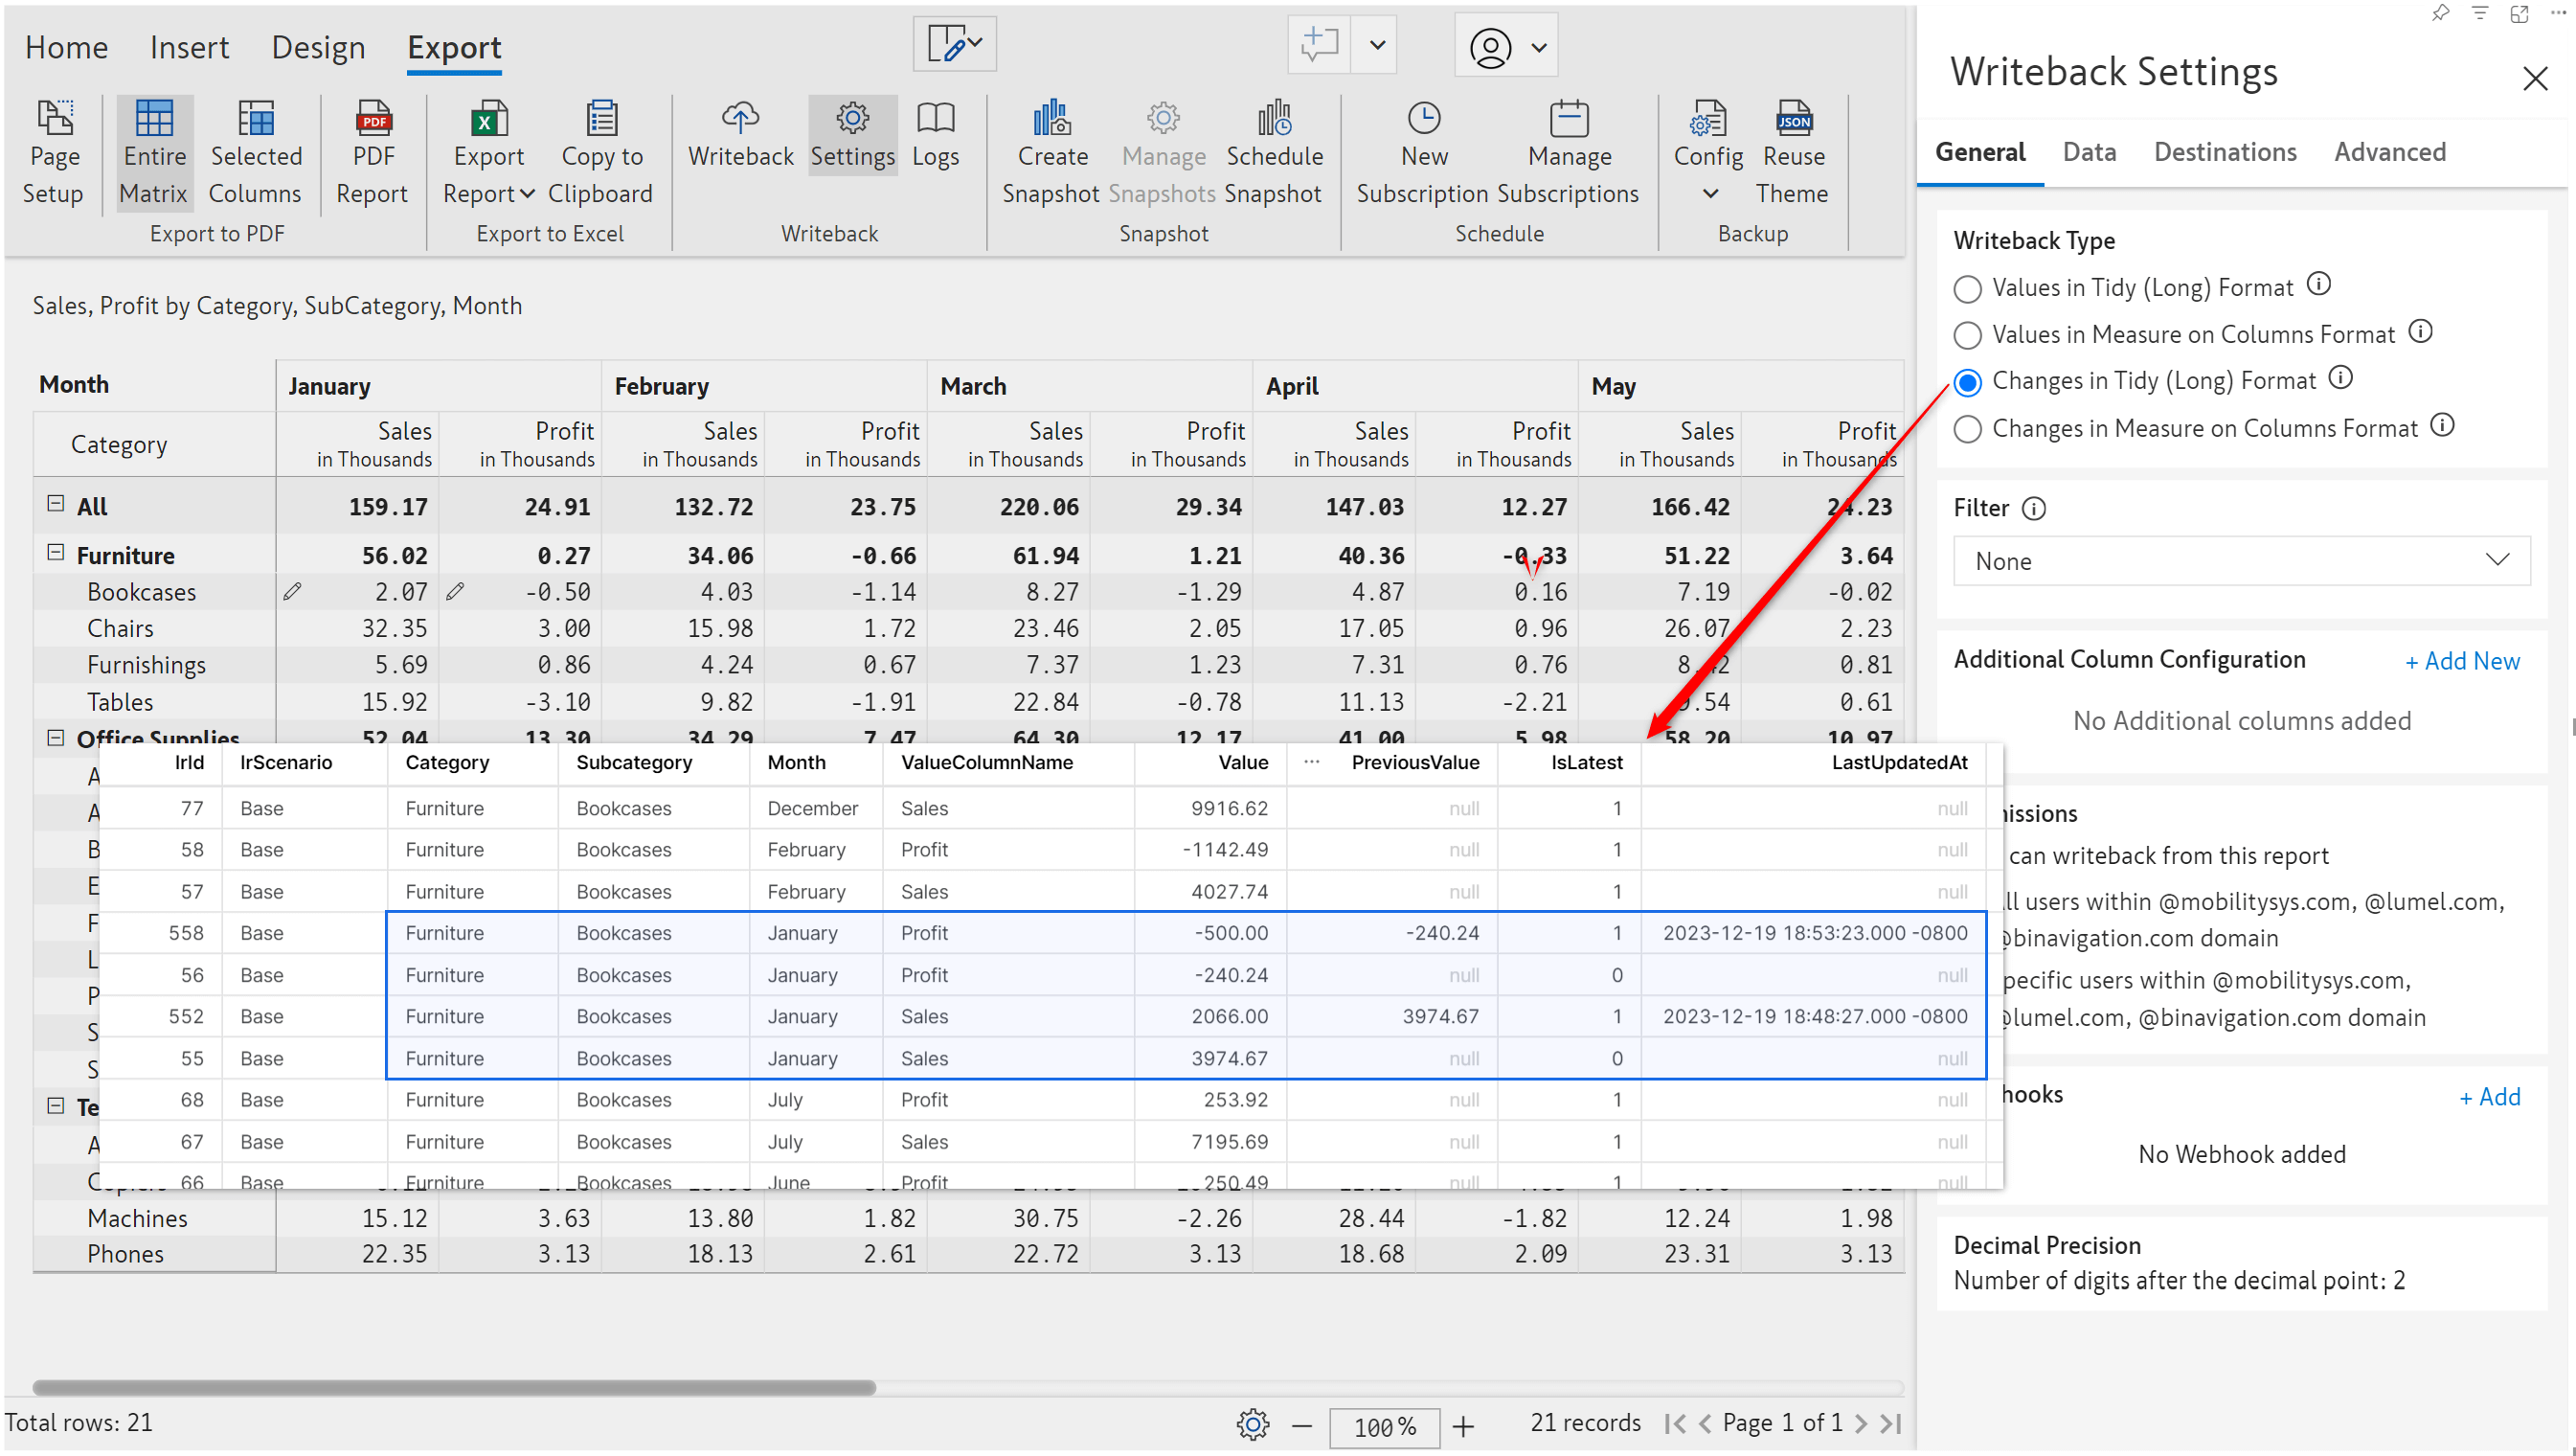
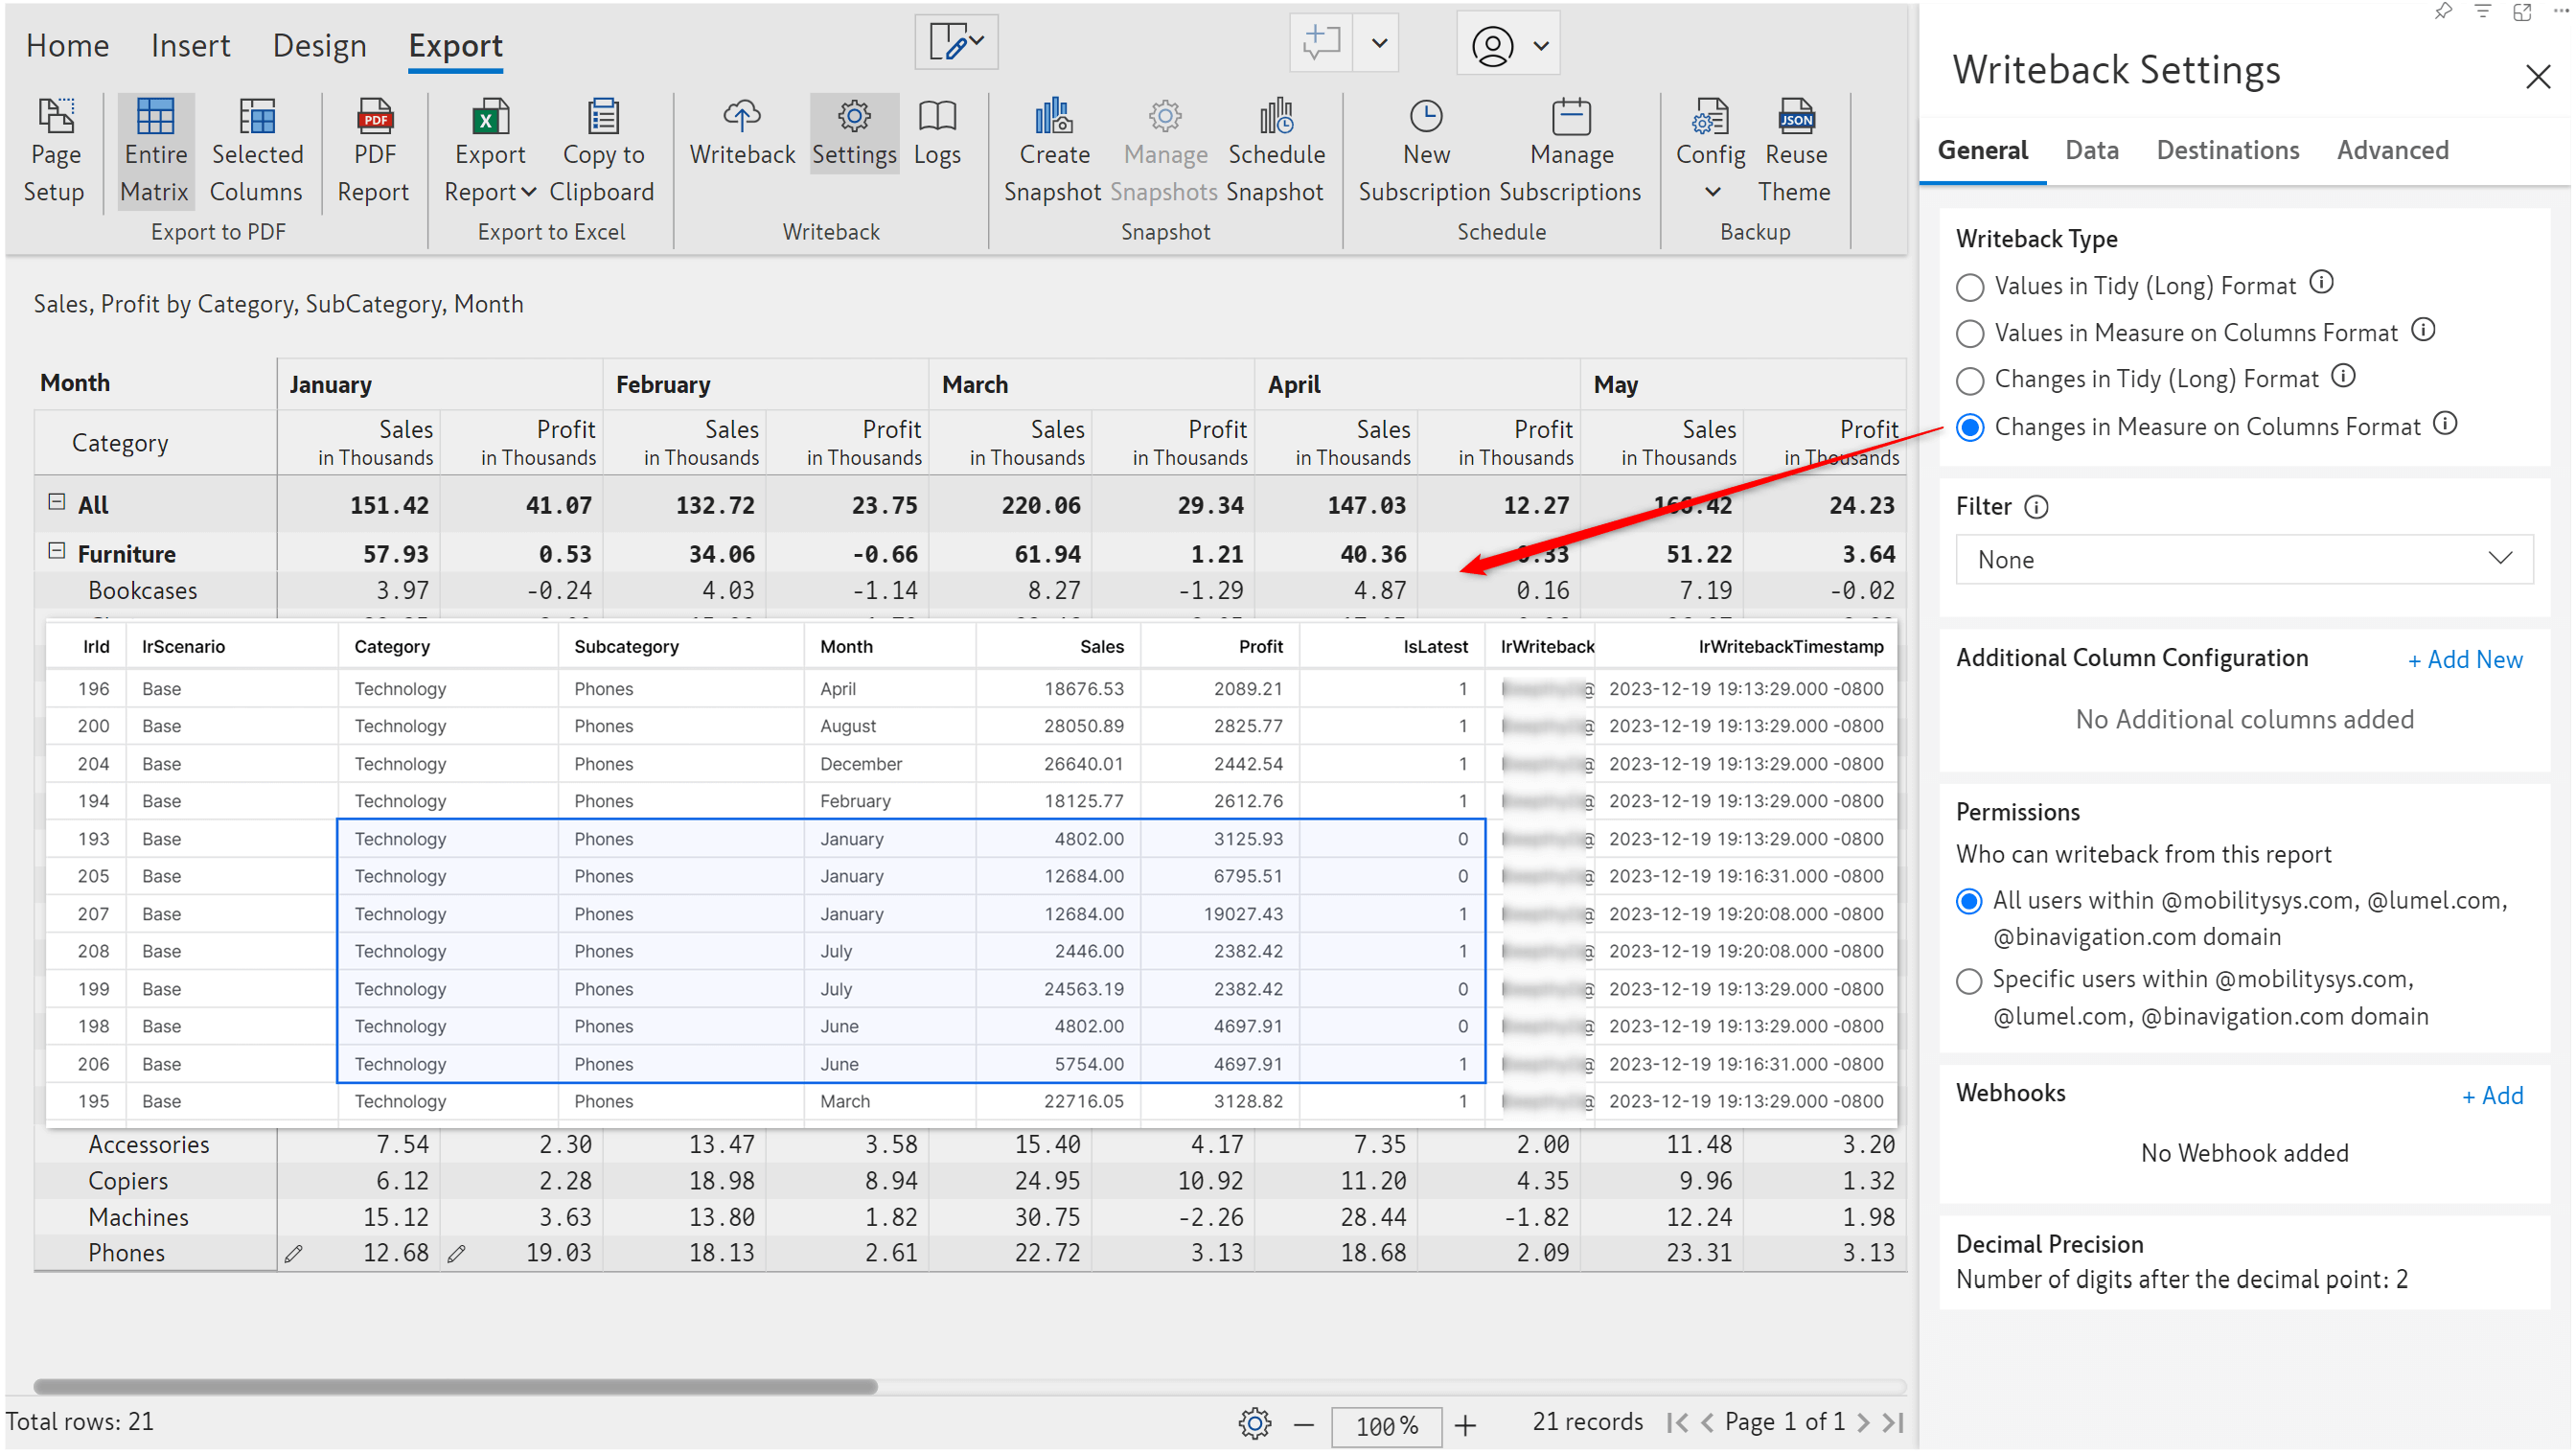
Inforiver’s writeback feature now supports delta writeback (only the changed records are written back) in 2 formats:
The ‘IsLatest’ field can be used to identify the latest record that was written back. A value of 1 indicates that a particular record is the current active record. The change log is maintained in both formats, enabling you to grasp the history of updates made quickly.
Delta writeback in the ‘tidy (long)’ format:
Delta writeback in the ‘measure on column’ format:
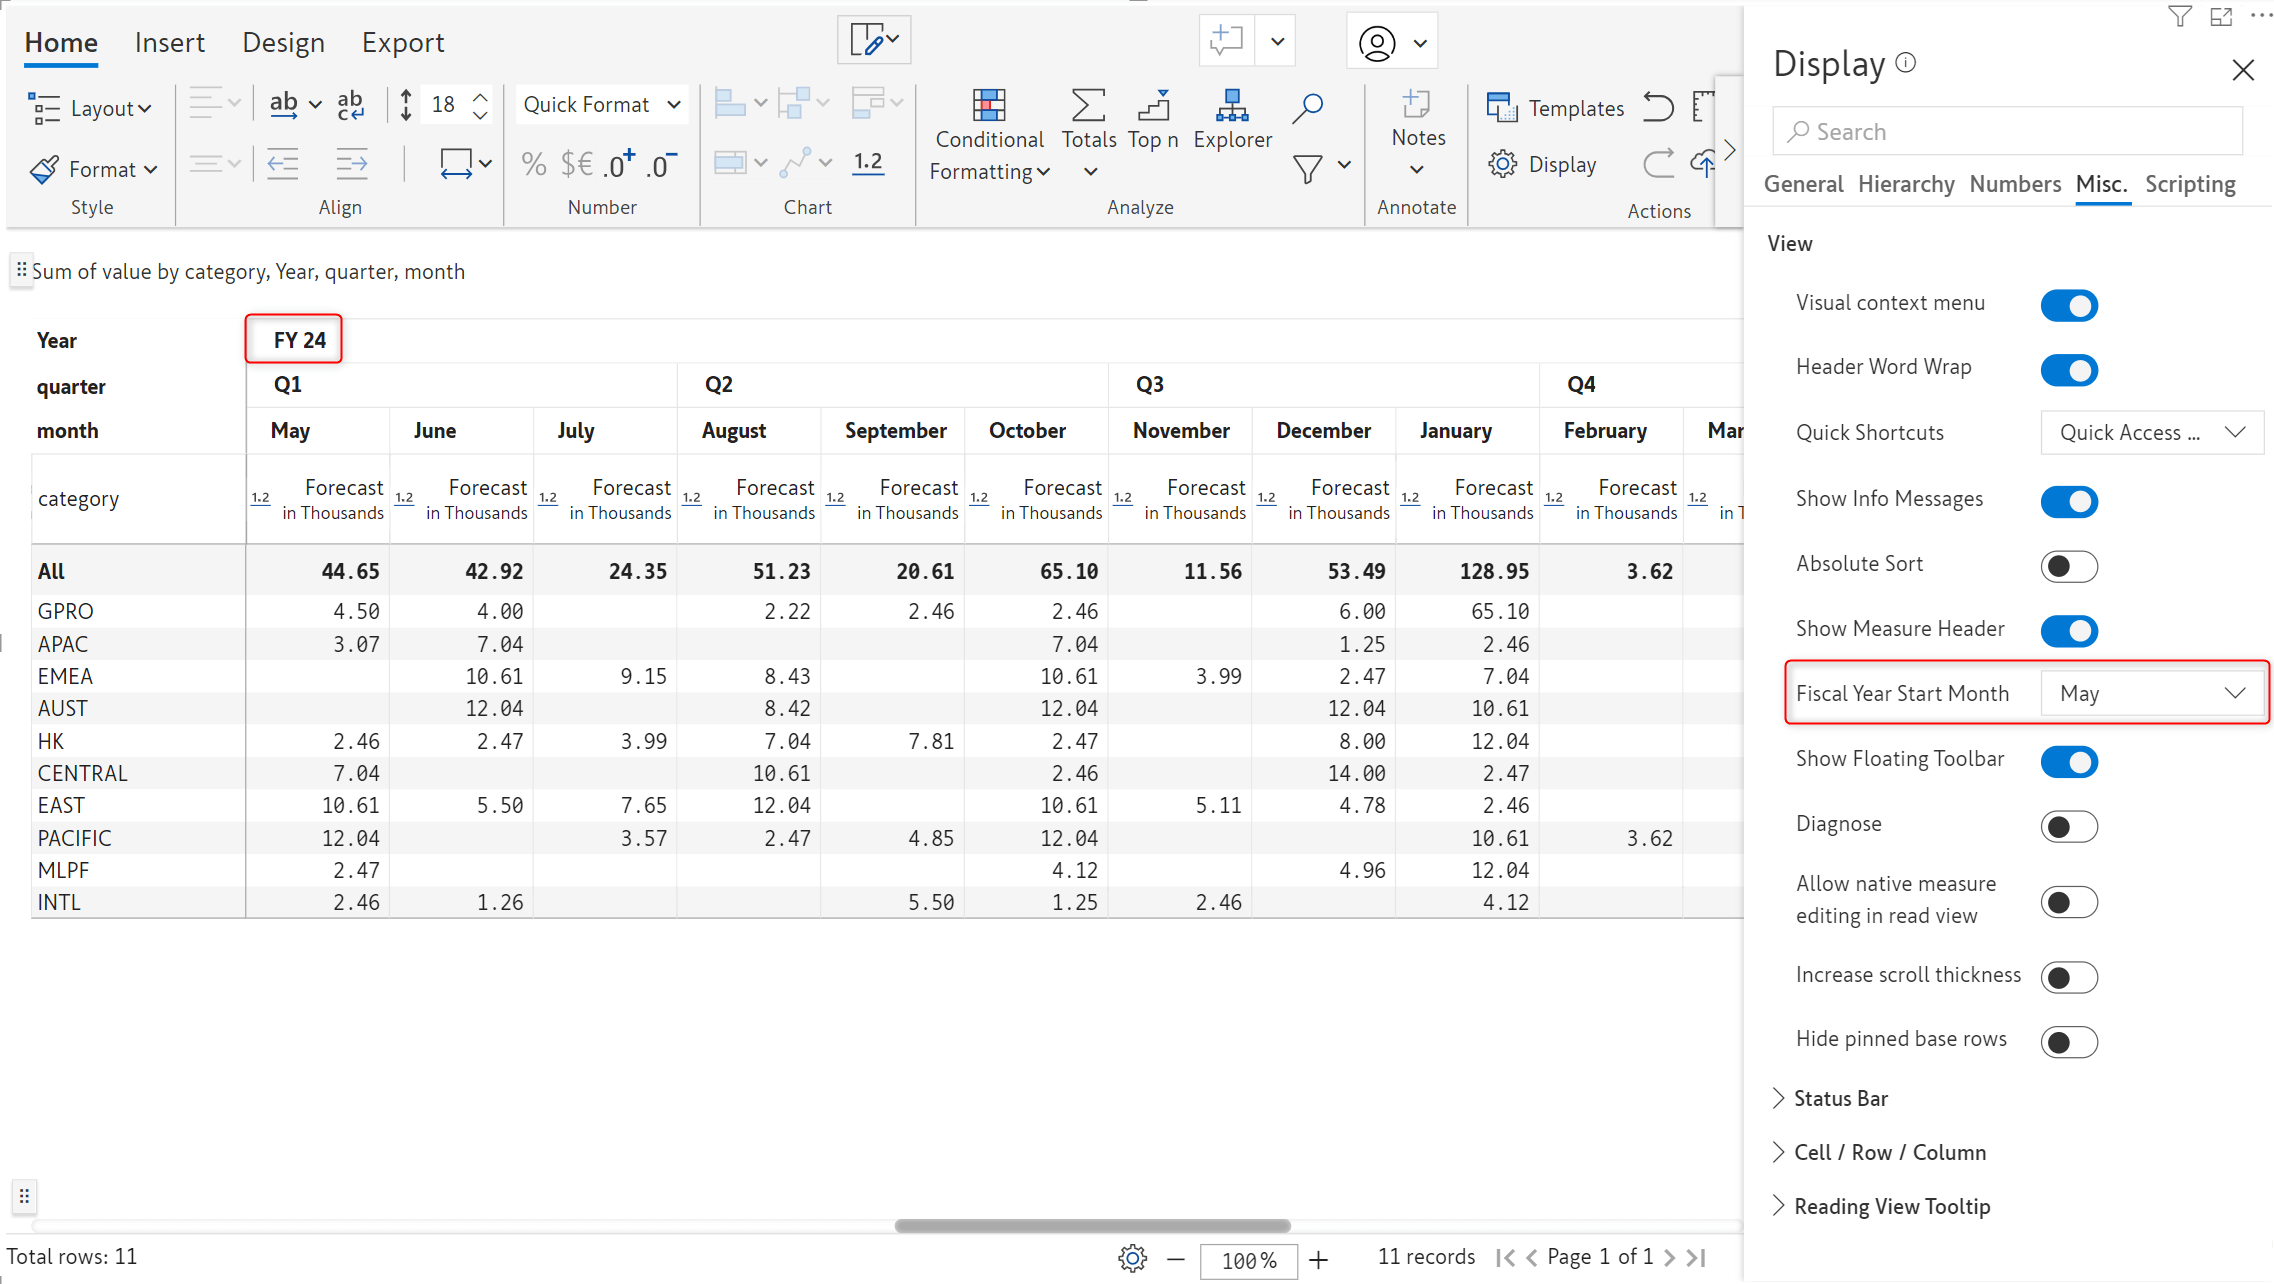
The earlier releases supported the creation of rolling forecasts for the fiscal. With the latest release, the built-in time intelligence will detect fiscal year formats and create forecasts based on the fiscal start month. The dataset drives the fiscal start month, and you can update it in Display settings > Misc > Fiscal Year Start Month.
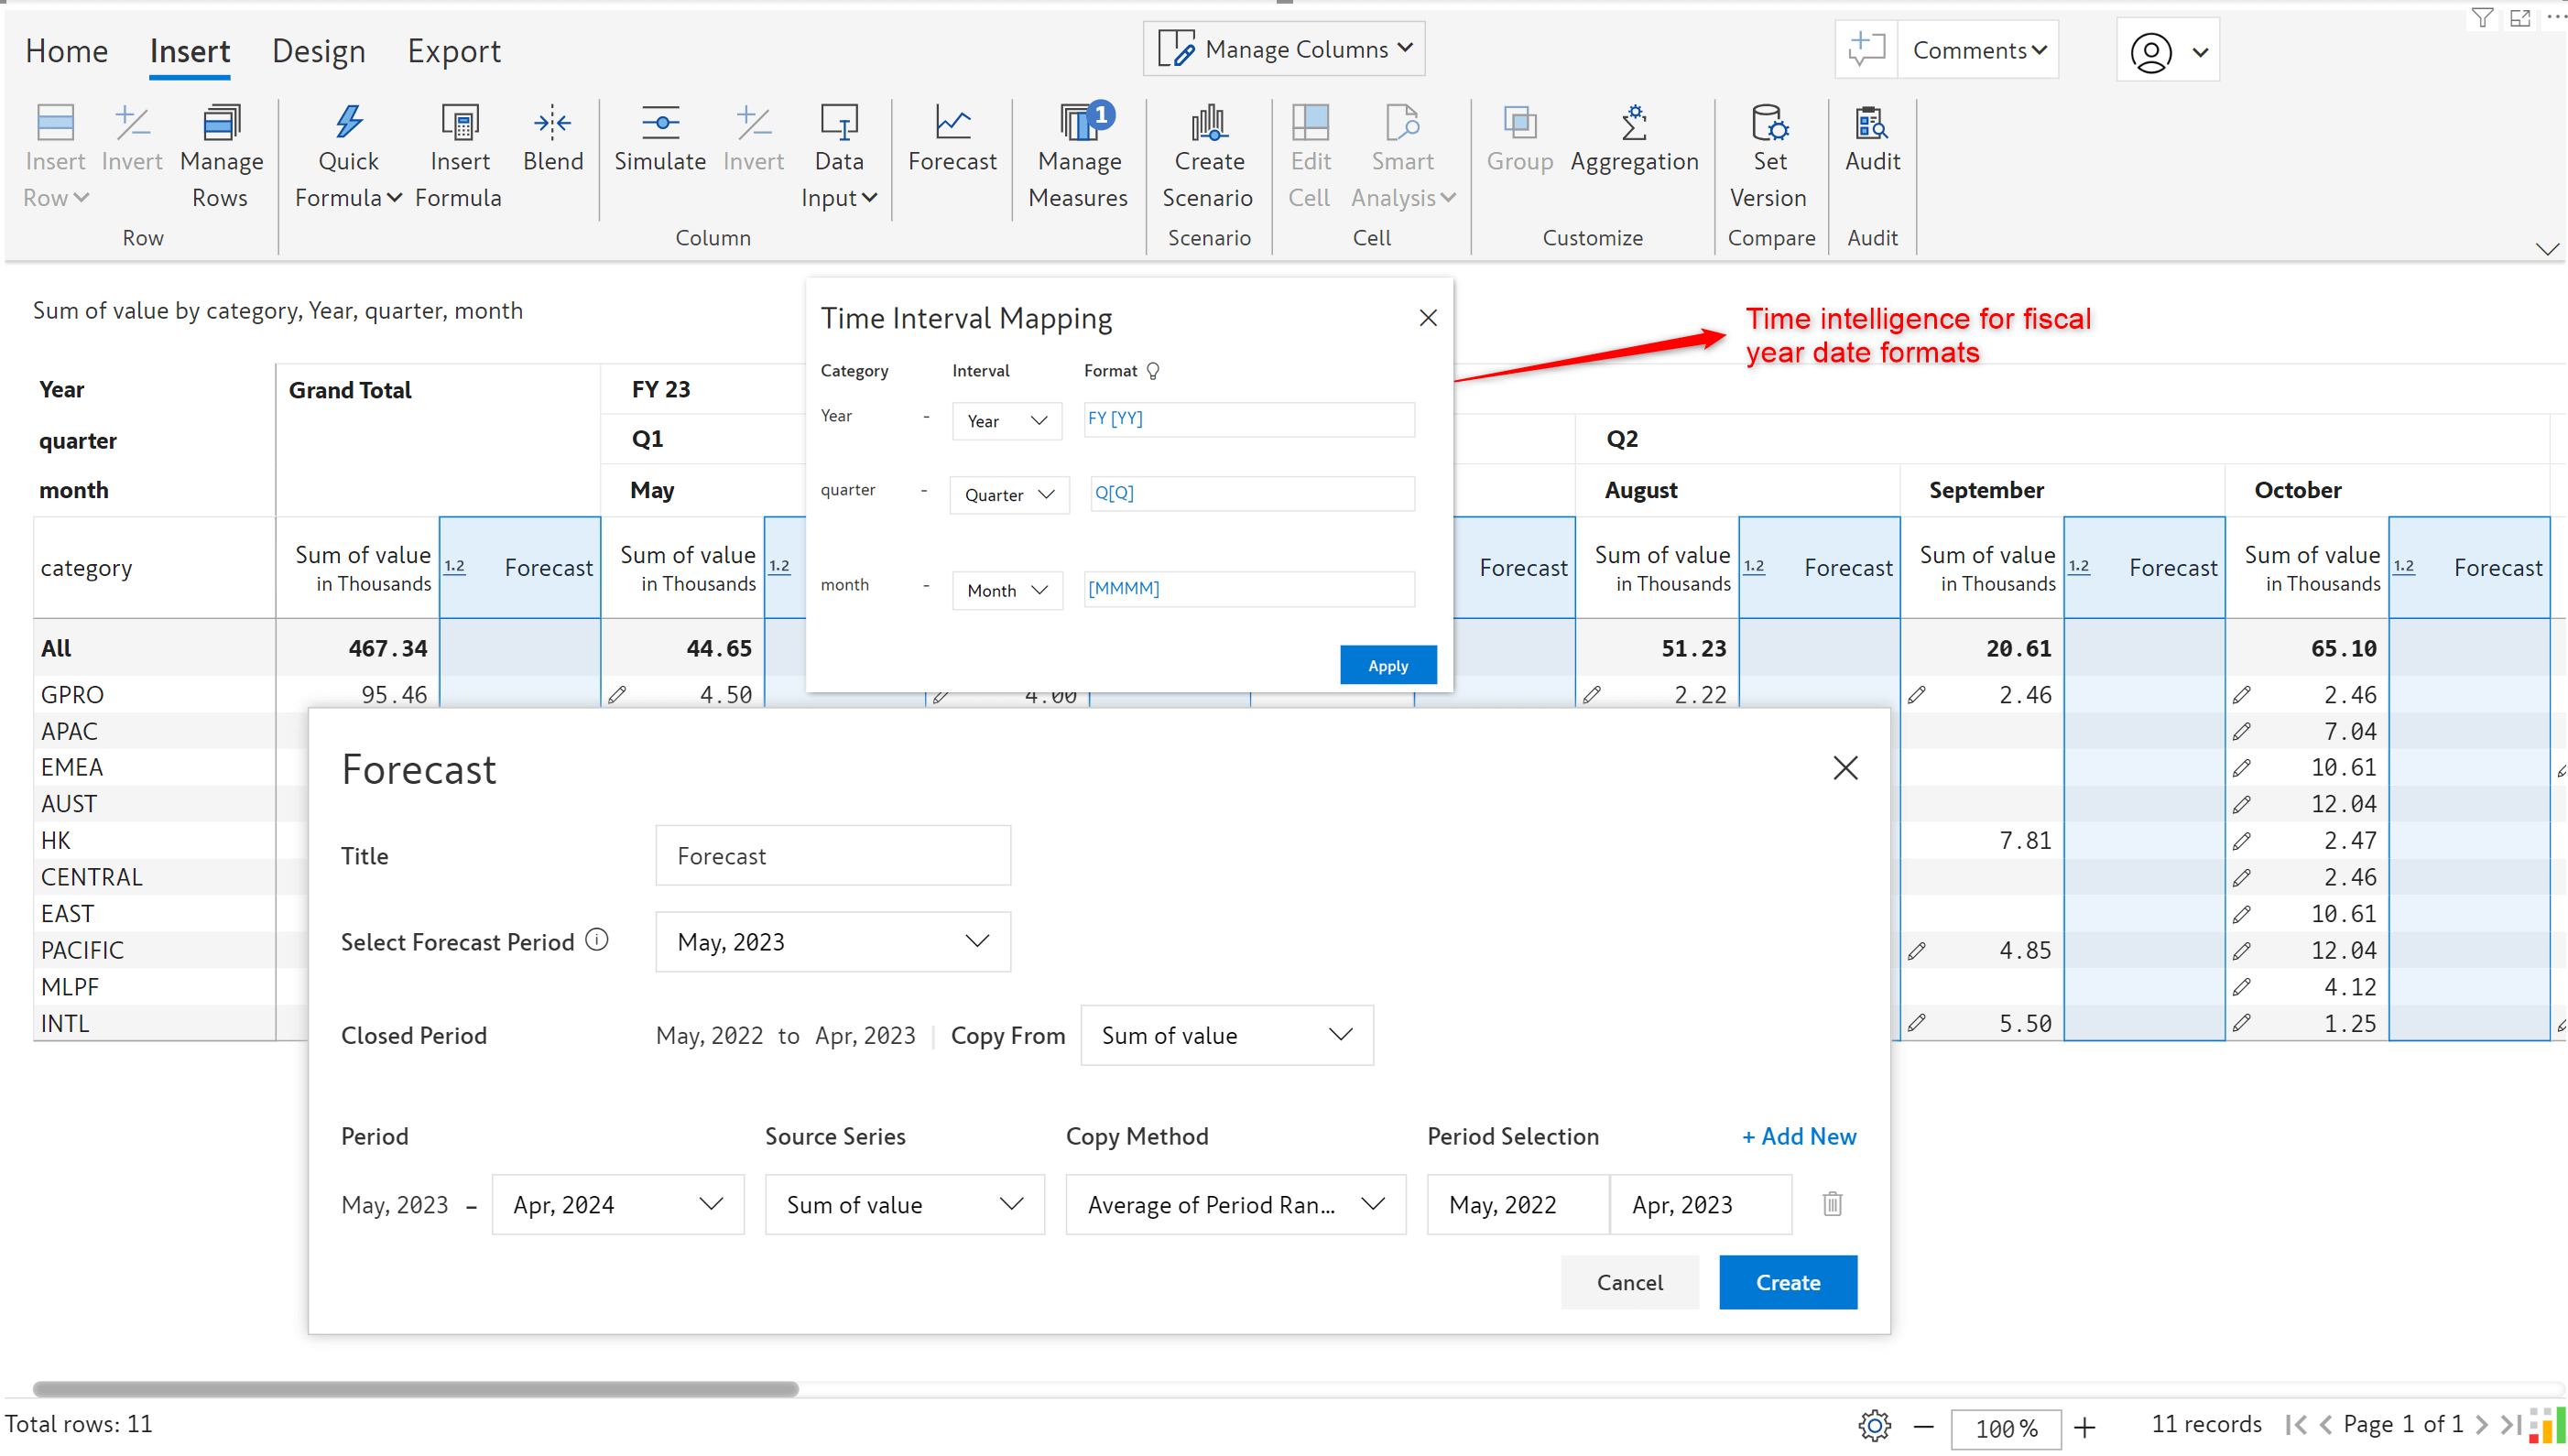
Notice that the forecast is created based on the fiscal start month.
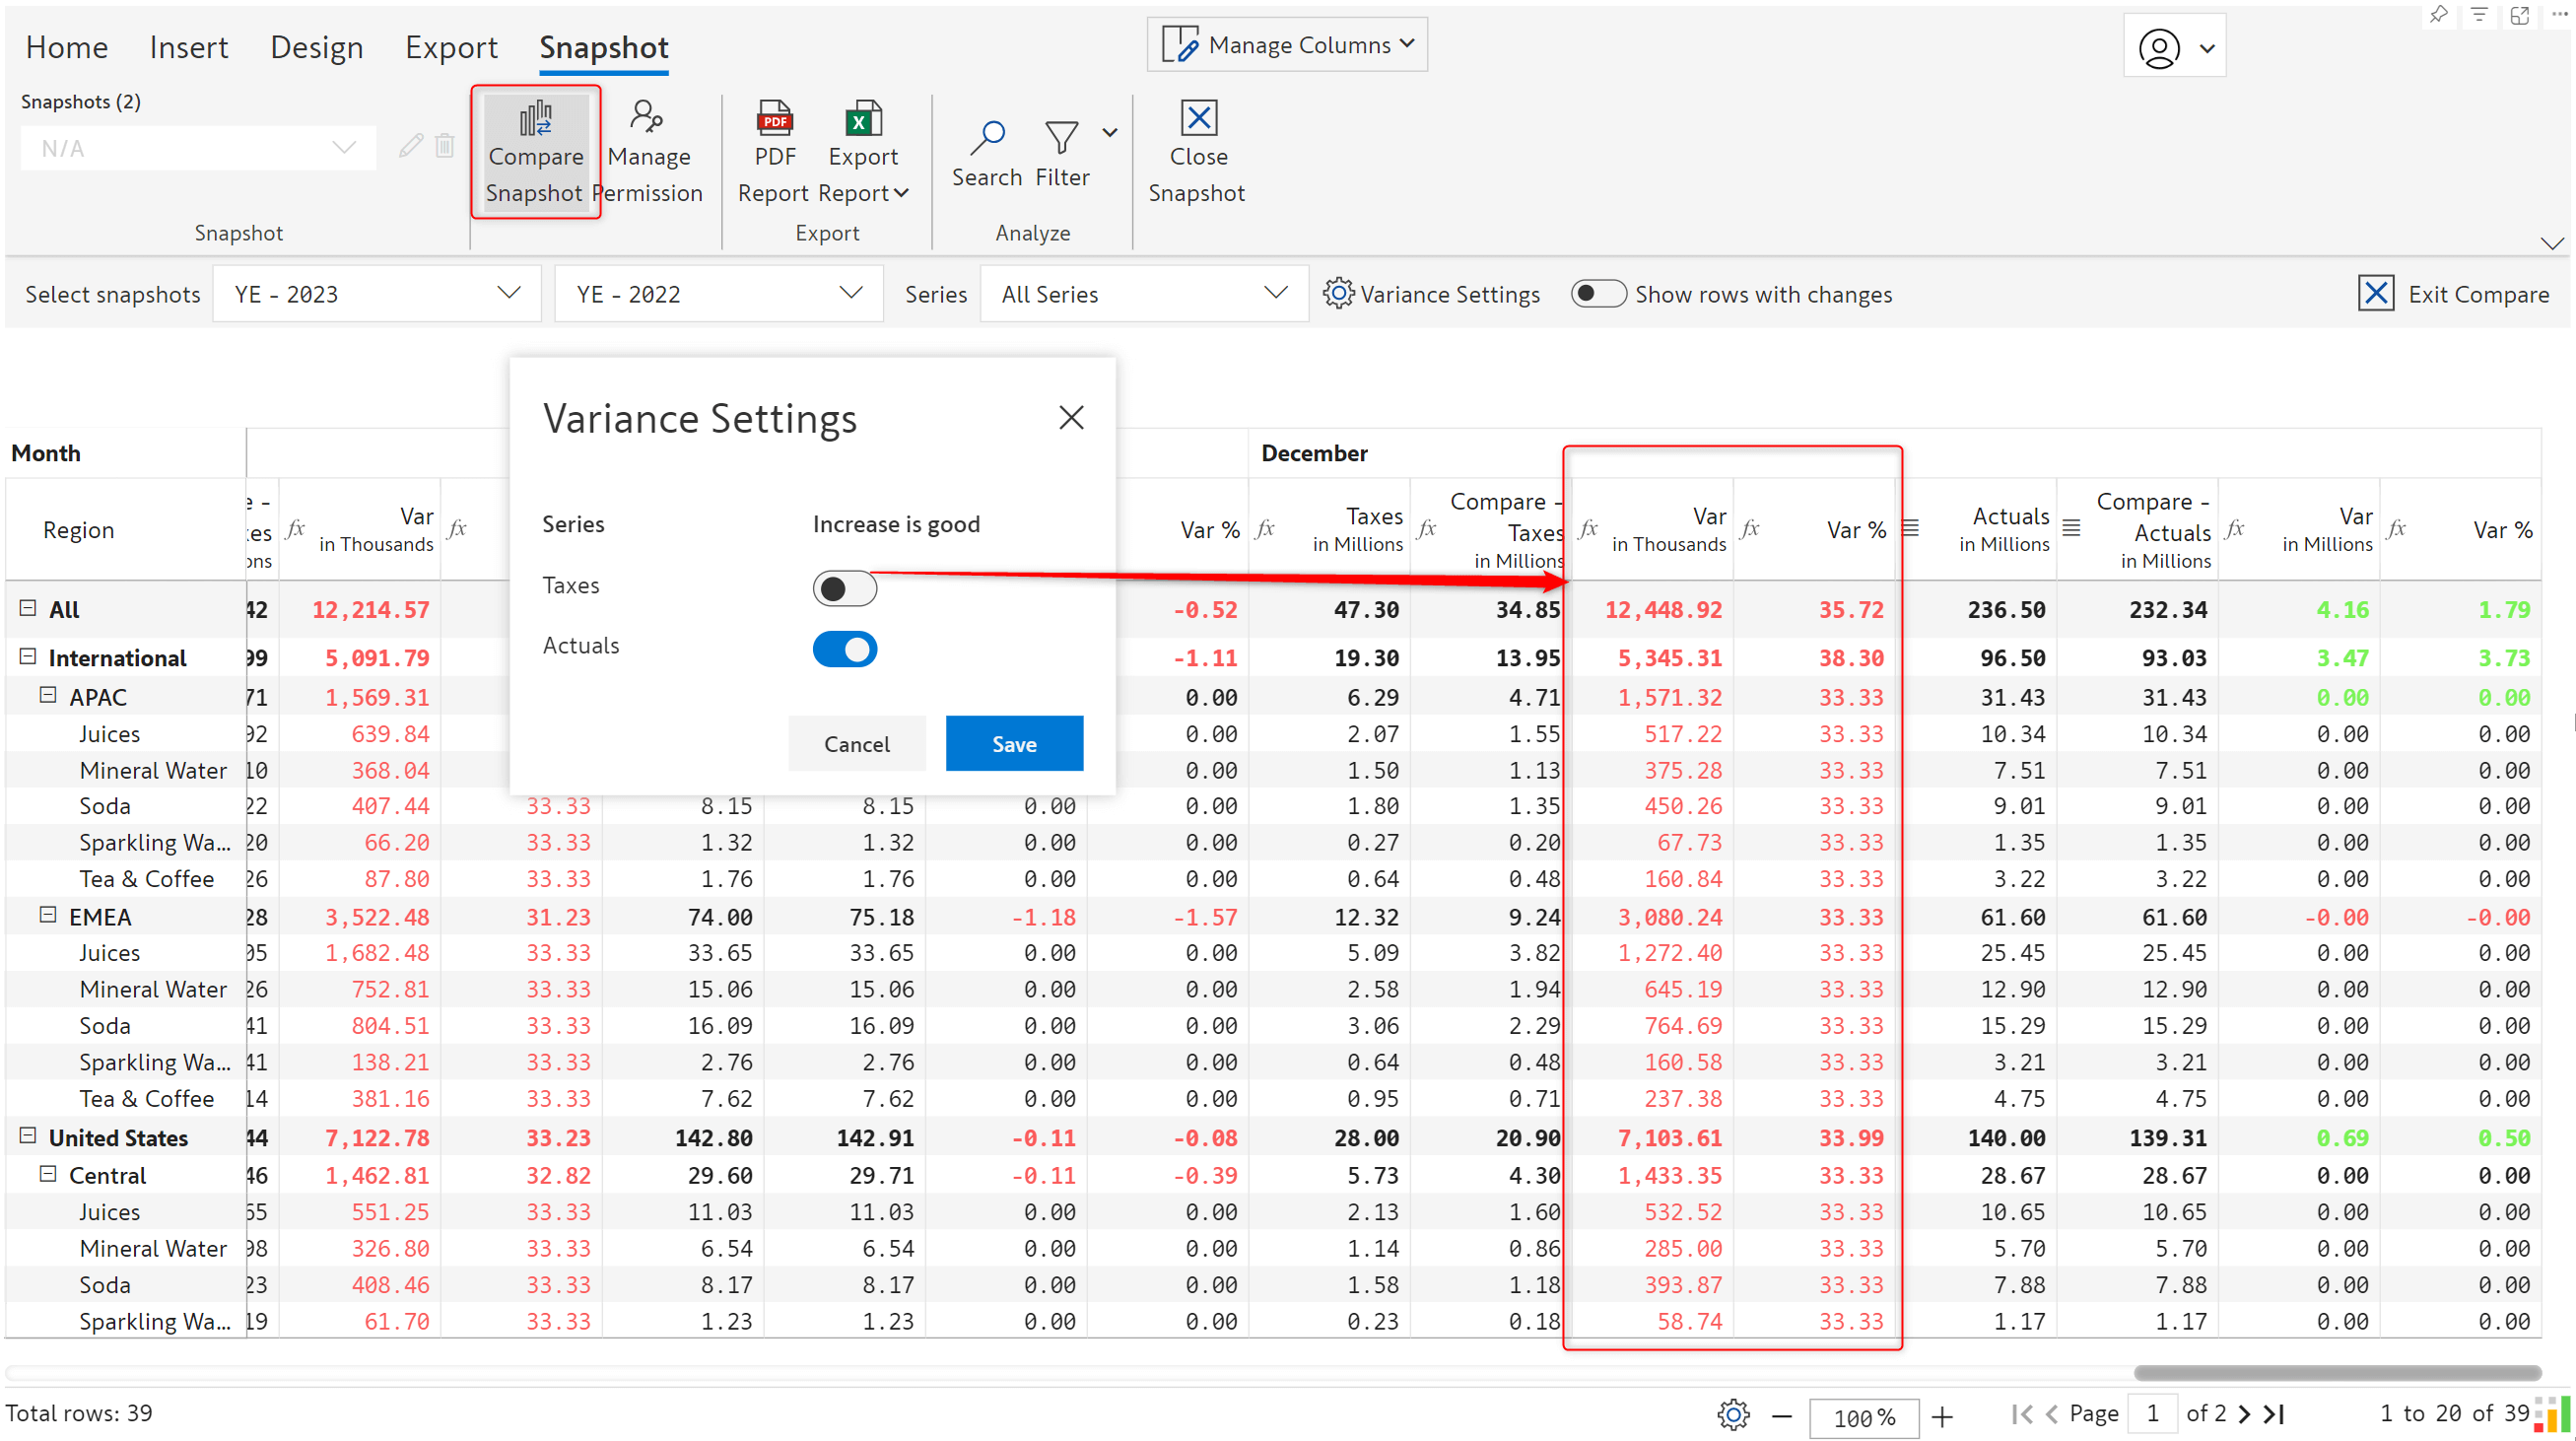
The December release brings you the ability to compare snapshots. For instance, you can compare the snapshots taken at the close of each quarter or each year to draw insights from the changes quickly. Inforiver calculates the absolute and relative variance between the measures while comparing snapshots. You can additionally specify when an increase in value does not imply a positive change - for example, an increase in the debt or interest paid.
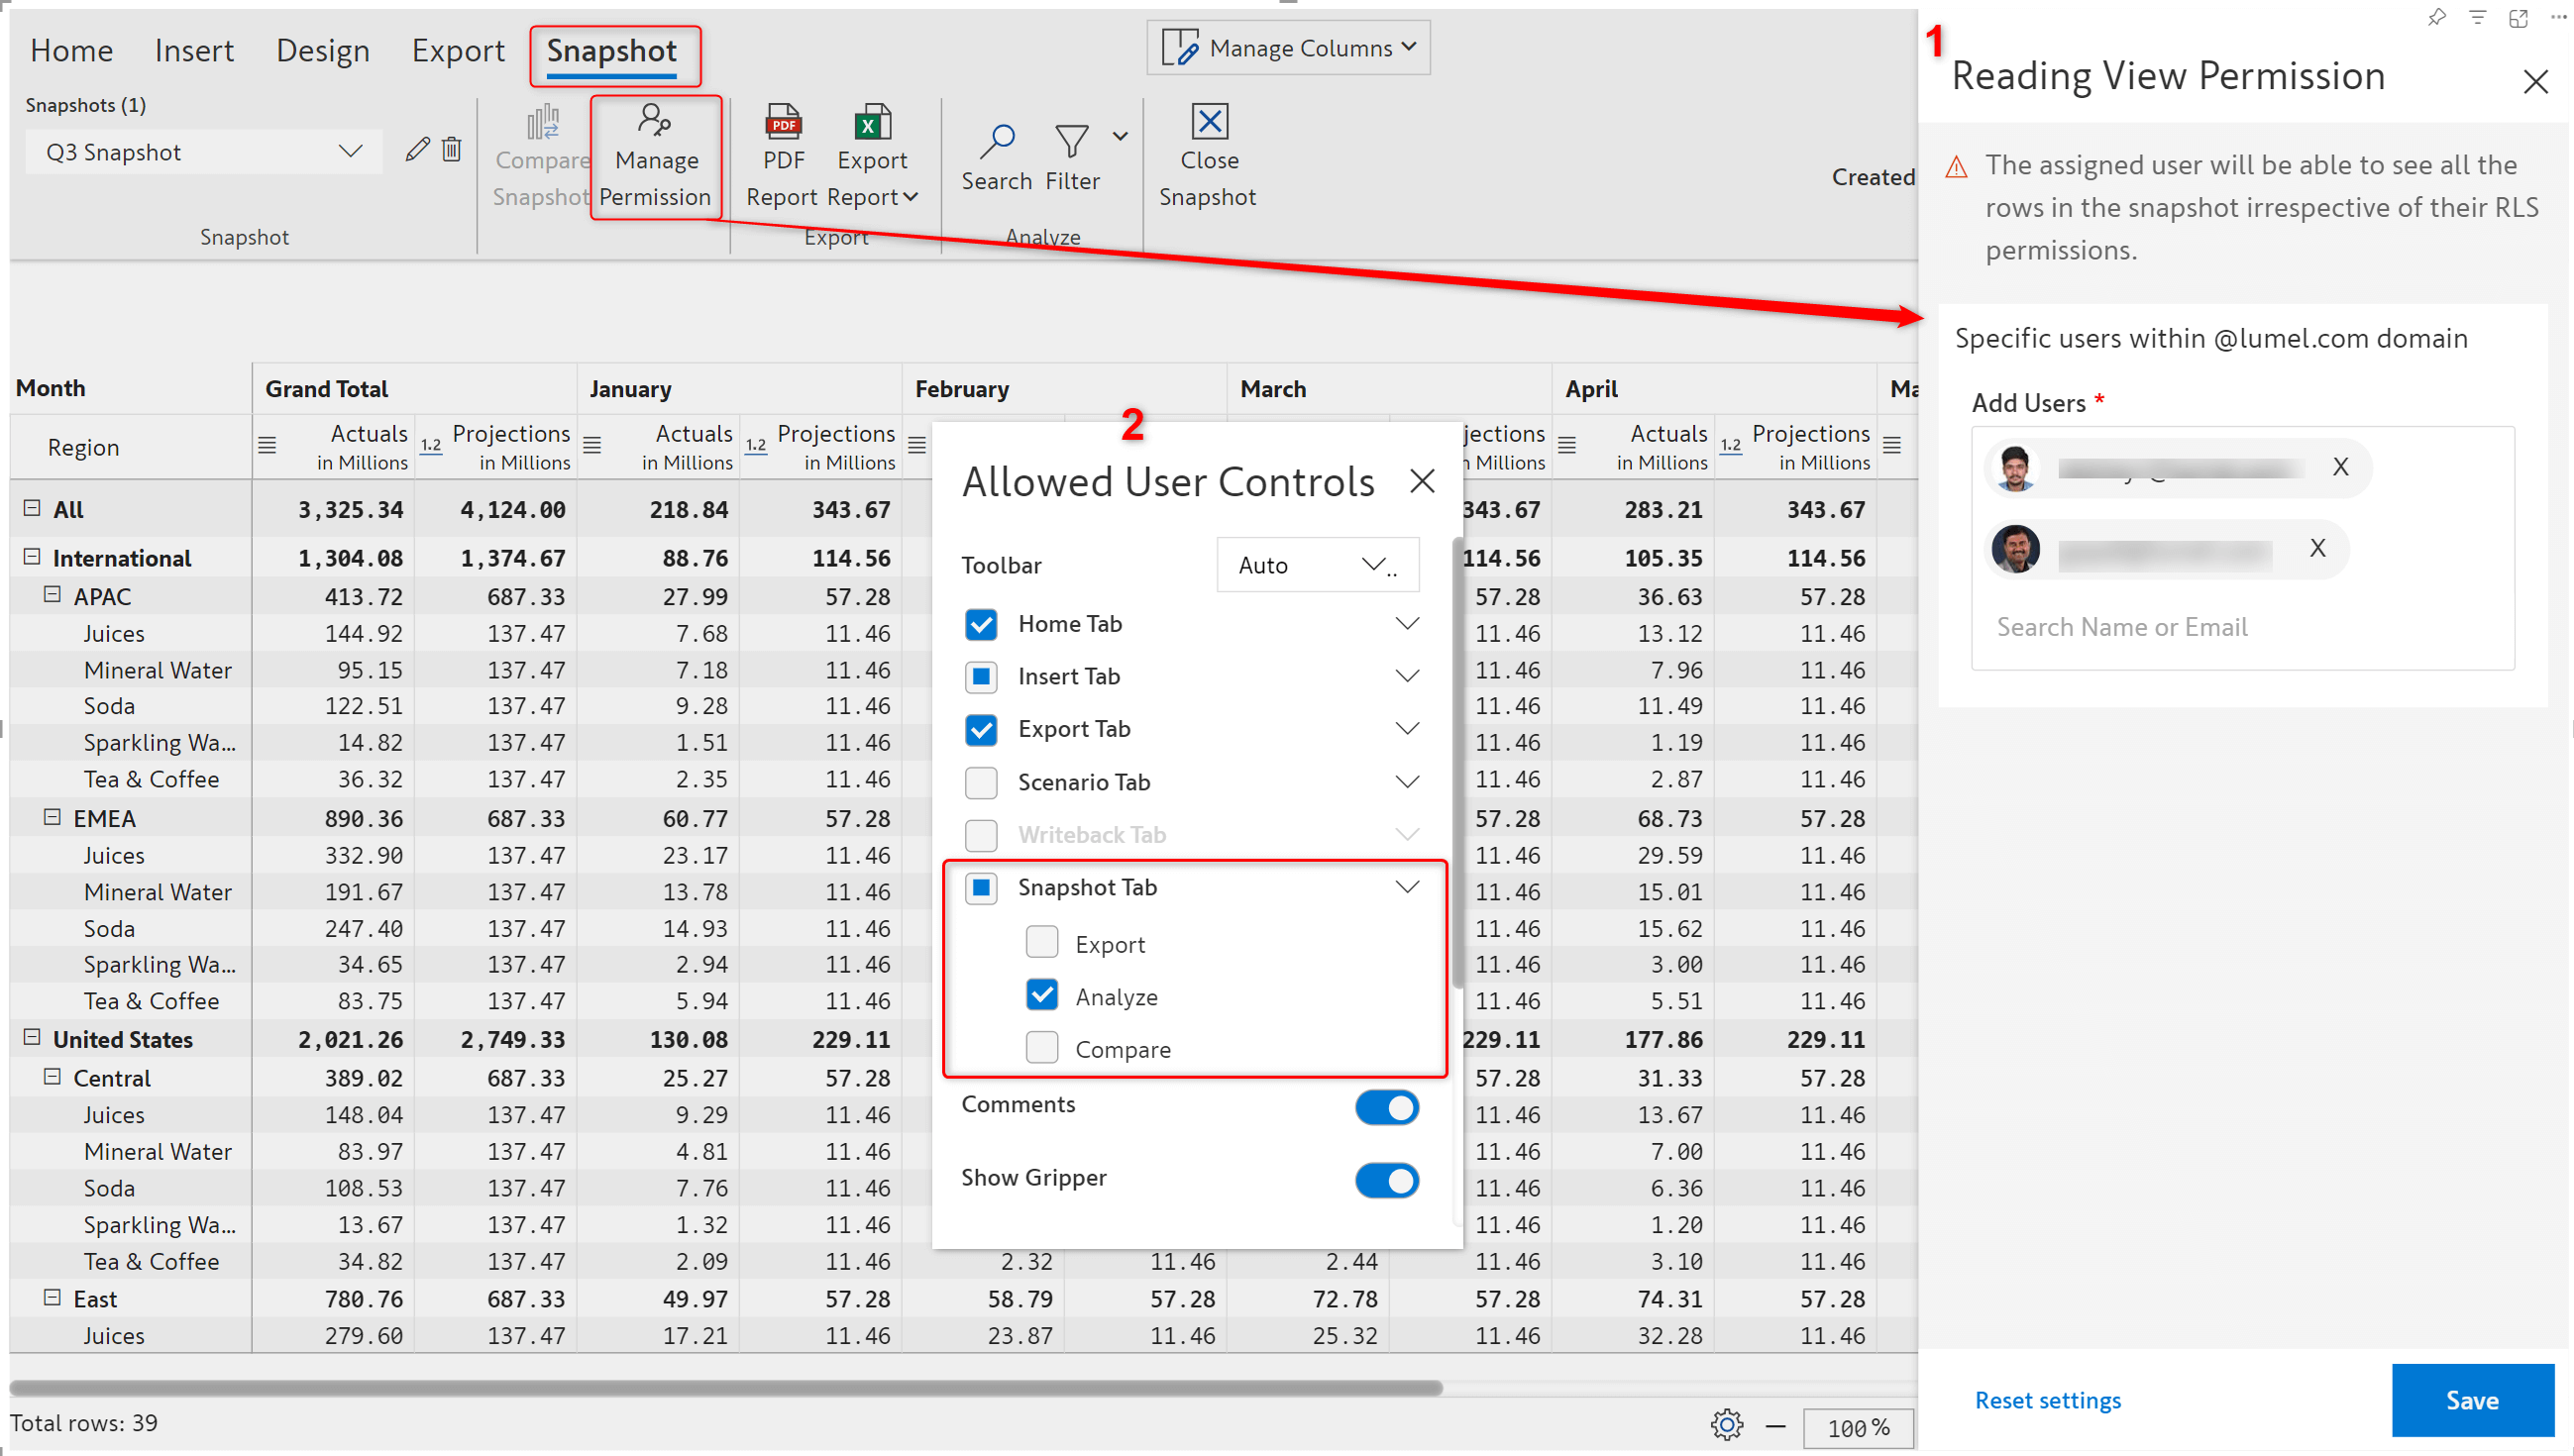
Report viewers can also view, export, and compare snapshots if the report author permits them. You can provide access to specific users from the new Reading View Permission settings in the Snapshot ribbon. You can also explicitly set view/compare/export access from Allowed User Control settings.
Note: Users with access to a snapshot have elevated access, they can view all the data irrespective of RLS settings.
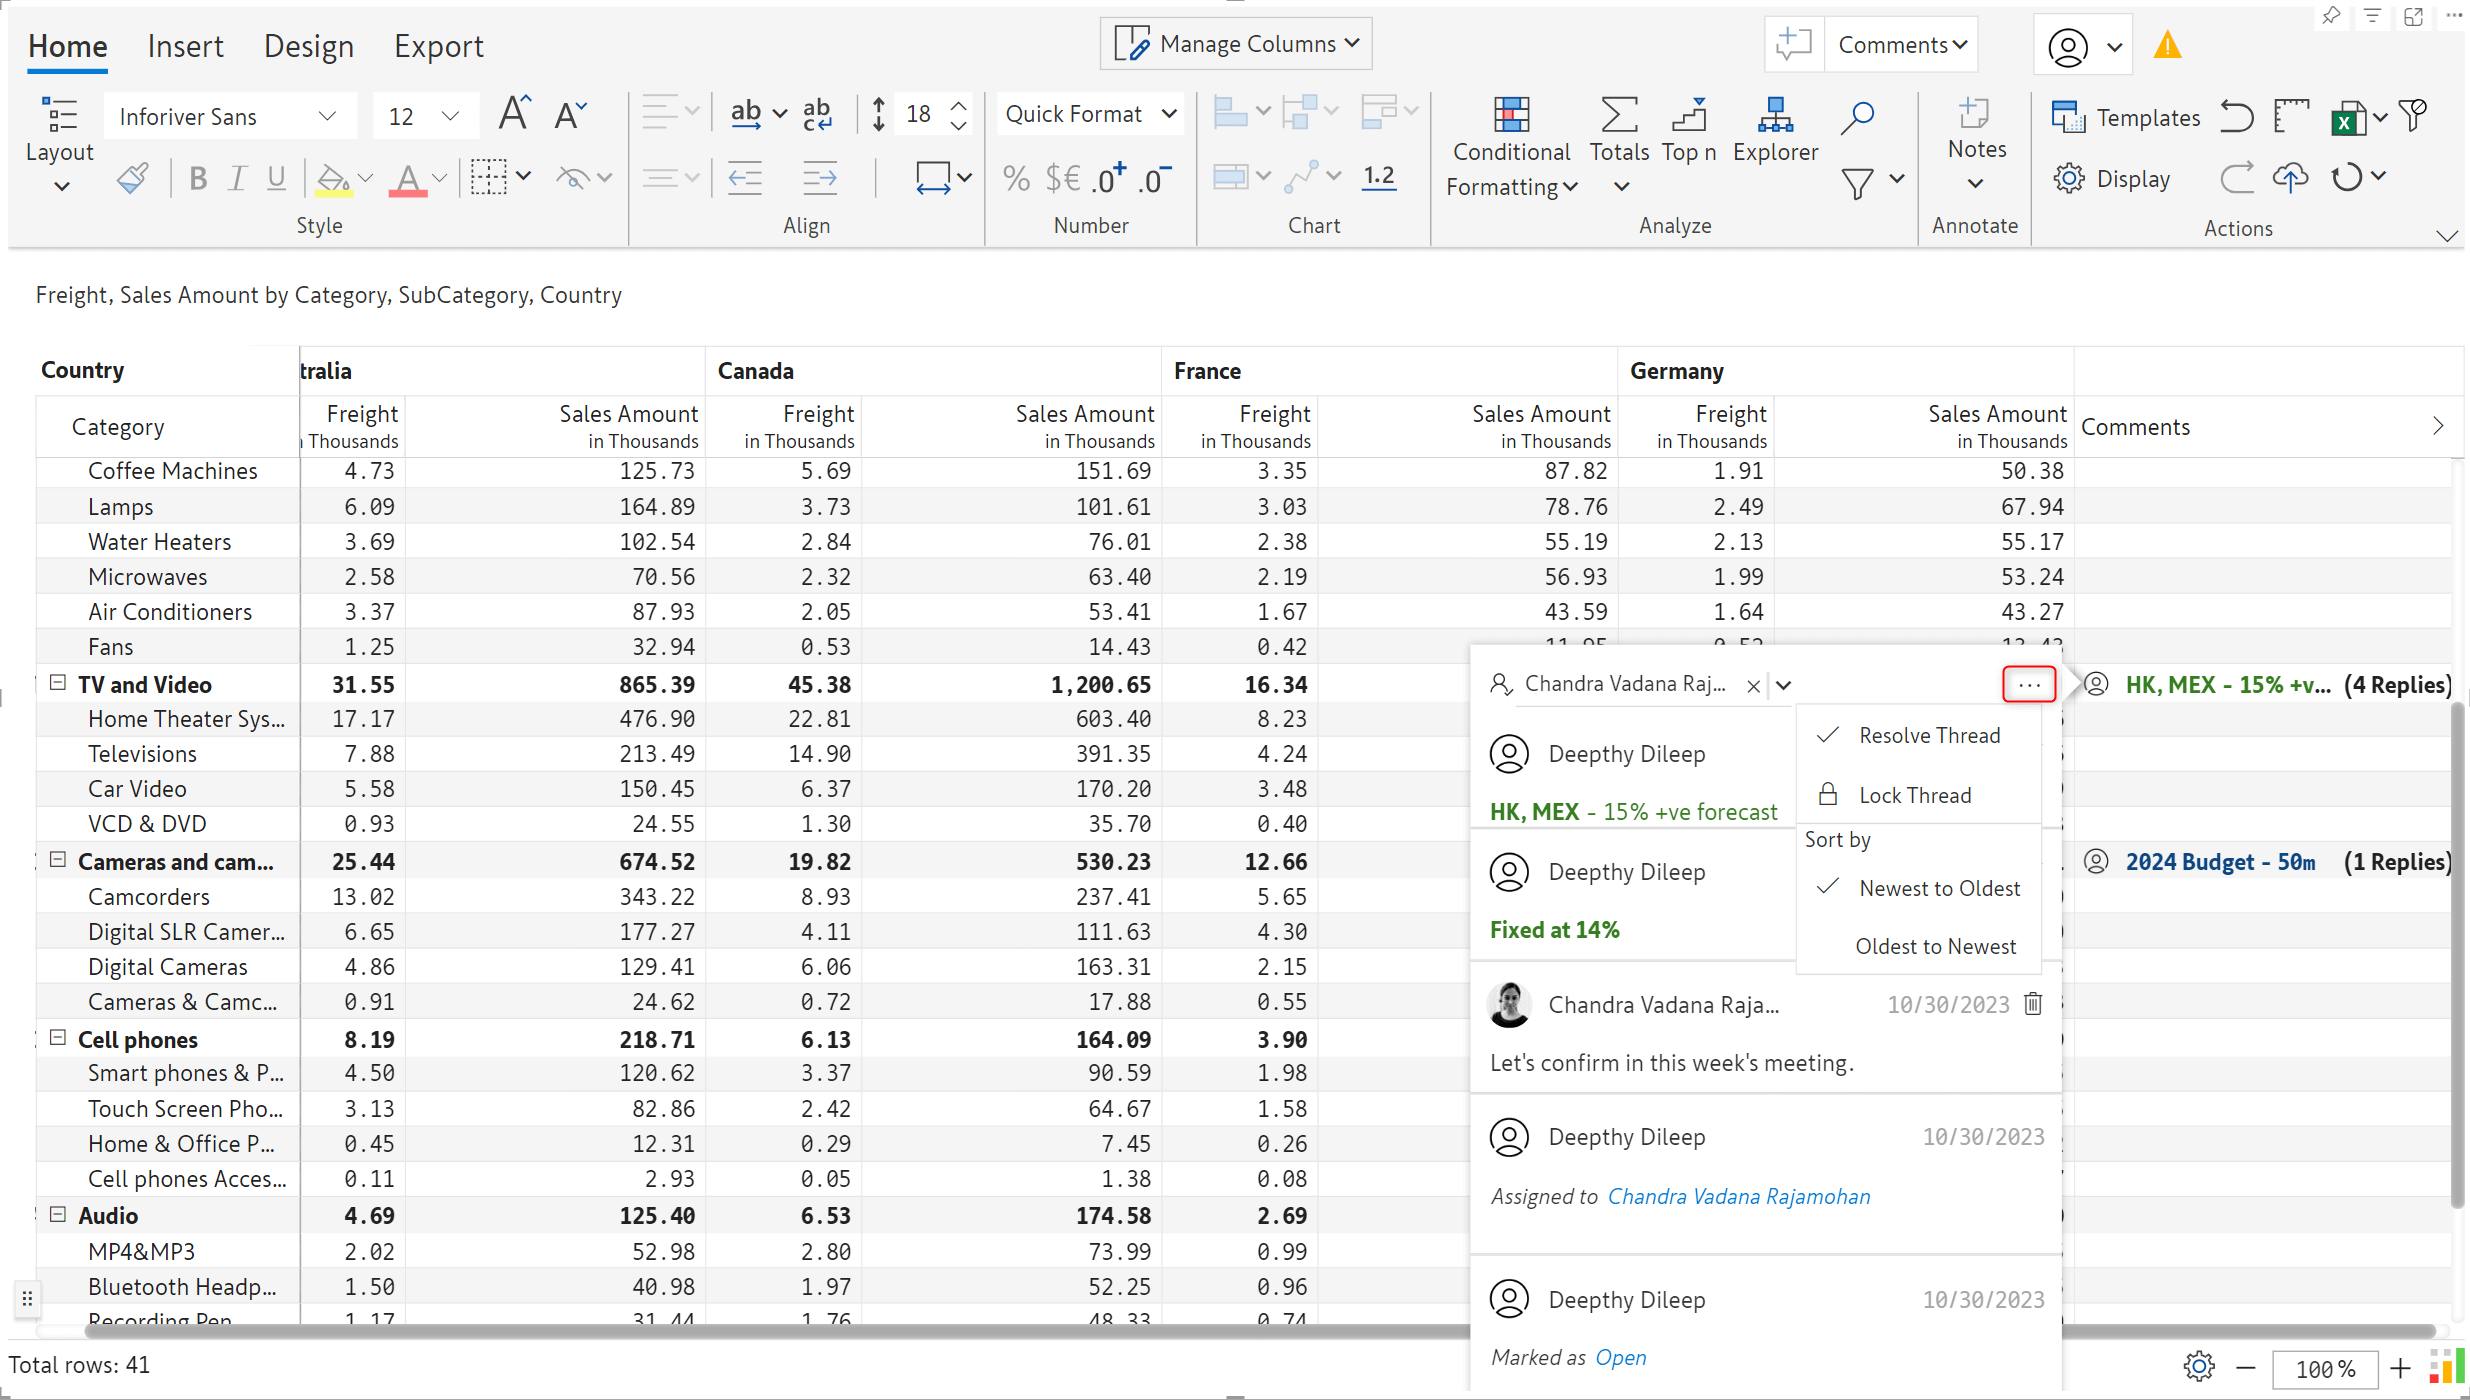
Inforiver allows you to order the replies to a comment based on the posted time. You can display the most recent or oldest at the top, enabling you to locate replies in long threads quickly.
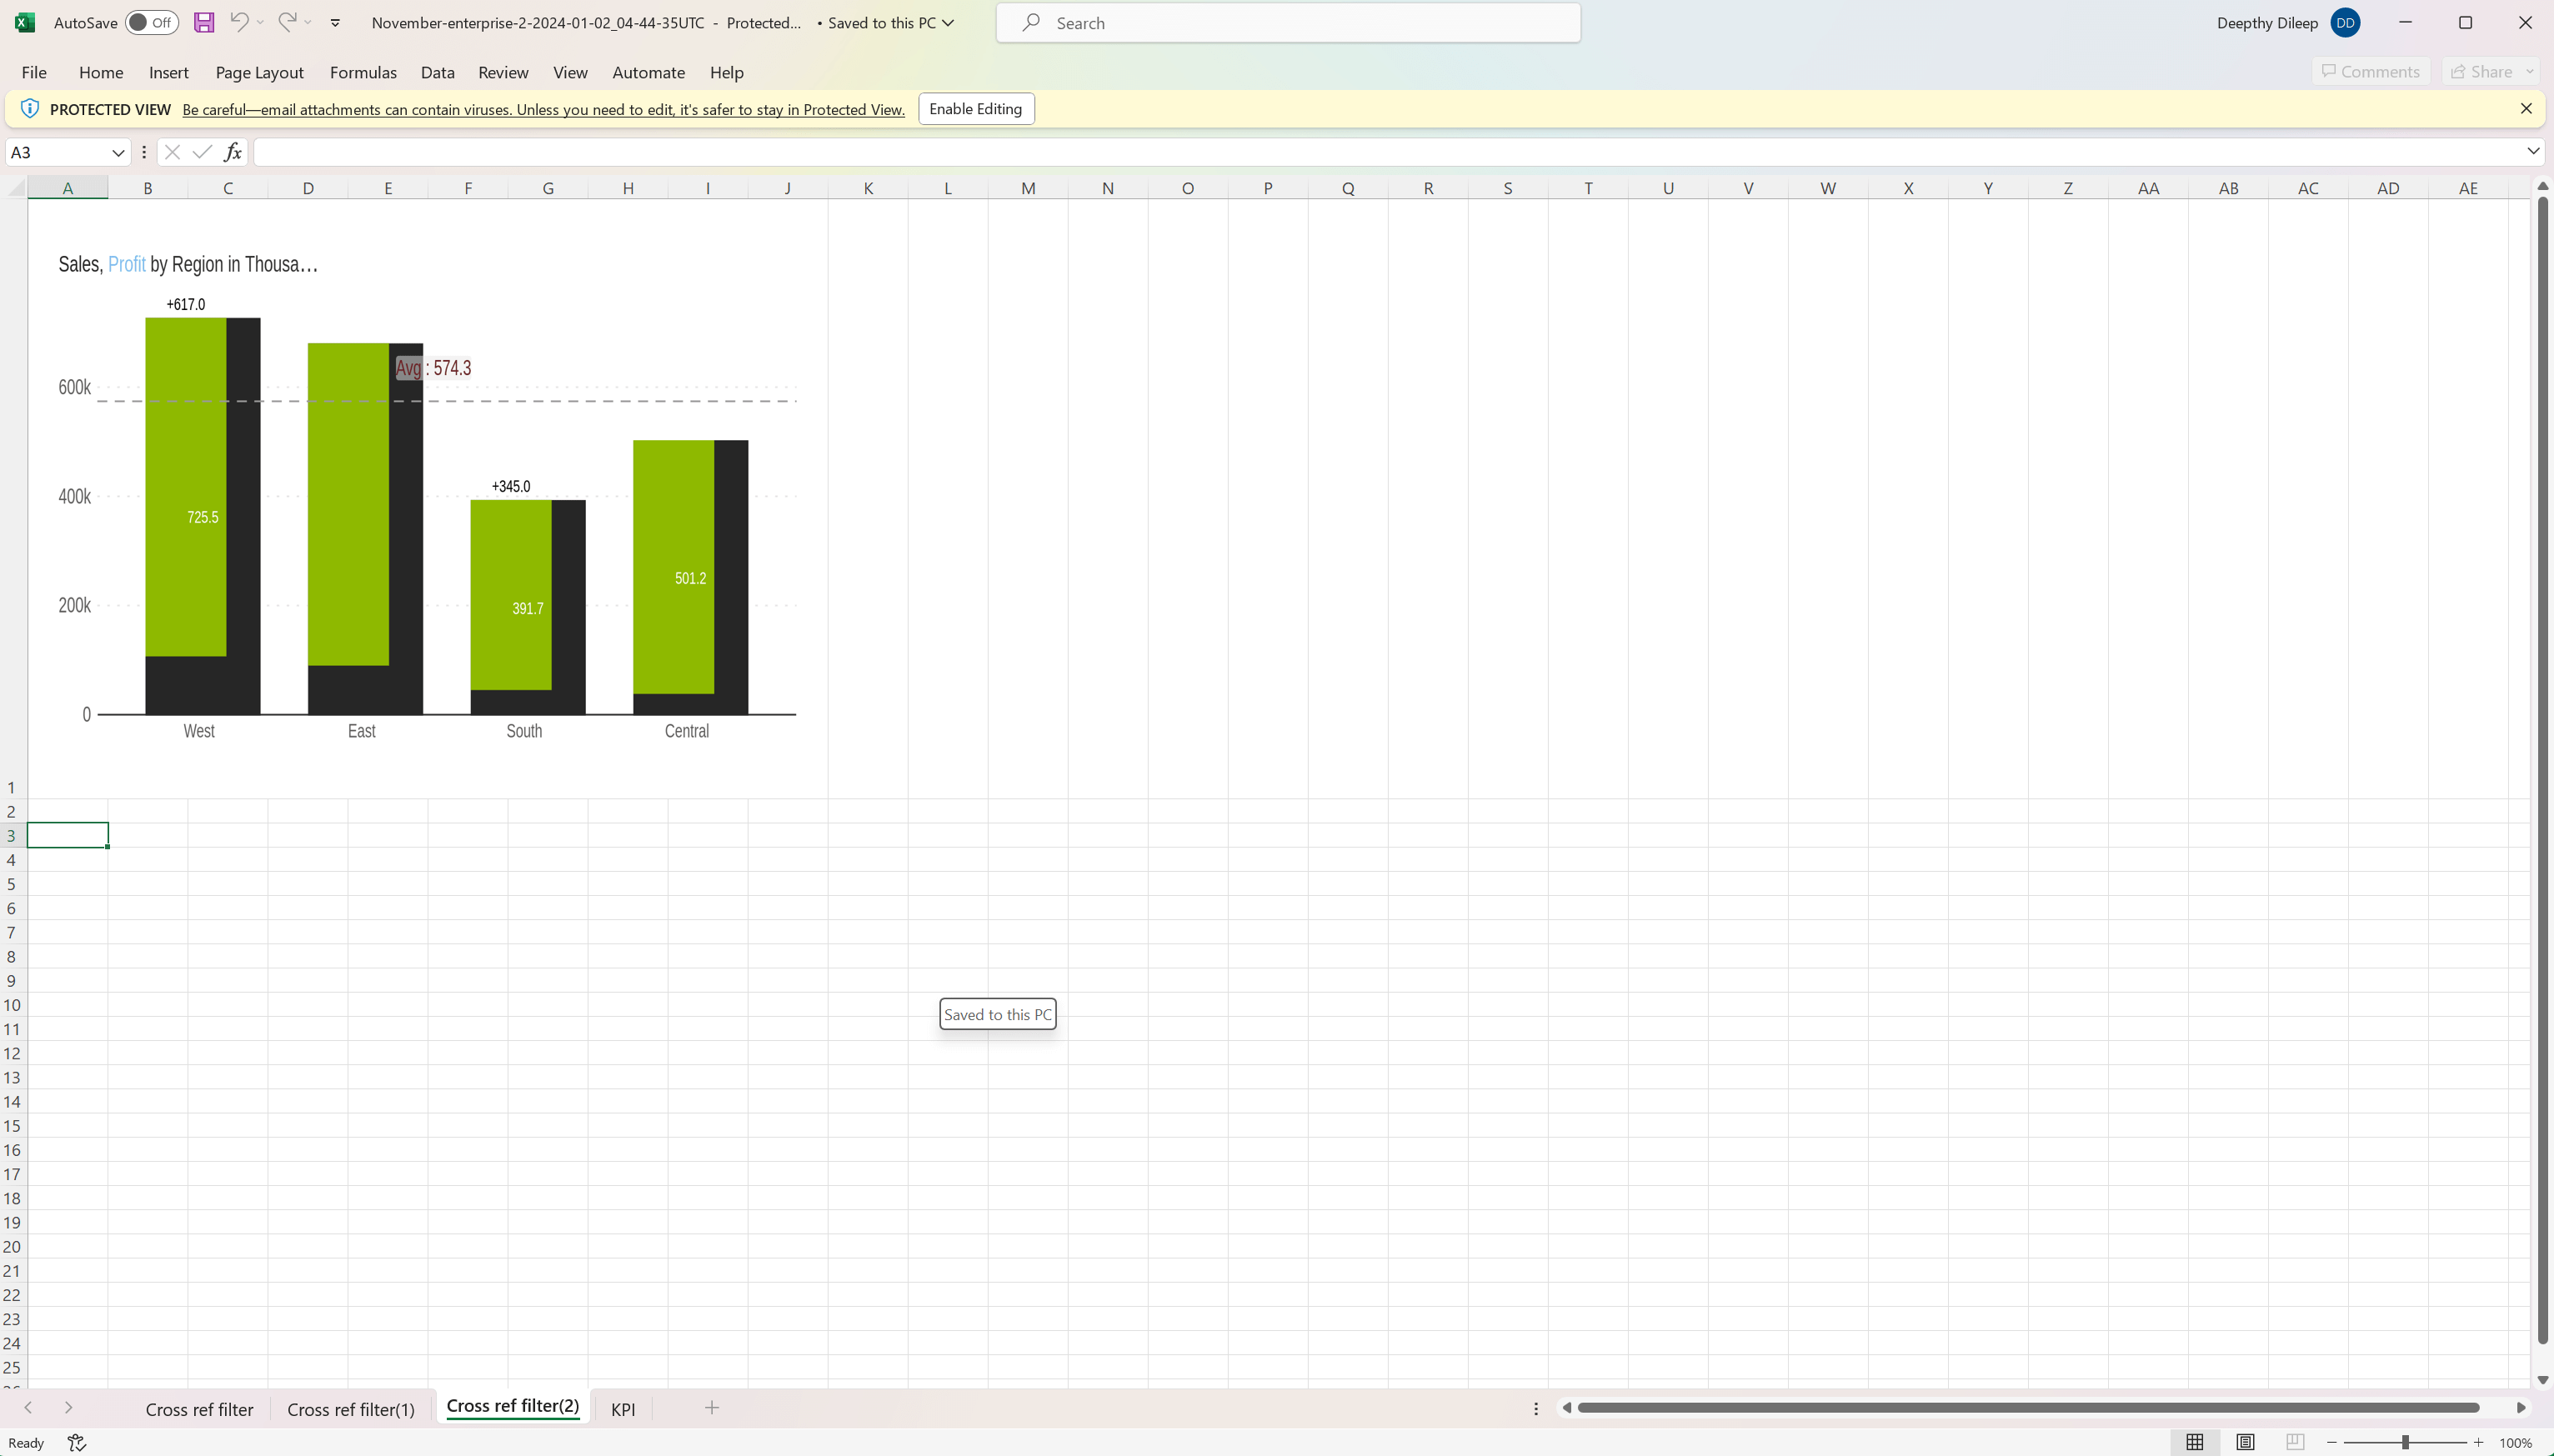
Inforiver Scheduler now supports exporting Analytics+ visuals as well. These visuals are exported as high-resolution images and can be merged with other matrix/analytics+ visuals in a single file or exported separately.
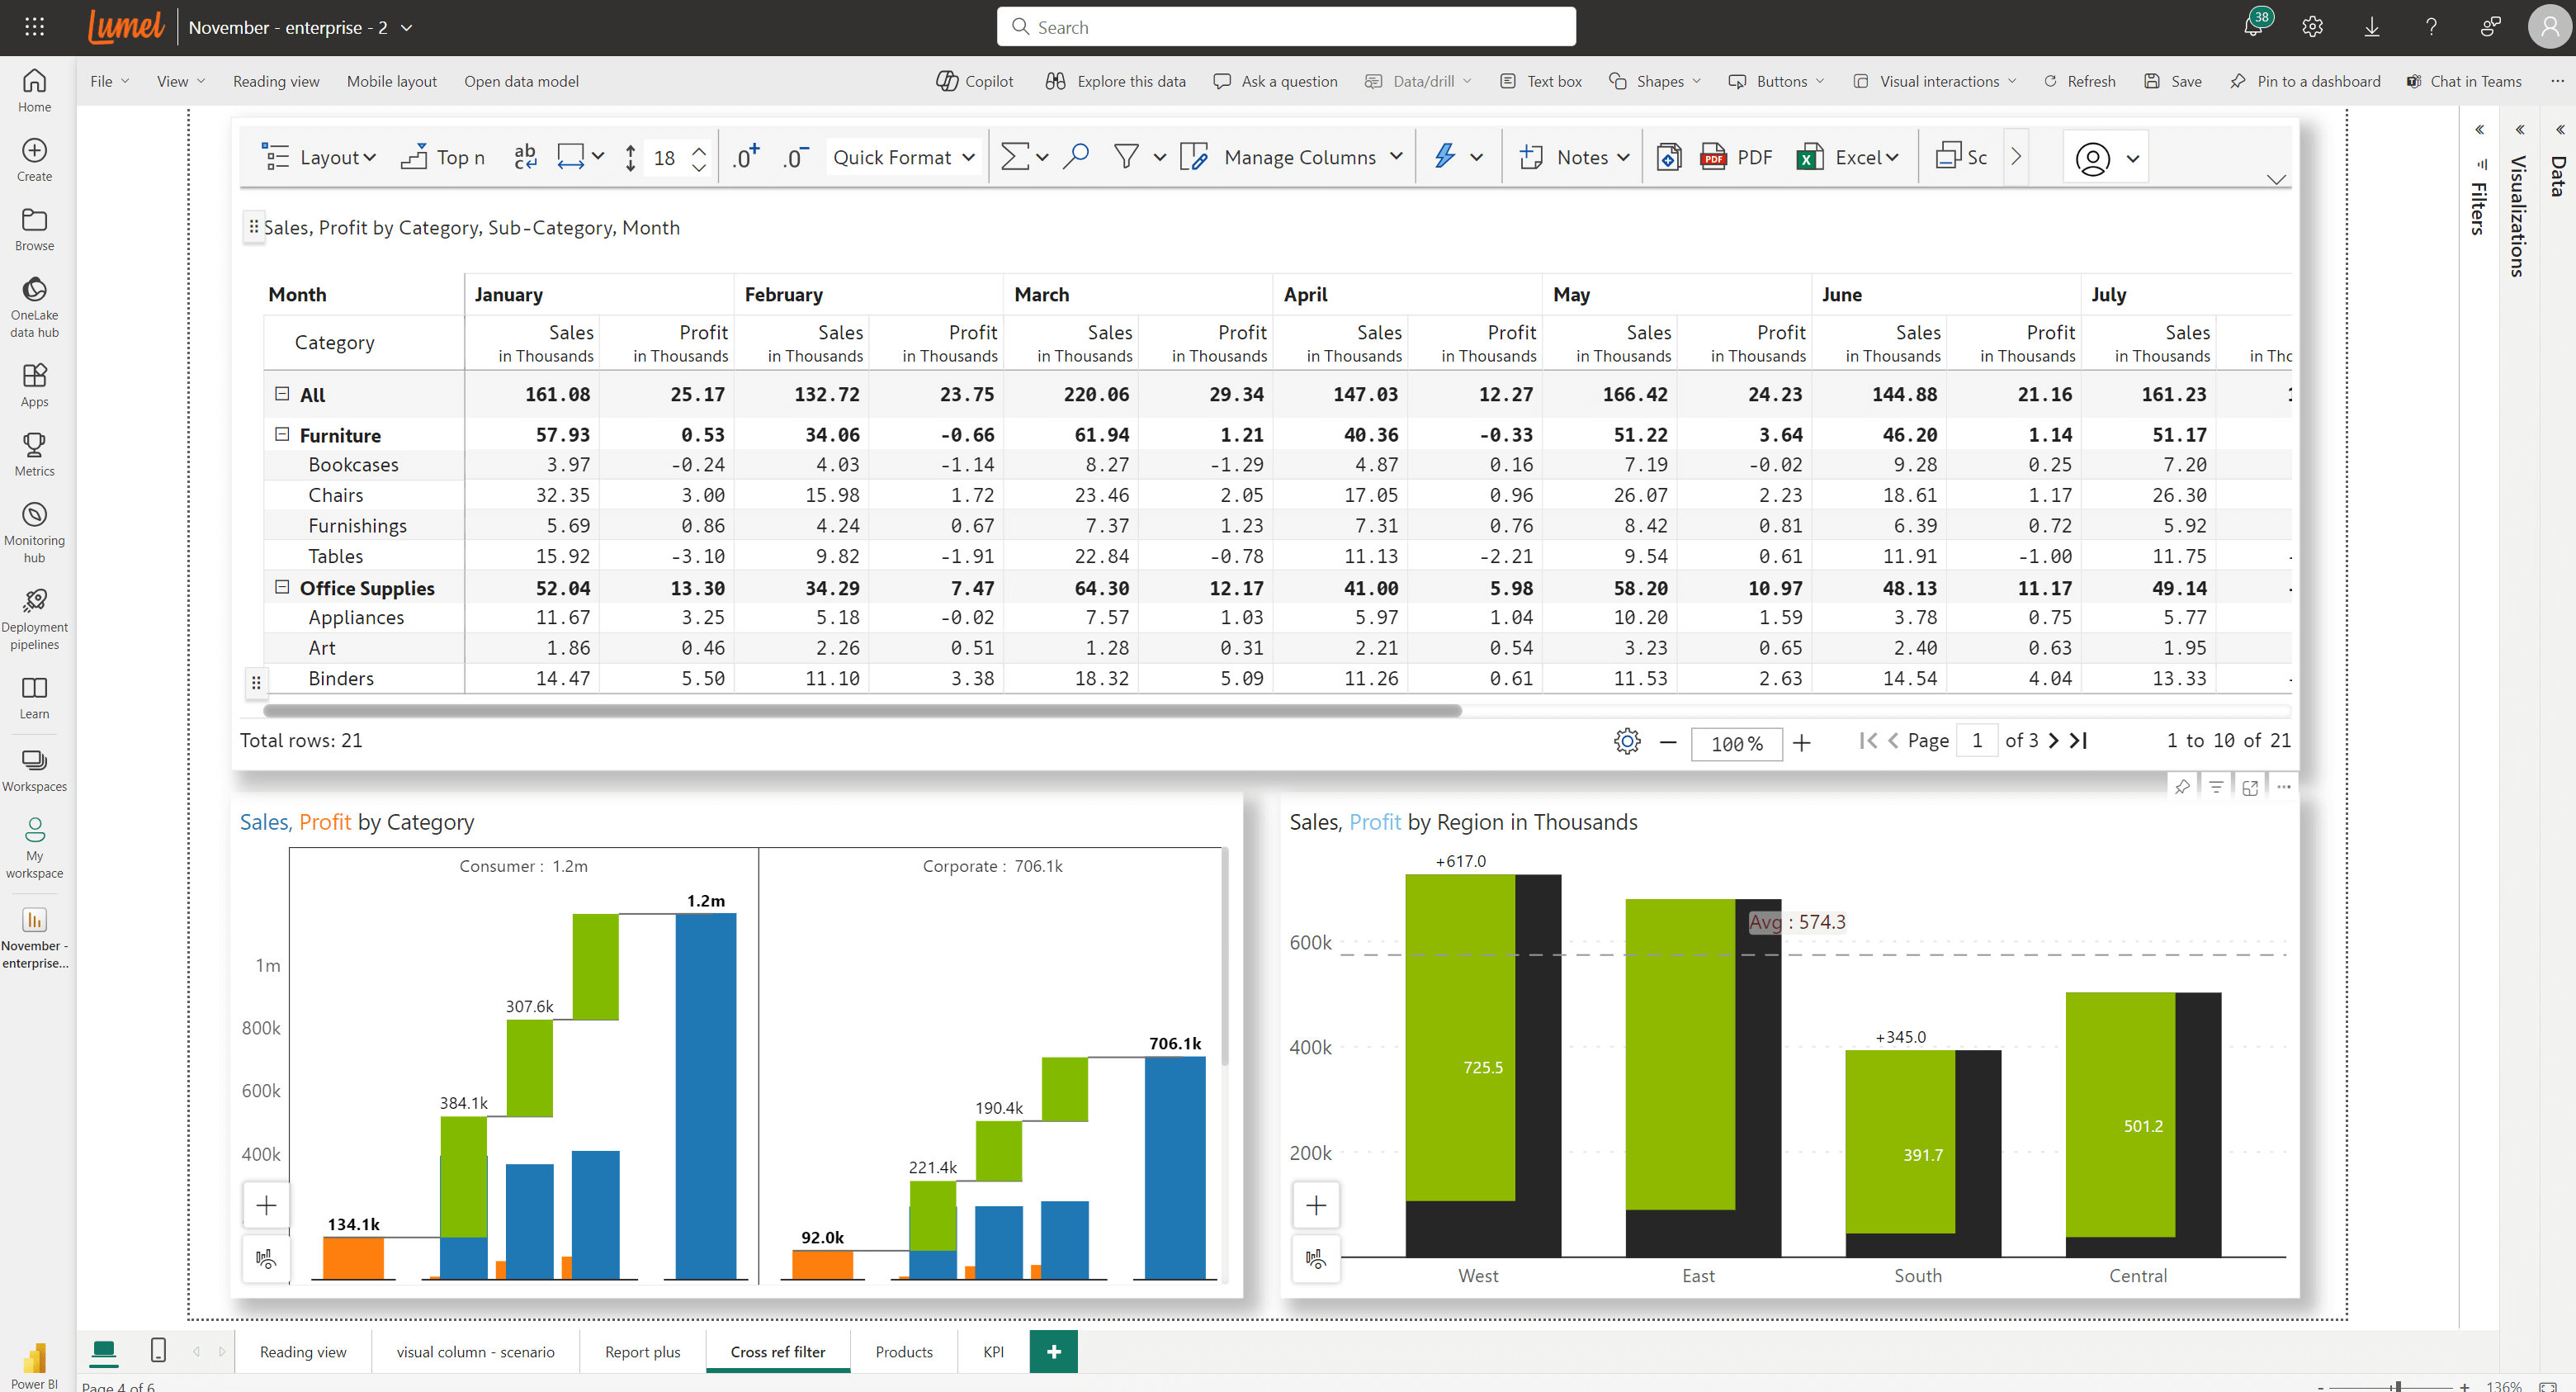
The following images show the Power BI report and exported PDF and Excel files.
Report with Matrix and Analytics+ visuals:
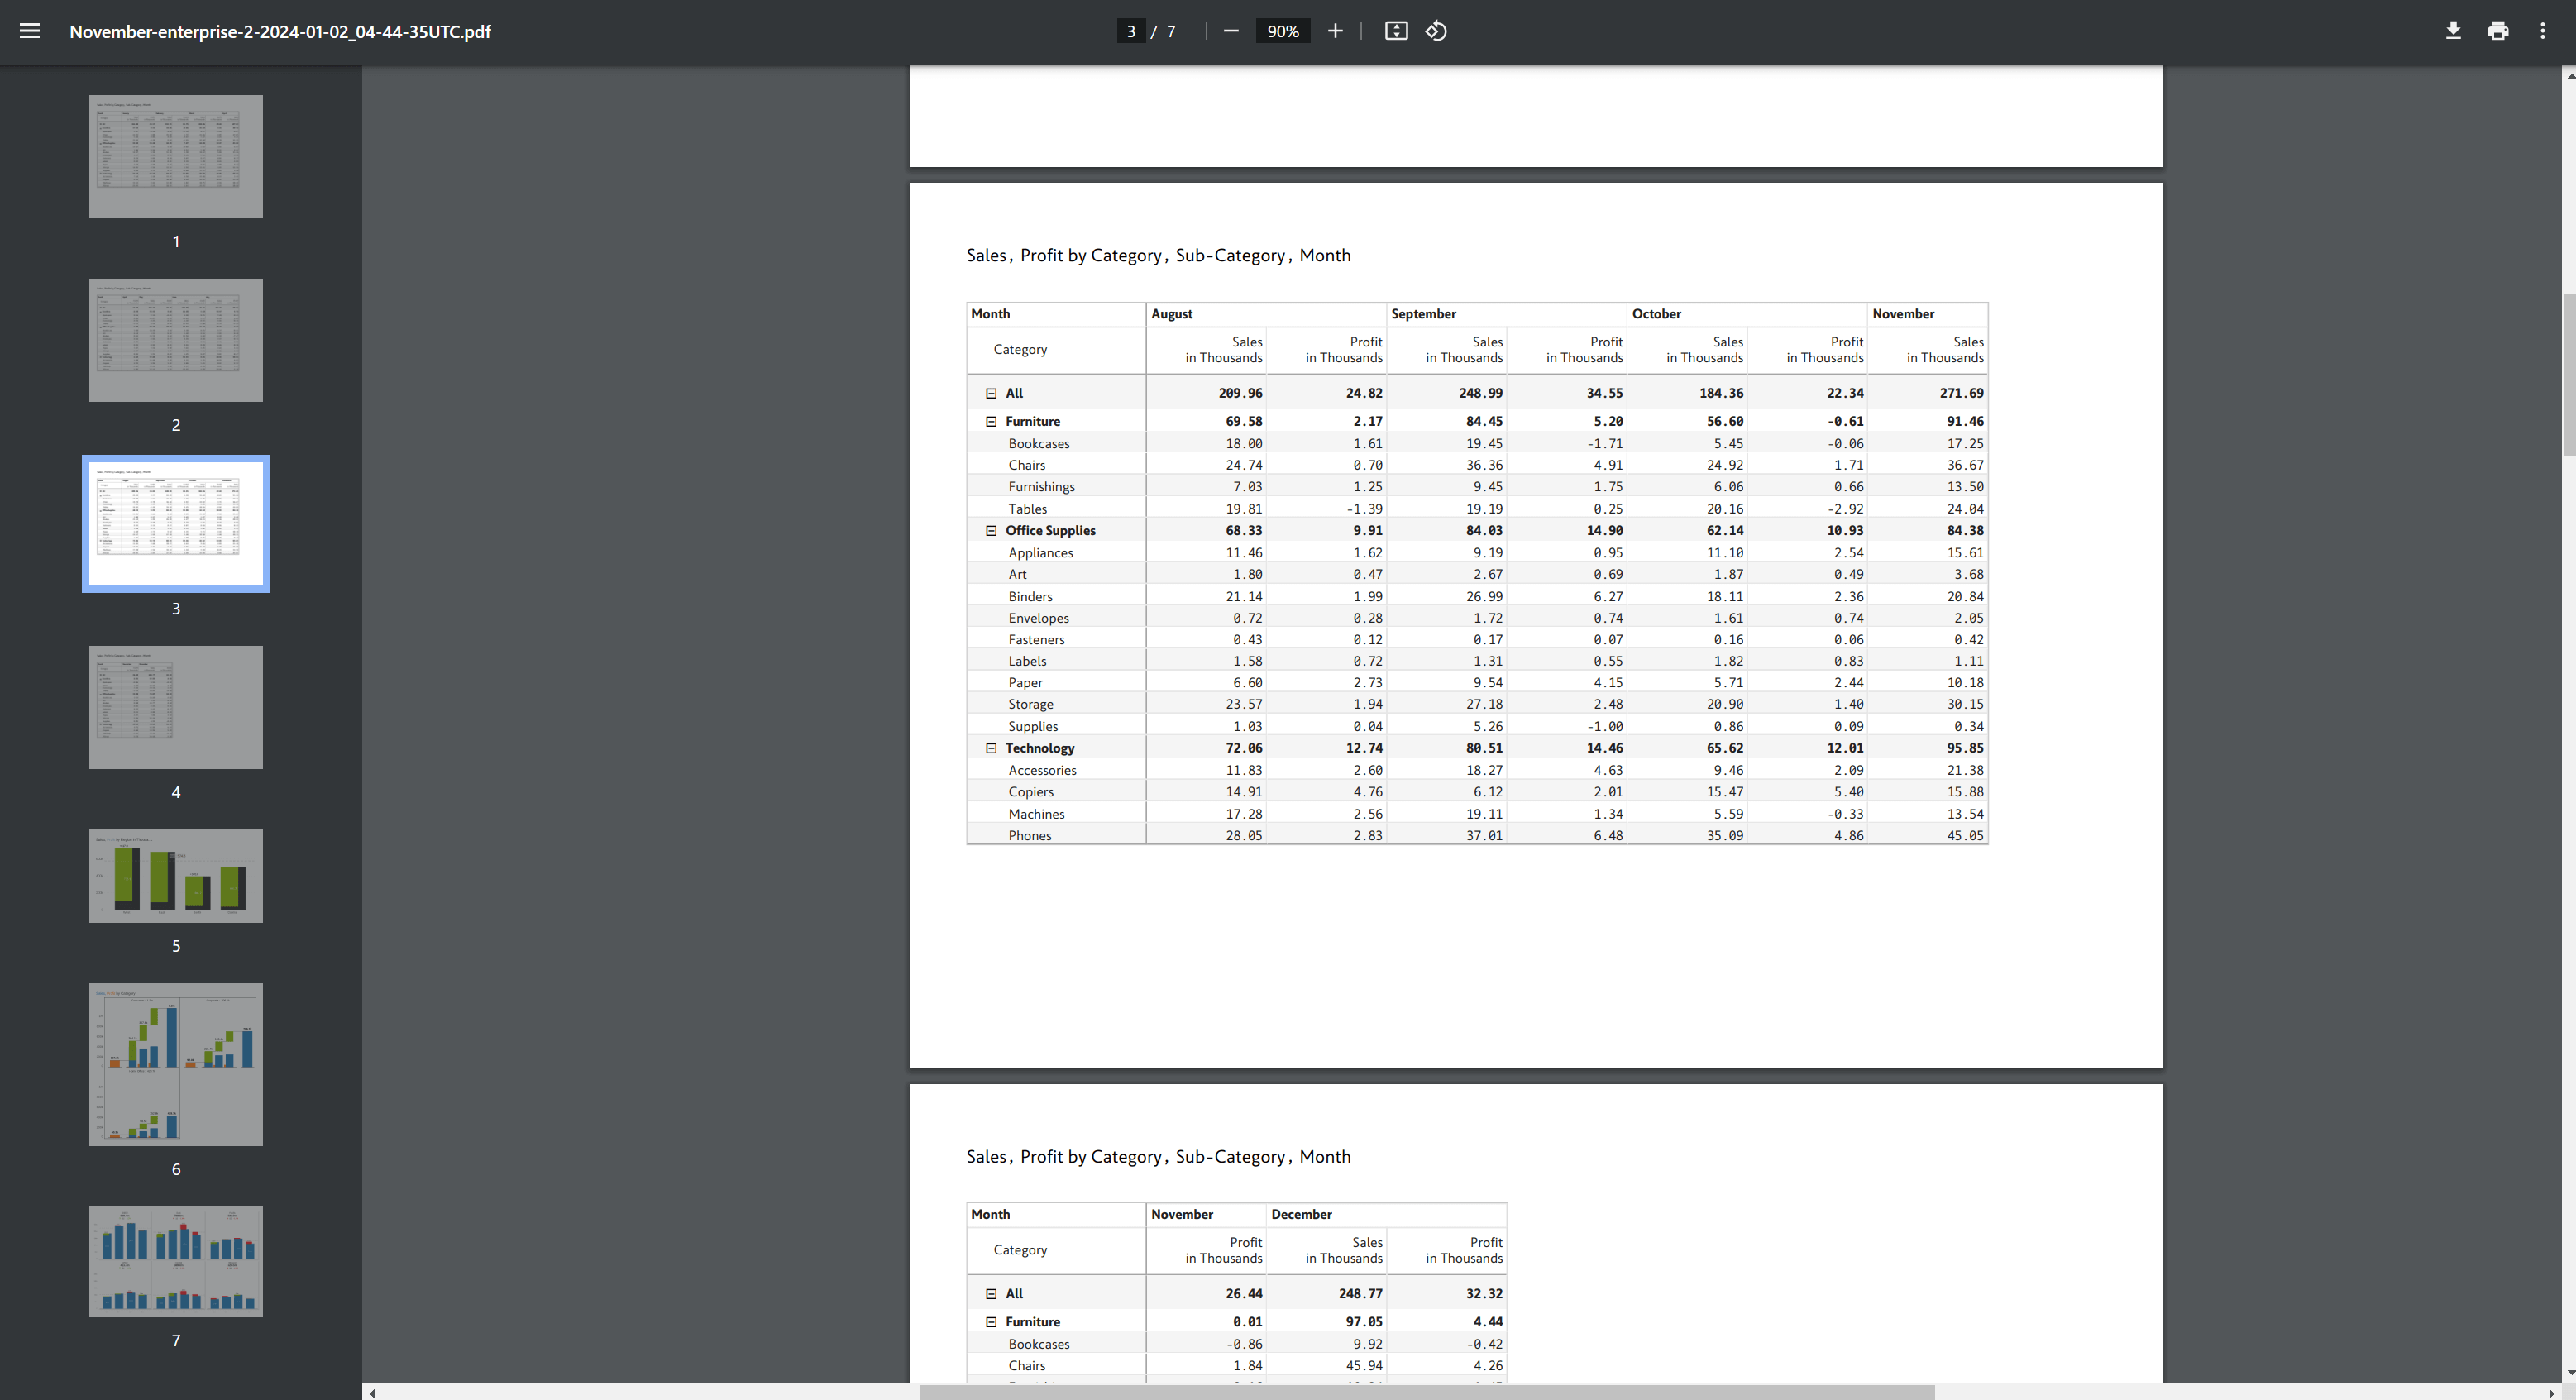
PDF Export:
Excel export:
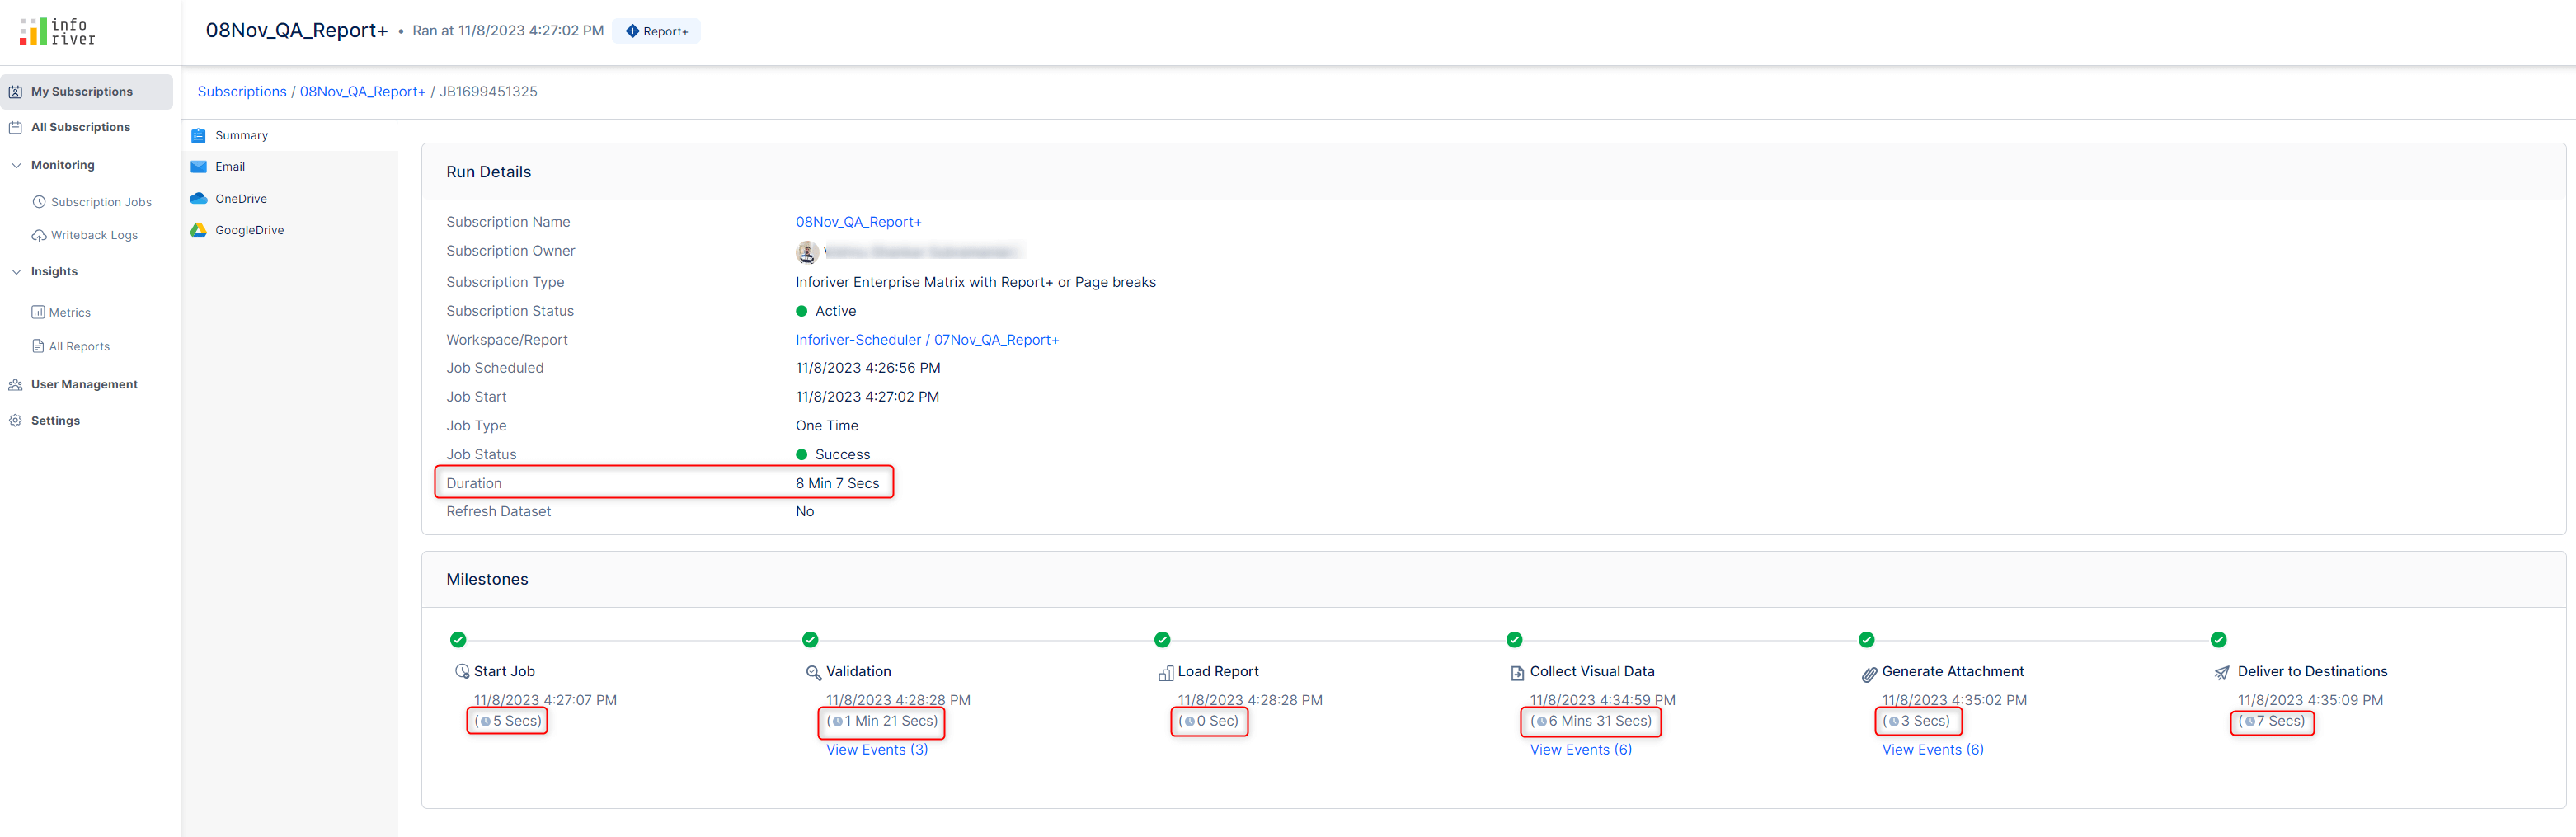
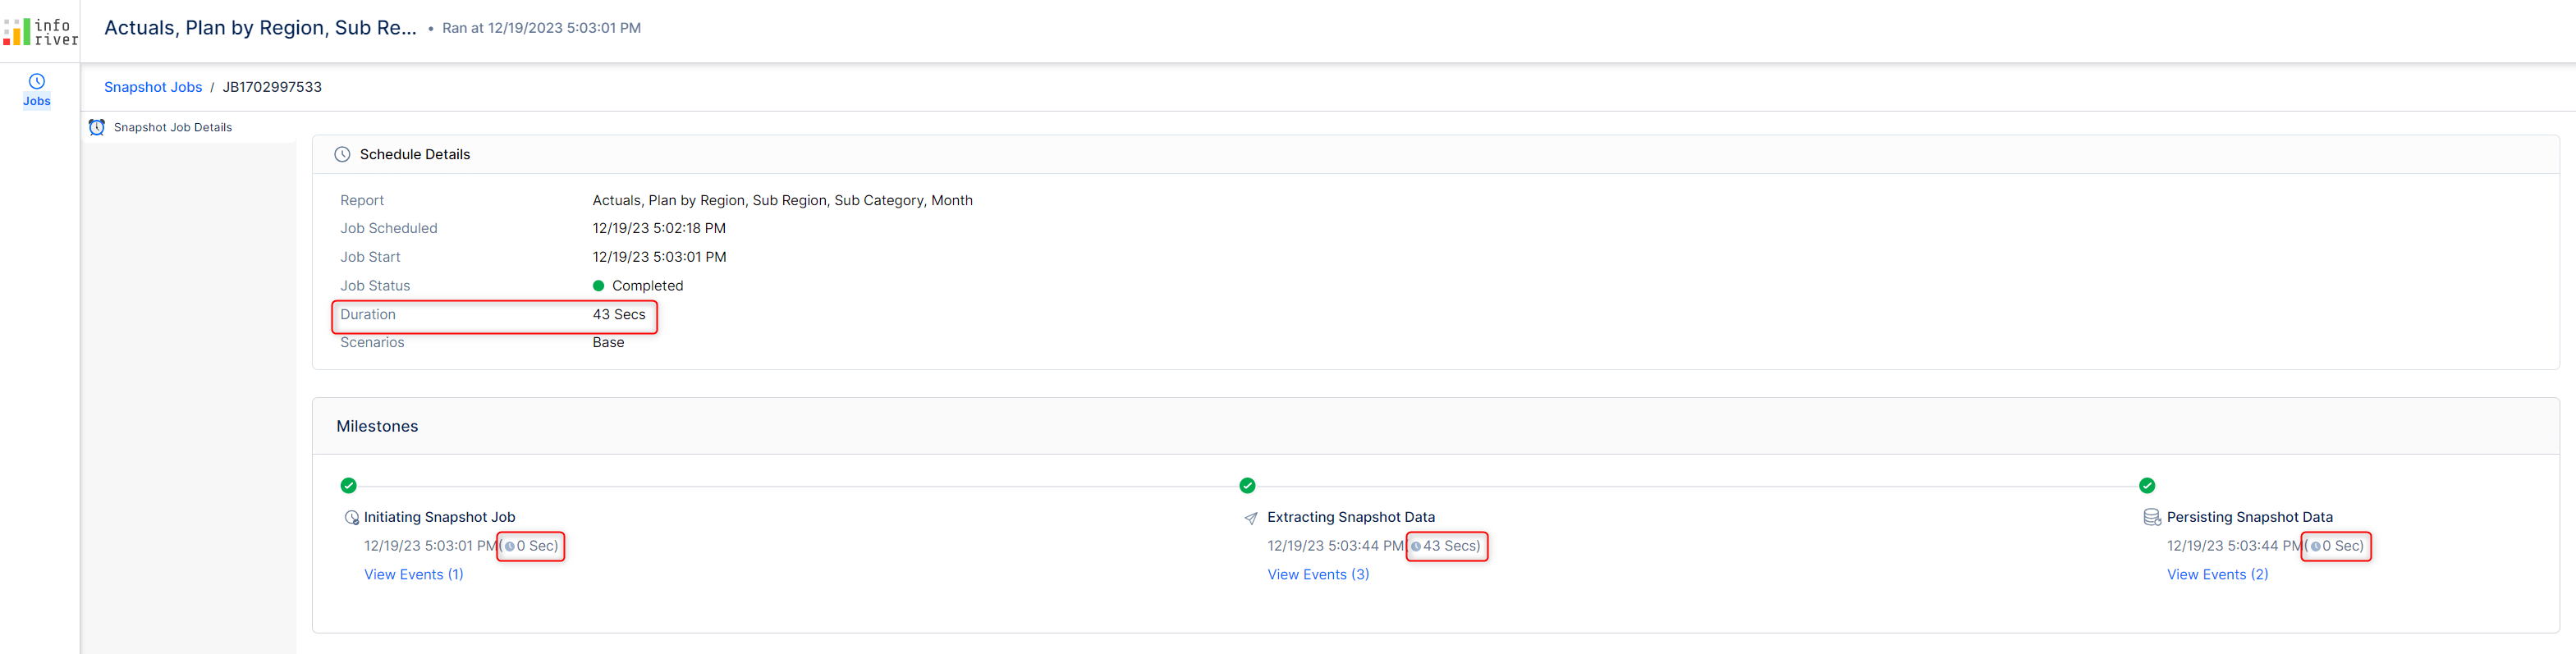
Inforiver breaks down the total duration from this release and tracks the time taken to execute each milestone. The time elapsed has been added for snapshot jobs and report subscription schedules.
Subscription scheduler log:
Snapshot scheduler log:
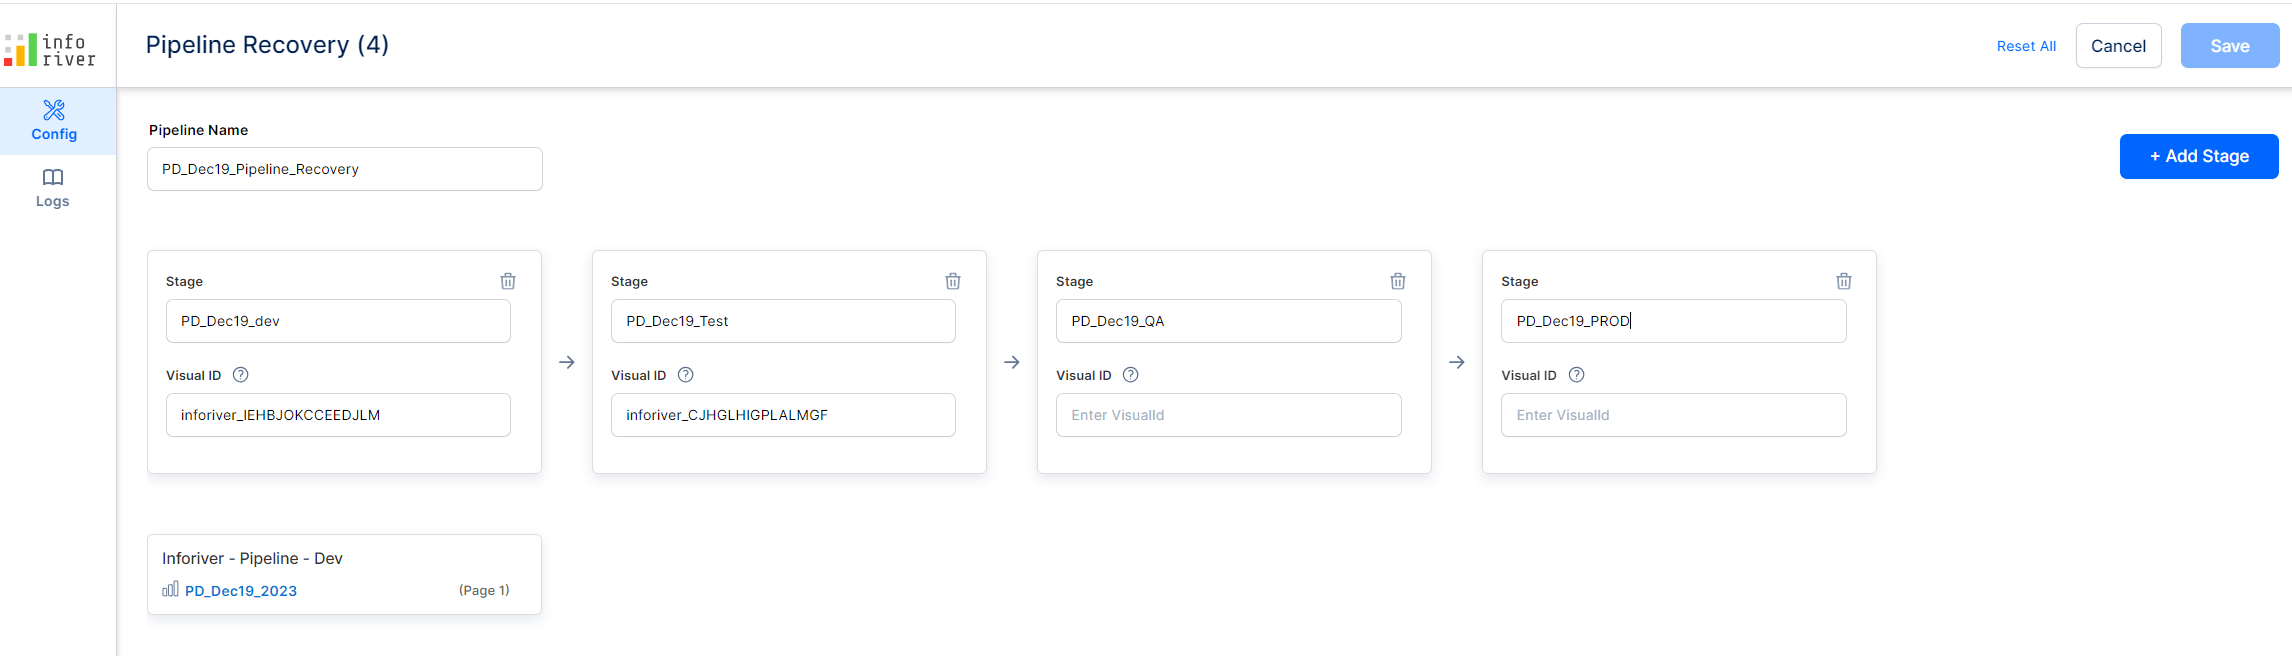
Inforiver visuals can be migrated to higher environments using Power BI deployment pipelines. In the December release, we introduced a pipeline recovery configuration for Inforiver to detect pipeline deployments flawlessly. You must set up a one-time pipeline recovery config for your reports. Once configured, Inforiver will internally compare the visuals in both regions and populate data input fields based on the configurations specified. Learn more about deploying Inforiver visuals.
We'd love to hear your ideas for Inforiver, whether they are a cool new feature or an improvement on existing features. Visit the Inforiver Community to share your ideas, vote on other submissions, and interact with other users.

Inforiver helps enterprises consolidate planning, reporting & analytics on a single platform (Power BI). The no-code, self-service award-winning platform has been recognized as the industry’s best and is adopted by many Fortune 100 firms.
Inforiver is a product of Lumel, the #1 Power BI AppSource Partner. The firm serves over 3,000 customers worldwide through its portfolio of products offered under the brands Inforiver, EDITable, ValQ, and xViz.