Upcoming webinar on 'Inforiver Charts : The fastest way to deliver stories in Power BI', Aug 29th , Monday, 10.30 AM CST. Register Now
Upcoming webinar on 'Inforiver Charts : The fastest way to deliver stories in Power BI', Aug 29th , Monday, 10.30 AM CST. Register Now
Welcome to the Inforiver Enterprise 2.9.8 release updates!
In this release, we have a few notable enhancements such as access control in writeback, additional filter to track comments, triggering subscriptions from external applications, and much more. Thank you for choosing Inforiver! With these updates, we strive to improve your experience and make the most of our product.
The release notes are organized into toolbar sections. Feel free to explore the sections that interest you.
1.1 Access control to manage writeback destinations
1.2 Role-based access control for writeback admin connections
1.3 Authentication simplified for Snowflake destination
1.4 Custom validation rules for writeback
1.5 Updates due to skipped row ID dimensions reflected in writeback data
2.1 Create Date Input column using the dates available in rows
3.1 Track specific tasks with the ‘Assigned By’ filter
4.1 Advanced Filtering in Goal Seek
4.2 Column referencing support in Goal Seek
5.1 German language interface supported in the visual
6.1 Option to re-arrange the tabs in Reading view
6.2 Menu options re-organized in the Minimal view toolbar
7.1 Customize the display style for open and closed periods
7.2 Border styles included in column style formatting options
8.1 API token management screen to create and manage tokens
9.1 Trigger subscriptions from external applications
9.2 Refresh semantic data input source using API
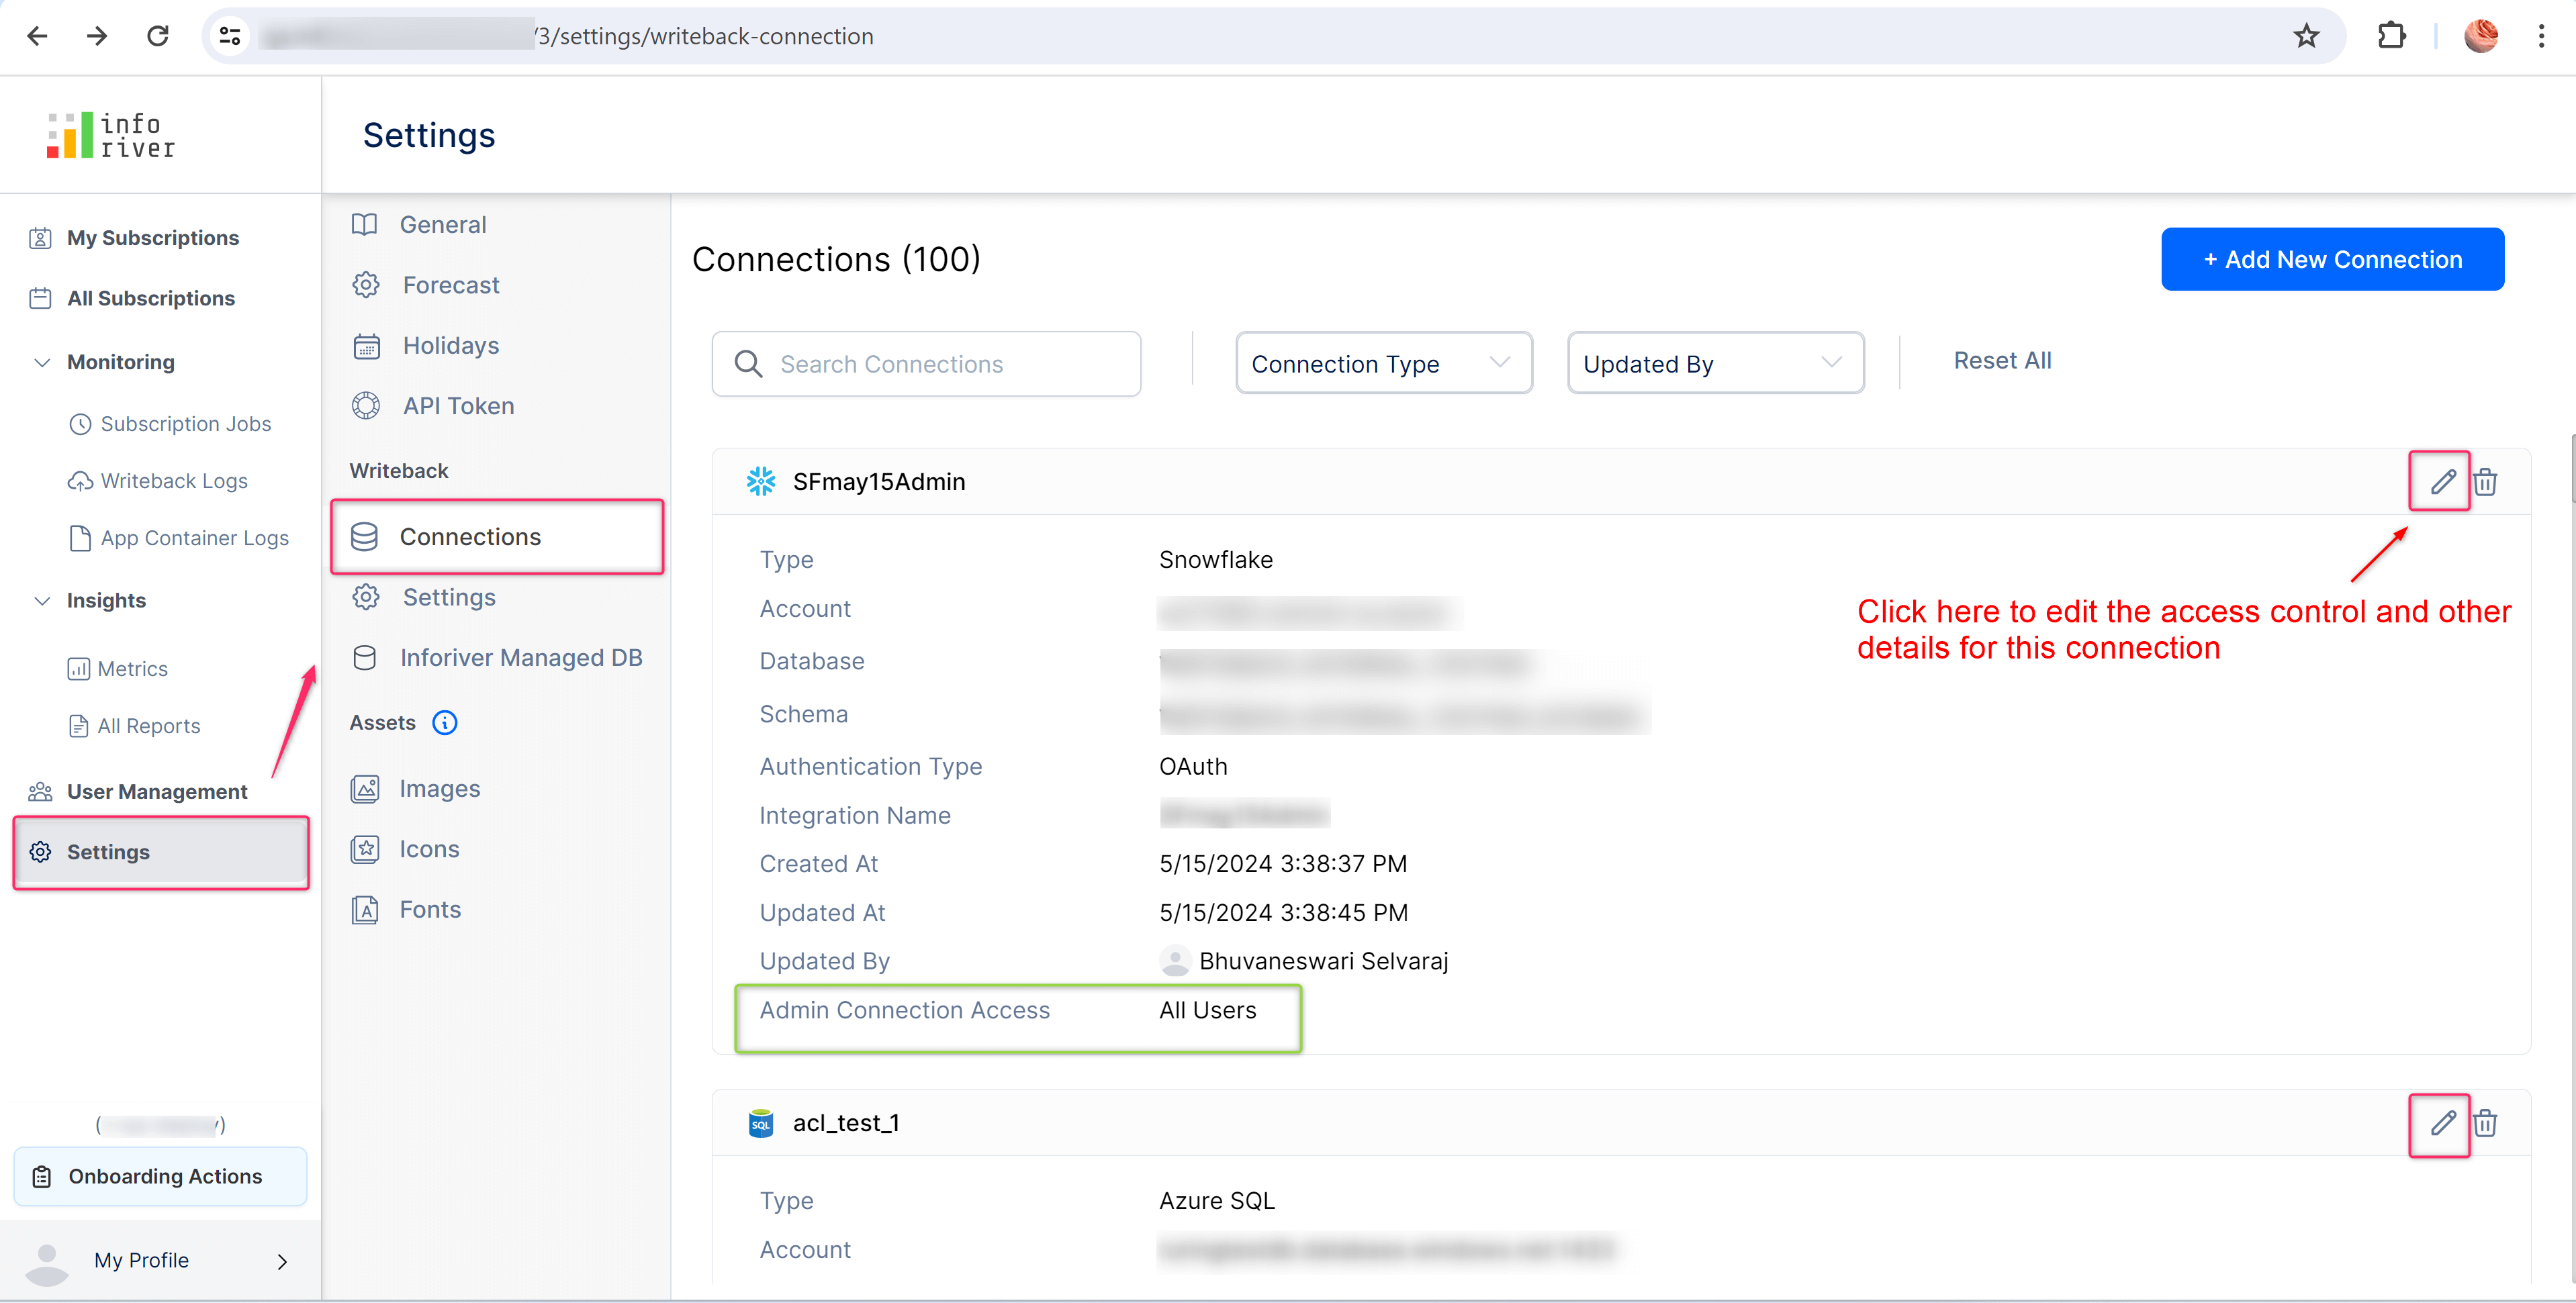
You can now limit the users who can manage writeback destinations. For example, you can let only certain users add, edit, or delete writeback destinations. Other users would be disabled from adding writeback destinations from the visual or the console.
As an admin, you can specify the email IDs of specific users or add an Active Directory list in the admin console, as shown below, who will be given permission to add writeback destinations.
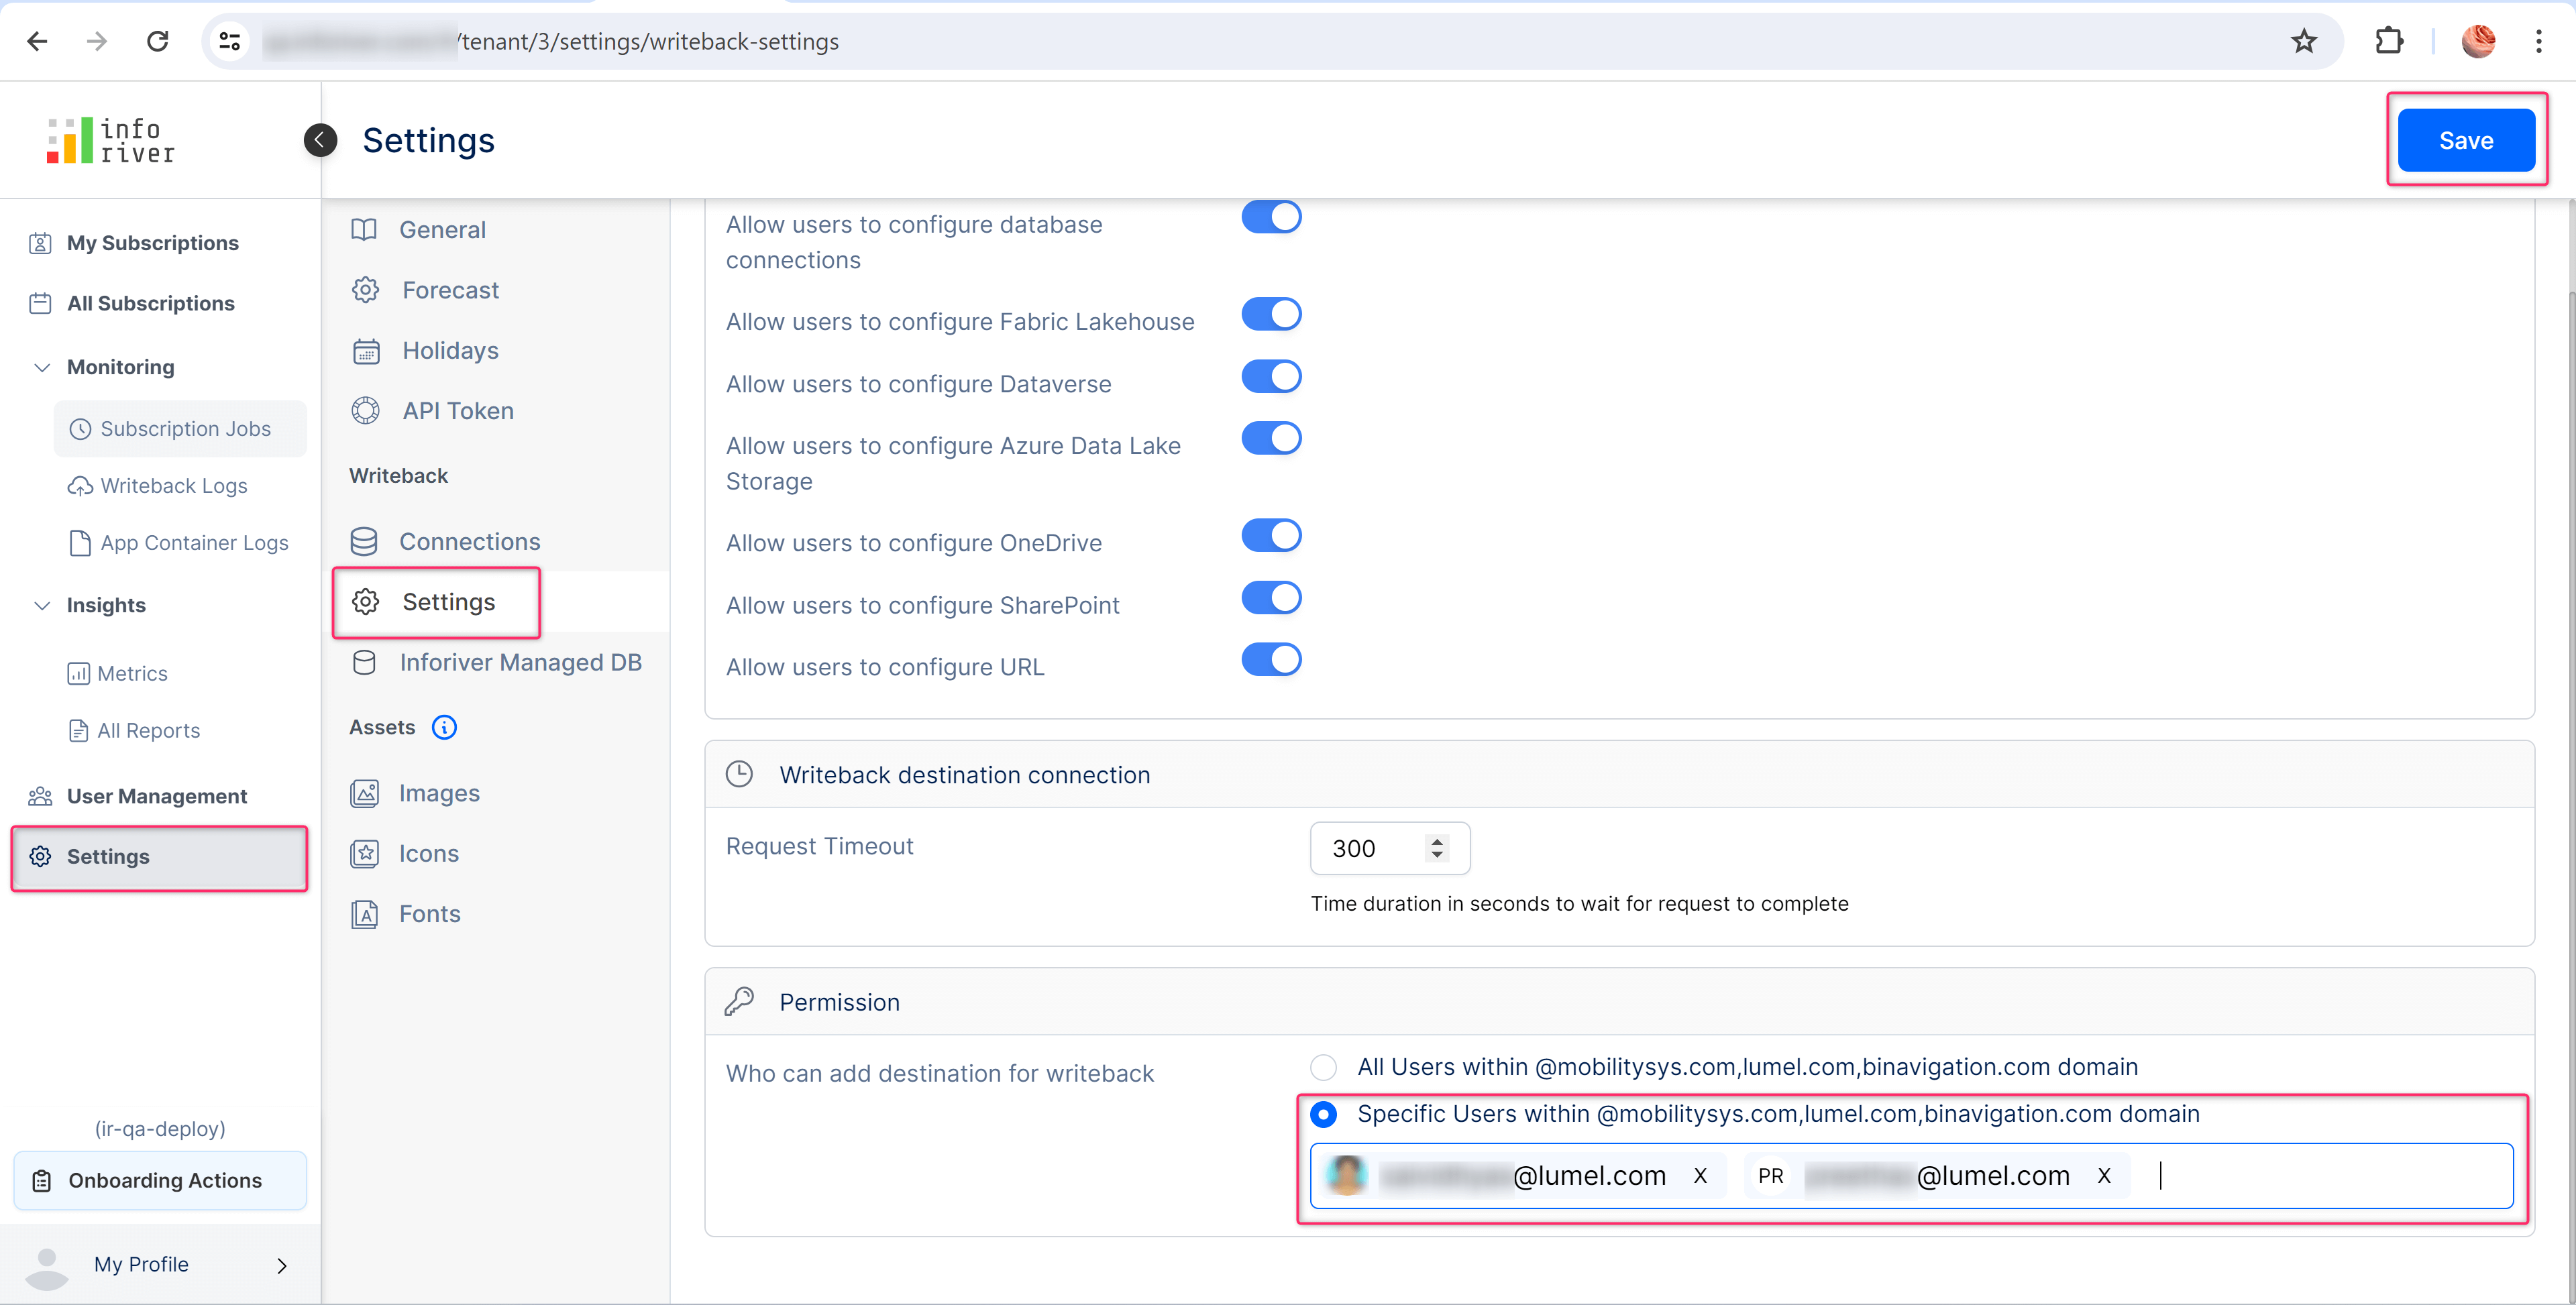
If access is revoked for a user who has previously added a destination, they can still view their added destination but cannot edit or delete it.
Admins can now specify who can access a particular connection as shown in the image below.
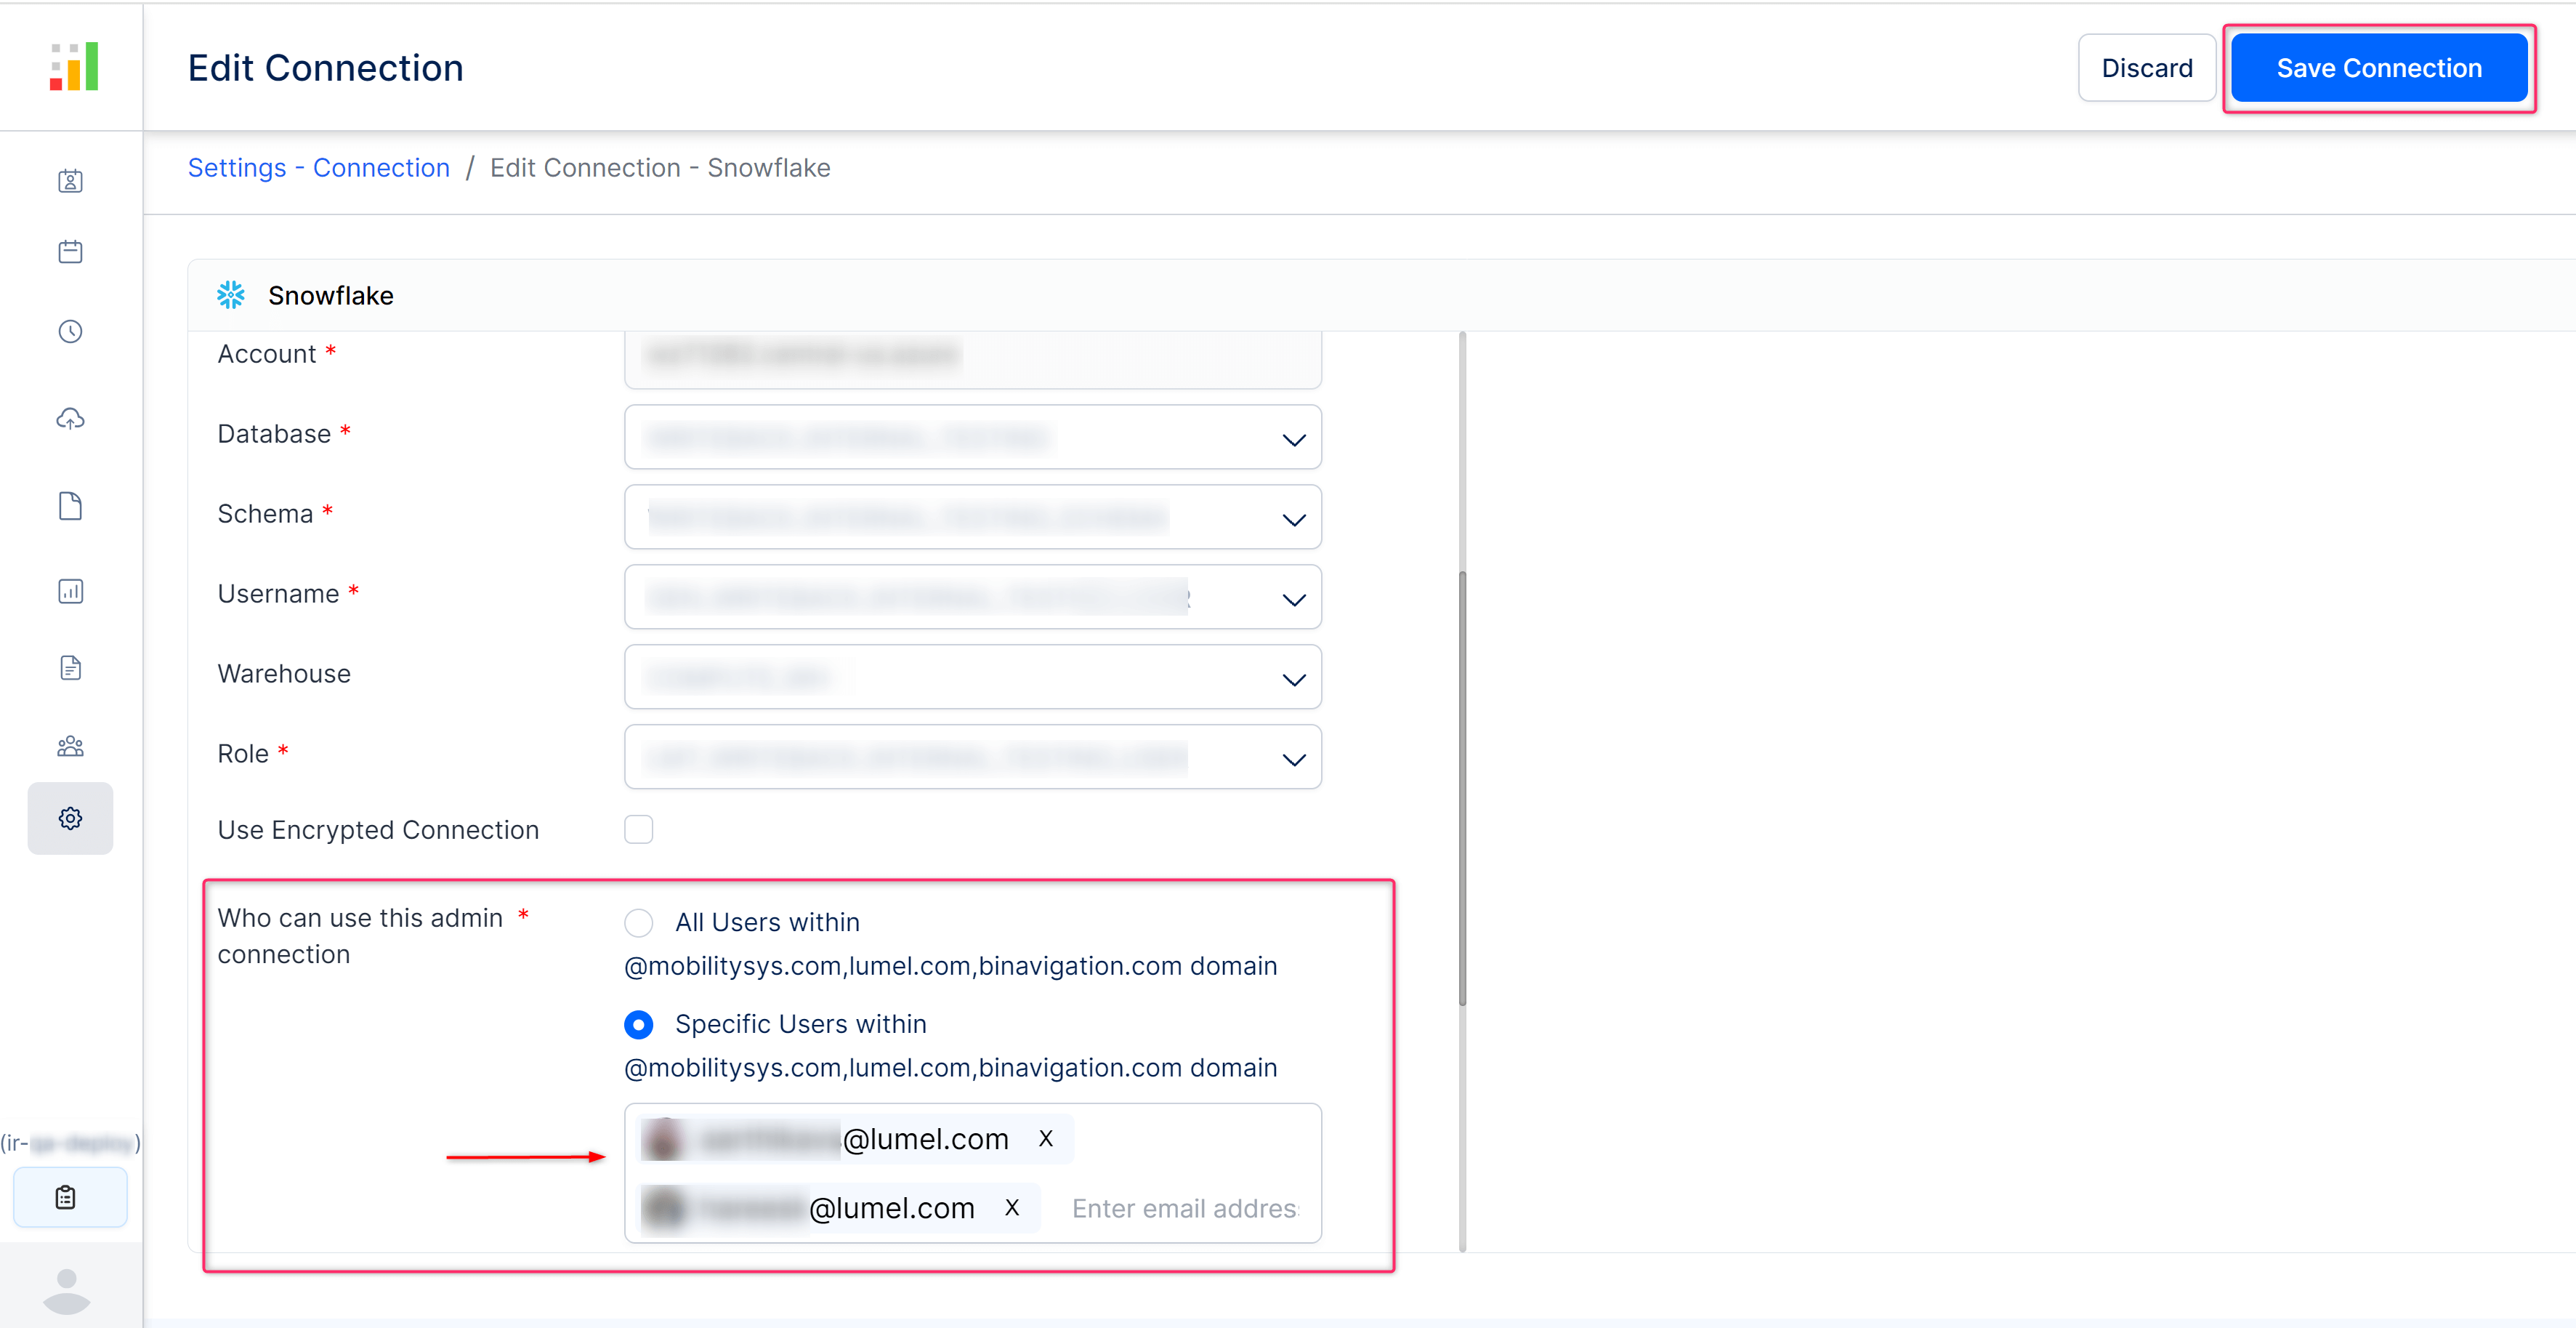
While configuring a new destination, only the specified users as added above, will be able to view and connect to this admin connection. Other users without access cannot view it in the list of connections.
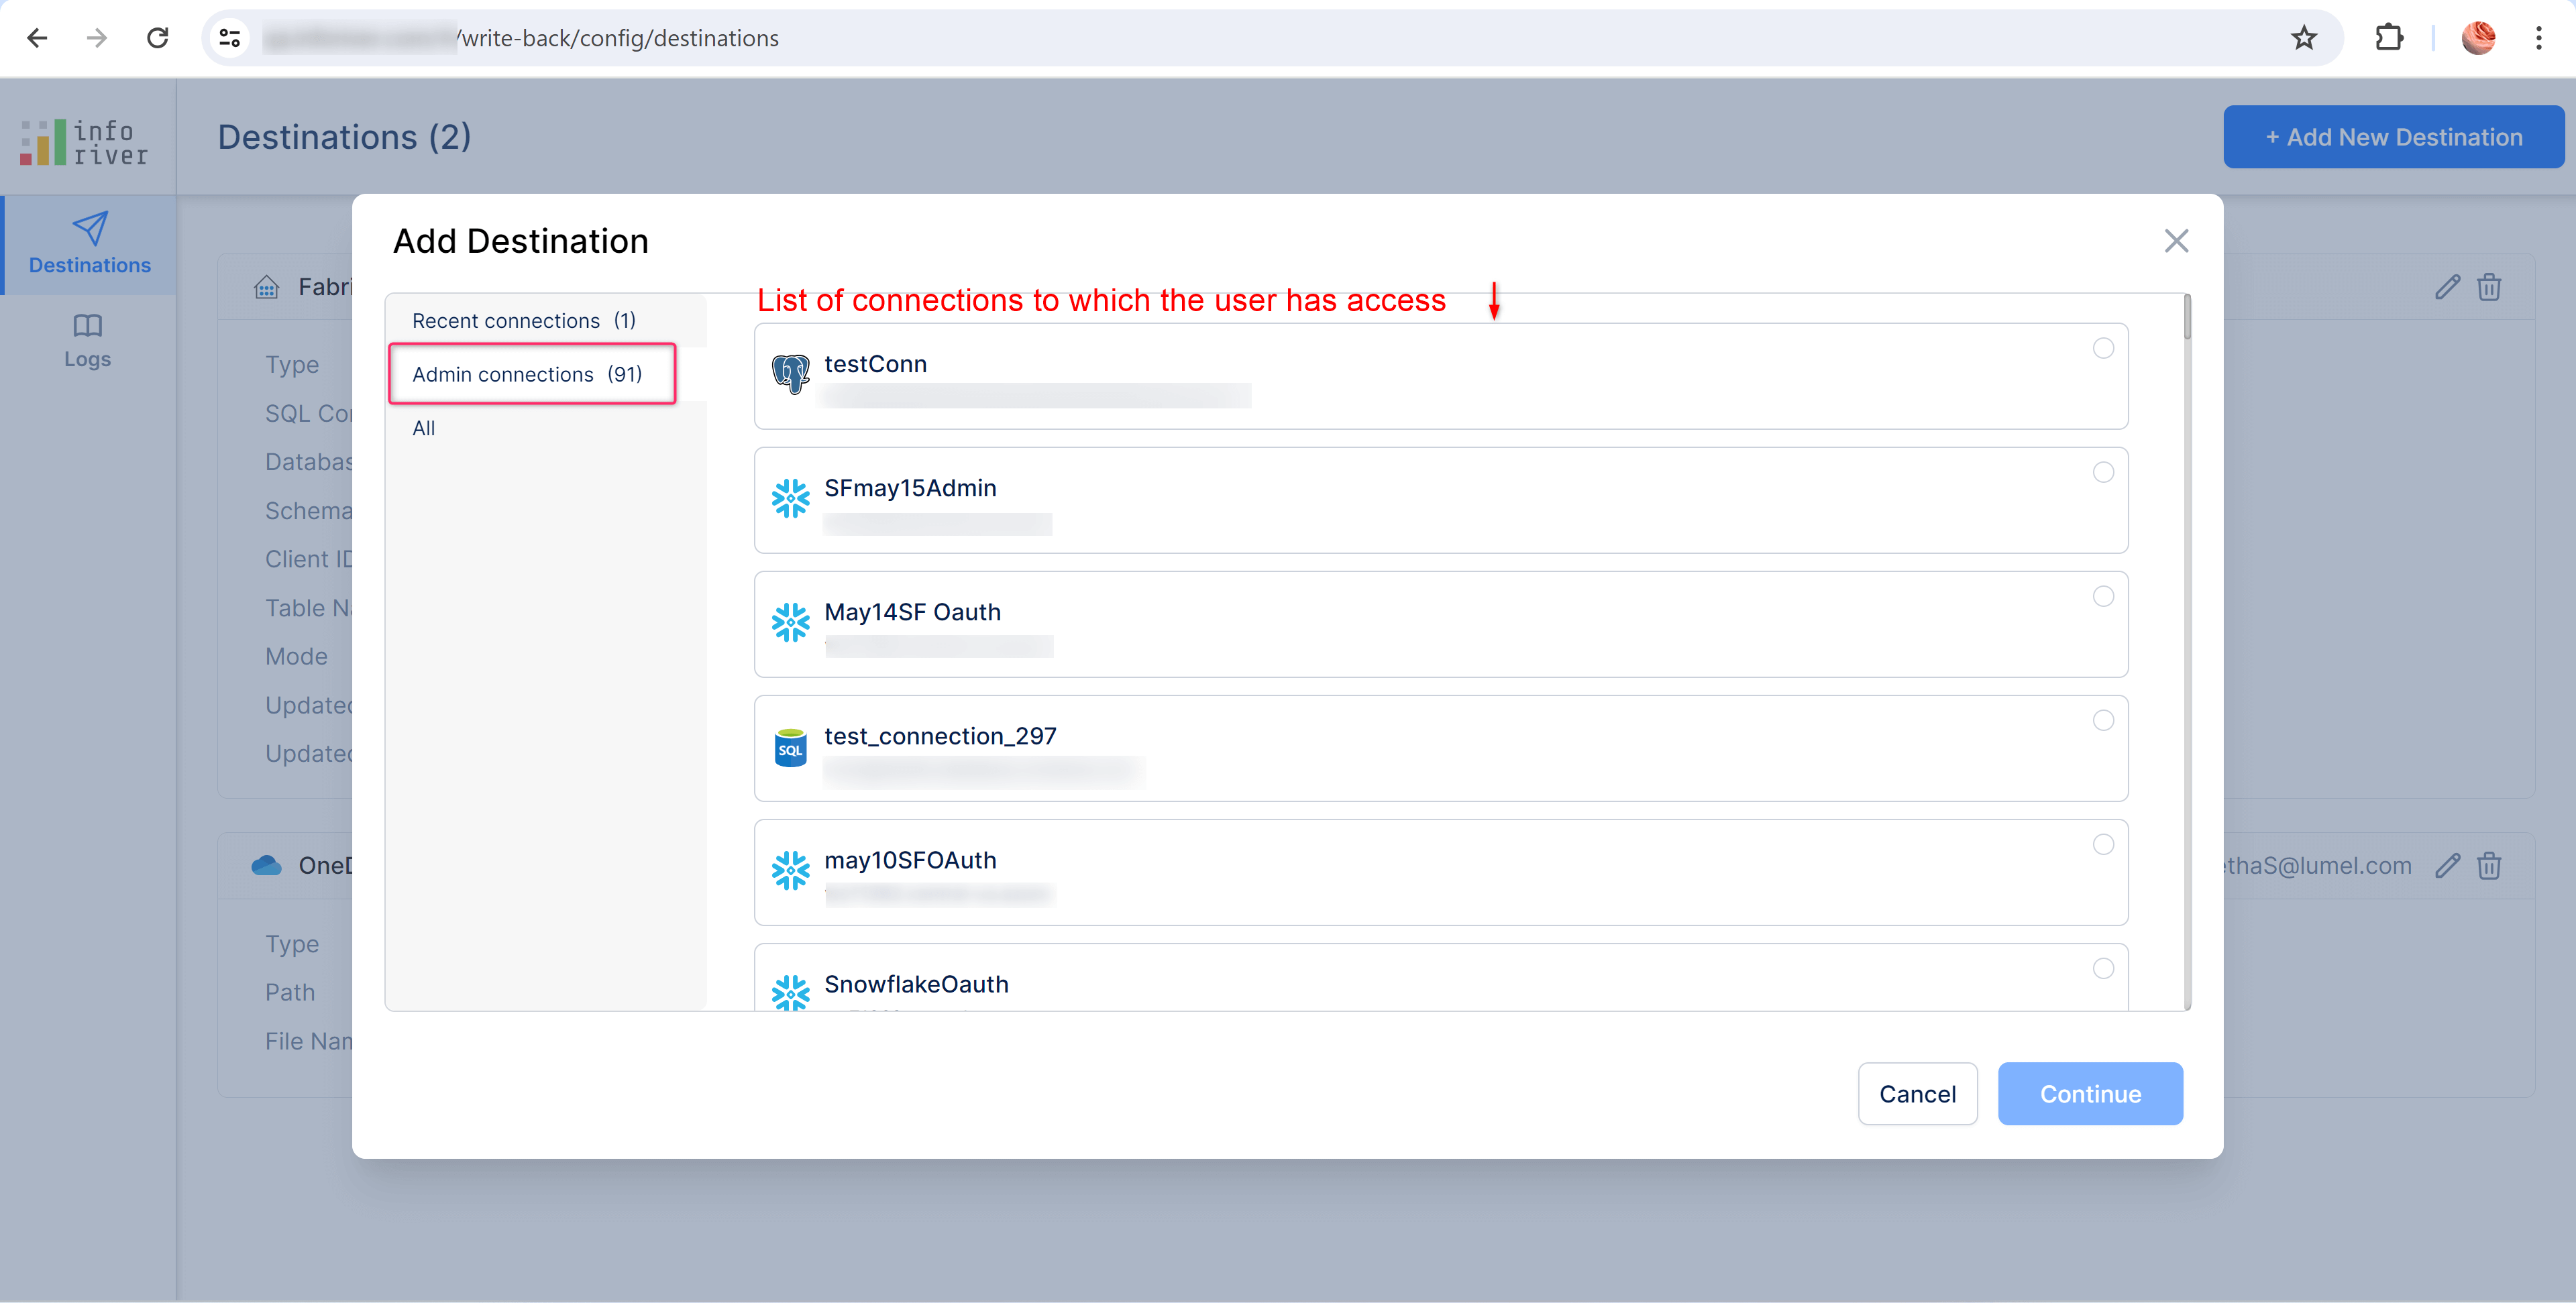
If a user who created the admin connection has their access revoked, they can still view the connection details in their profile's 'My Connections' tab. However, they will not be able to connect to it, or modify its accessibility.
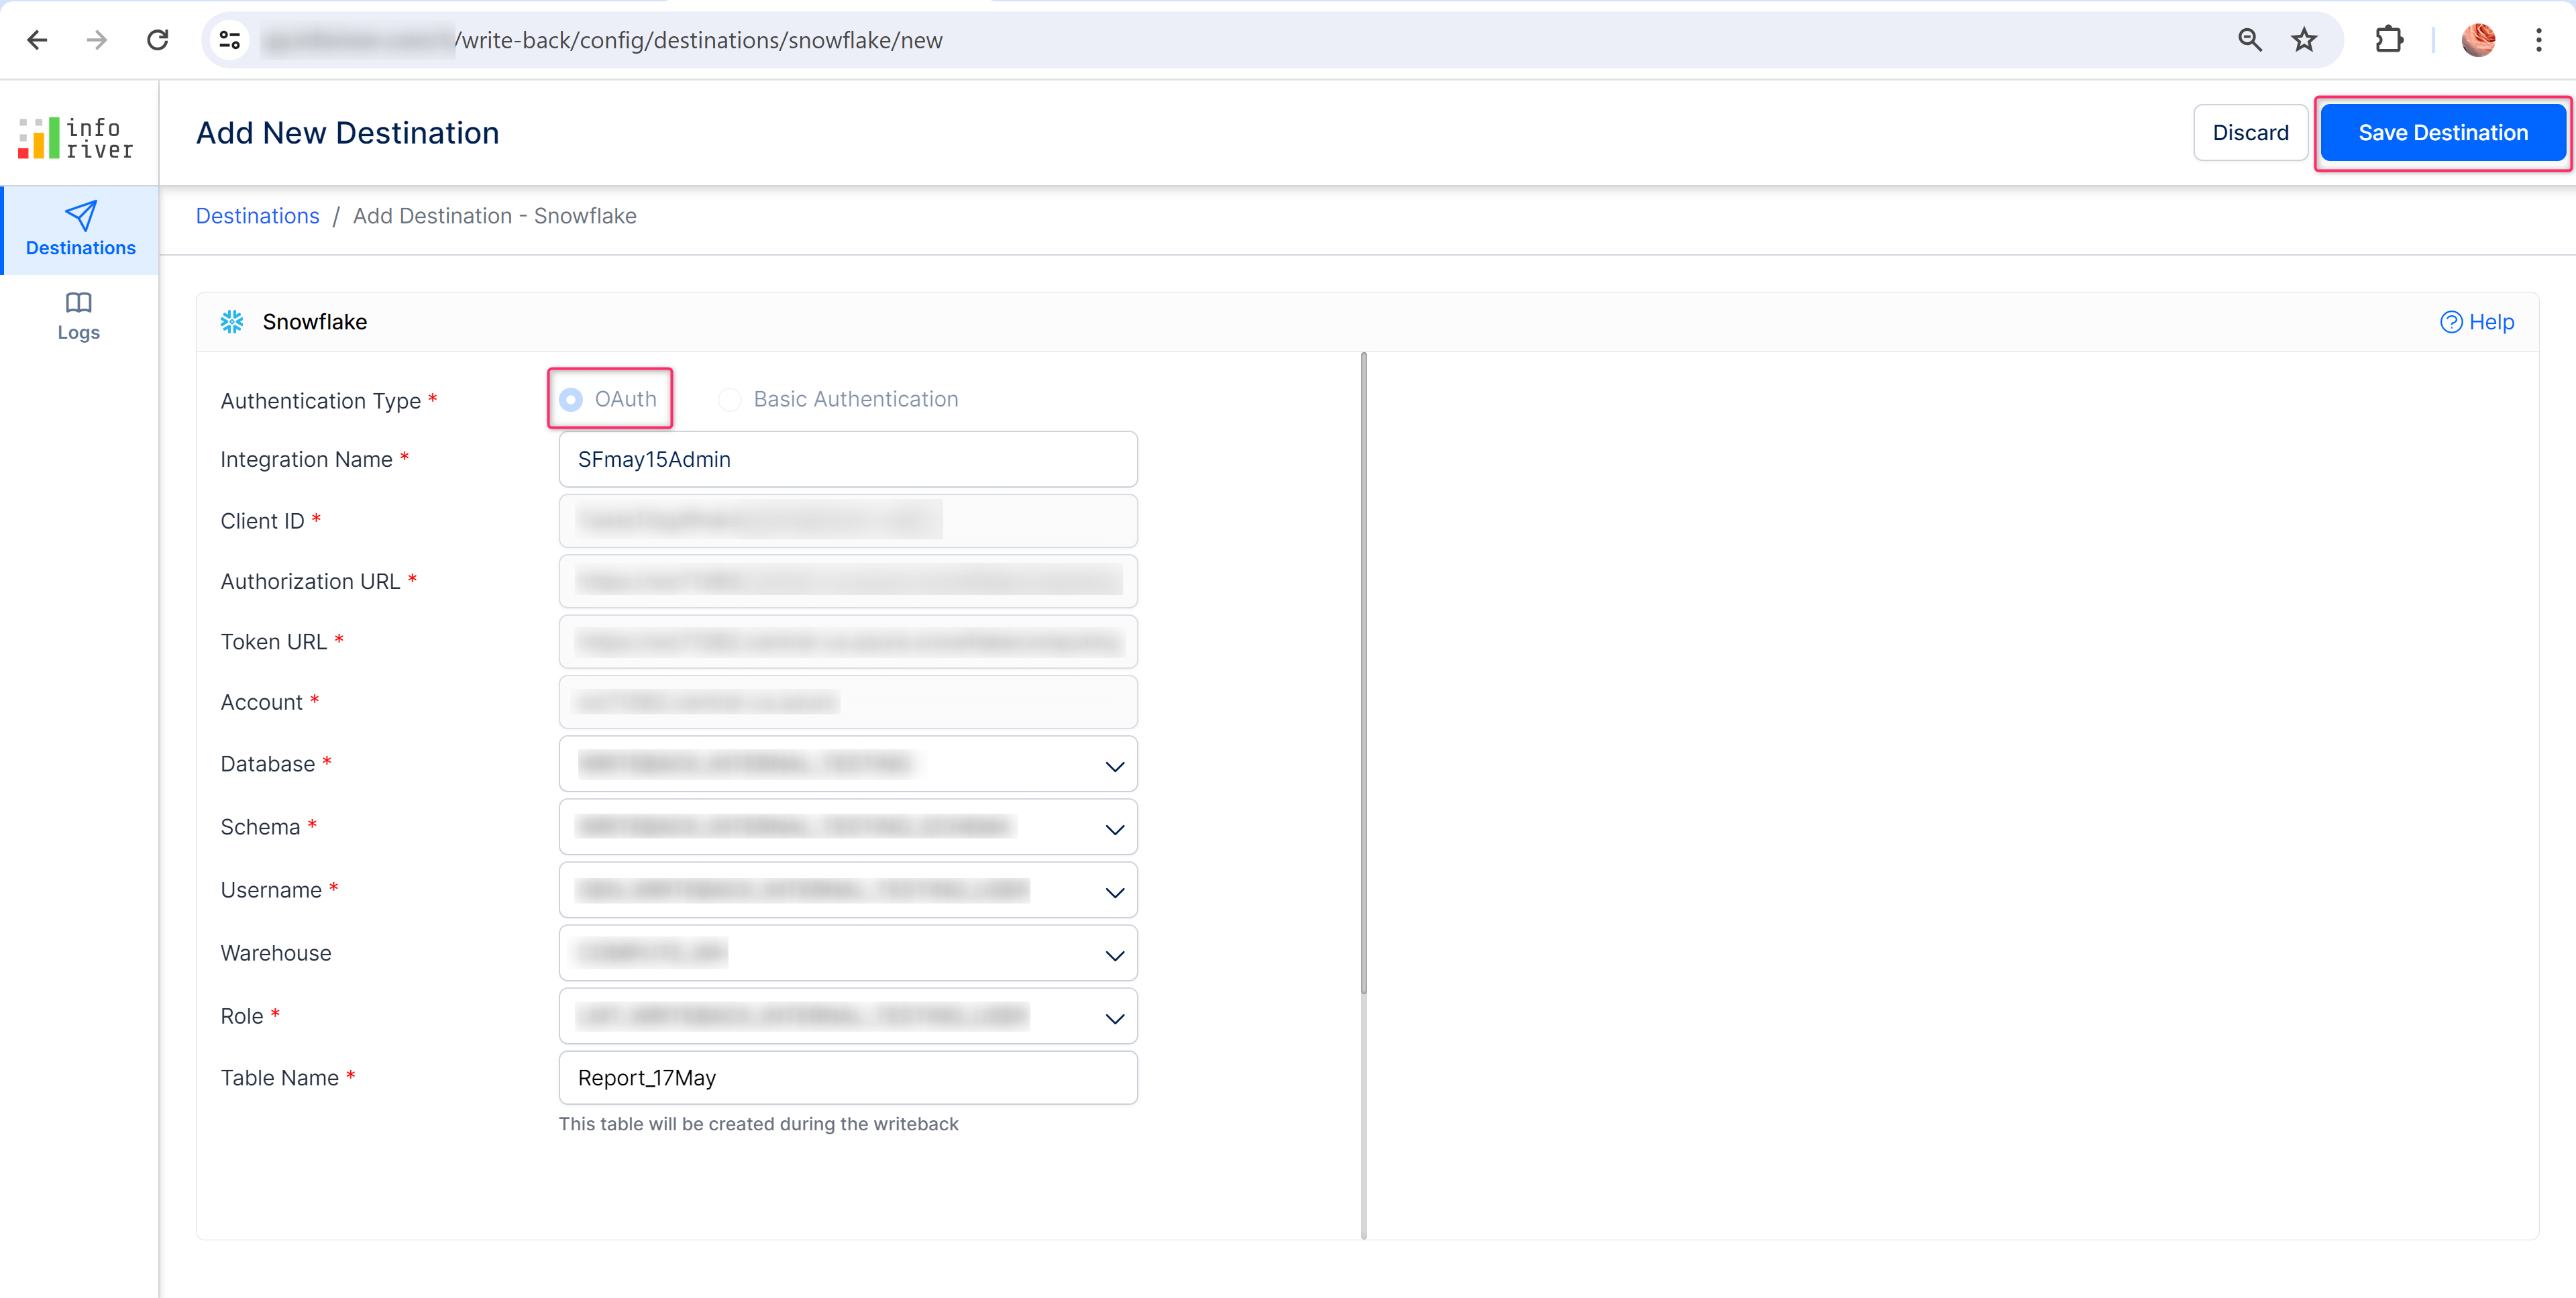
When adding a Snowflake destination, basic authentication with username and password was used to login. Now, you can also use OAuth type authentication to log in. This ensures that the login process is simple and secure. The example below illustrates adding a Snowflake destination to an existing integration using OAuth-type authentication.
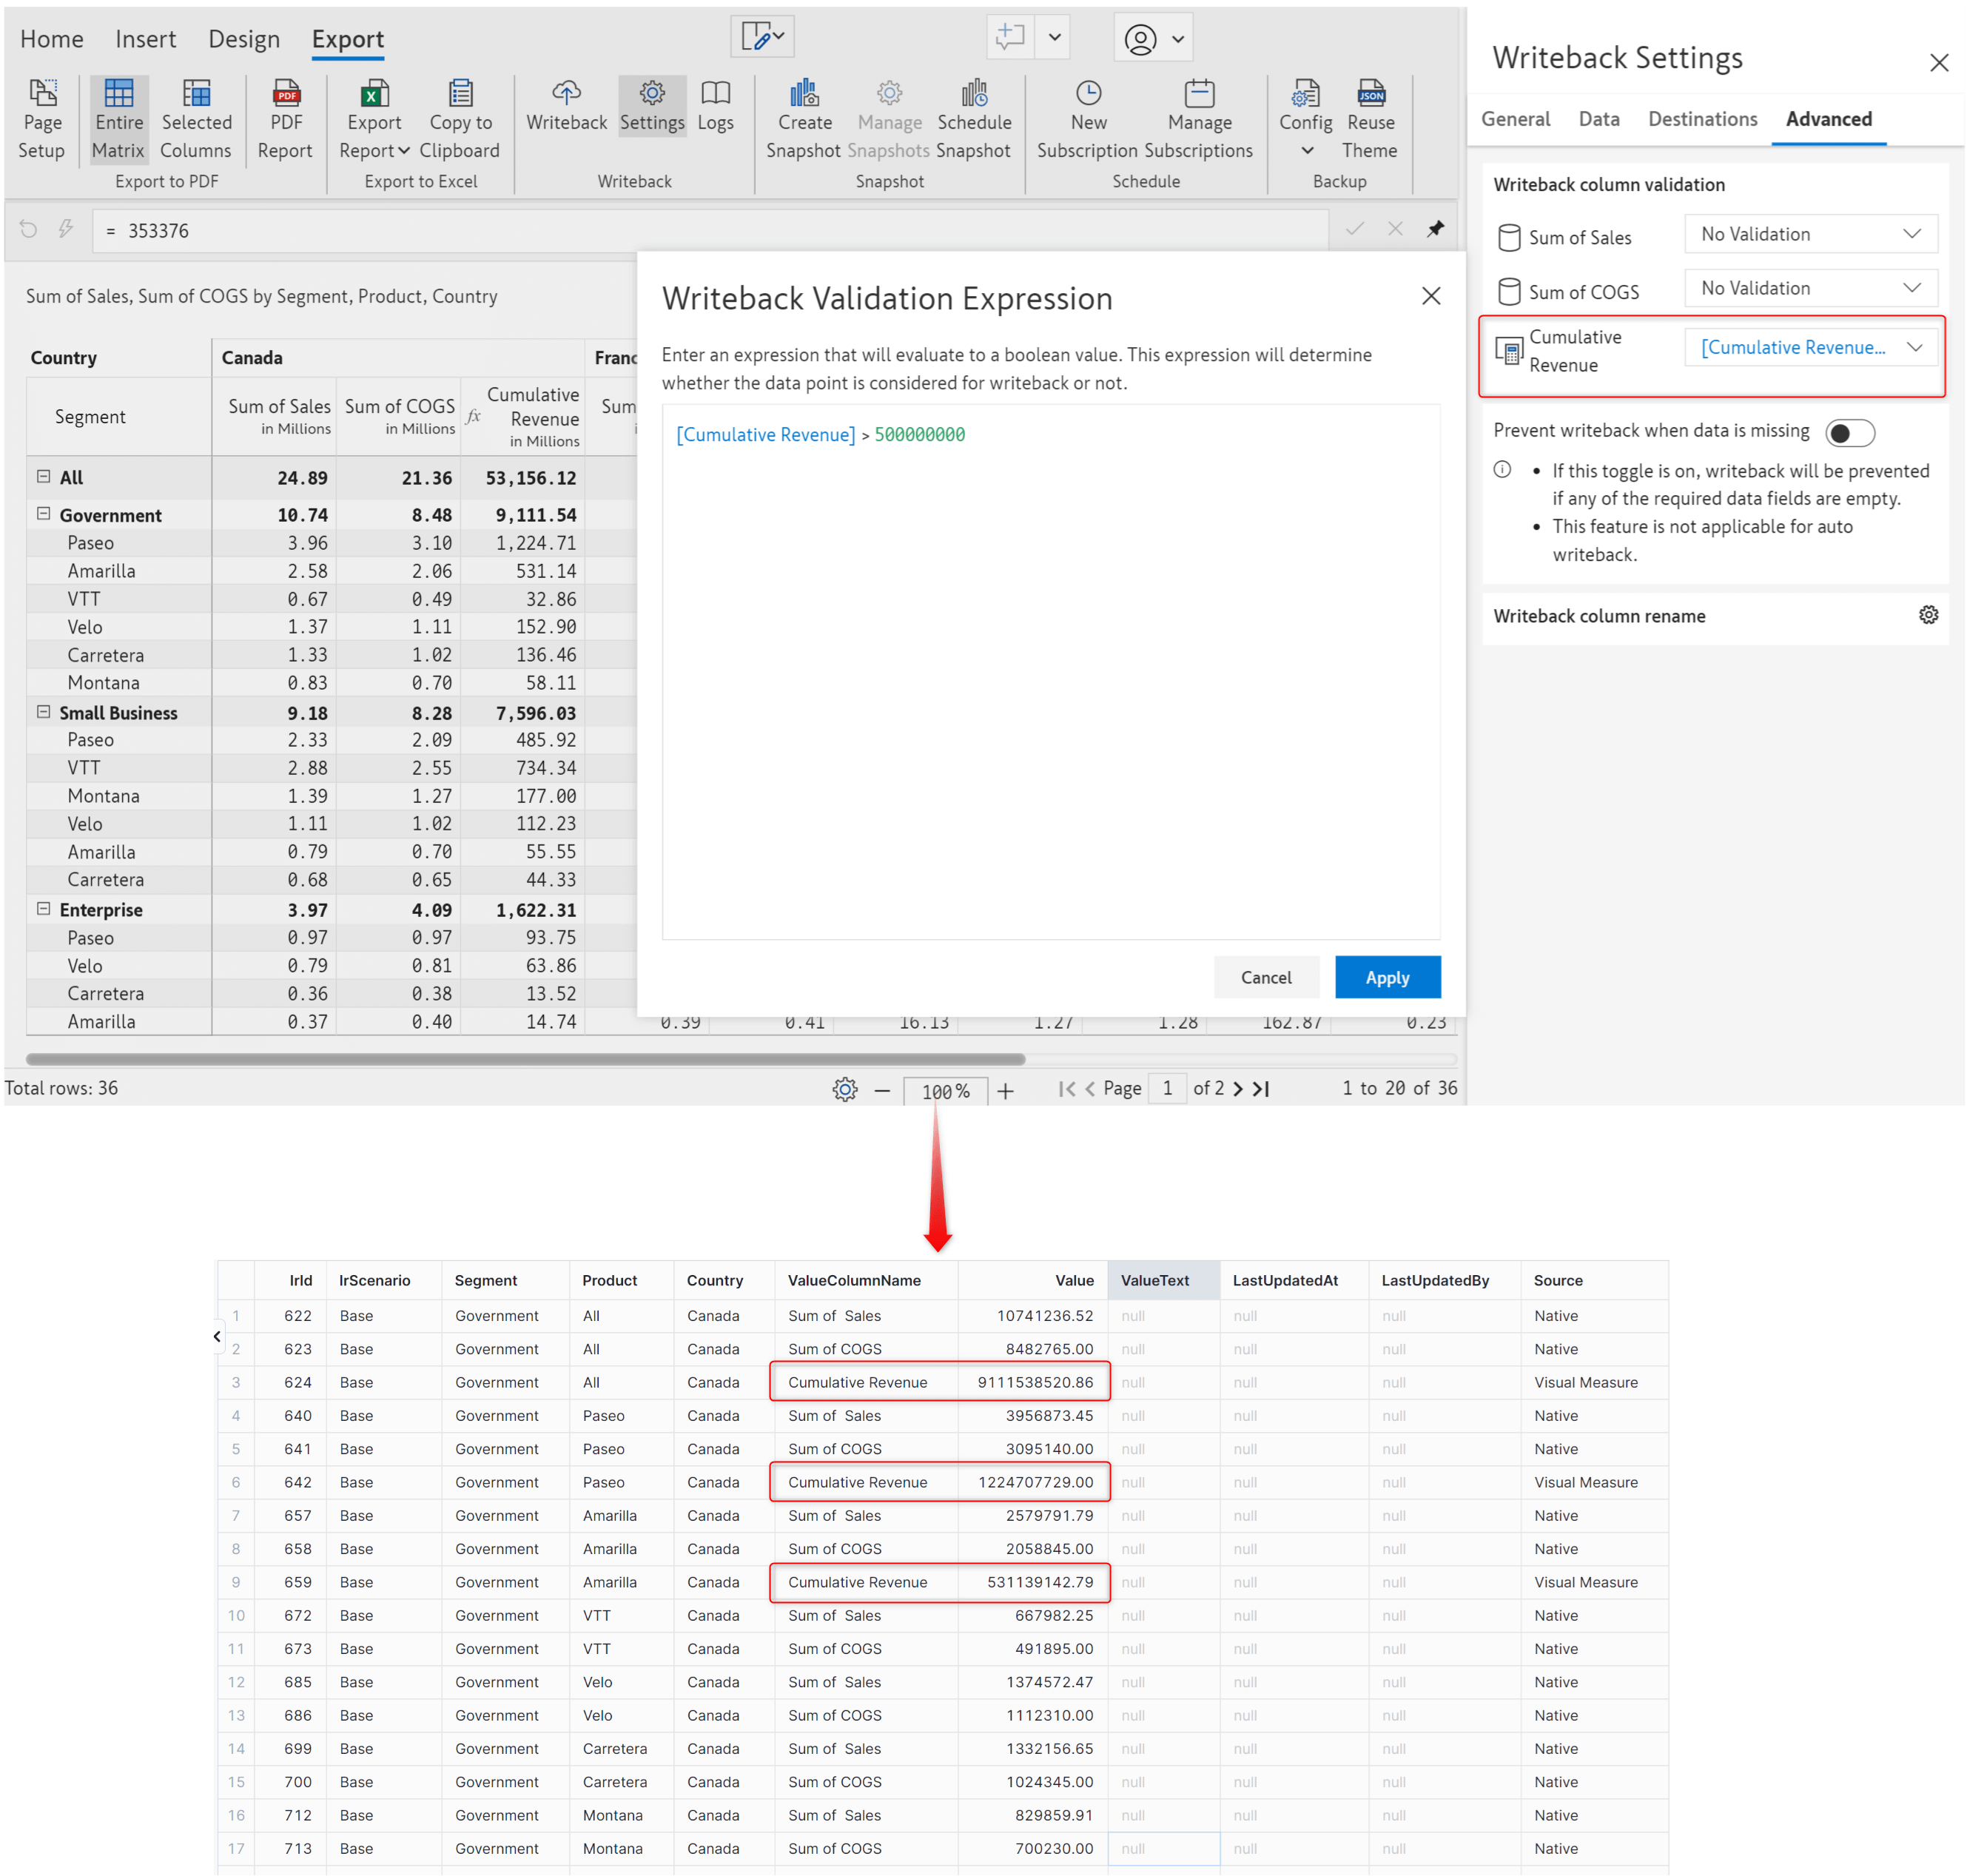
With the latest version, you can choose the data points needed to be written back by using a validation expression that checks the cells before writeback. The cells whose values do not satisfy the validation rule will be excluded during writeback. In the sample report, for the ‘Cumulative Revenue’ measure, we have written back only the data cells whose values are greater than 500 million using the validation expression seen below. Now if you see the writeback data for the Government segment, only the data cells where the cumulative revenue exceeds 500 million are written back.
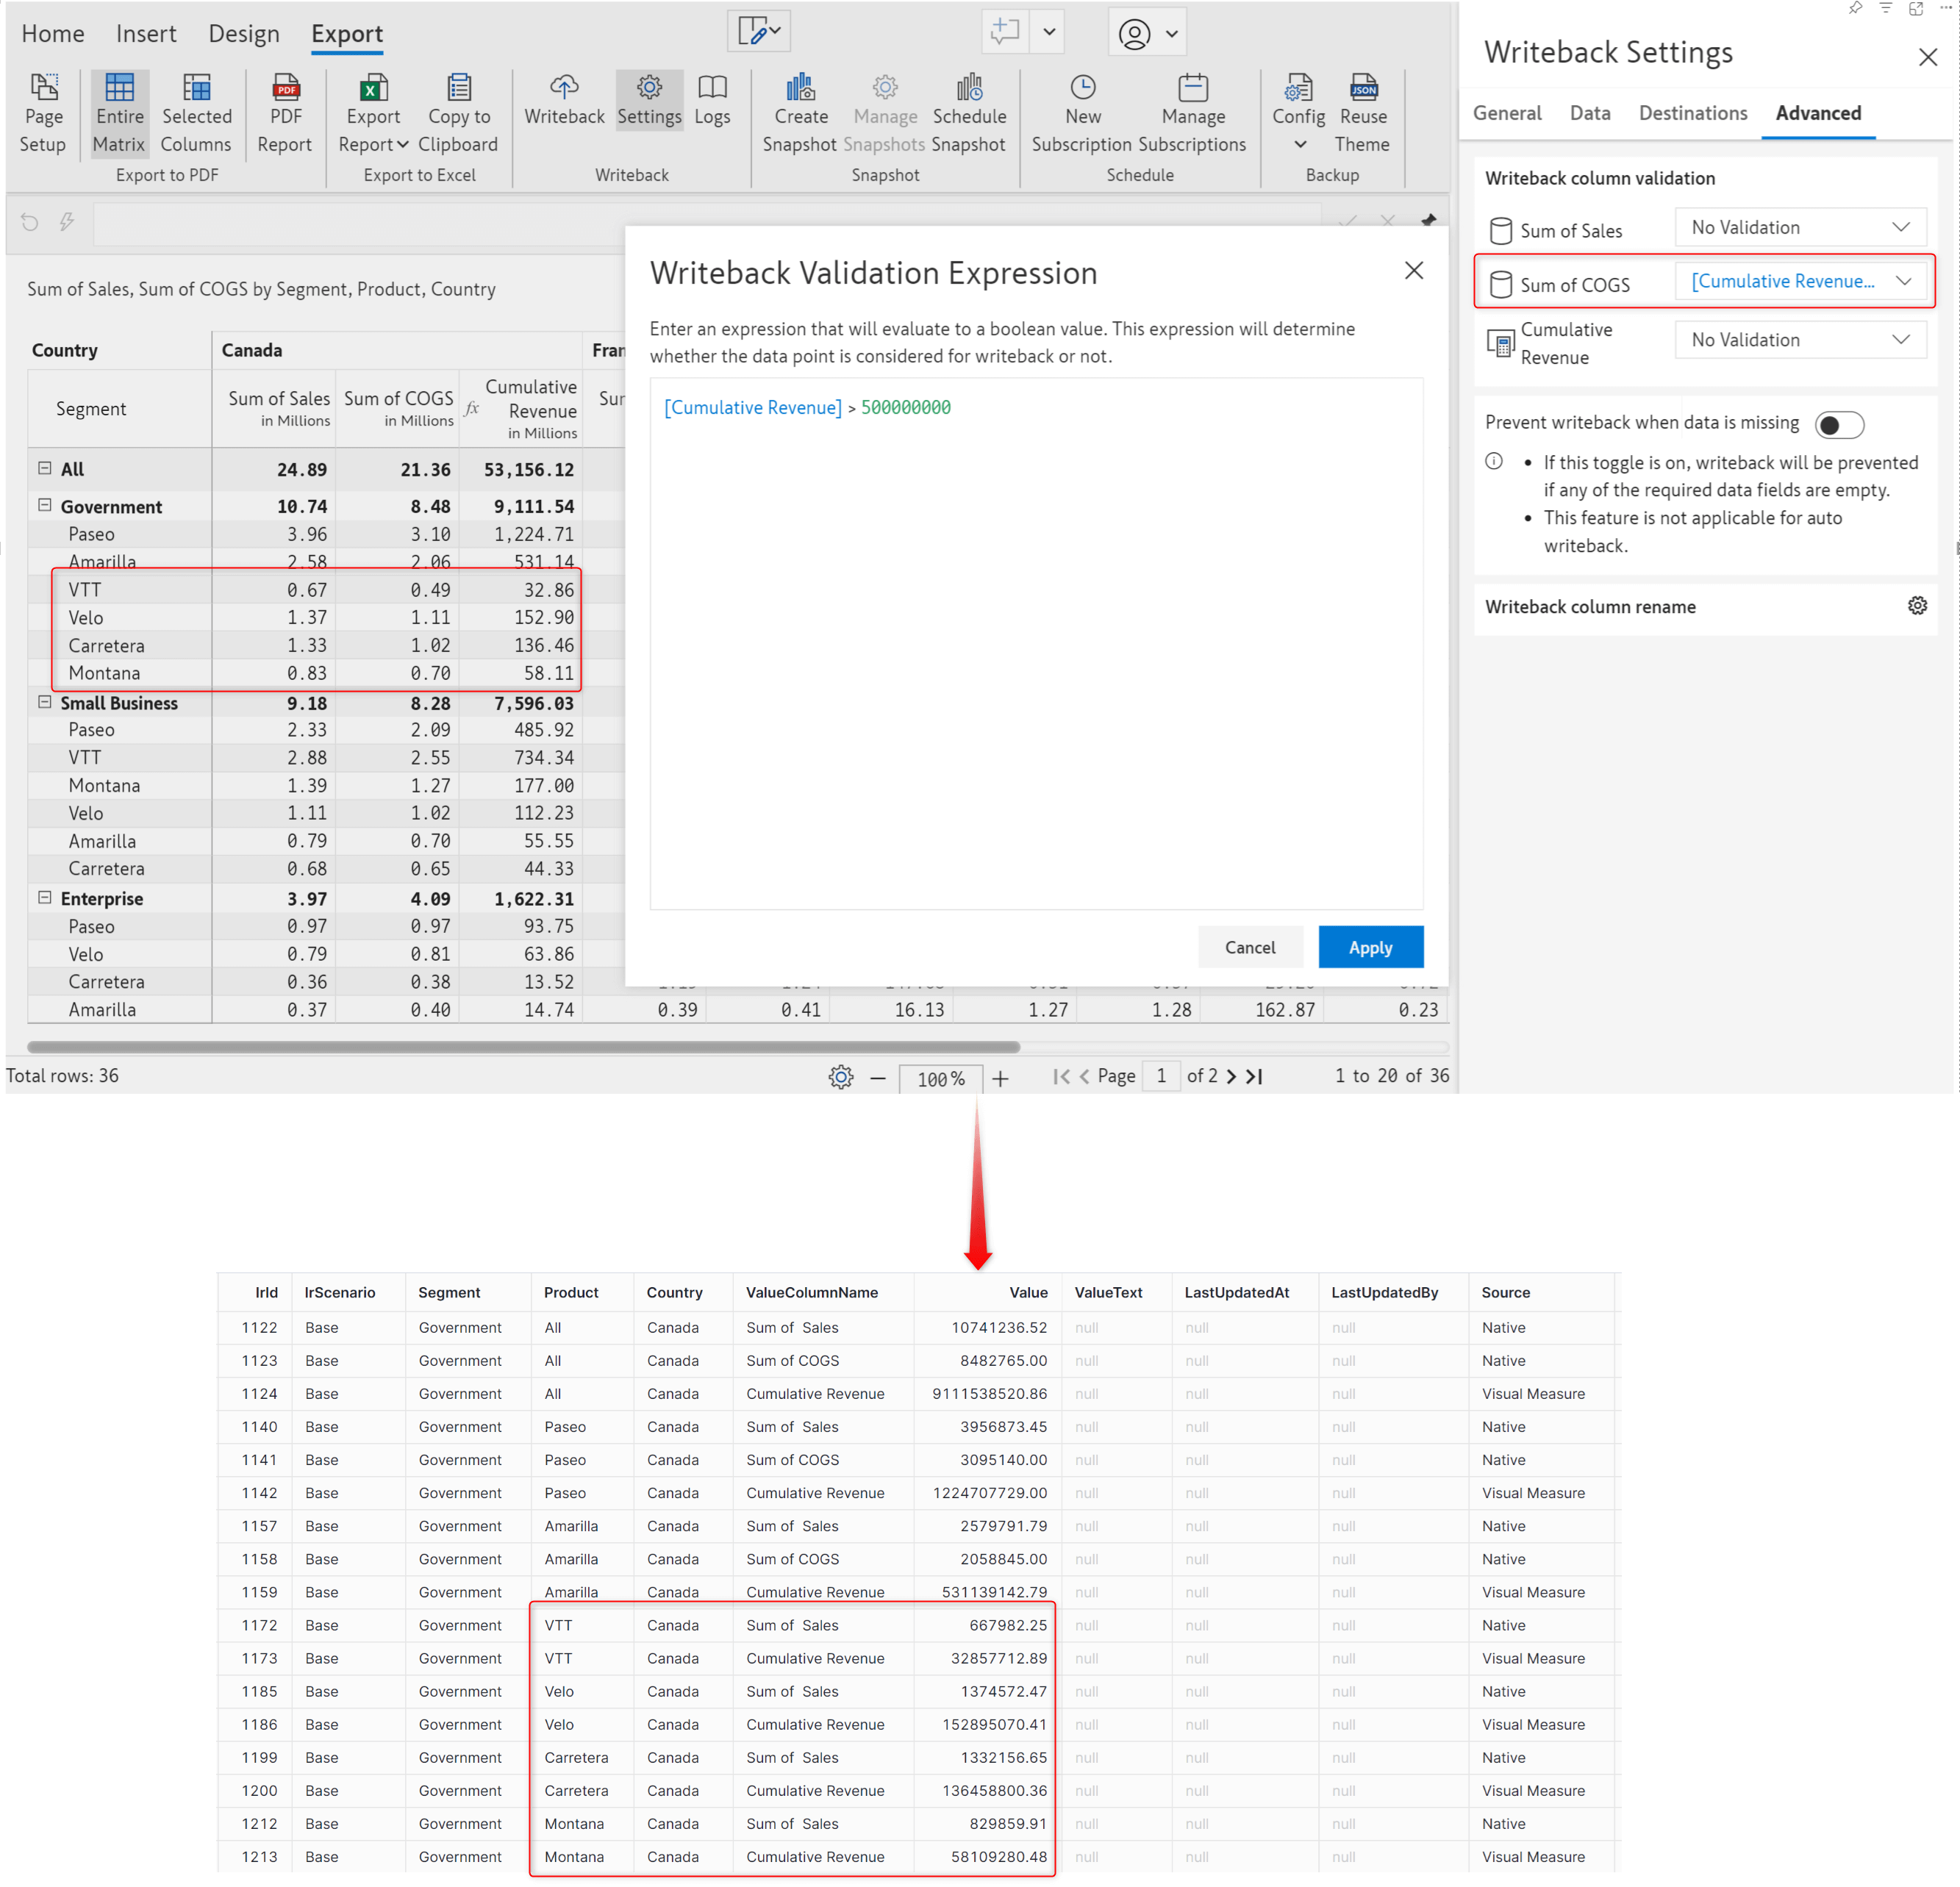
With this option, you can also apply cross-filters. Let's use the same validation rule, but this time in the ‘Sum of COGS’ measure field. The COGS cells that don't meet the cumulative revenue condition will not be written back.
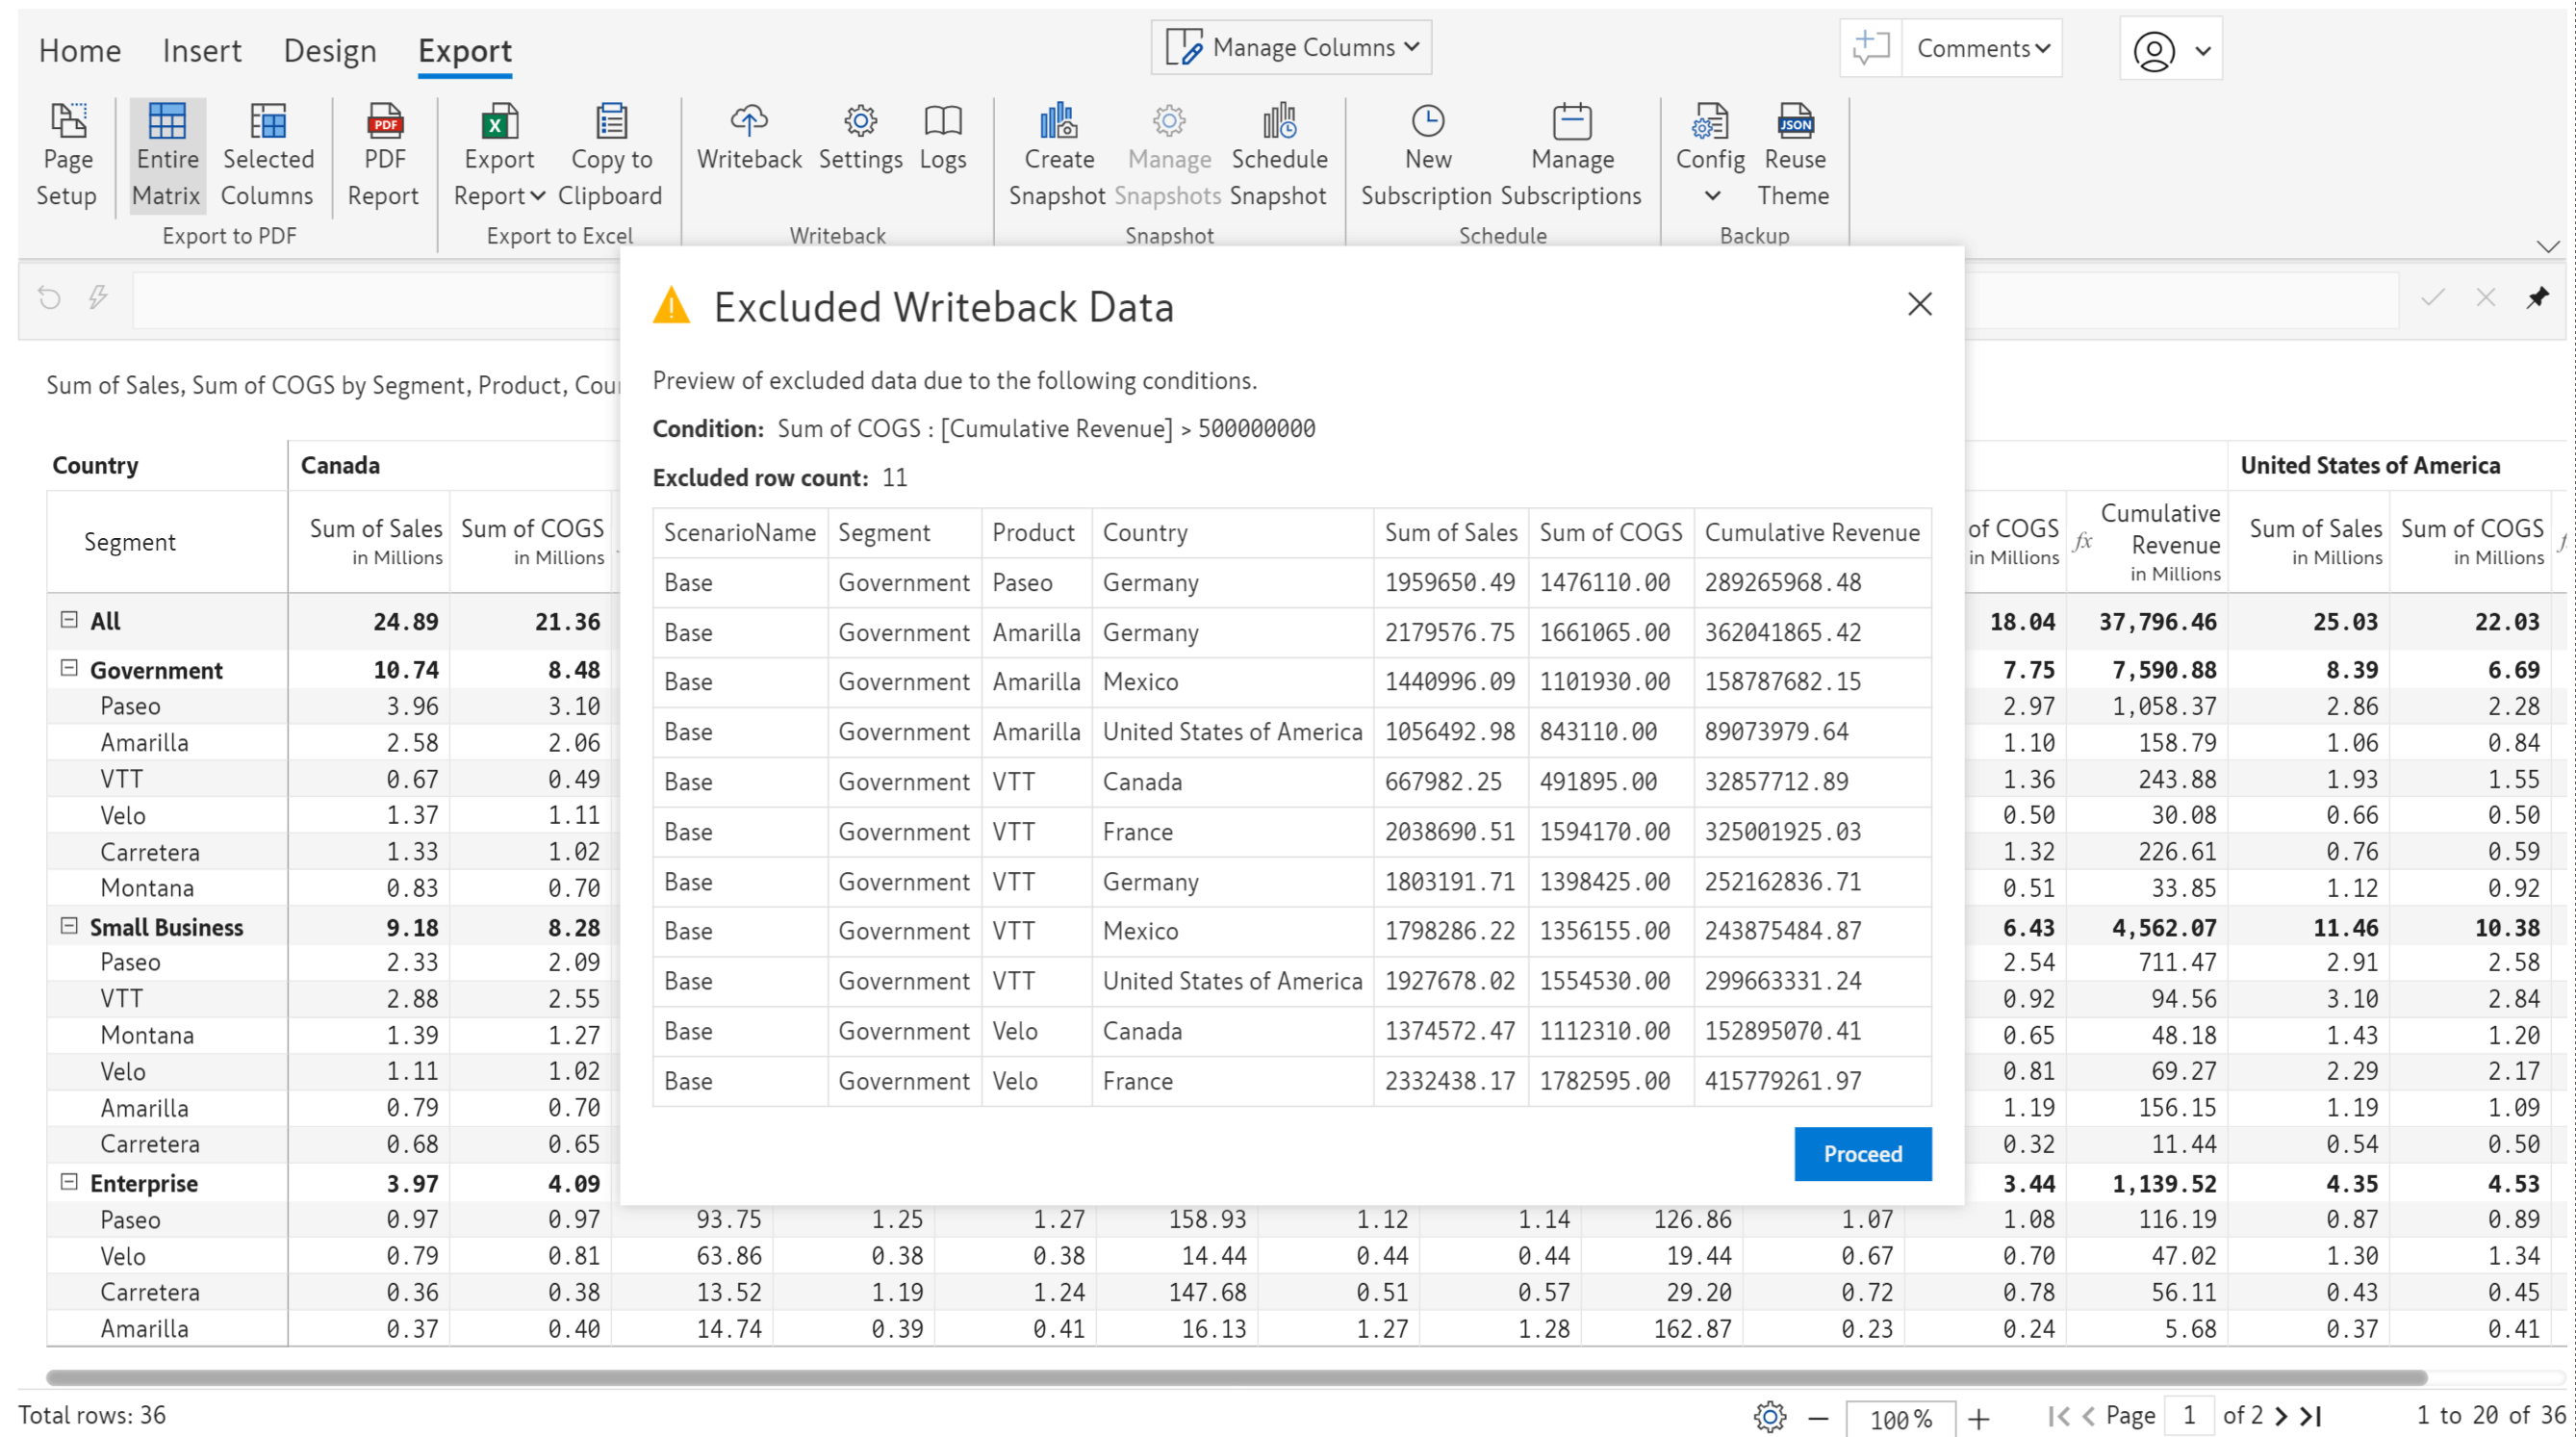
Whenever a writeback is triggered, Inforiver will display a preview of the excluded cells.
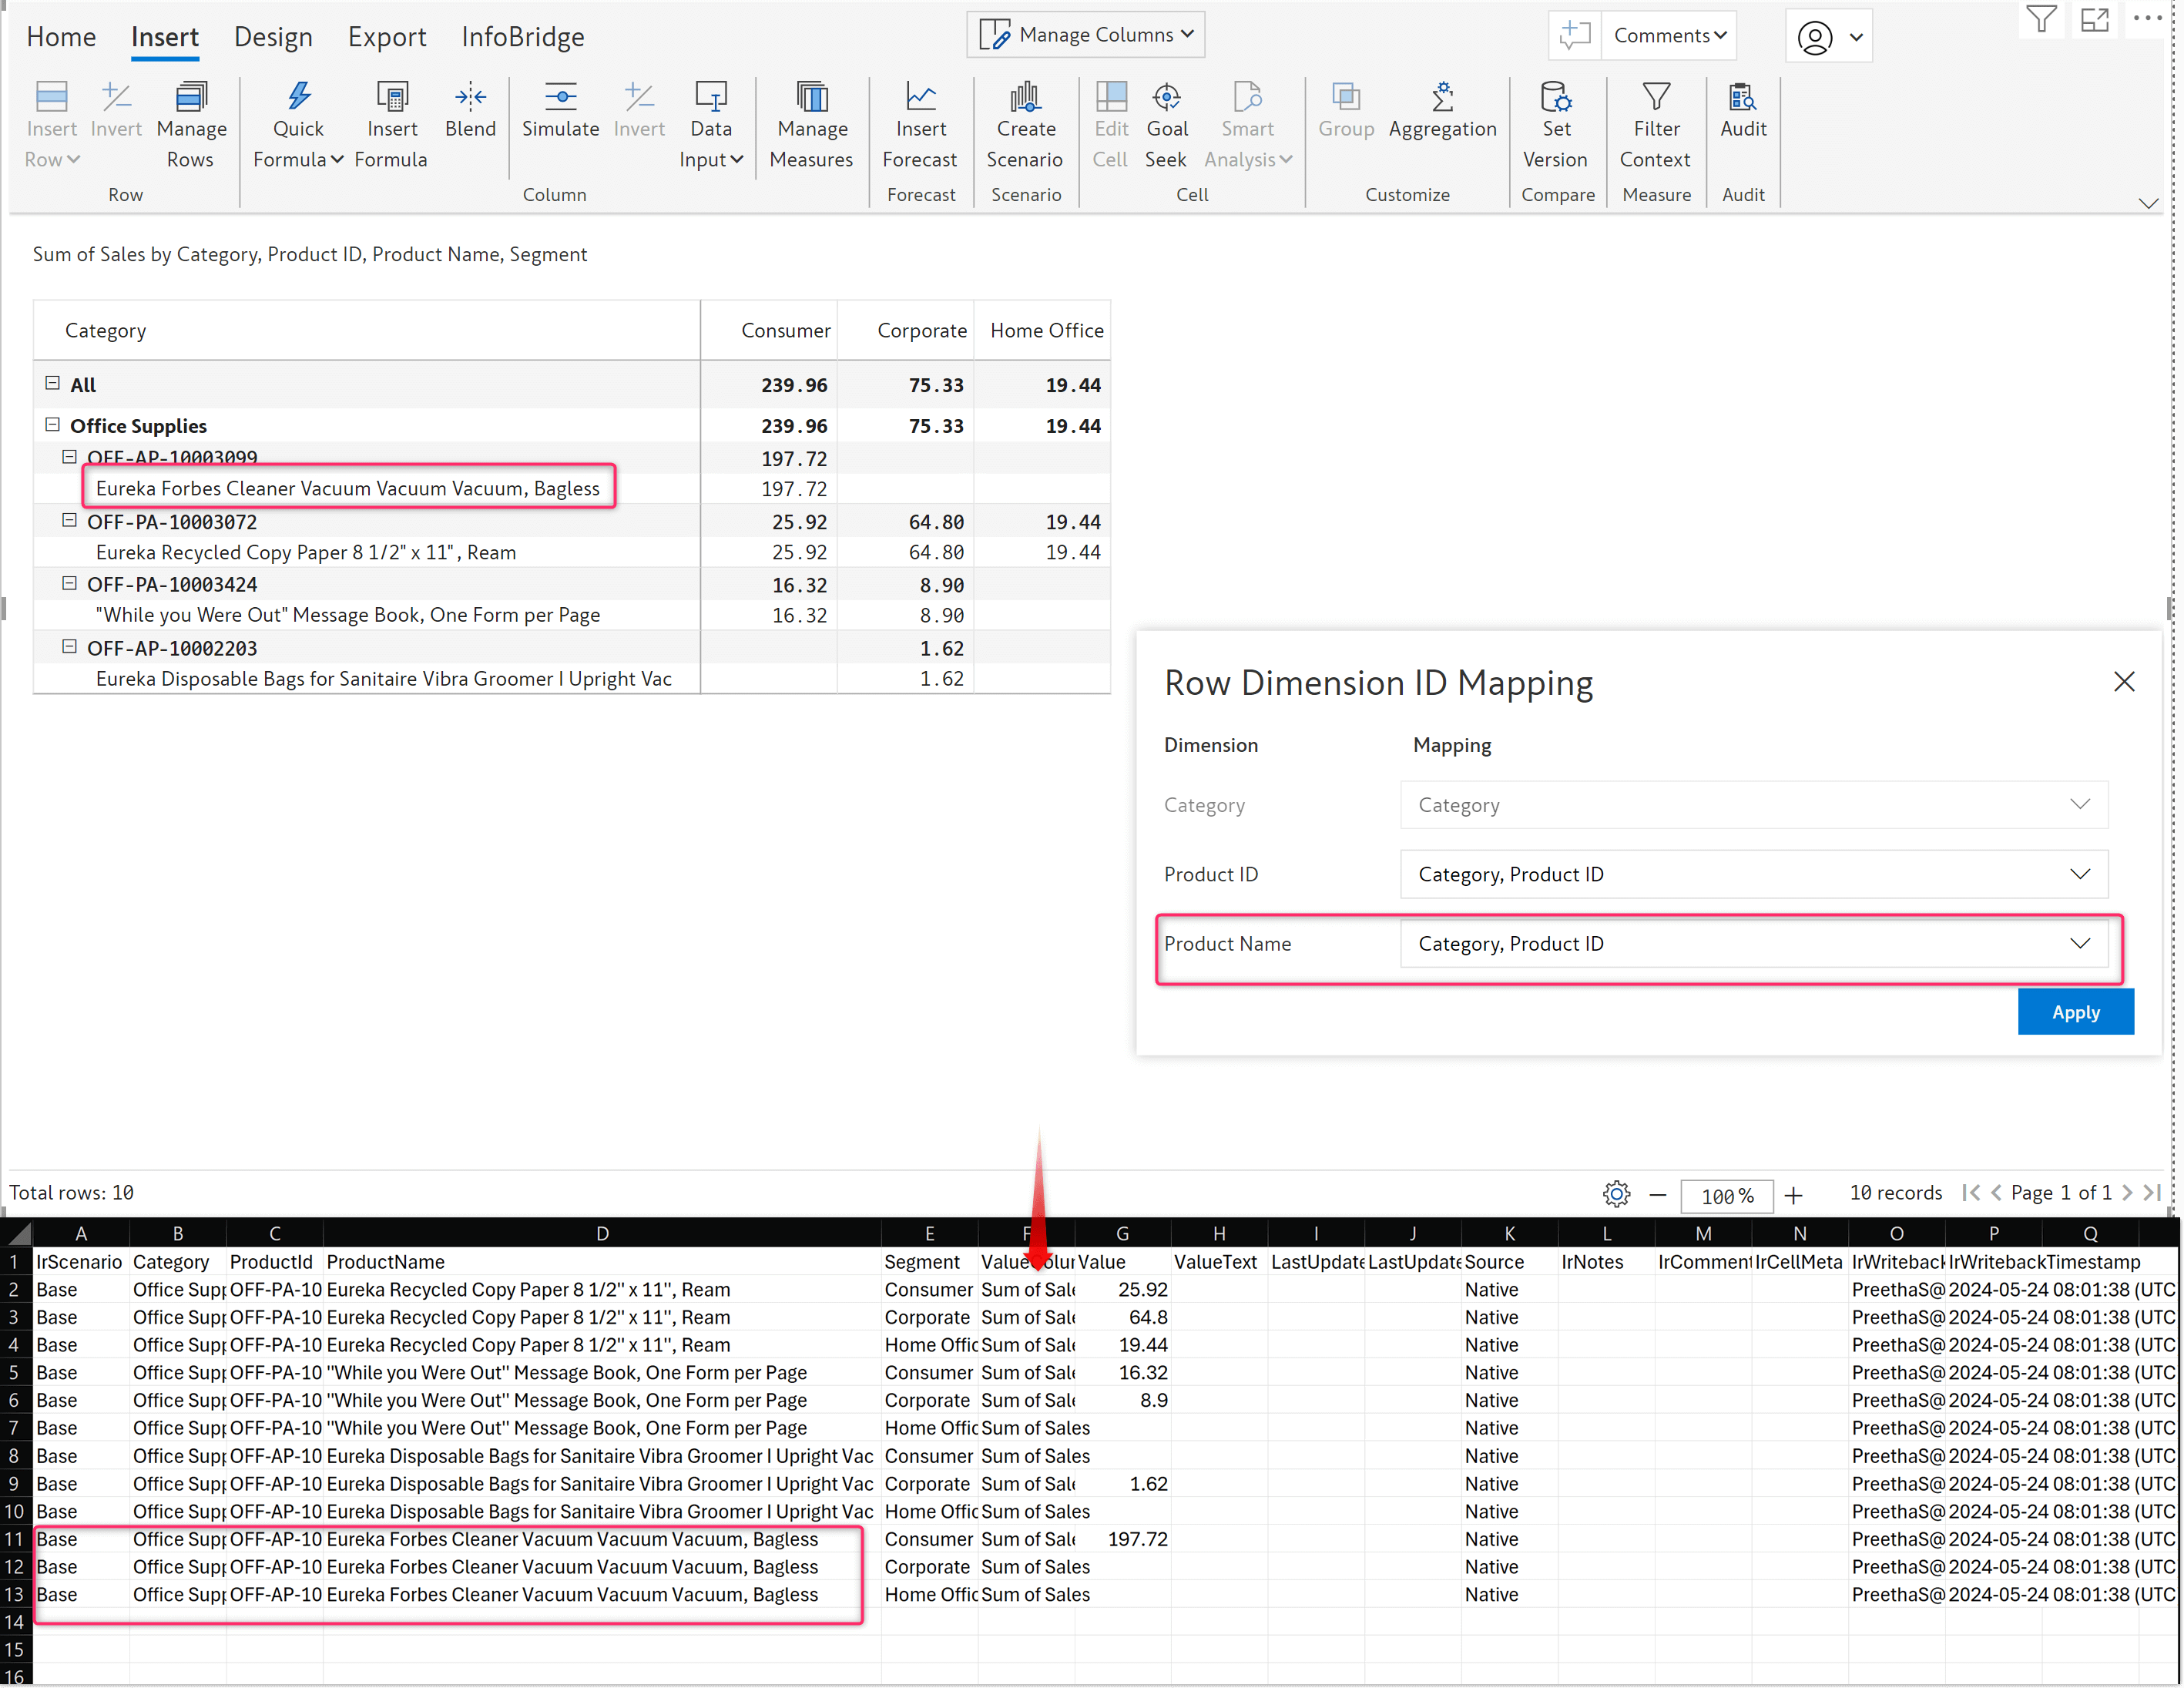
We introduced an option in the previous release, which lets users manually map the row dimensions with the required row IDs that are constant. Based on the mapped row IDs, the associated visual formatting, data changes, notes, comments, etc., are also captured in the writeback data promptly, as seen below.
The report below shows the default mapping, followed by the results of the writeback data.
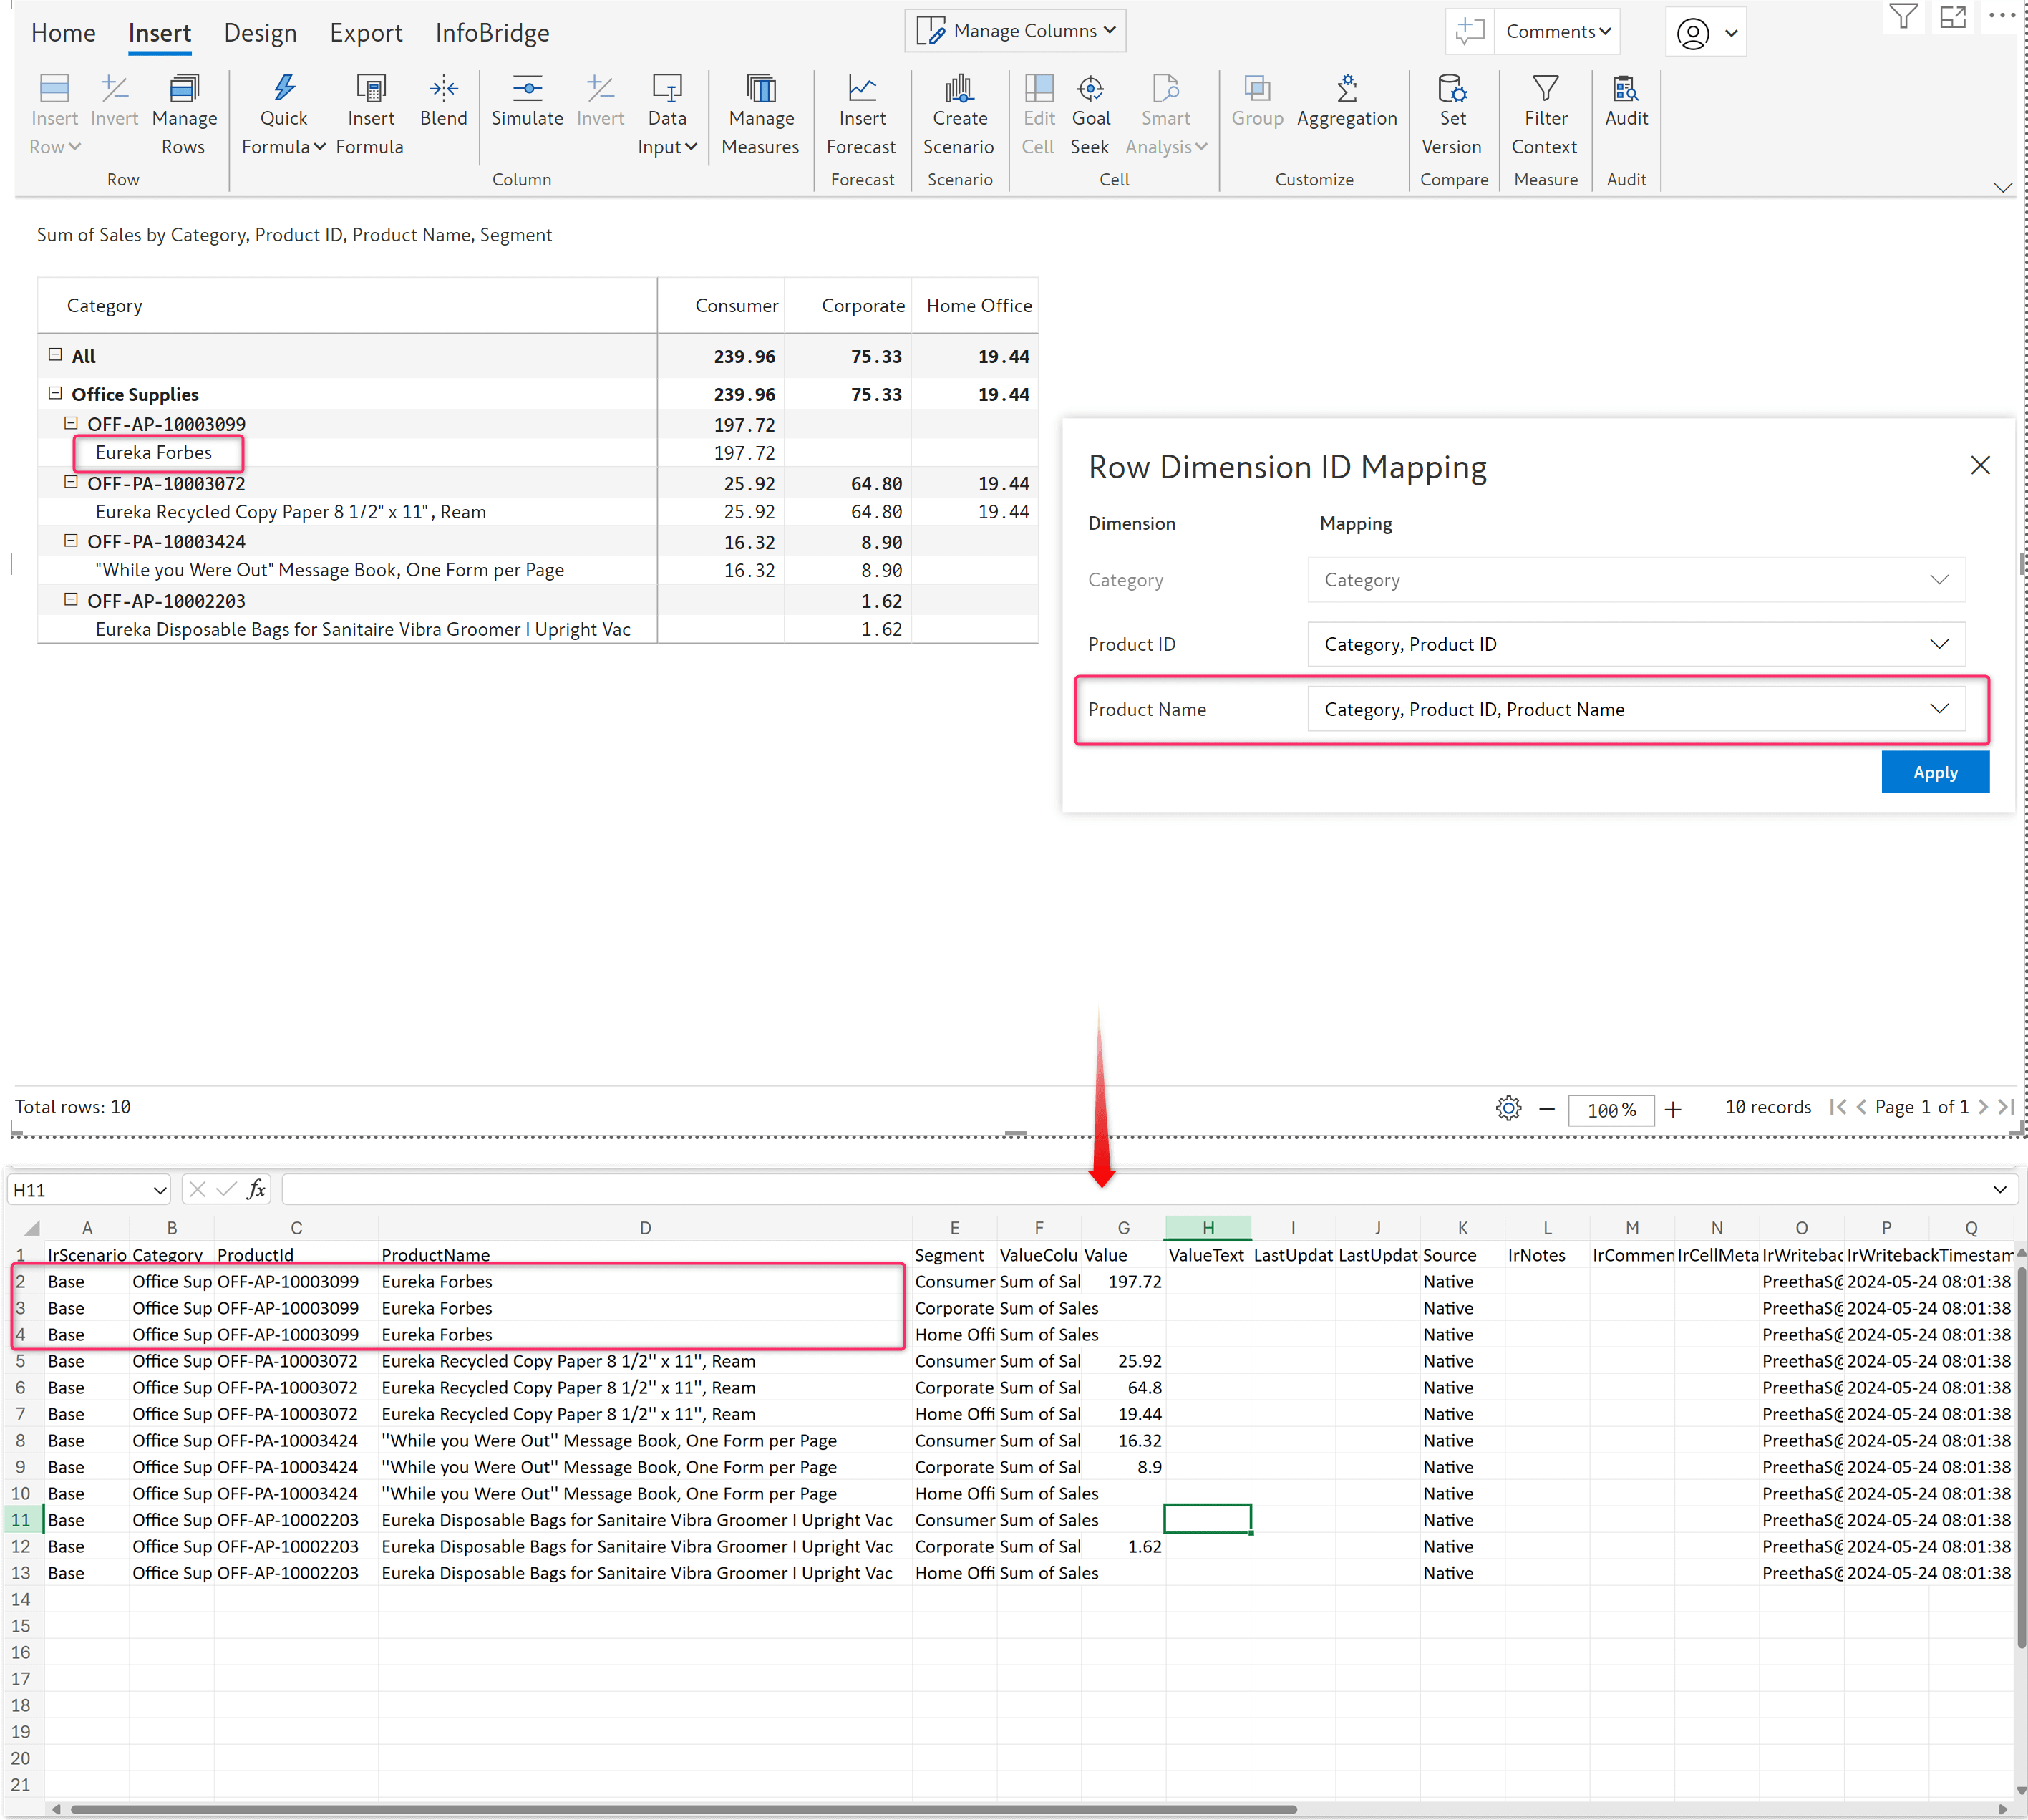
After manually mapping the row dimension to a constant ID like the Product ID, any changes made in the report are also effectively captured in the writeback. In the image below, you can see the updated records in the writeback results.
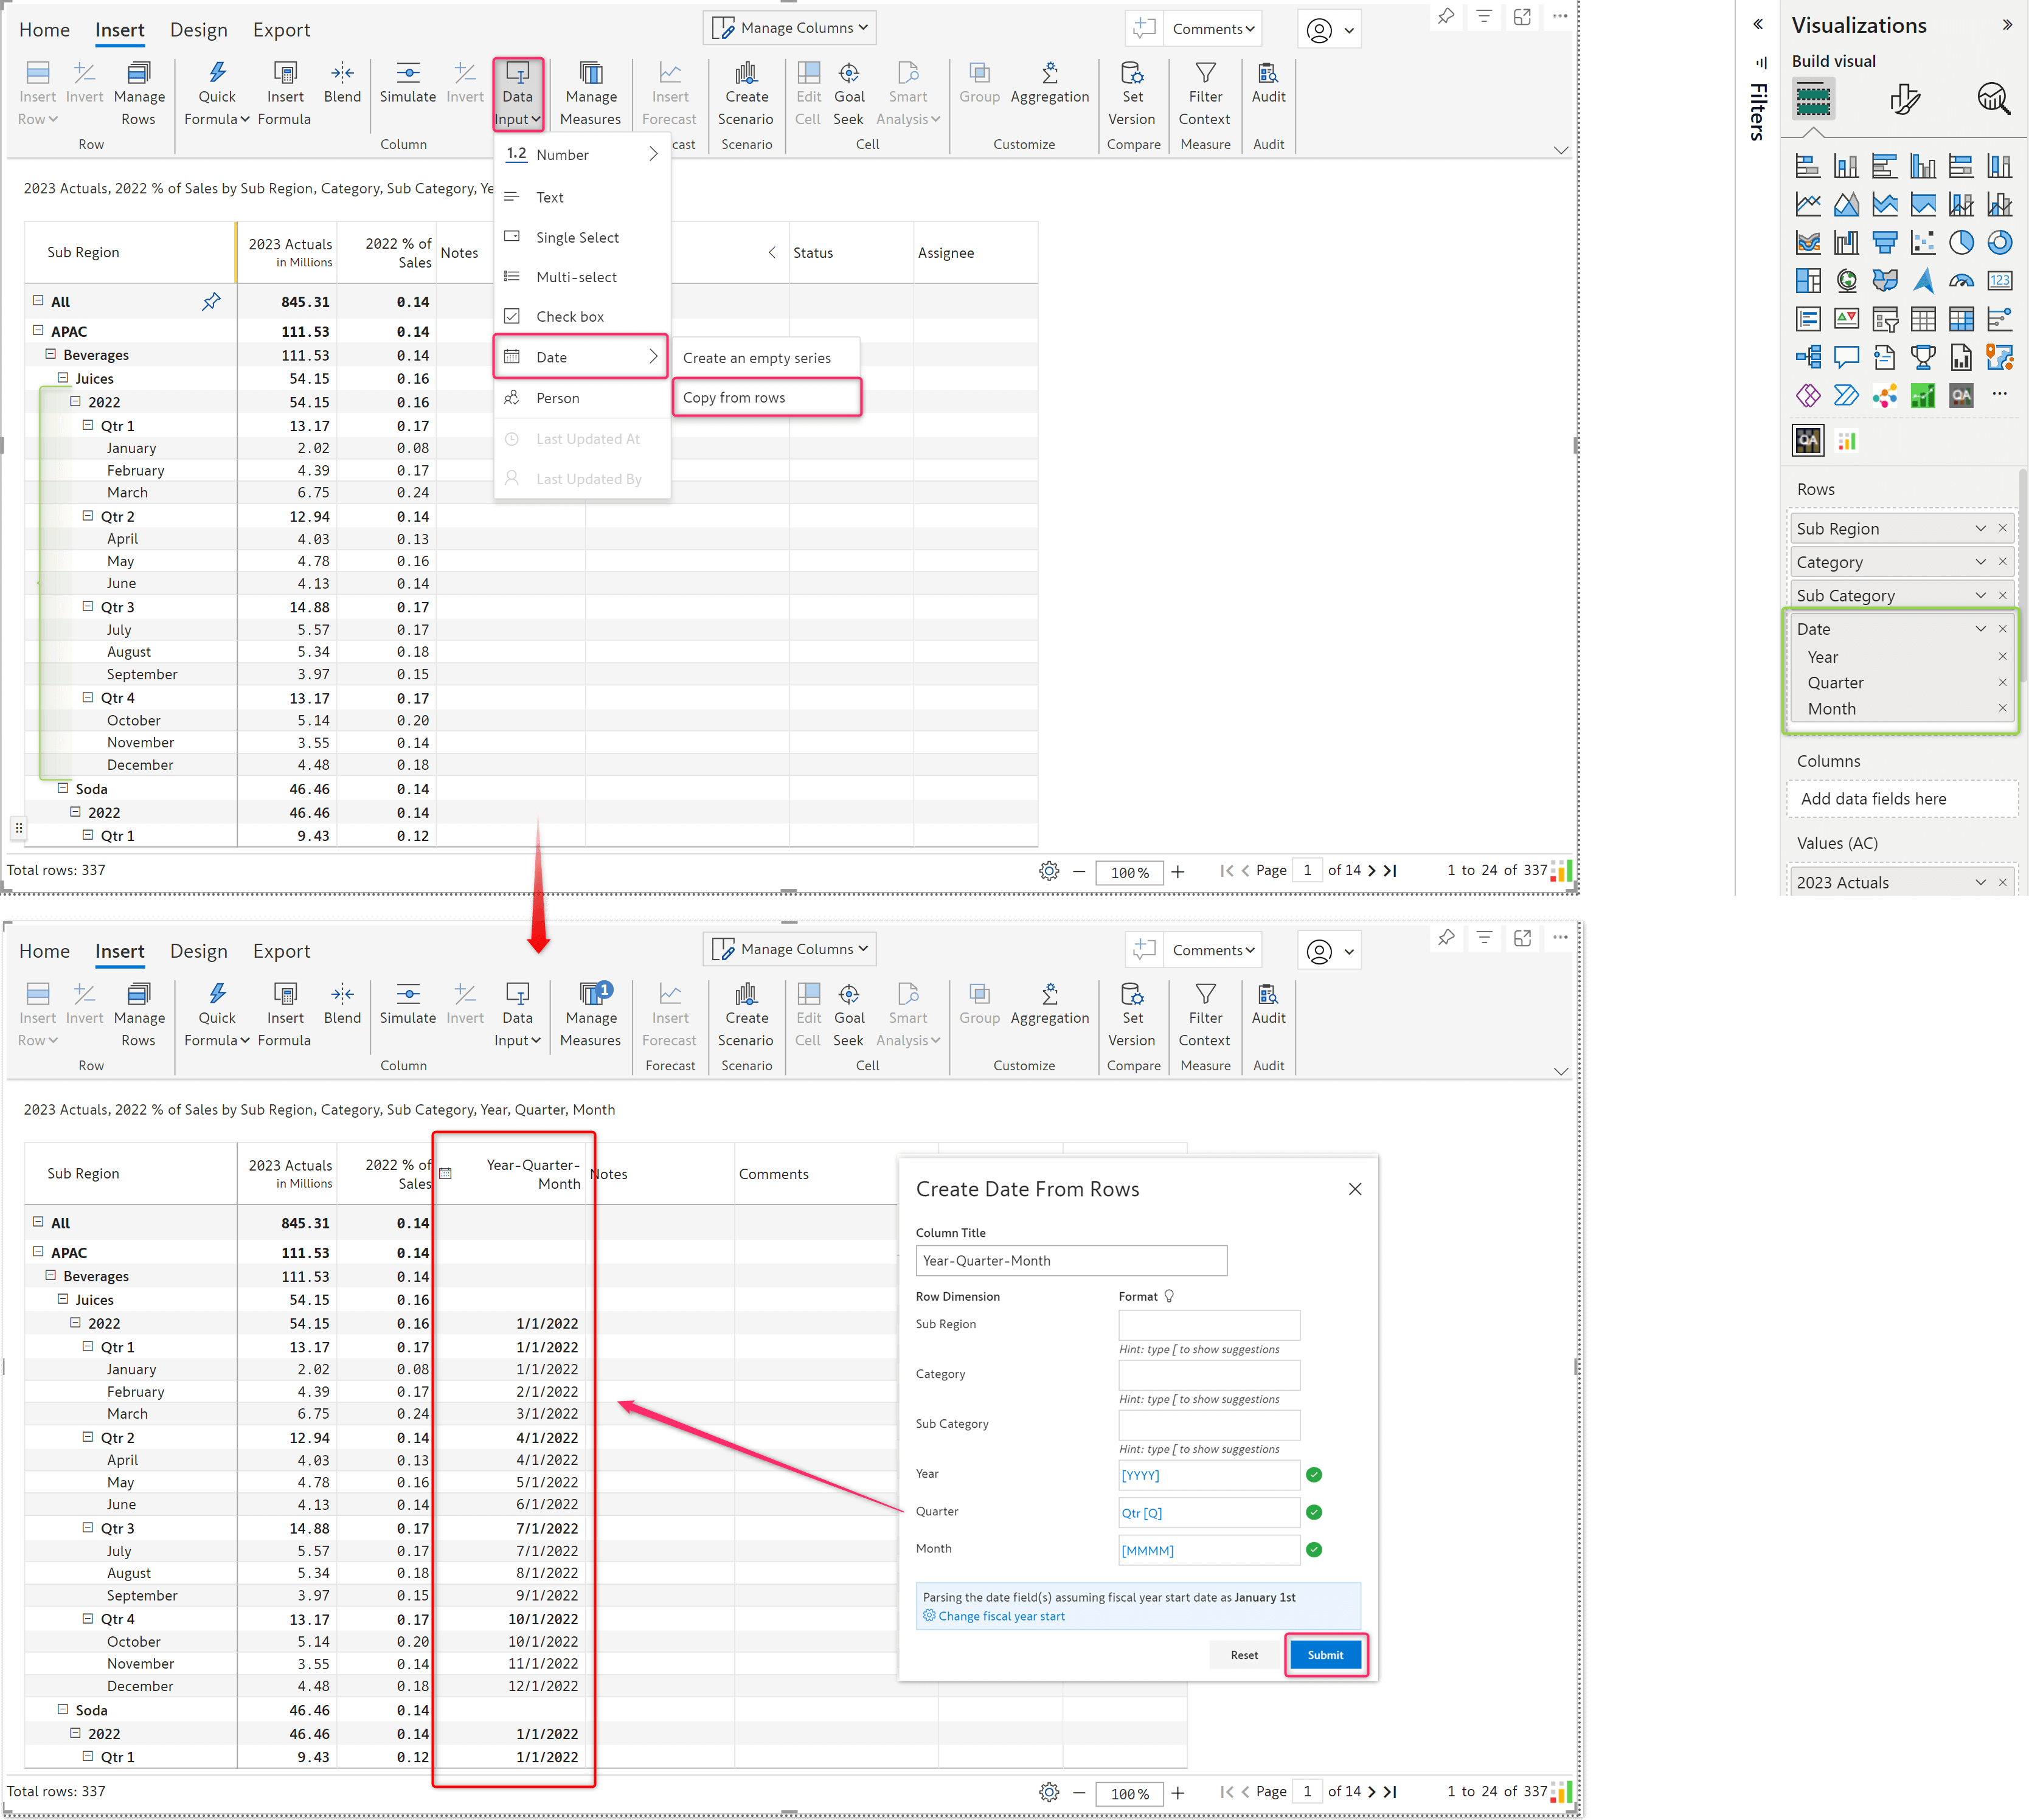
Inforiver lets you add a date input-dropdown column in your report, with which you can enter a date for each record. Let’s say your report has a list of calendar dates in the row dimension, and you want to replicate the same dates in an input column; instead of manually entering it for each record, you can use the ‘copy from rows’ option now available in the Data Input → Date menu.
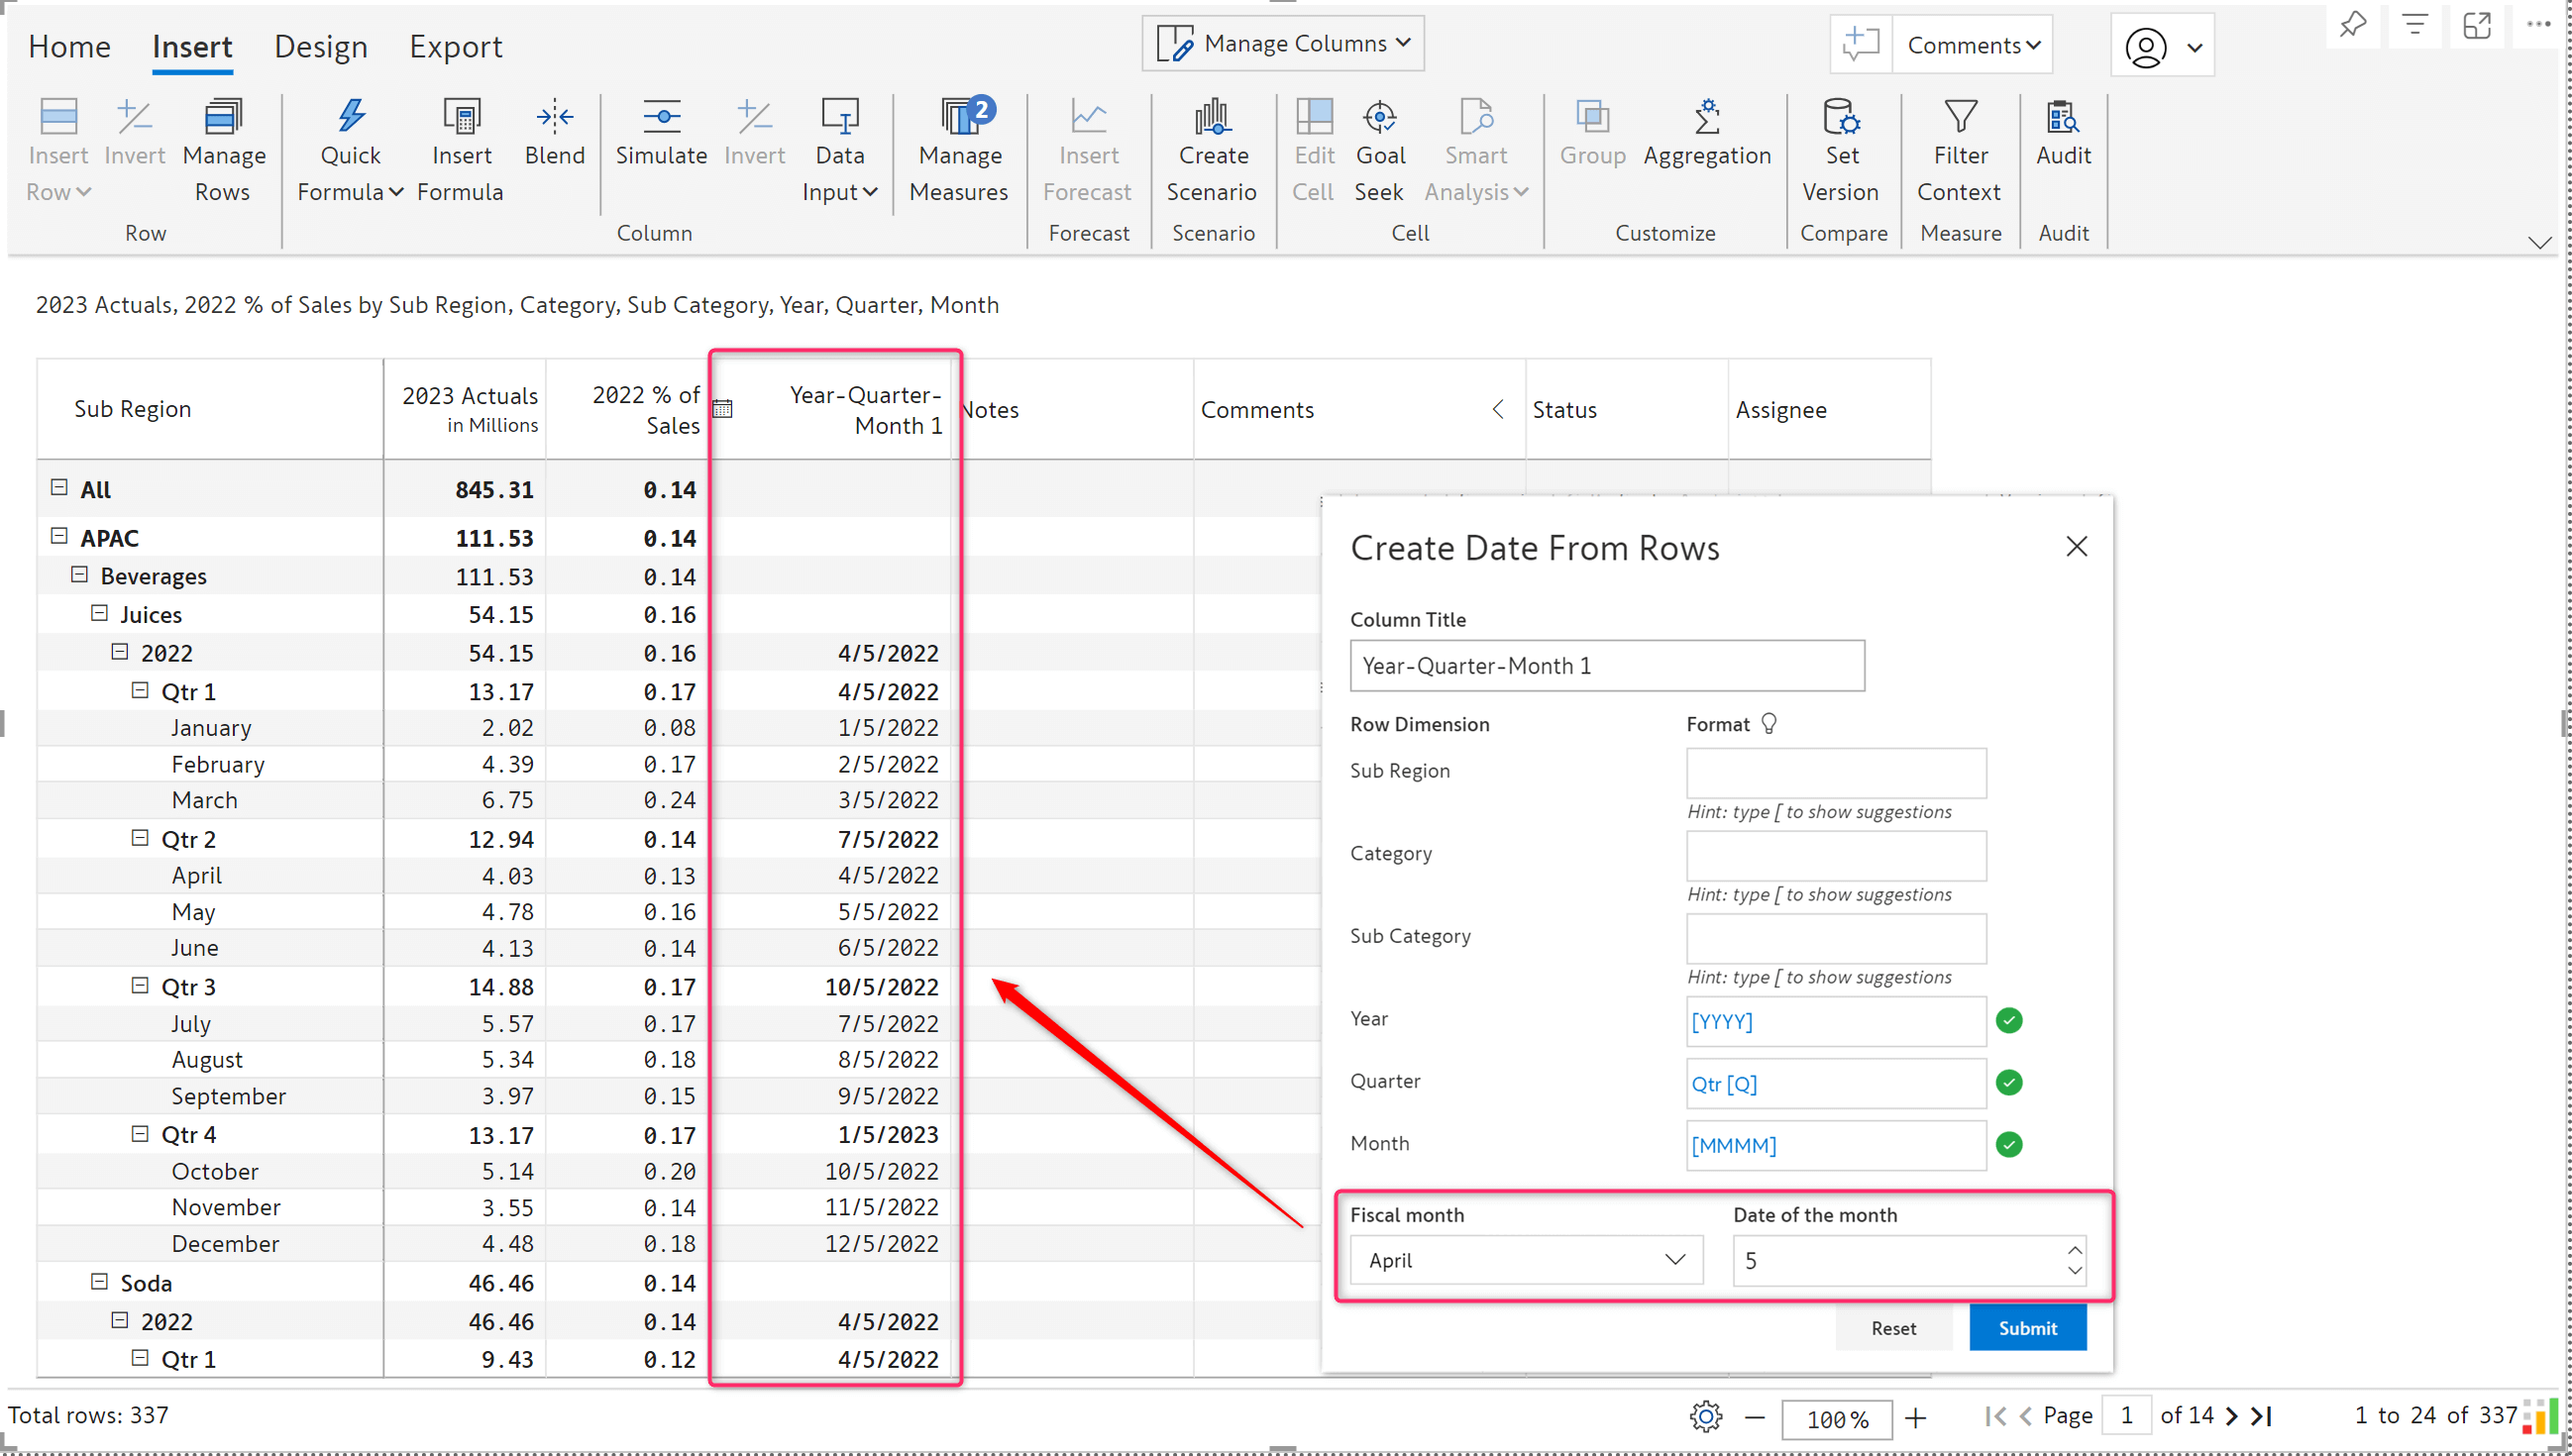
You also have the option to select the start of the fiscal year while copying the dates. In the below image, you can see the fiscal year is set to start from the 5th of April.
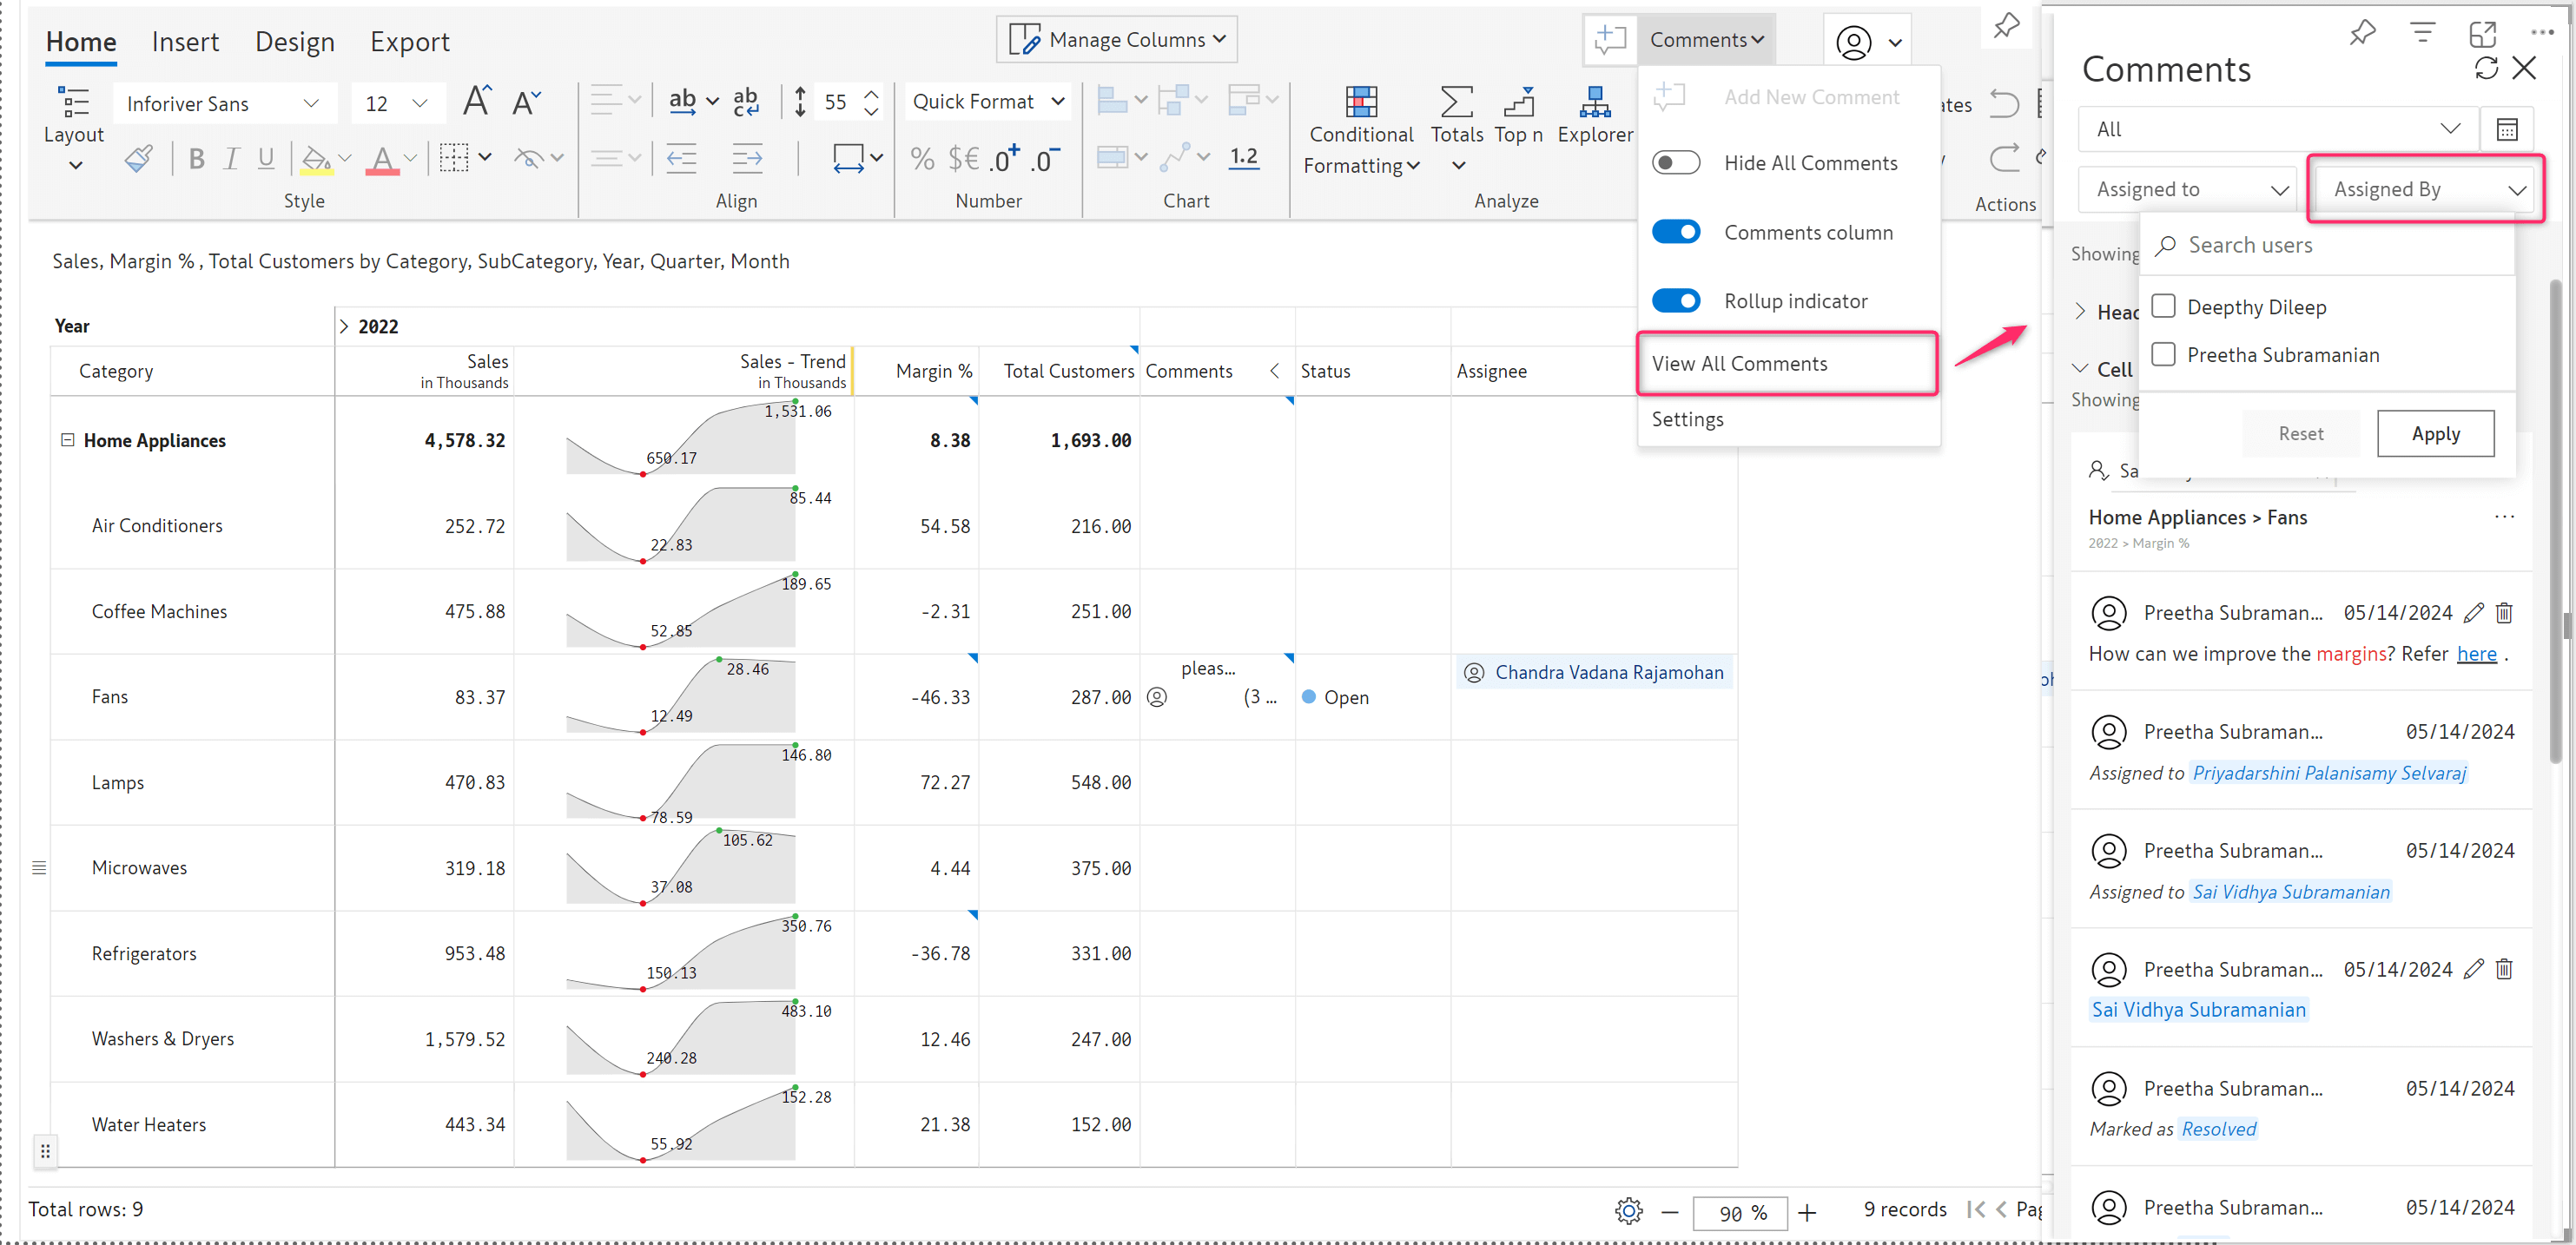
Inforiver’s commenting capability enables you to assign tasks to stakeholders and track their status to closure. The existing ‘Assigned to’ filter helps you filter tasks based on the assigned users. Now, we have also included the 'Assigned By' filter, with which you can filter the tasks based on who assigned them. This helps in tracking the tasks efficiently when multiple stakeholders are involved.
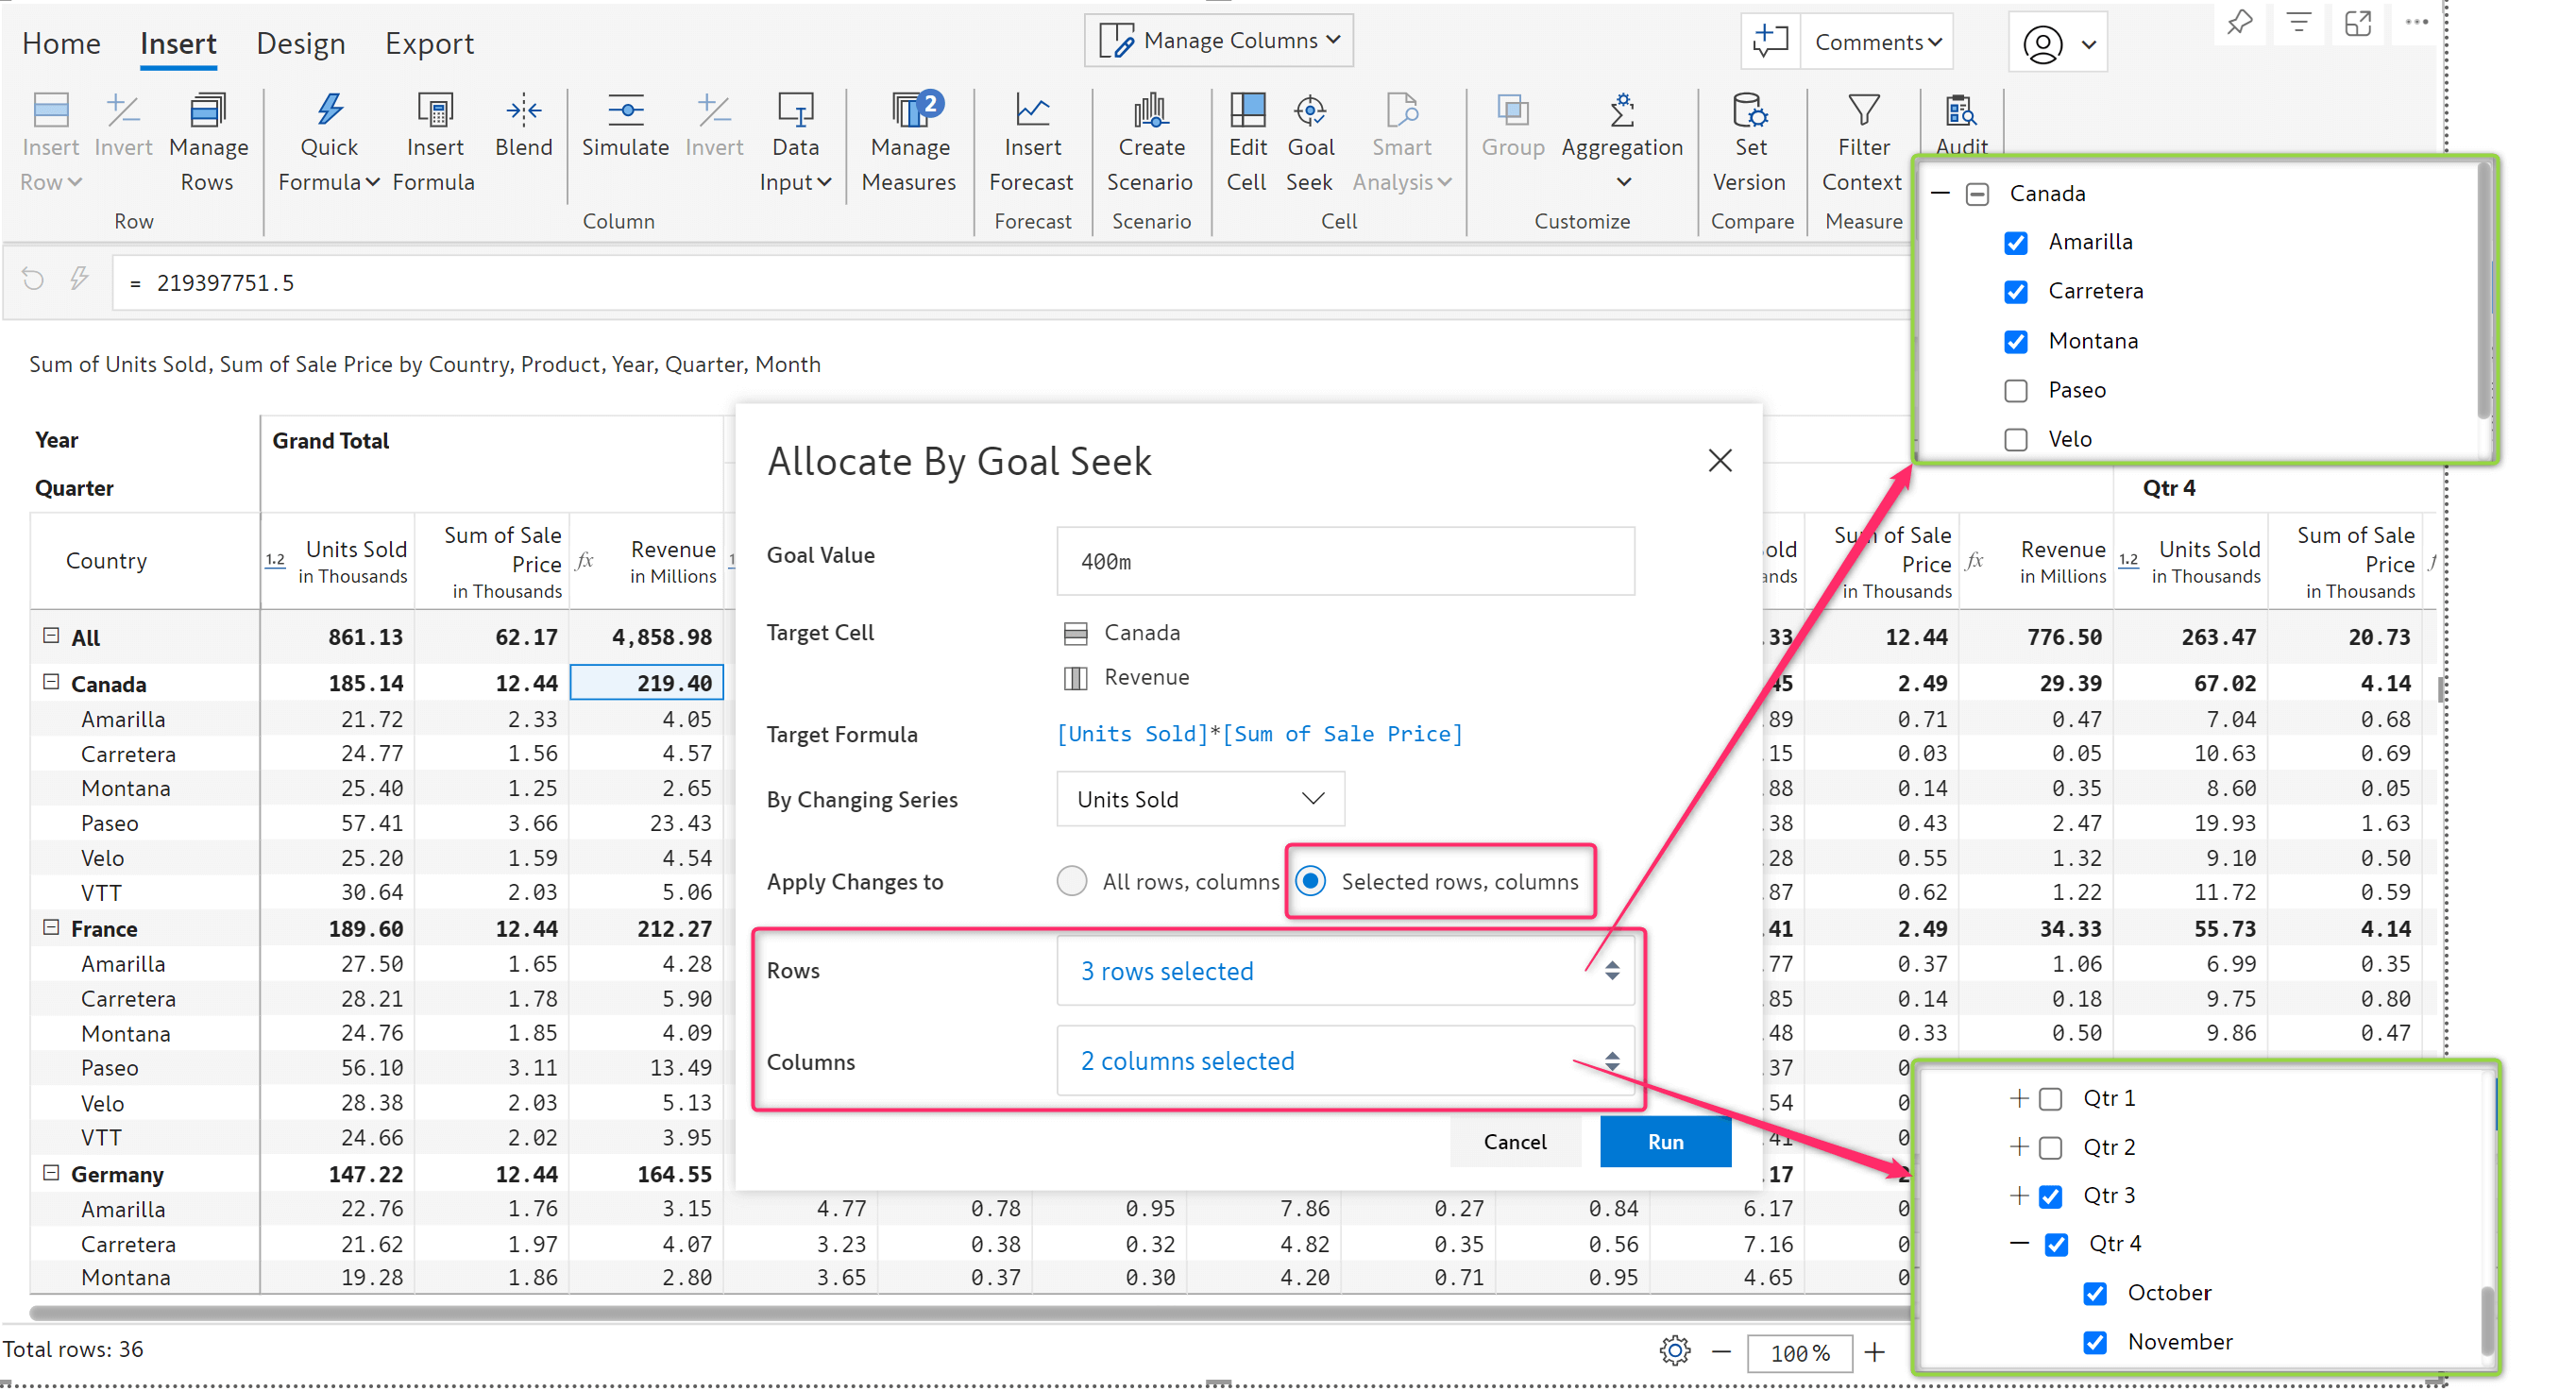
Previously, all input rows and columns were affected by default when a goal seek was performed. Now, you can choose which rows and column measures should be changed to meet the desired goal value.
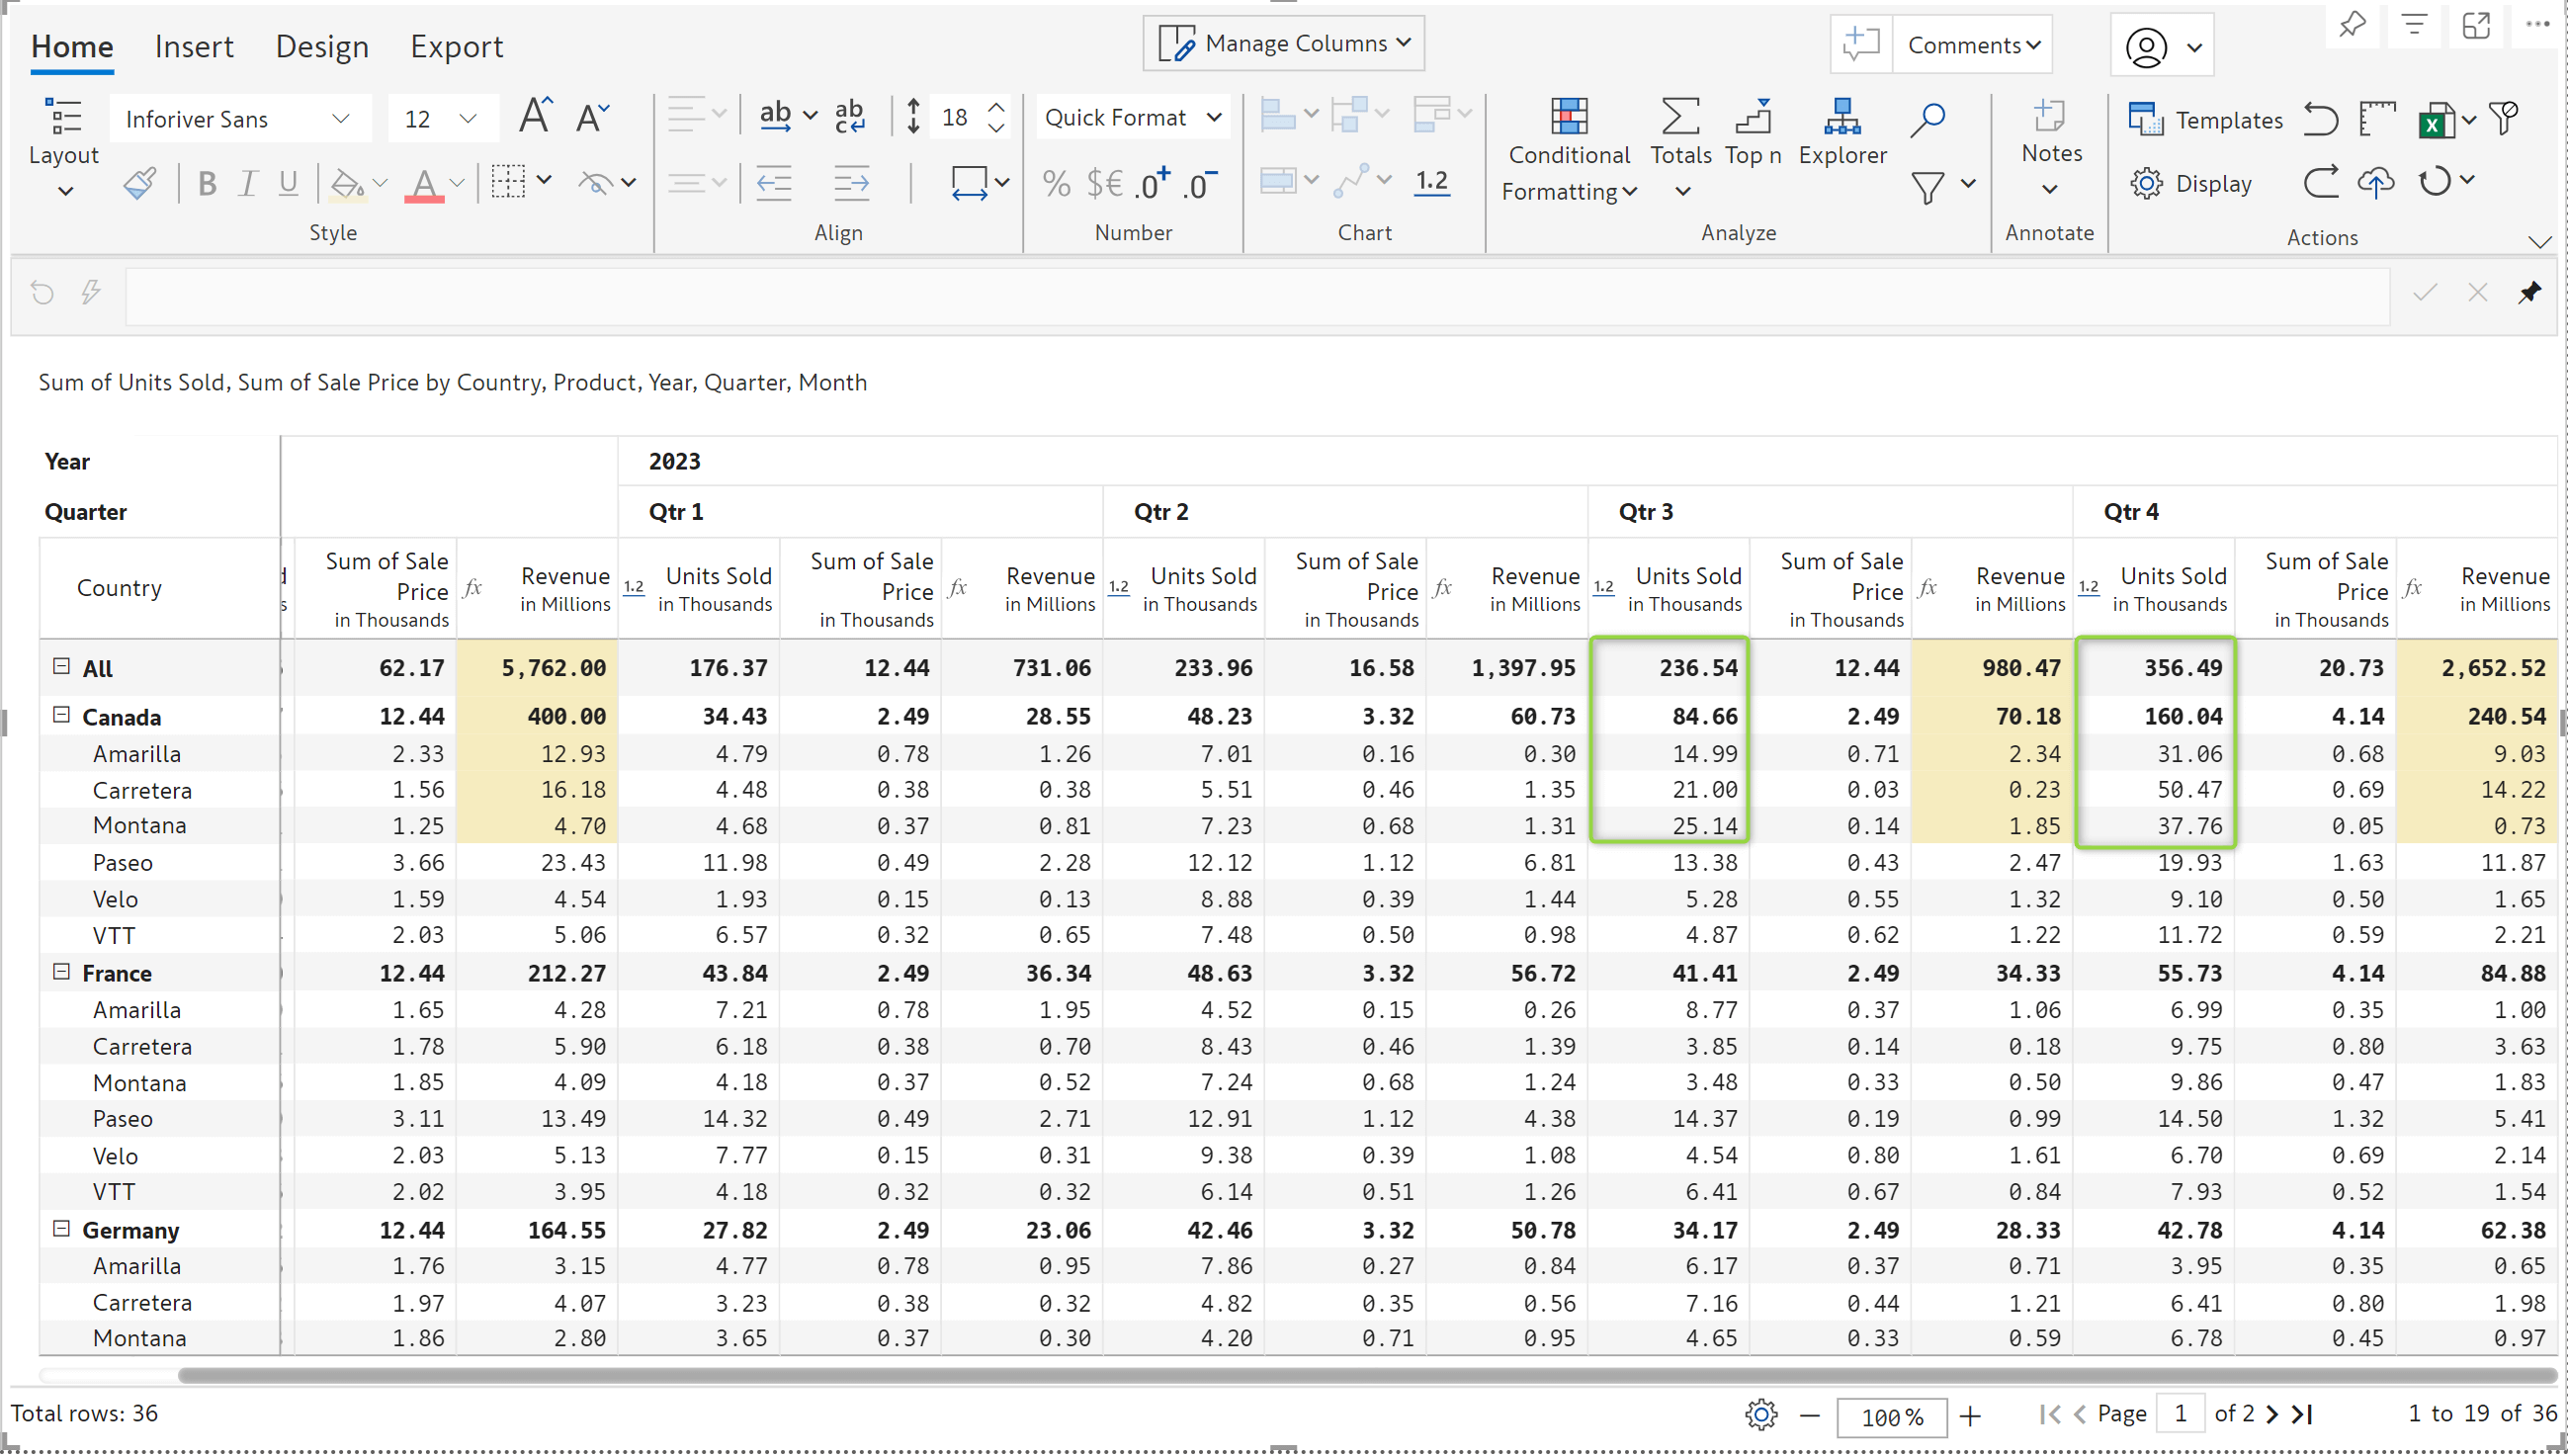
The results are shown below. Only the selected rows and column values are changed while others remain unaffected.
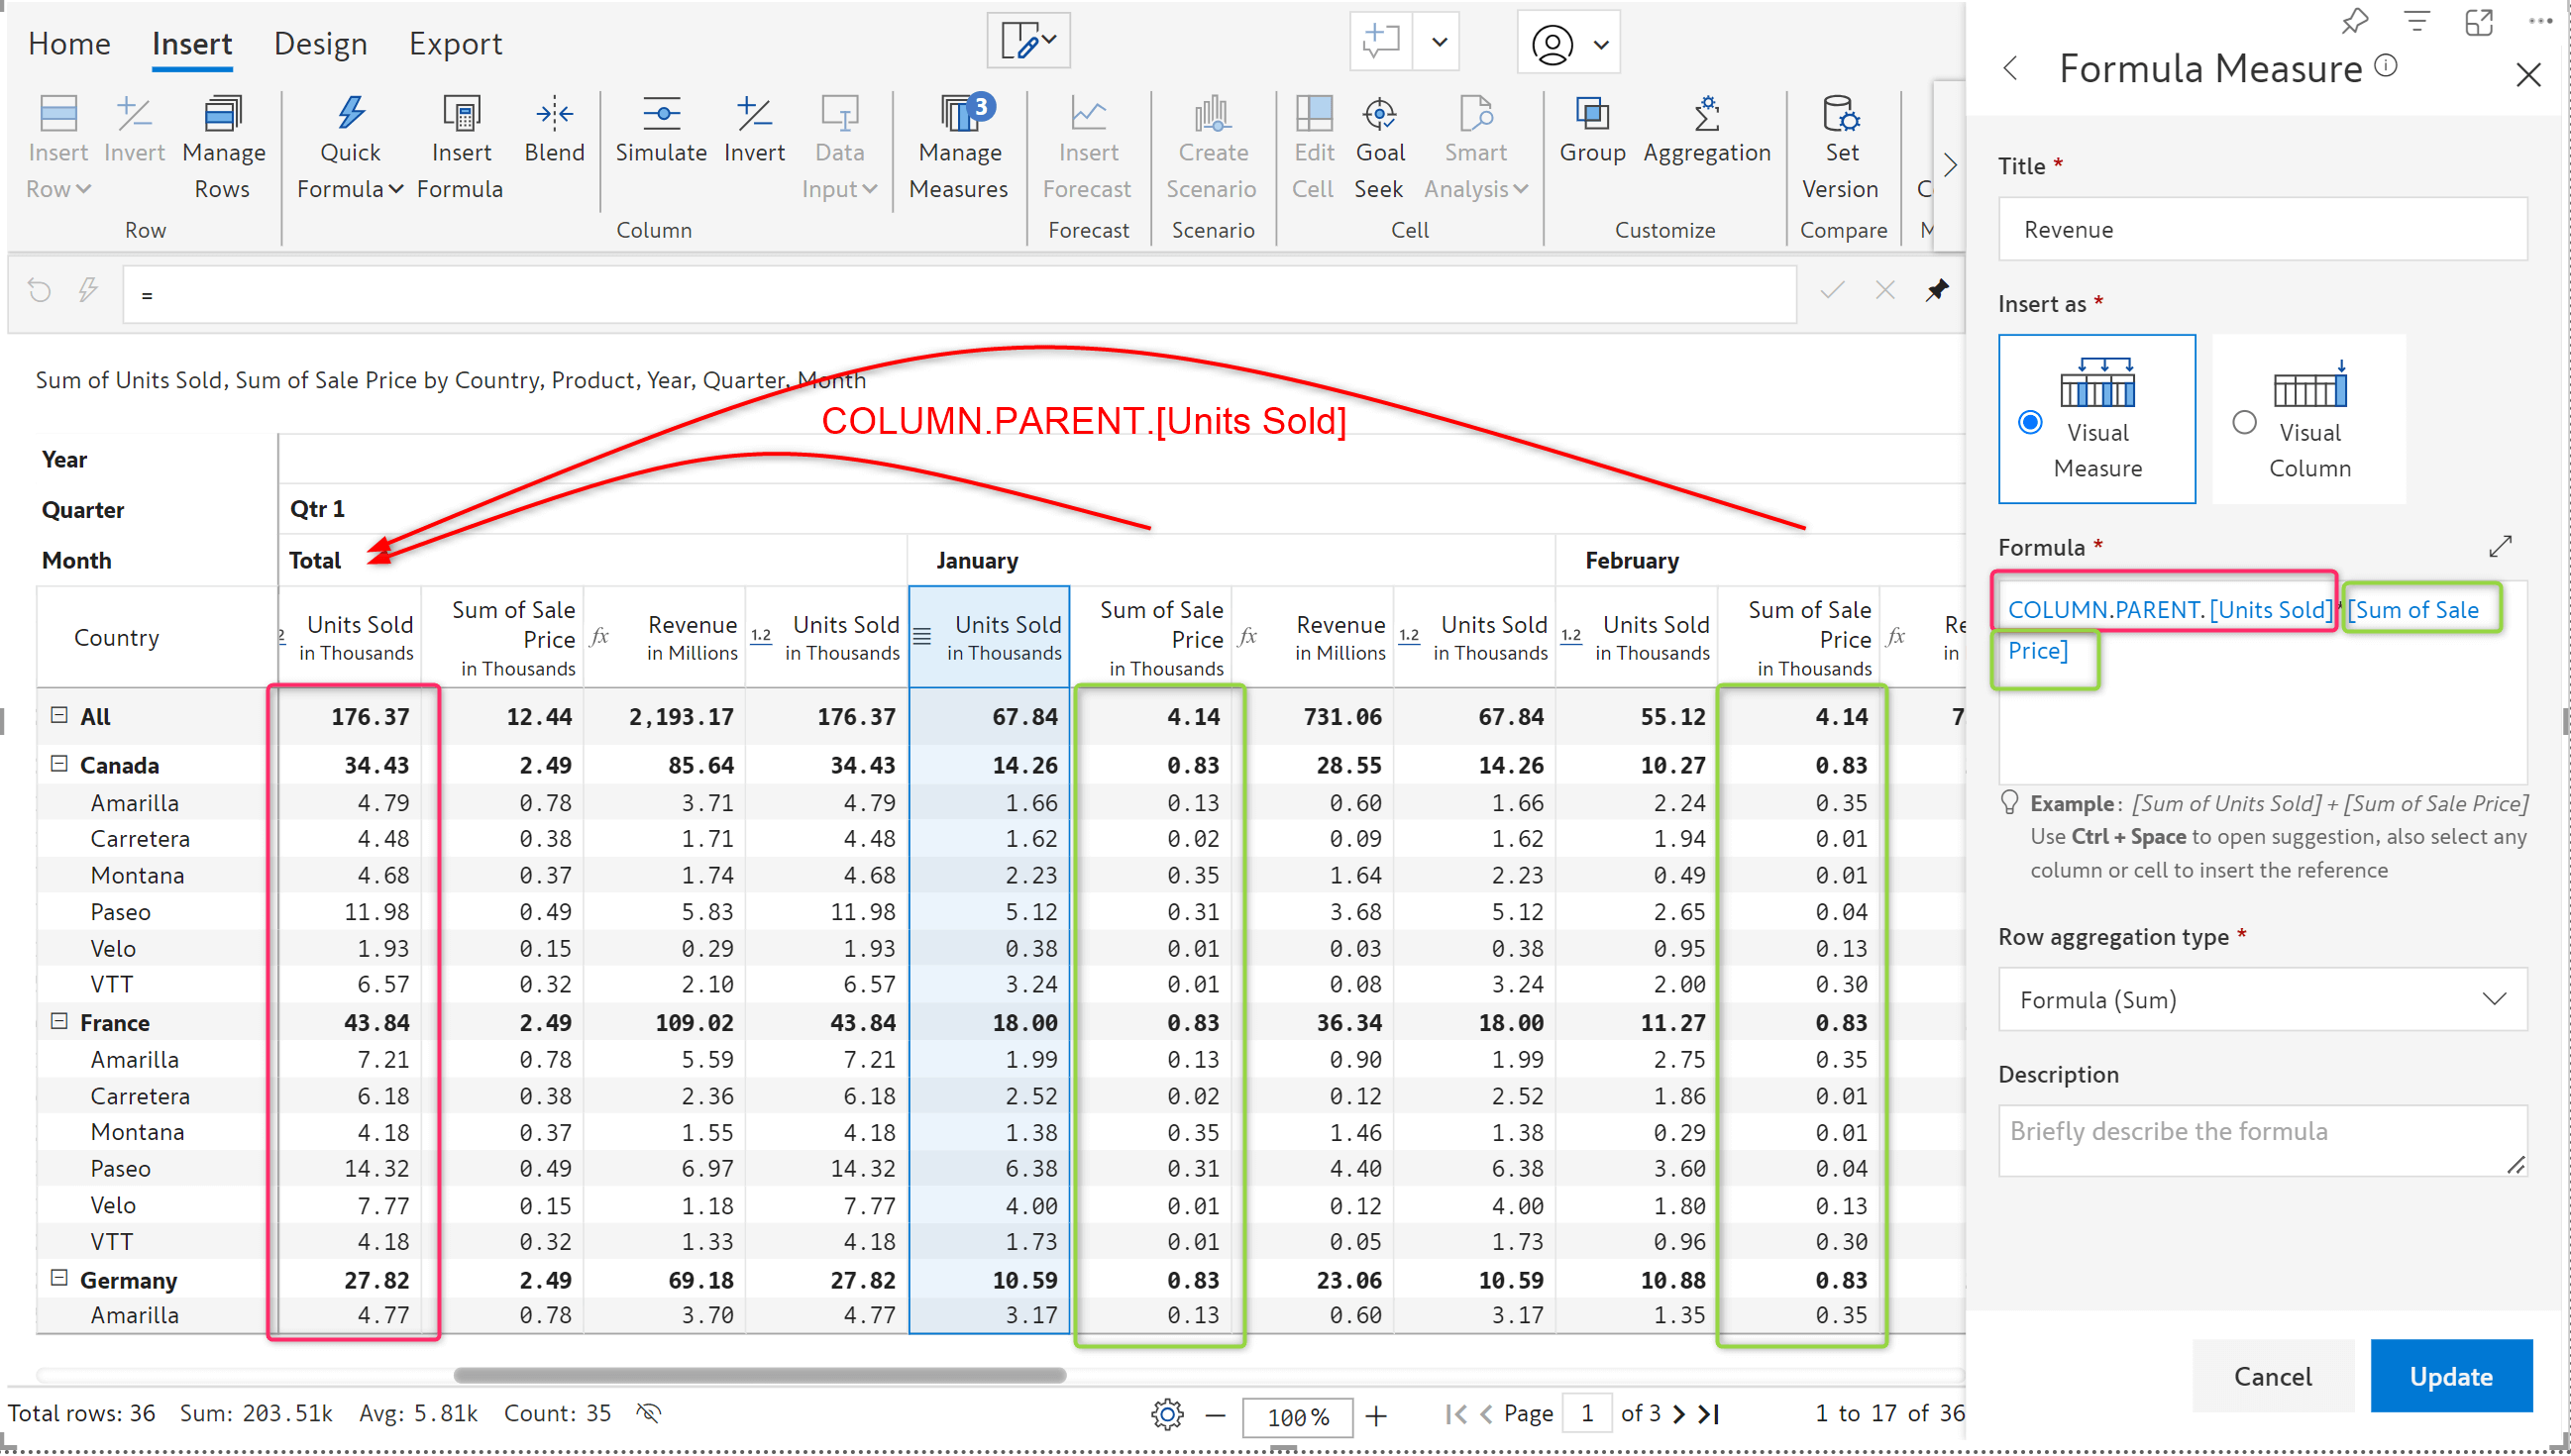
We now support column referencing functions such as, COLUMN.PARENT, COLUMN.TOTAL, etc. in formula measures for SUM and Formula (SUM) aggregation types.
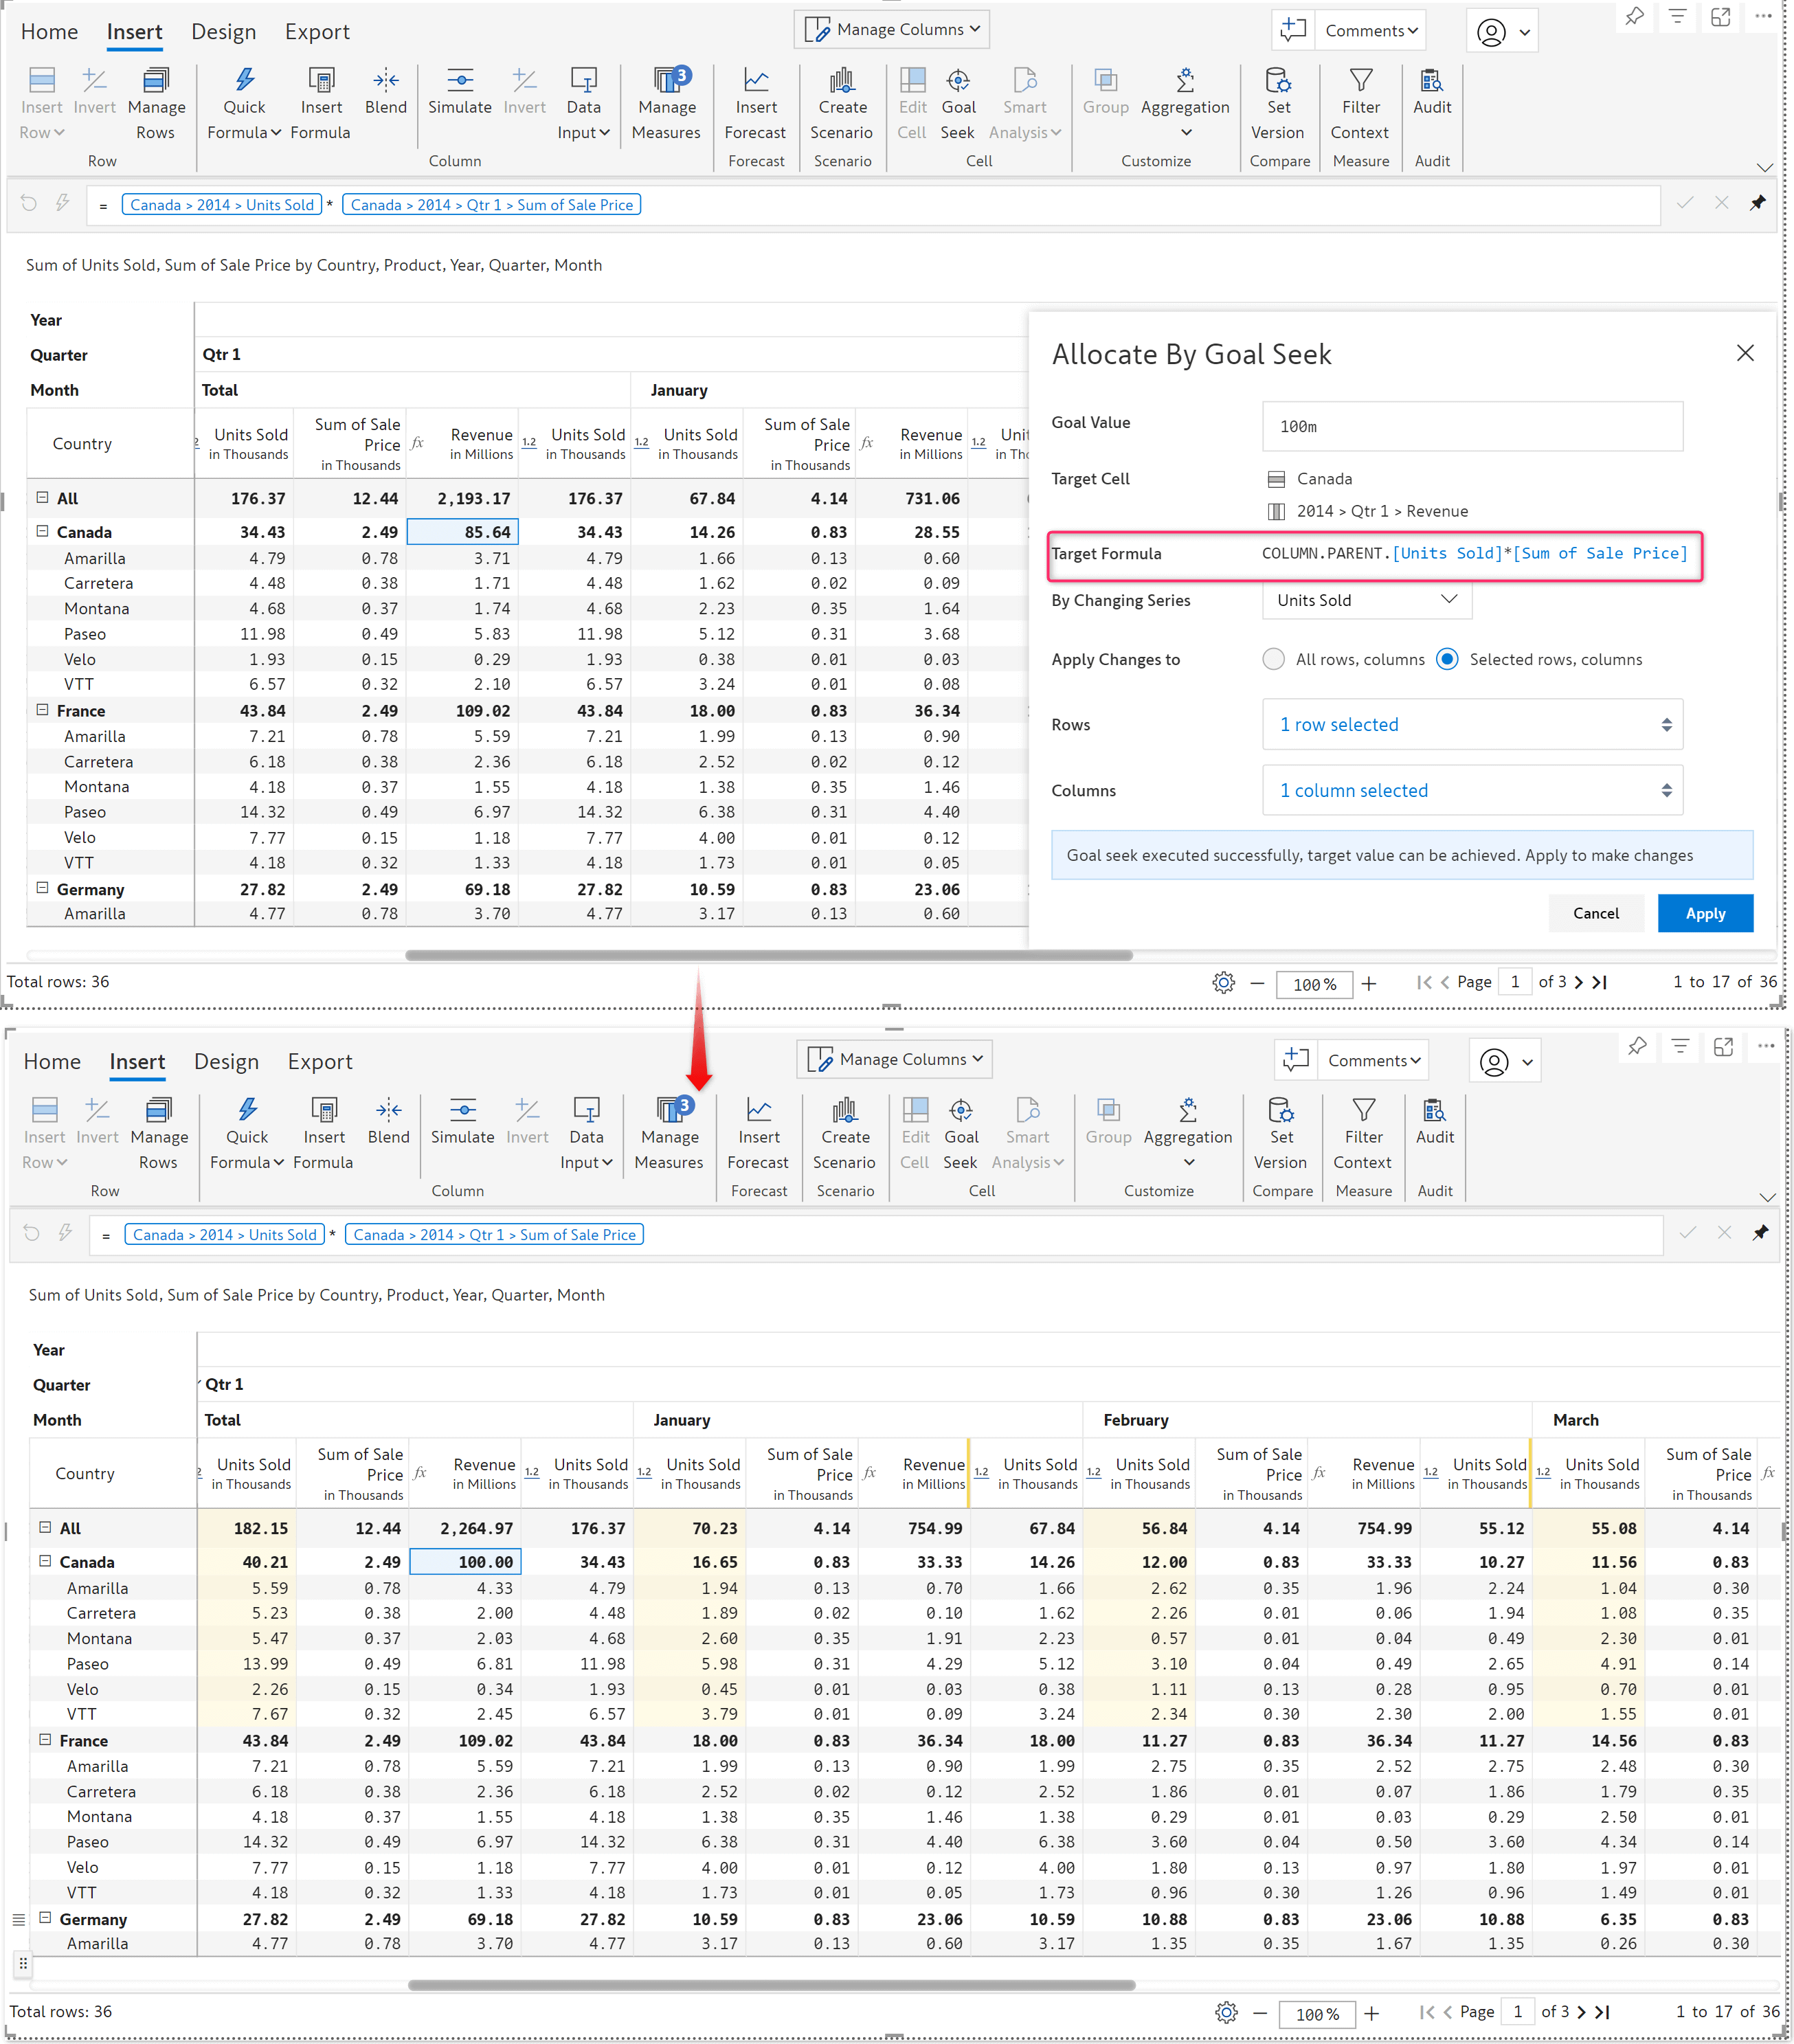
Goal seek can also be performed on such target formula cells that use column references.
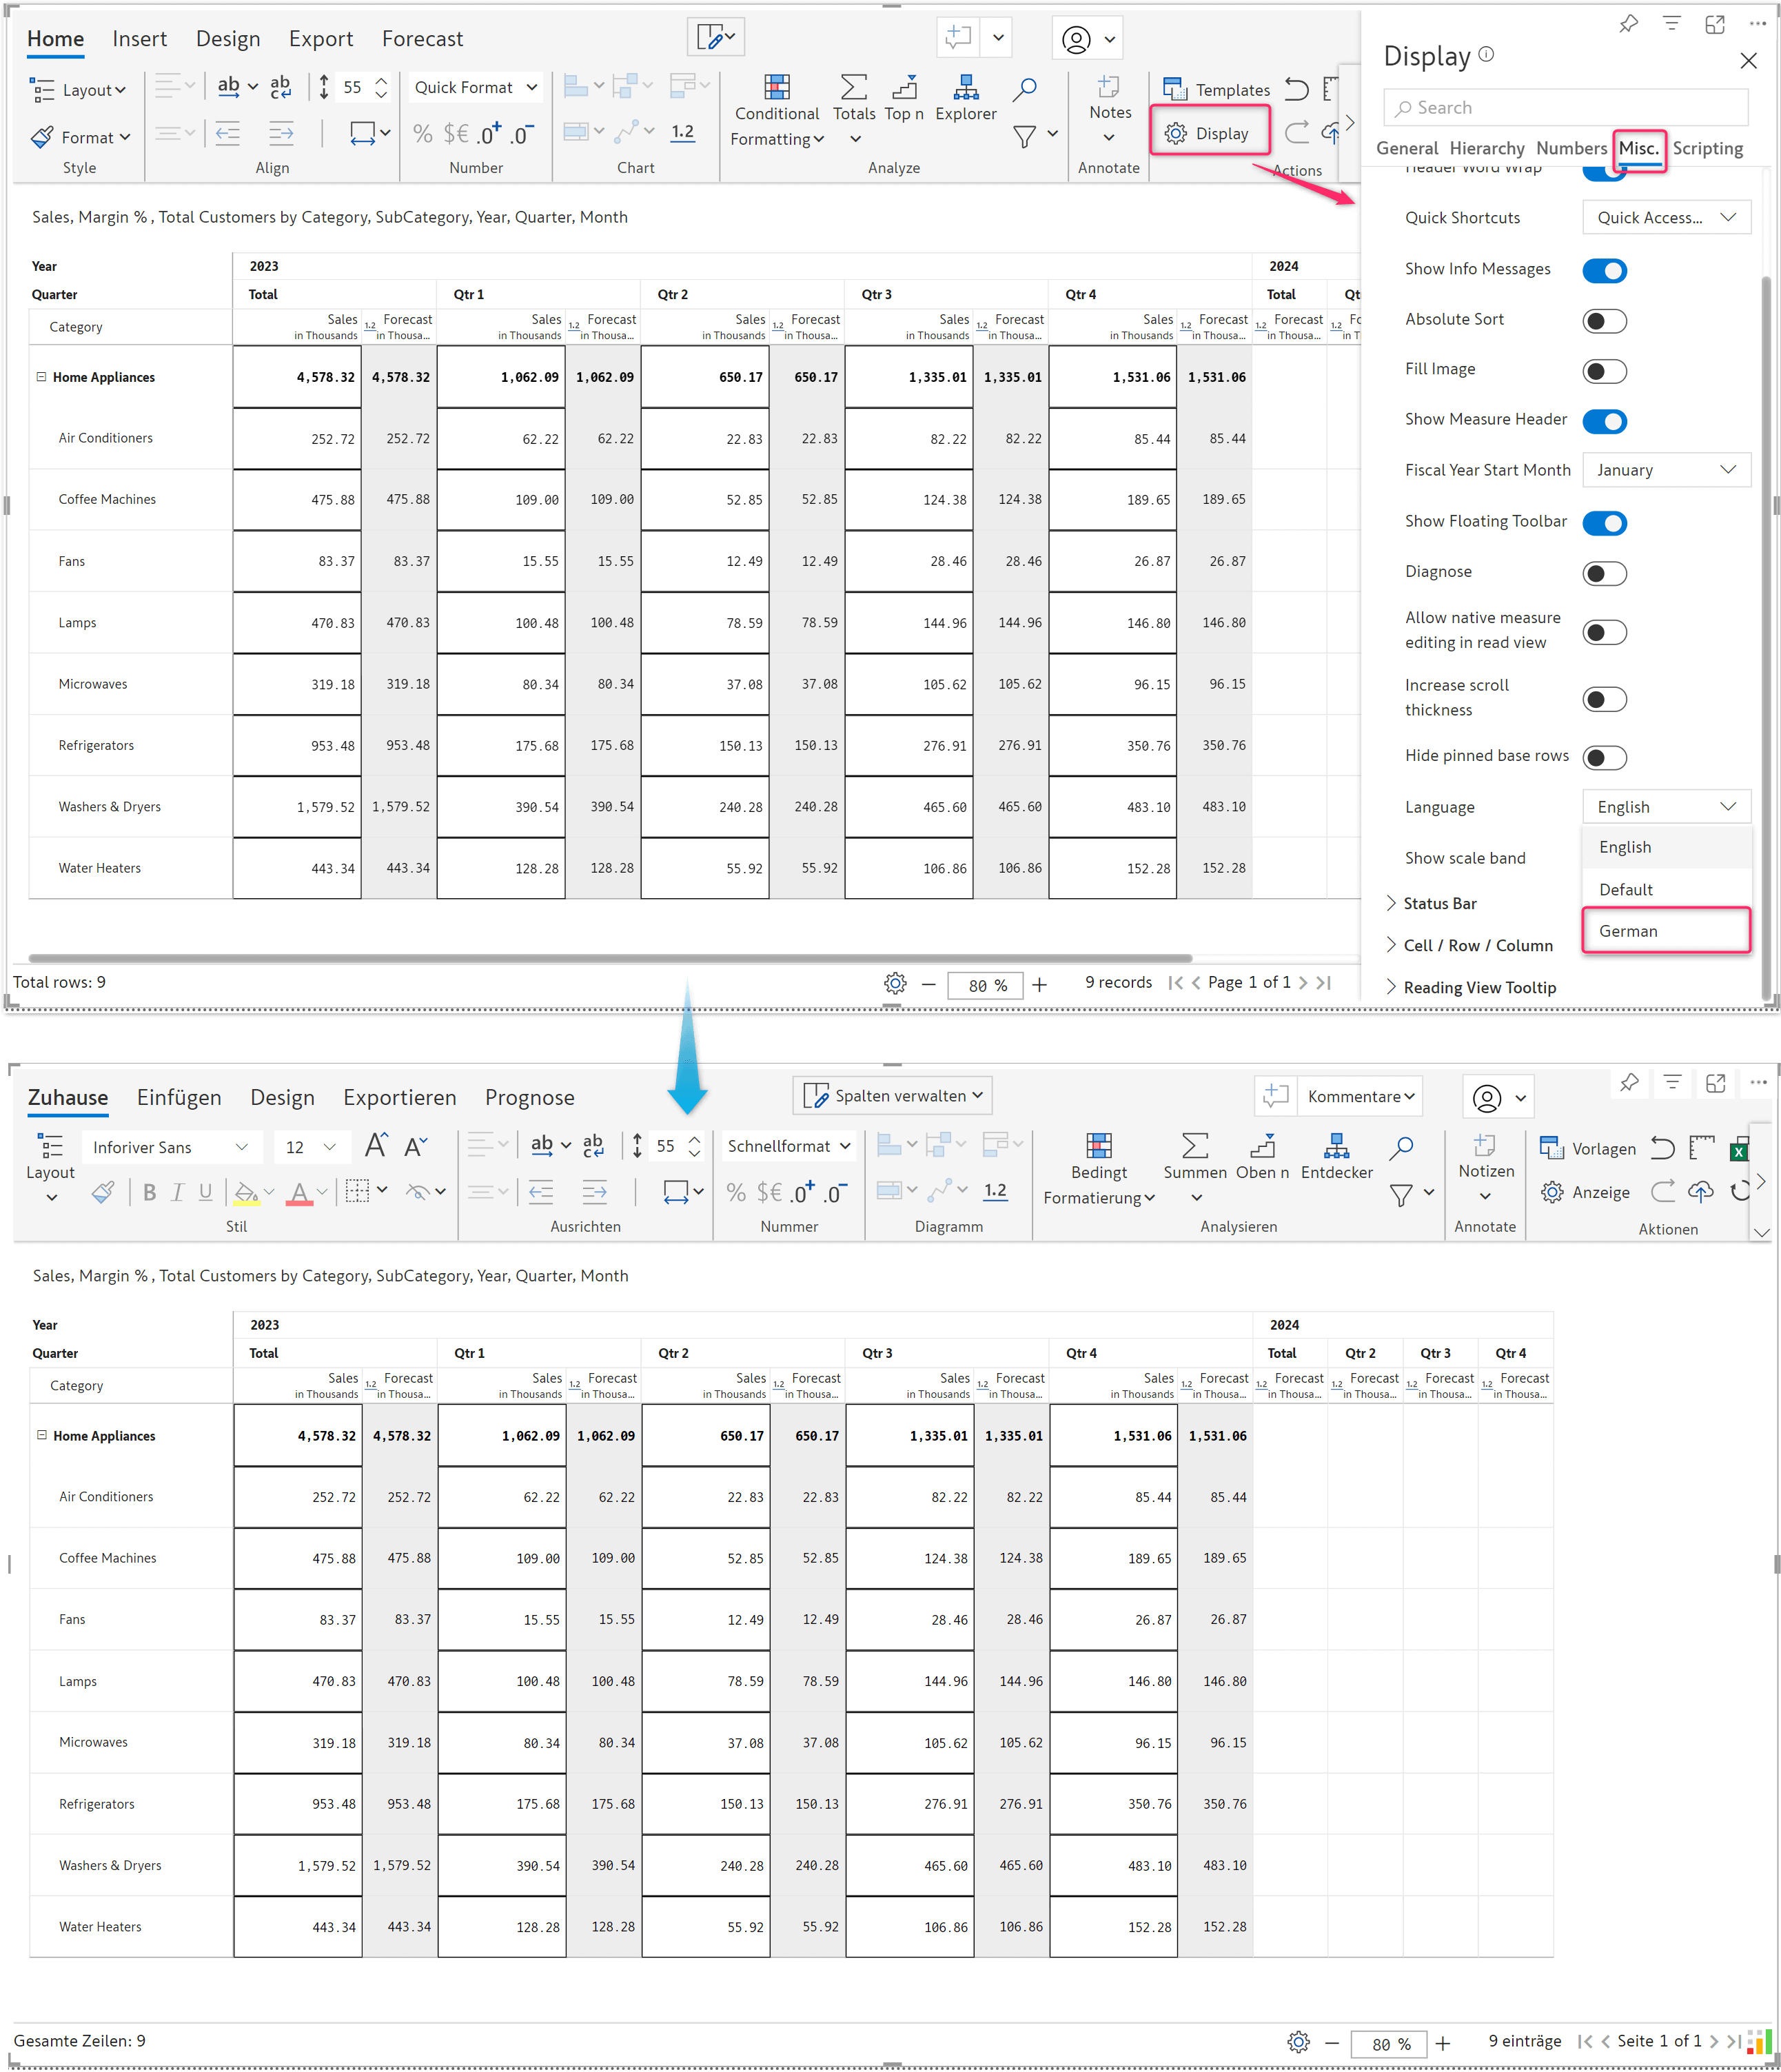
Our latest Inforiver visual now supports a German-language interface. To change all the menus, tabs, and options to German, go to the Home tab, select Display → Misc. → Language, and then choose German.
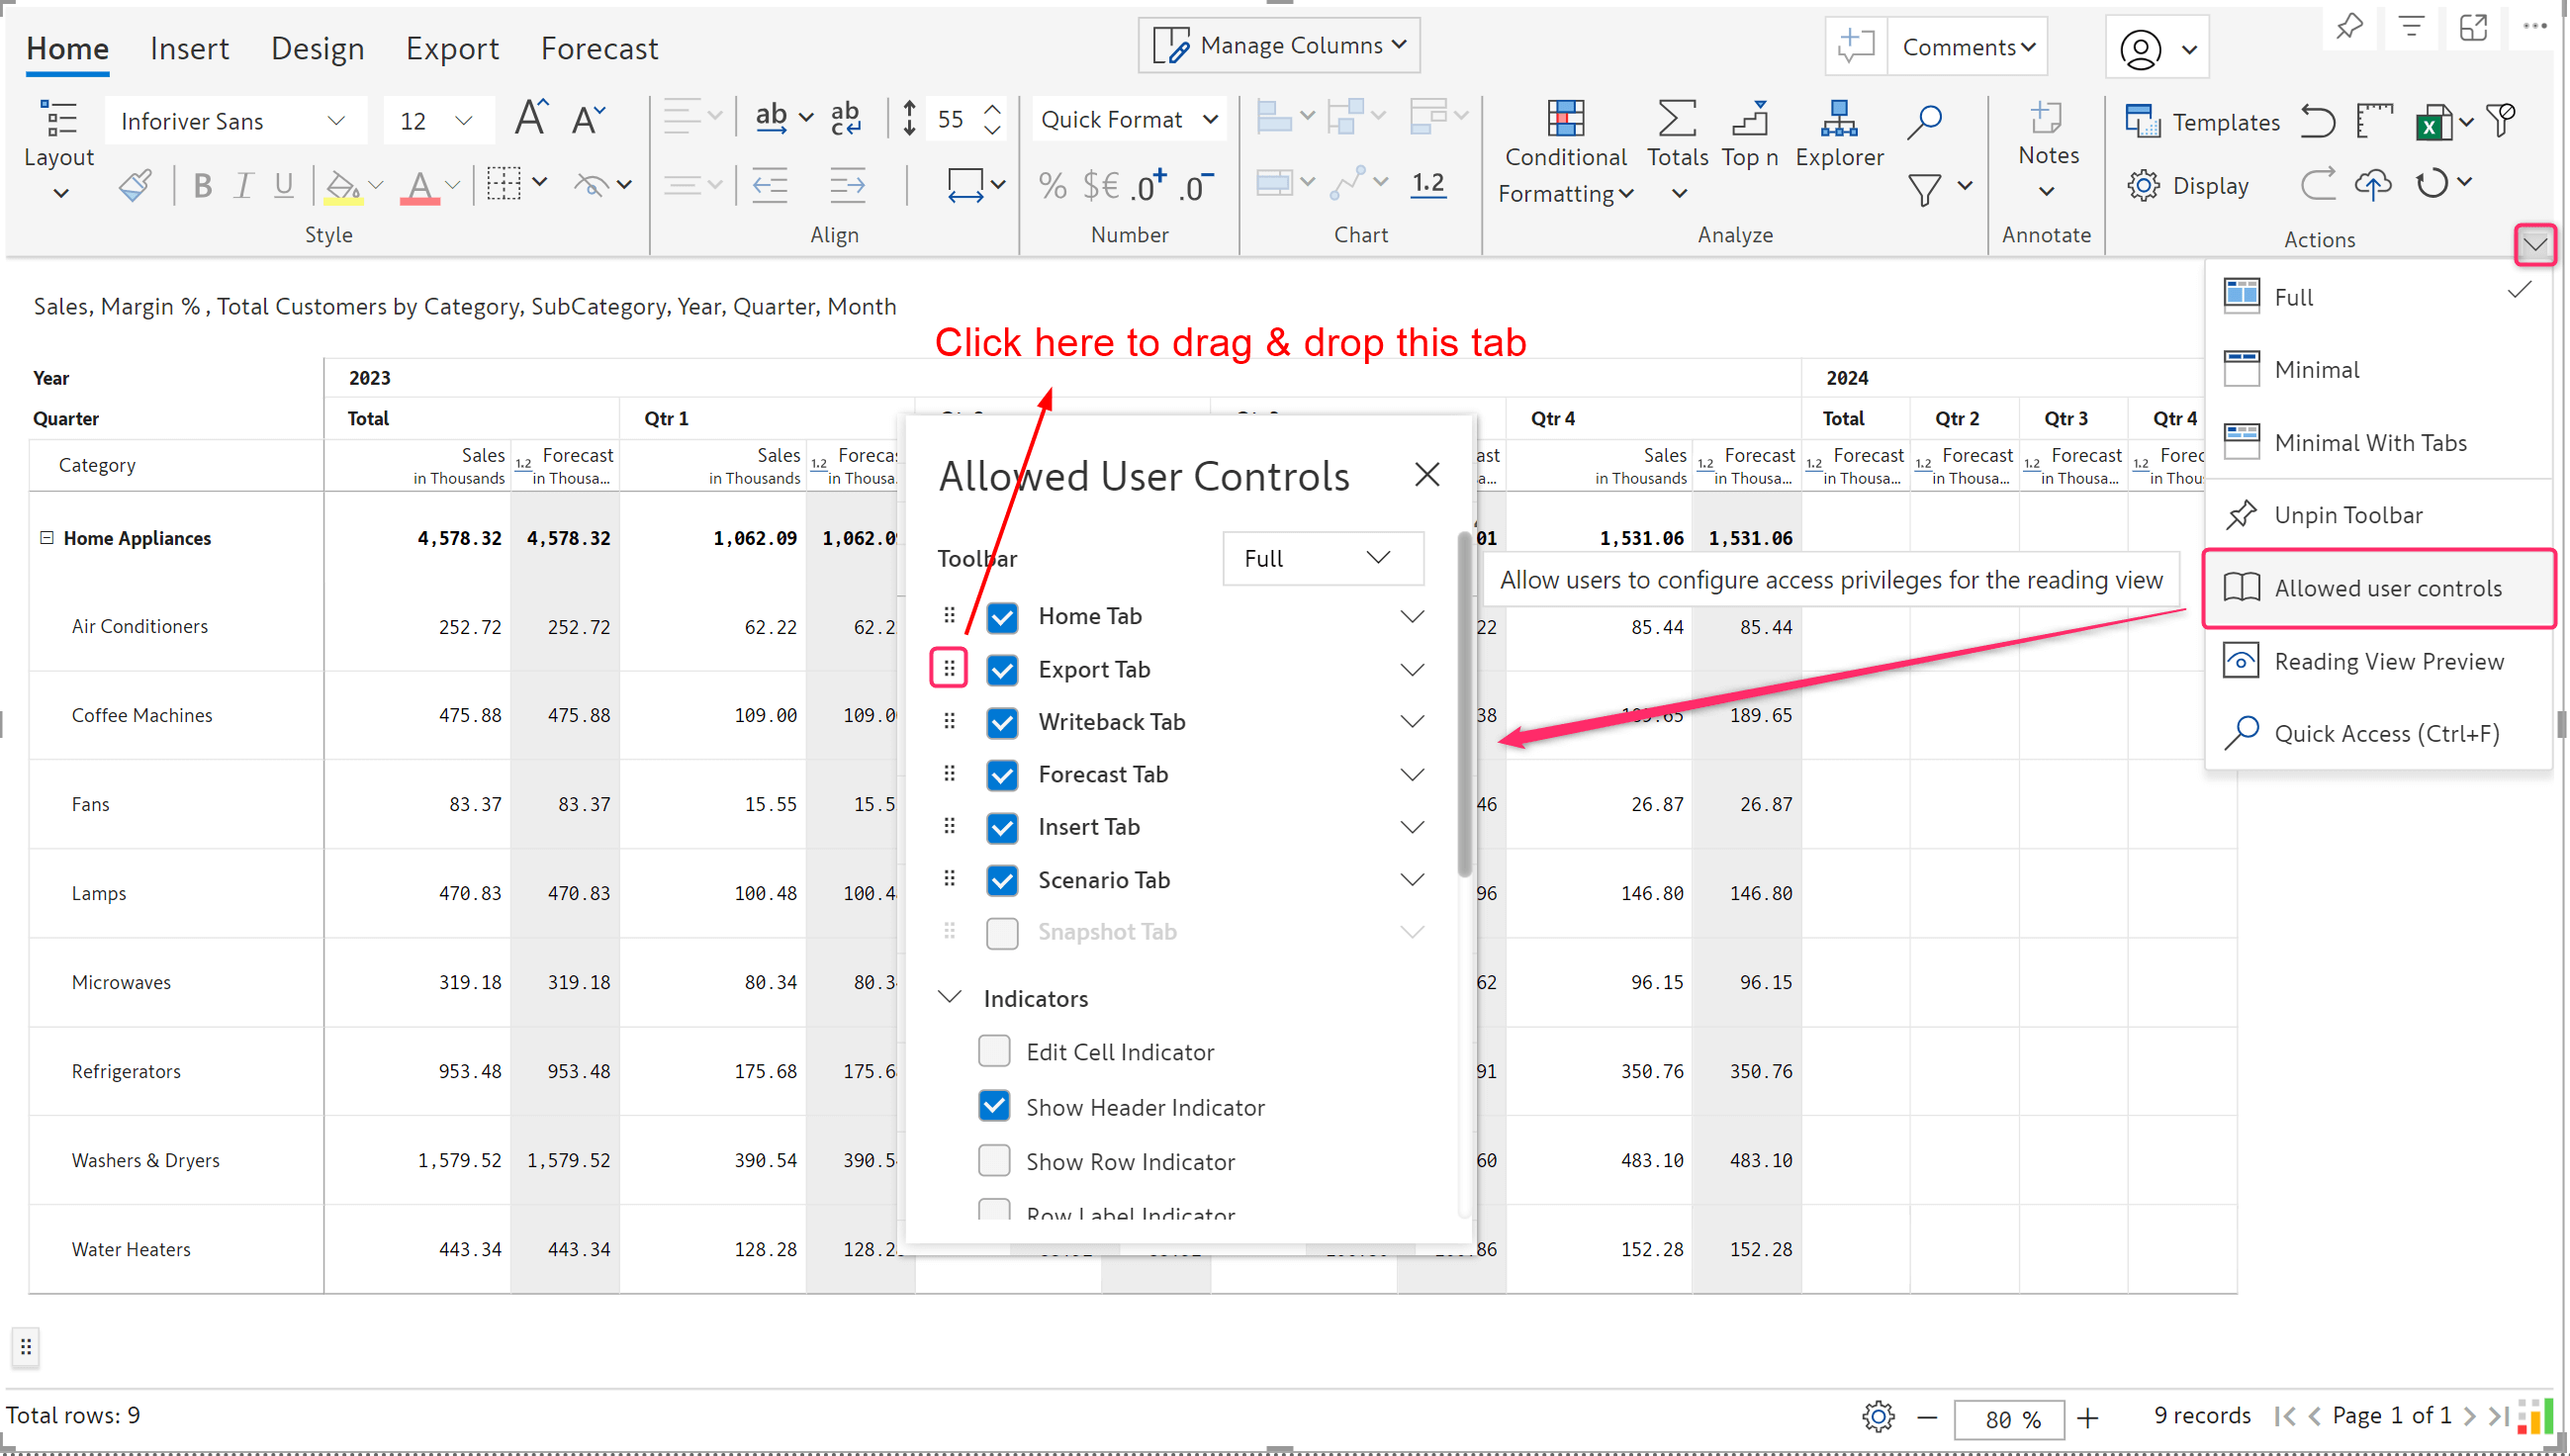
You can change the order of the tabs (Home, Insert, Design, Export, Forecast, etc.) while setting up the ‘Allowed user controls’ for the Reading view. This applies only to the "Full" and "Minimal with Tabs" views because, in other view types, the tabs are not visible. To rearrange the tabs, click on the six-dot icon beside the tab you wish to move.
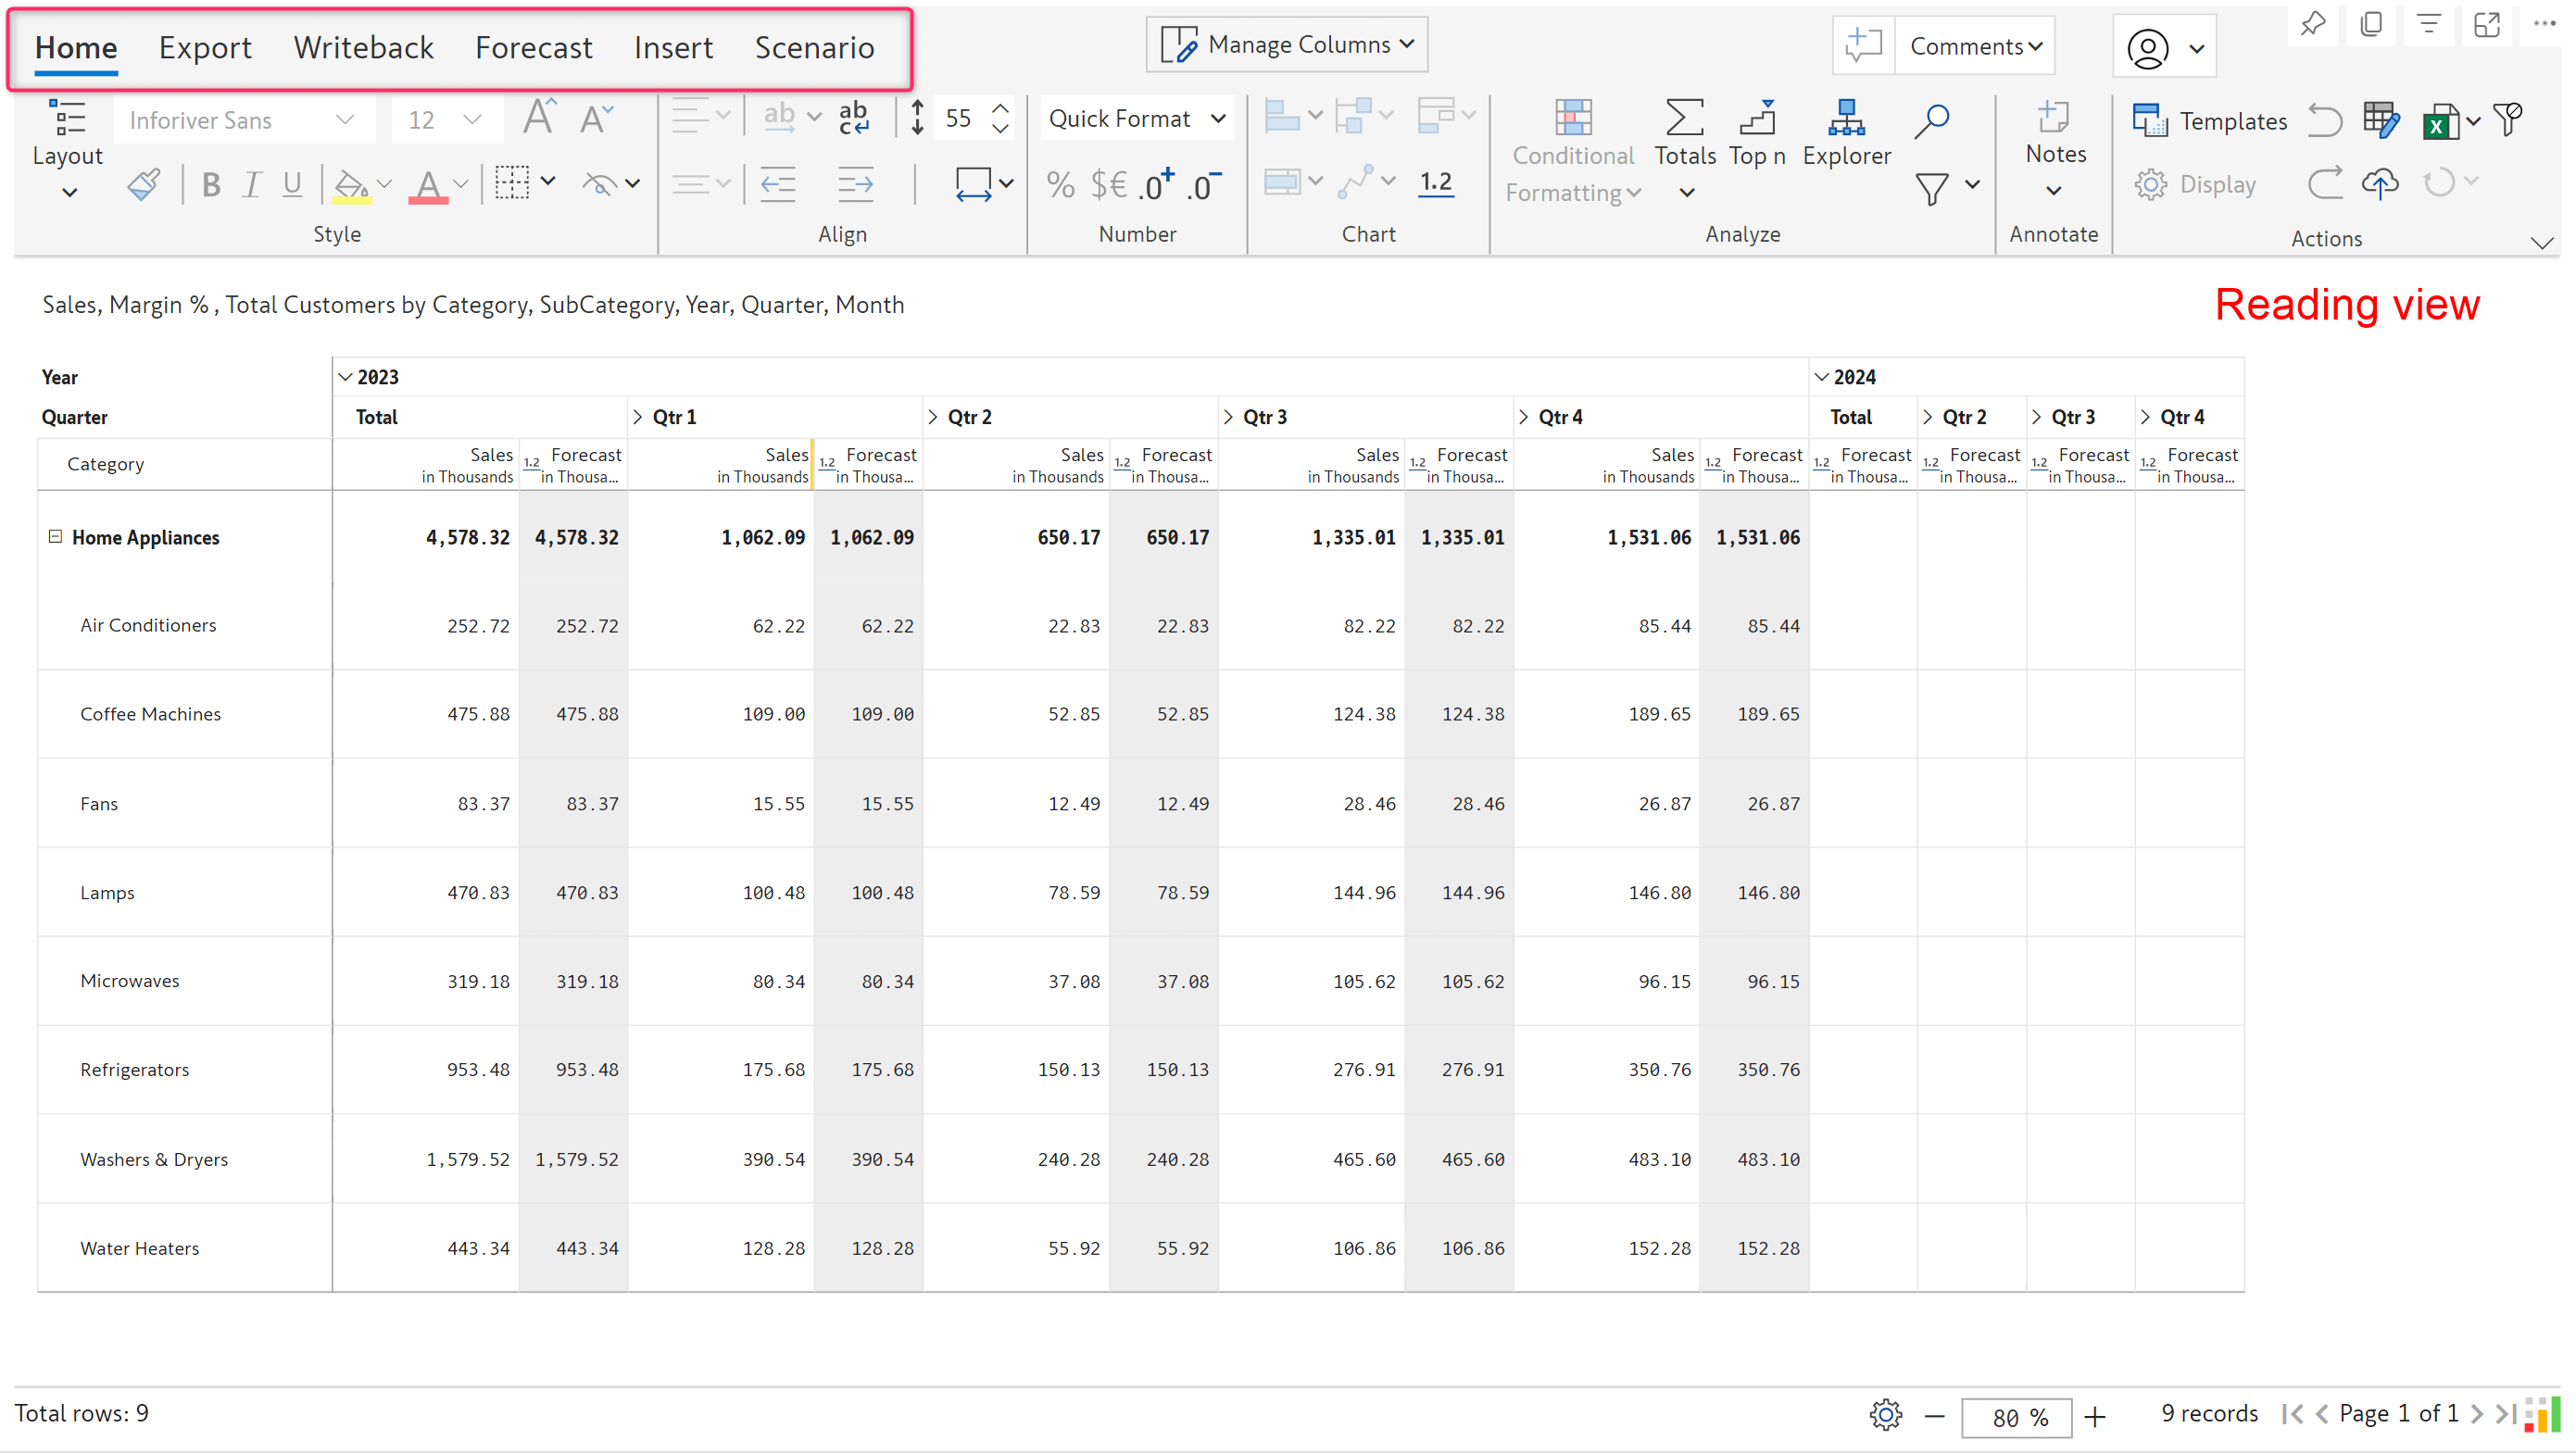
With the above configuration, the Reading view looks as shown below:
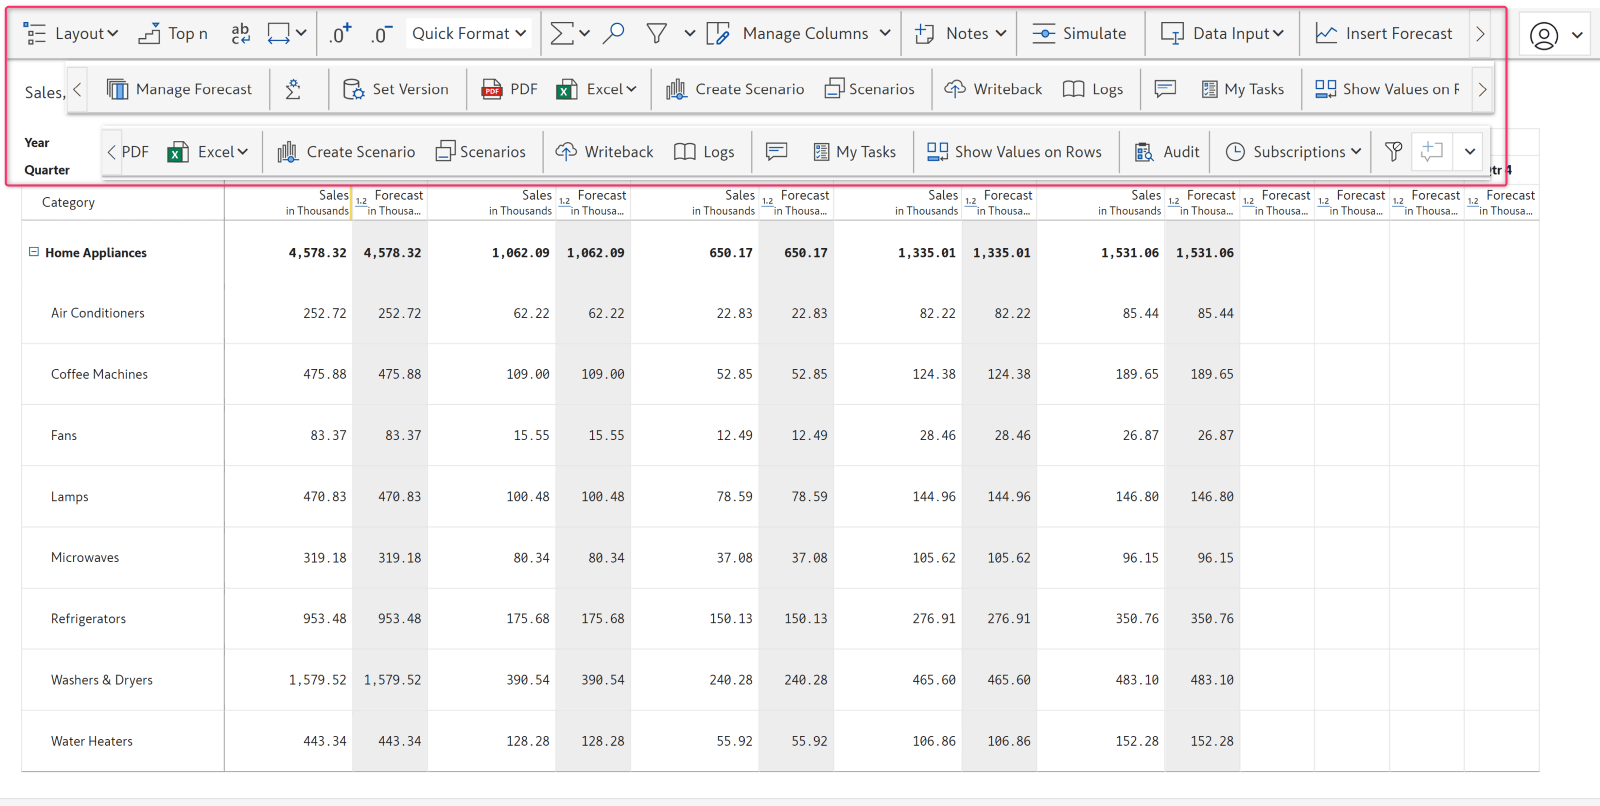
We had previously introduced additional menus in the minimal view toolbar, including Simulate, Data Input, and Forecast. We have now reorganized the menu options in both read and edit modes so you can easily navigate to the frequently used options.
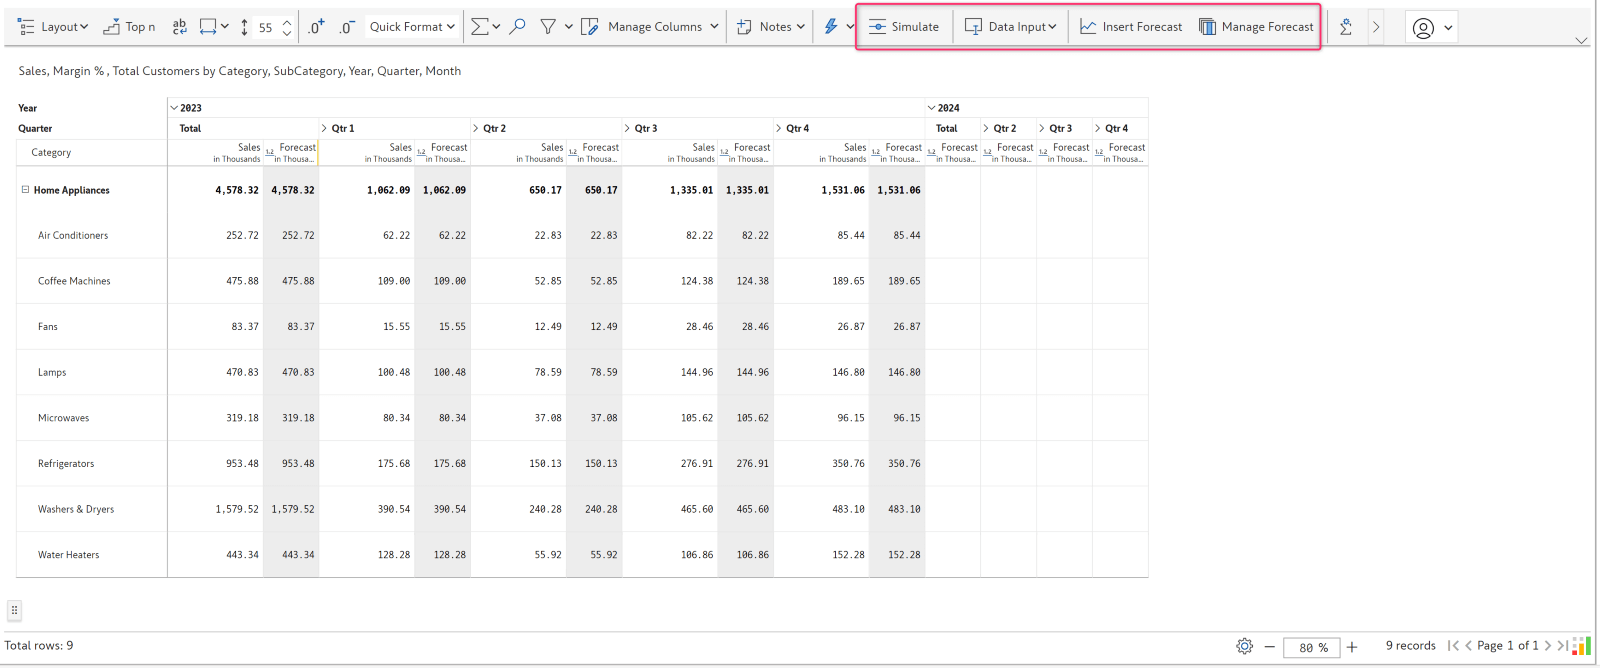
The regrouped menu options are illustrated in the image below.
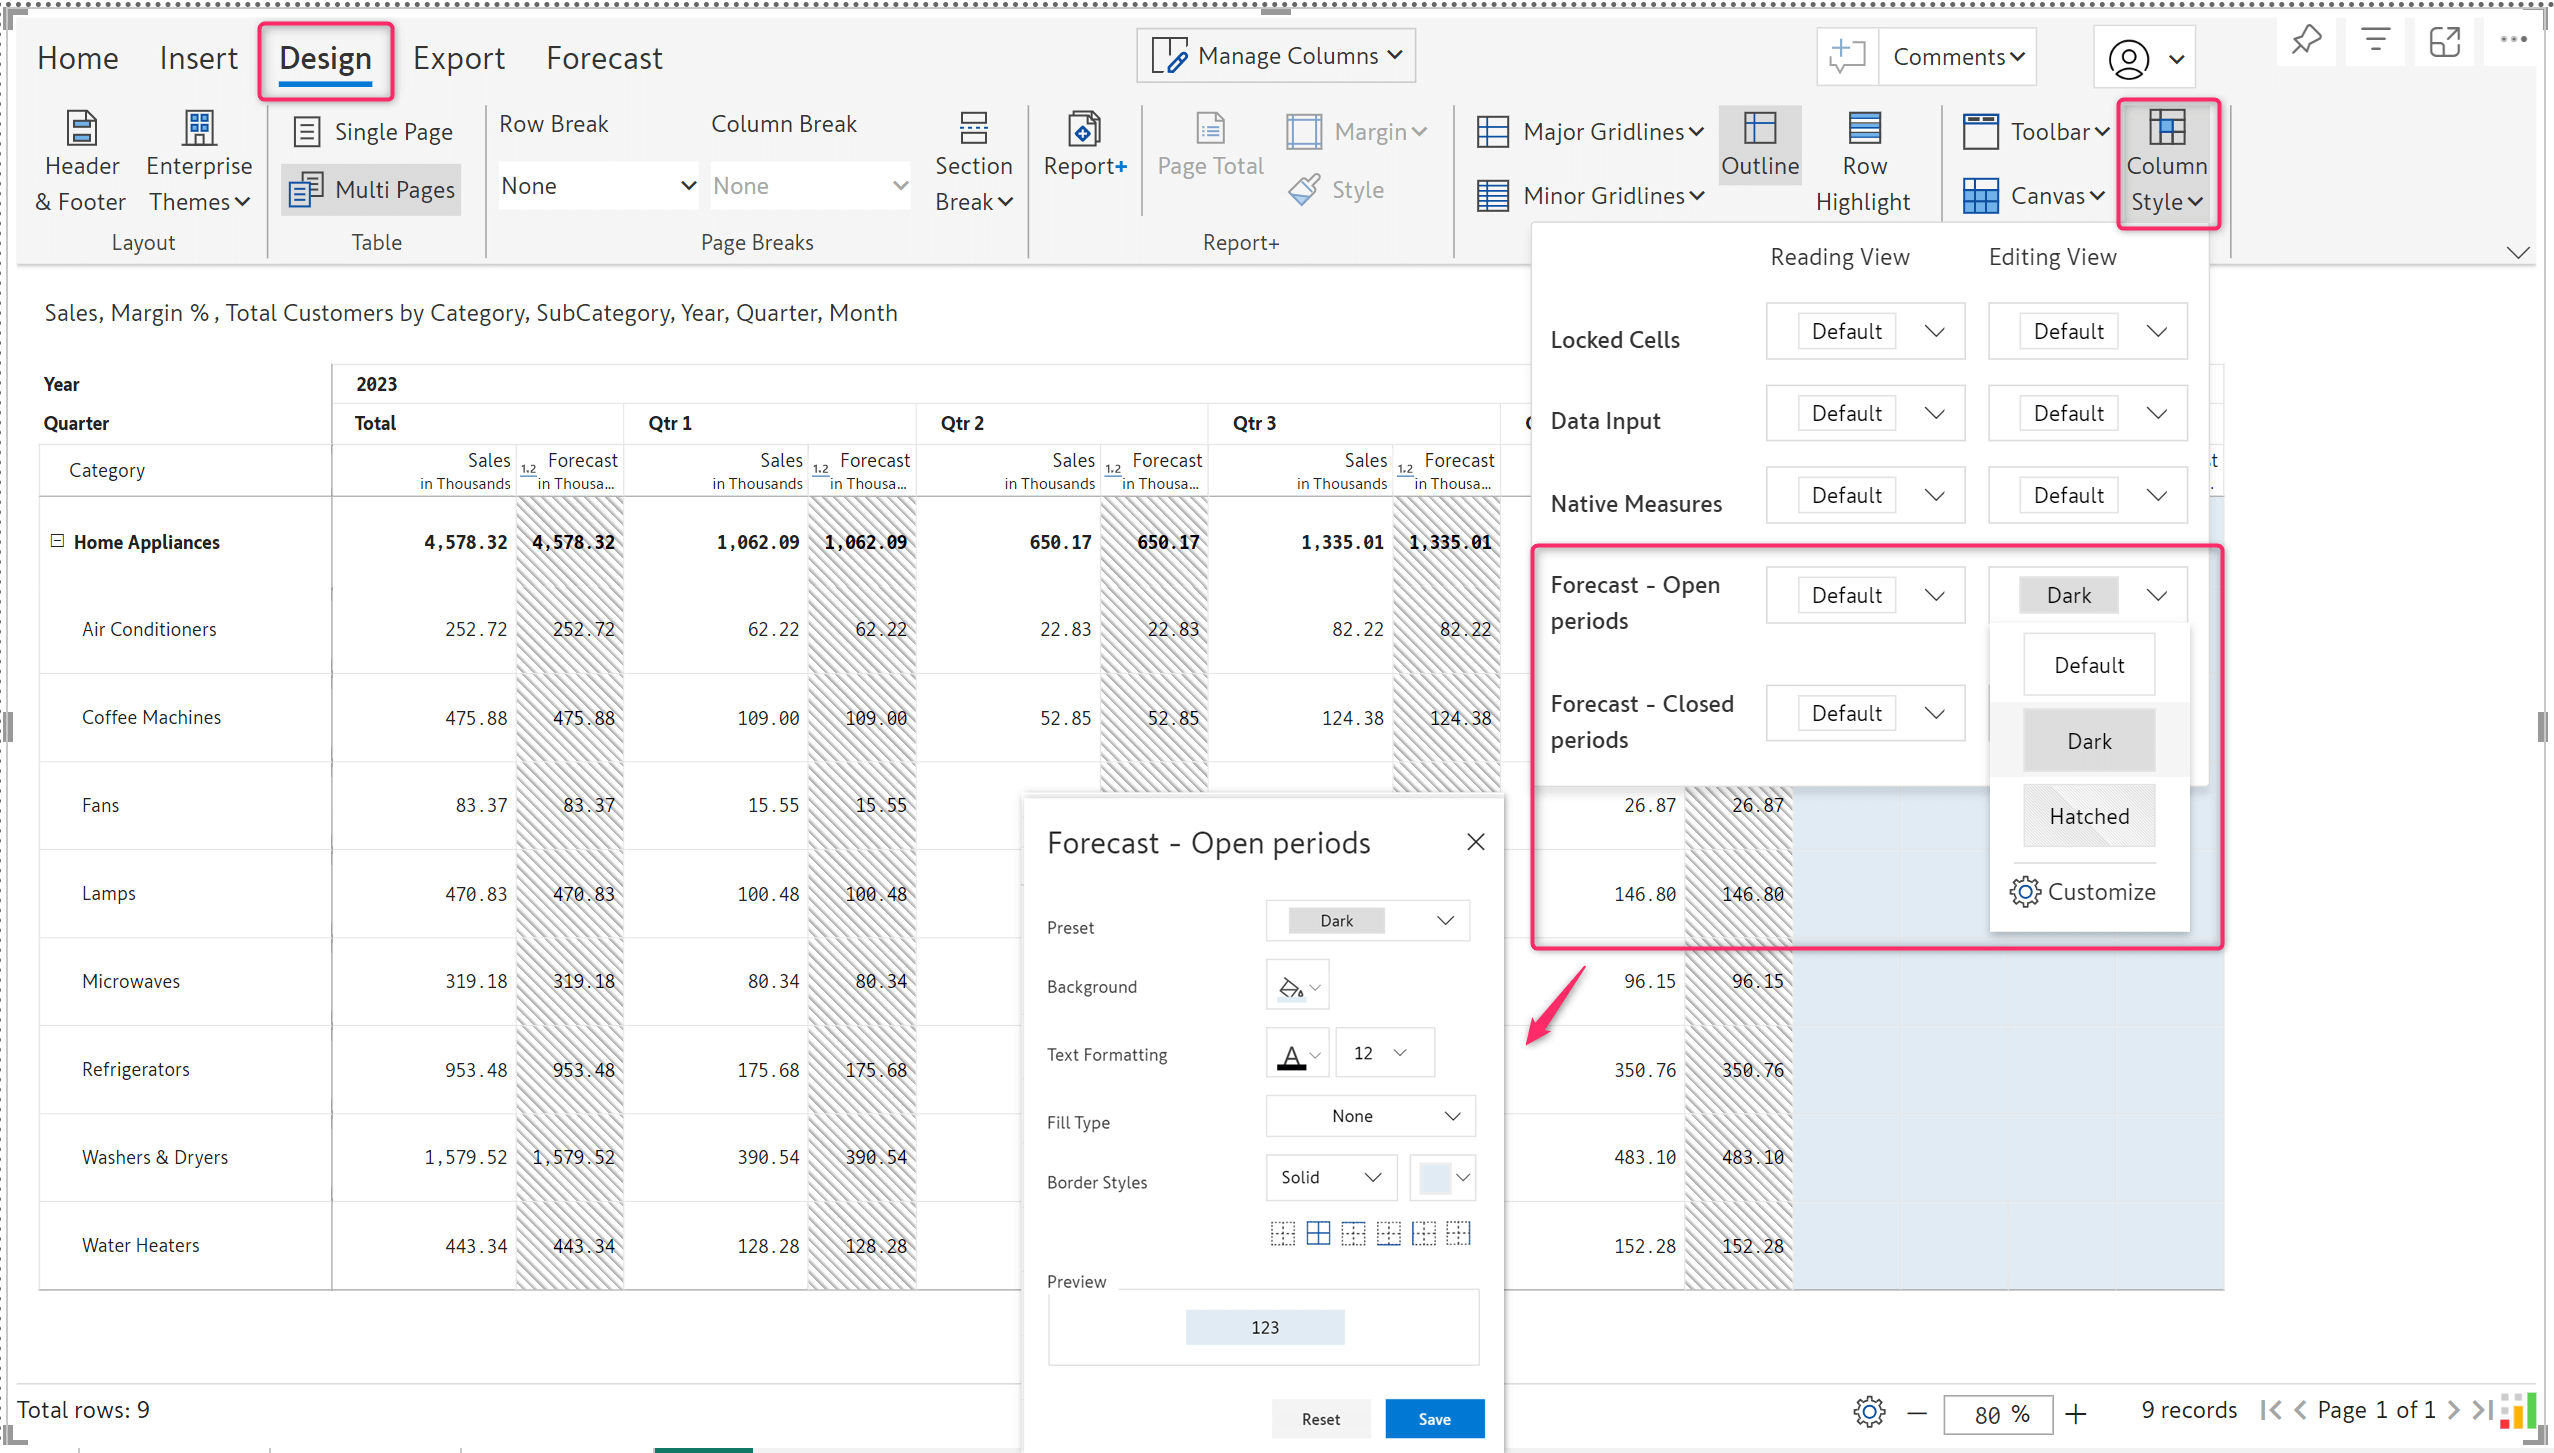
Personalize your forecast report by choosing your preferred background and border colors for open and closed periods. This enables viewers to identify and differentiate between them quickly. In Design > Column Style, choose from the different text and cell formatting options available to apply to the open and closed periods. You can select distinctive styles for the read and edit modes.
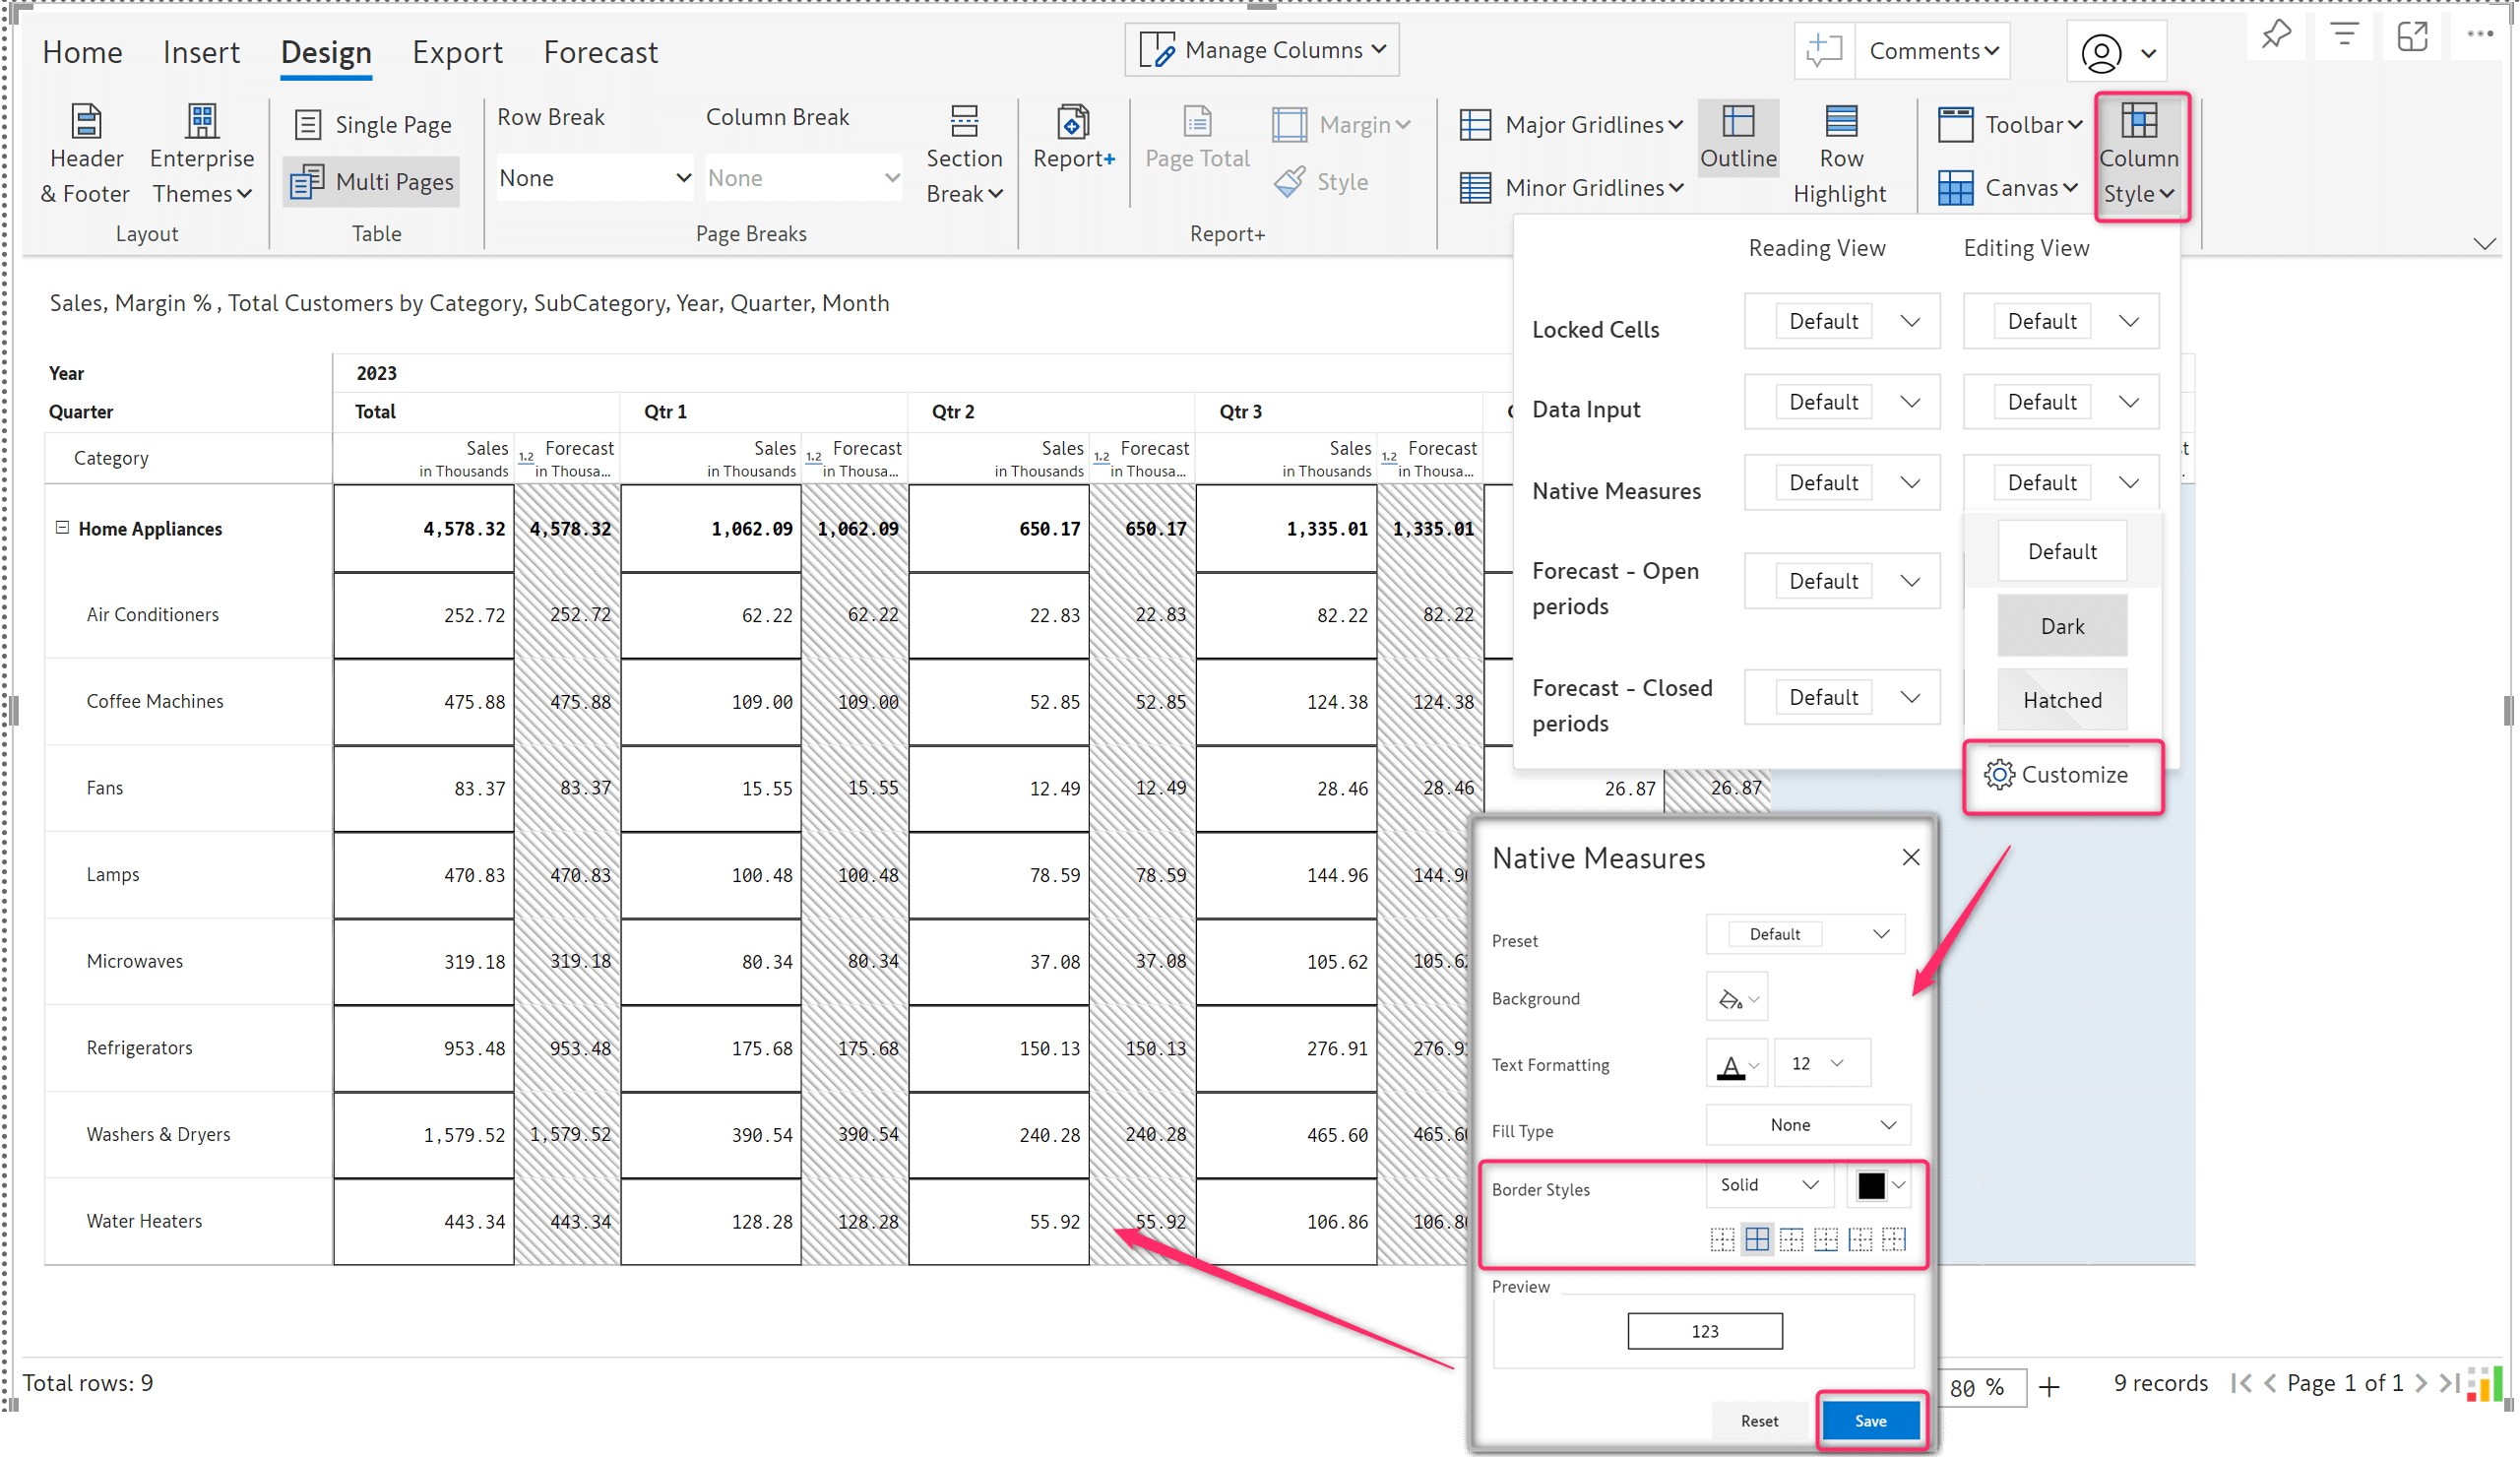
In addition to the cell and text formatting options available in the column style menu, this version has also added an option to customize the border style for the locked cells, data input columns, native measures, and forecast columns.
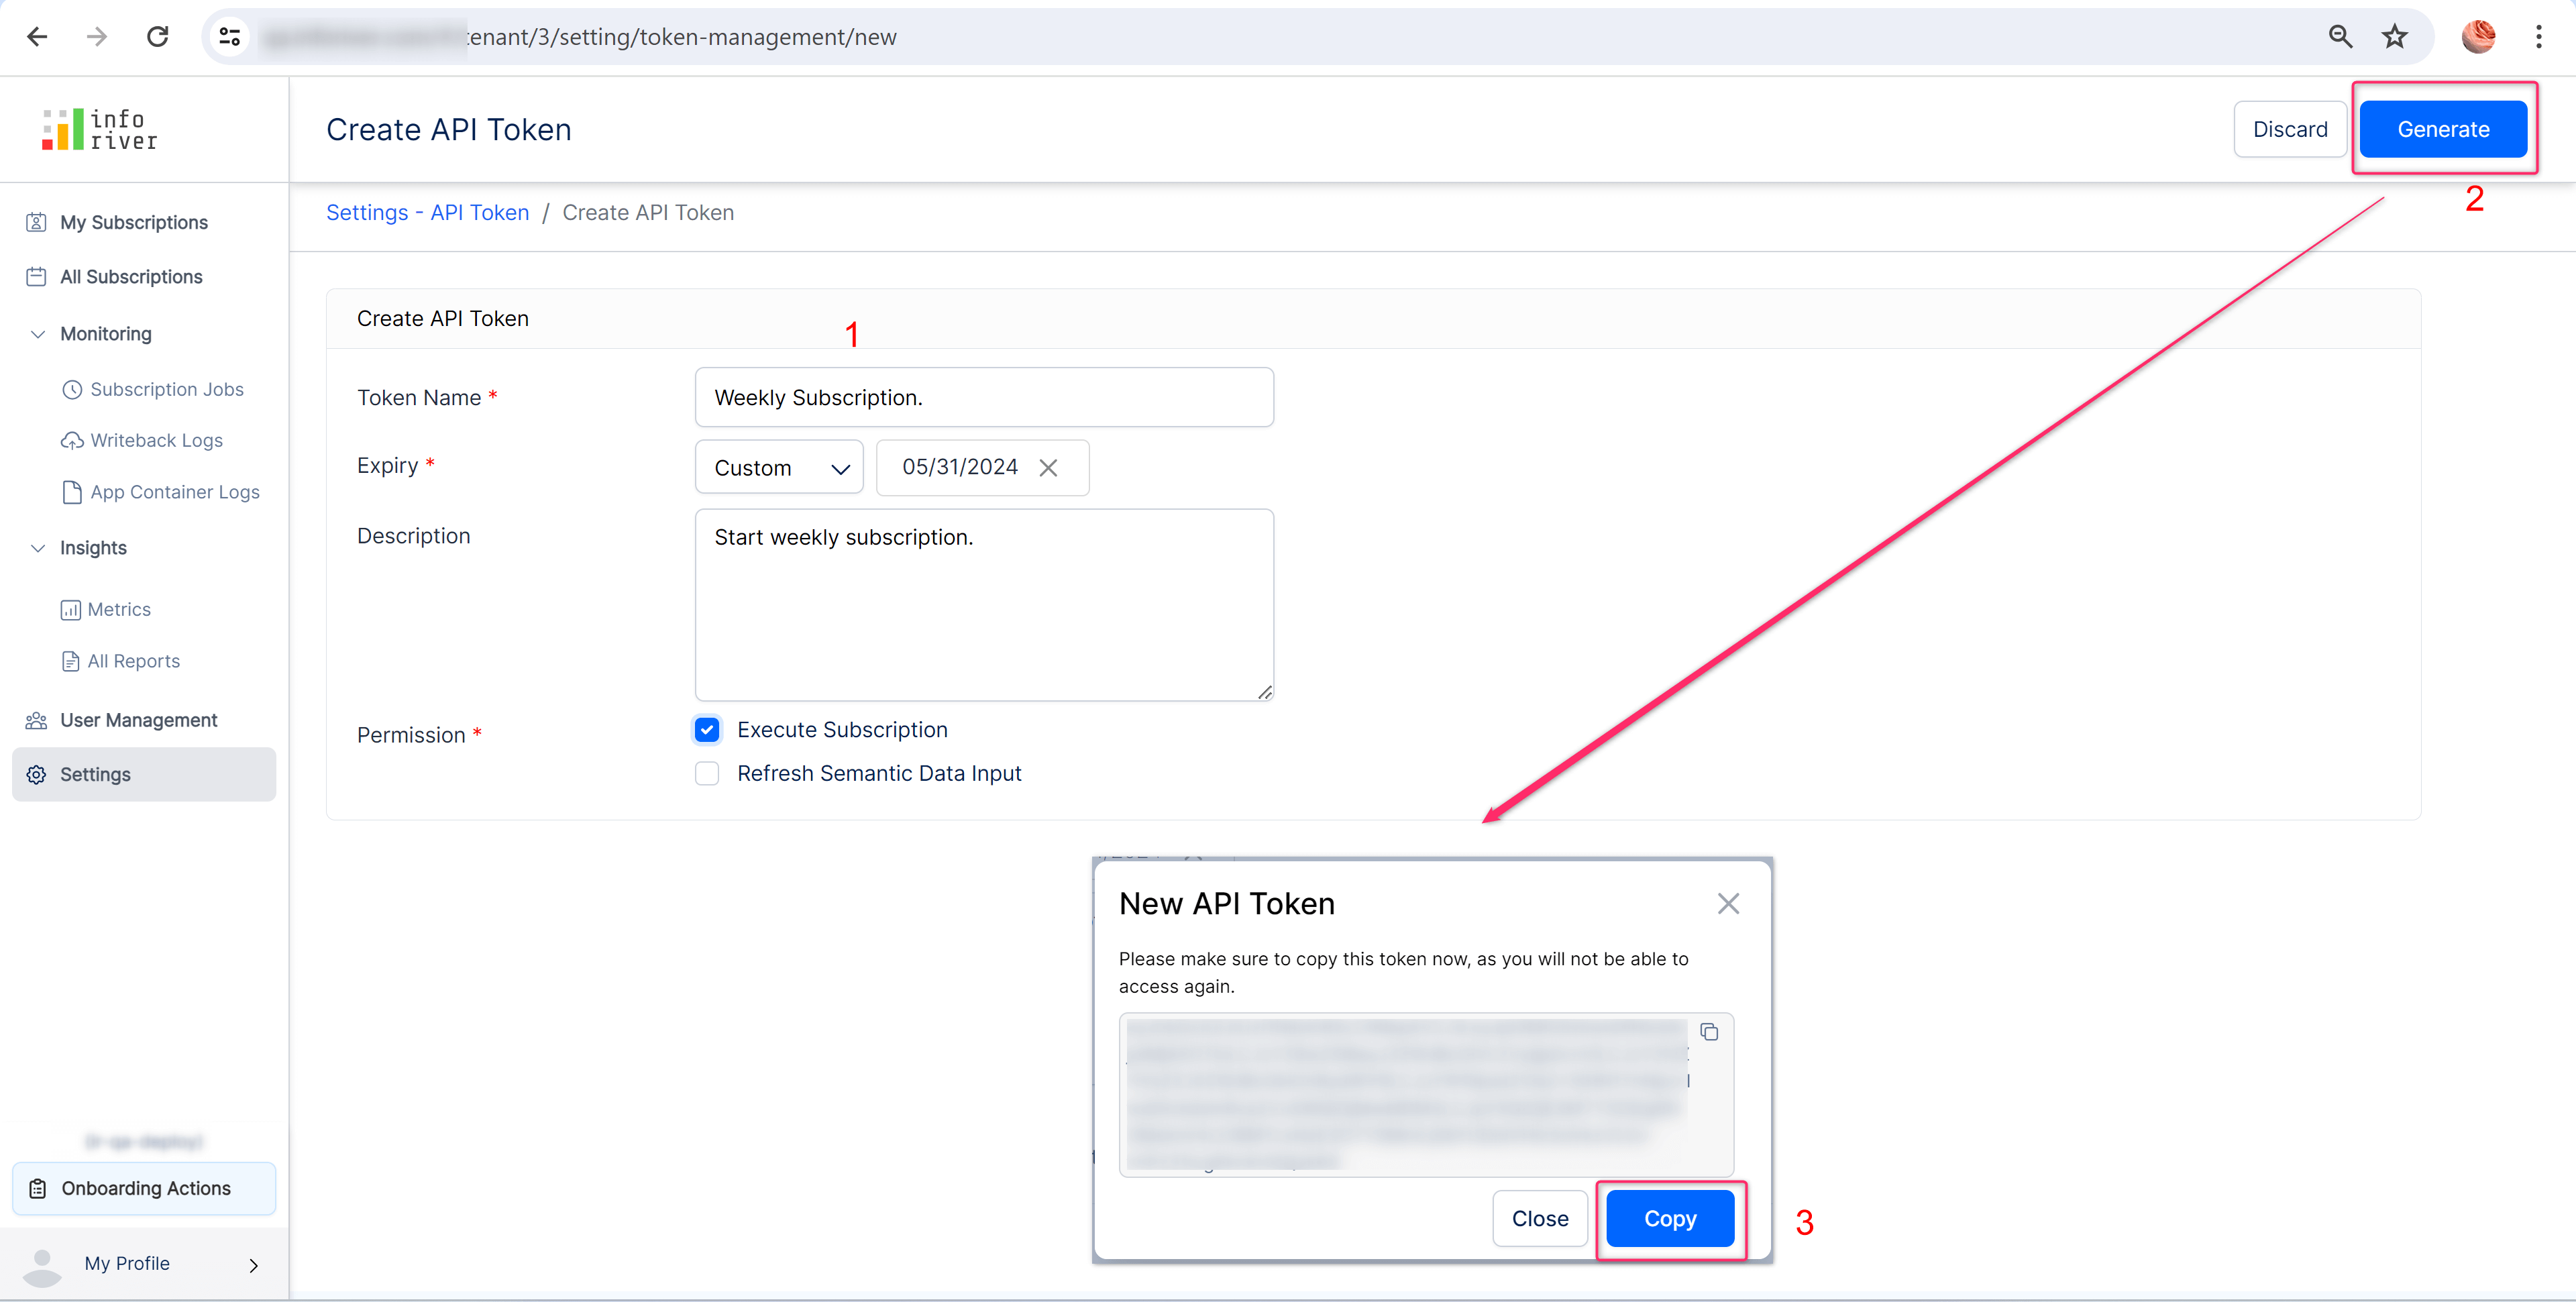
In this version, we provide an API token management system in the admin console settings, where admins can create and manage API tokens. These tokens can then be integrated into any external application to schedule a subscription job, or refresh a semantic data input model, or both. The images below show the process of creating an API token.
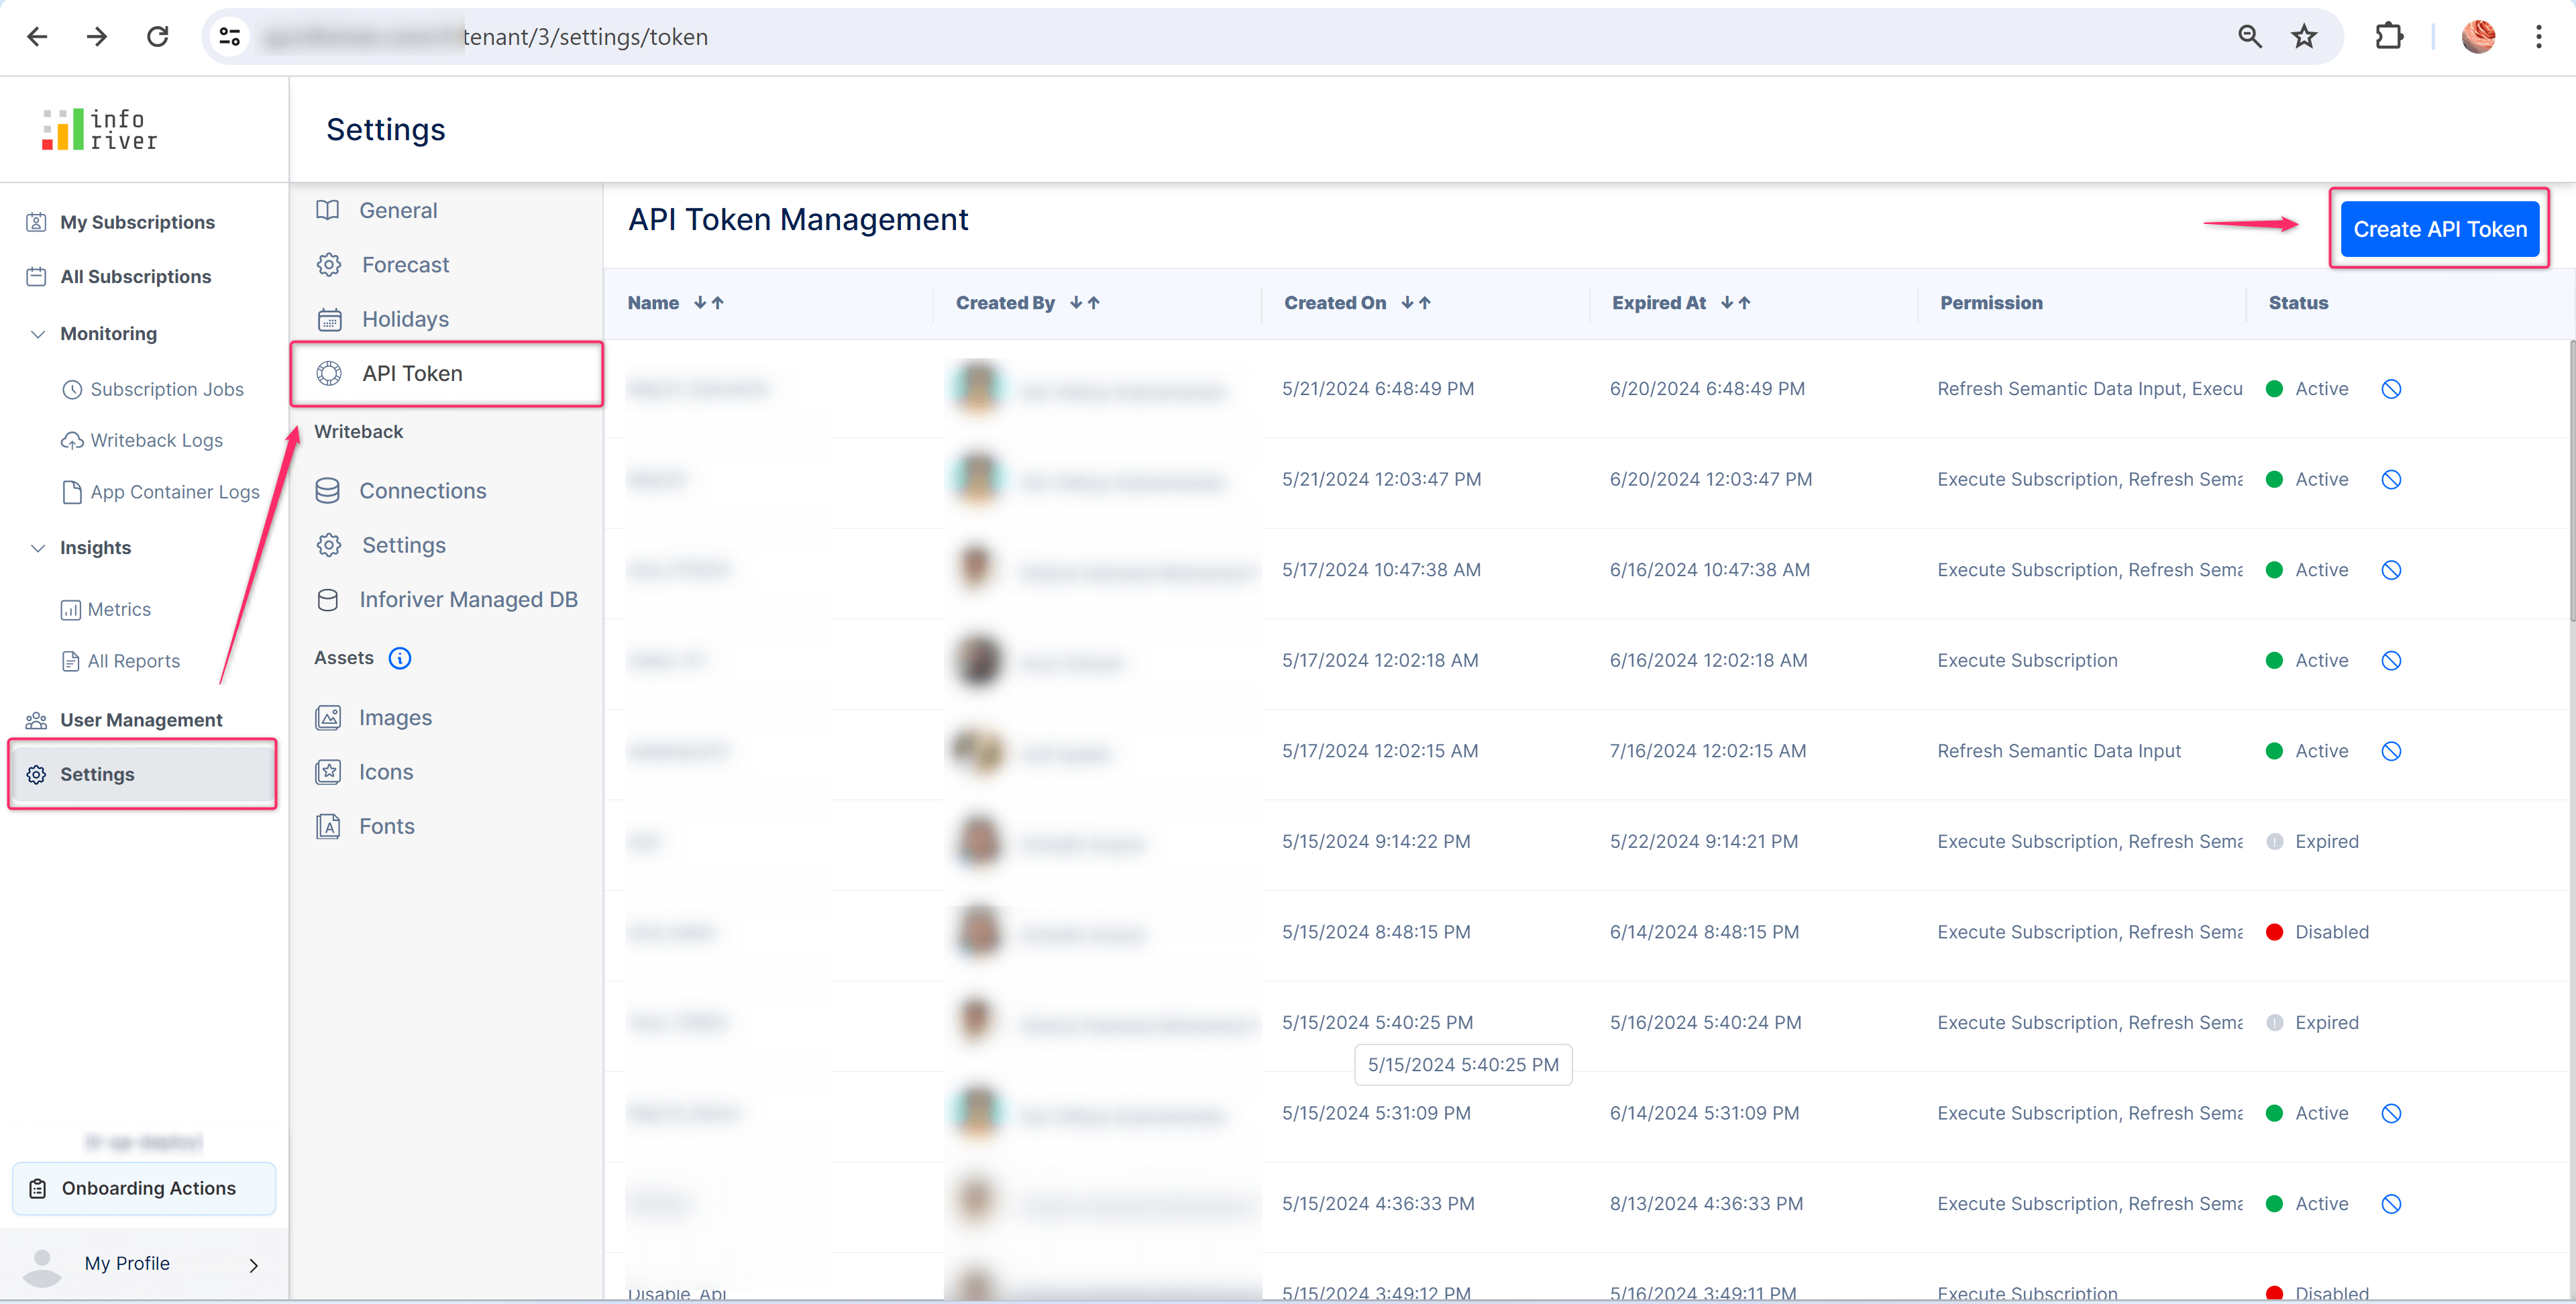
Admins can create a token, name it, and set its validity and description. After generating a token, ensure it is copied, as it becomes irretrievable after closing the window.
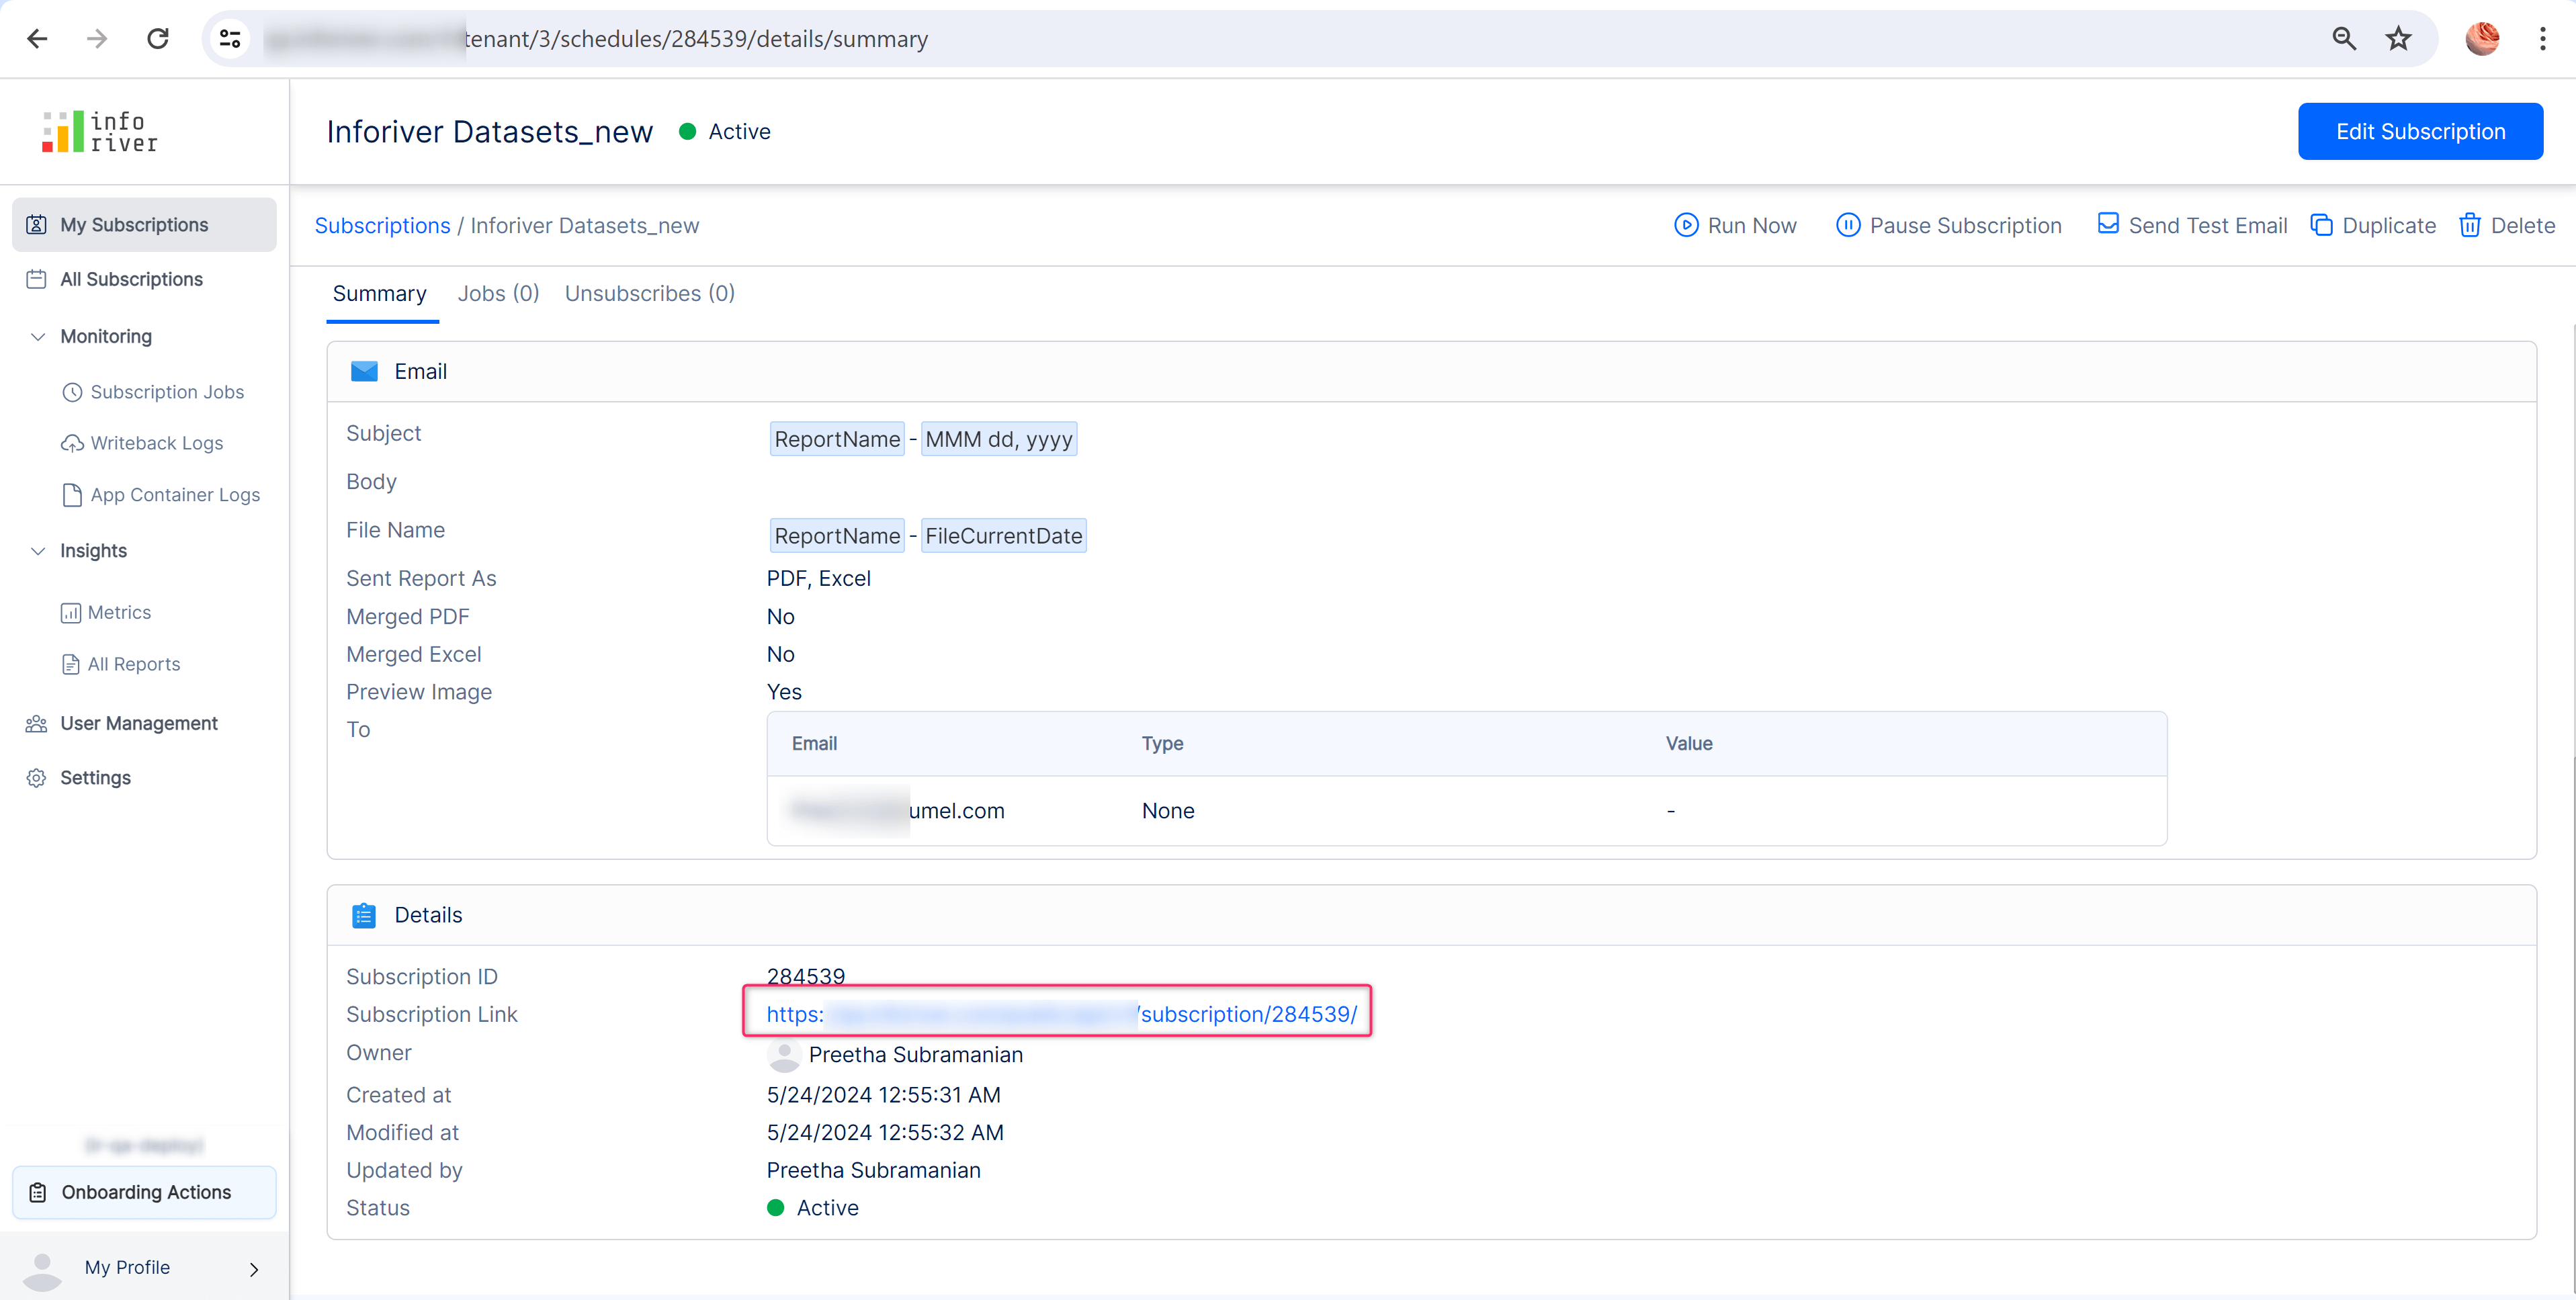
Inforiver lets you initiate a scheduled subscription from an external application in addition to initiating it through the console. This way, any authorized user can start a subscription job with a simple click of a button from an external application without having to log in to the admin console.
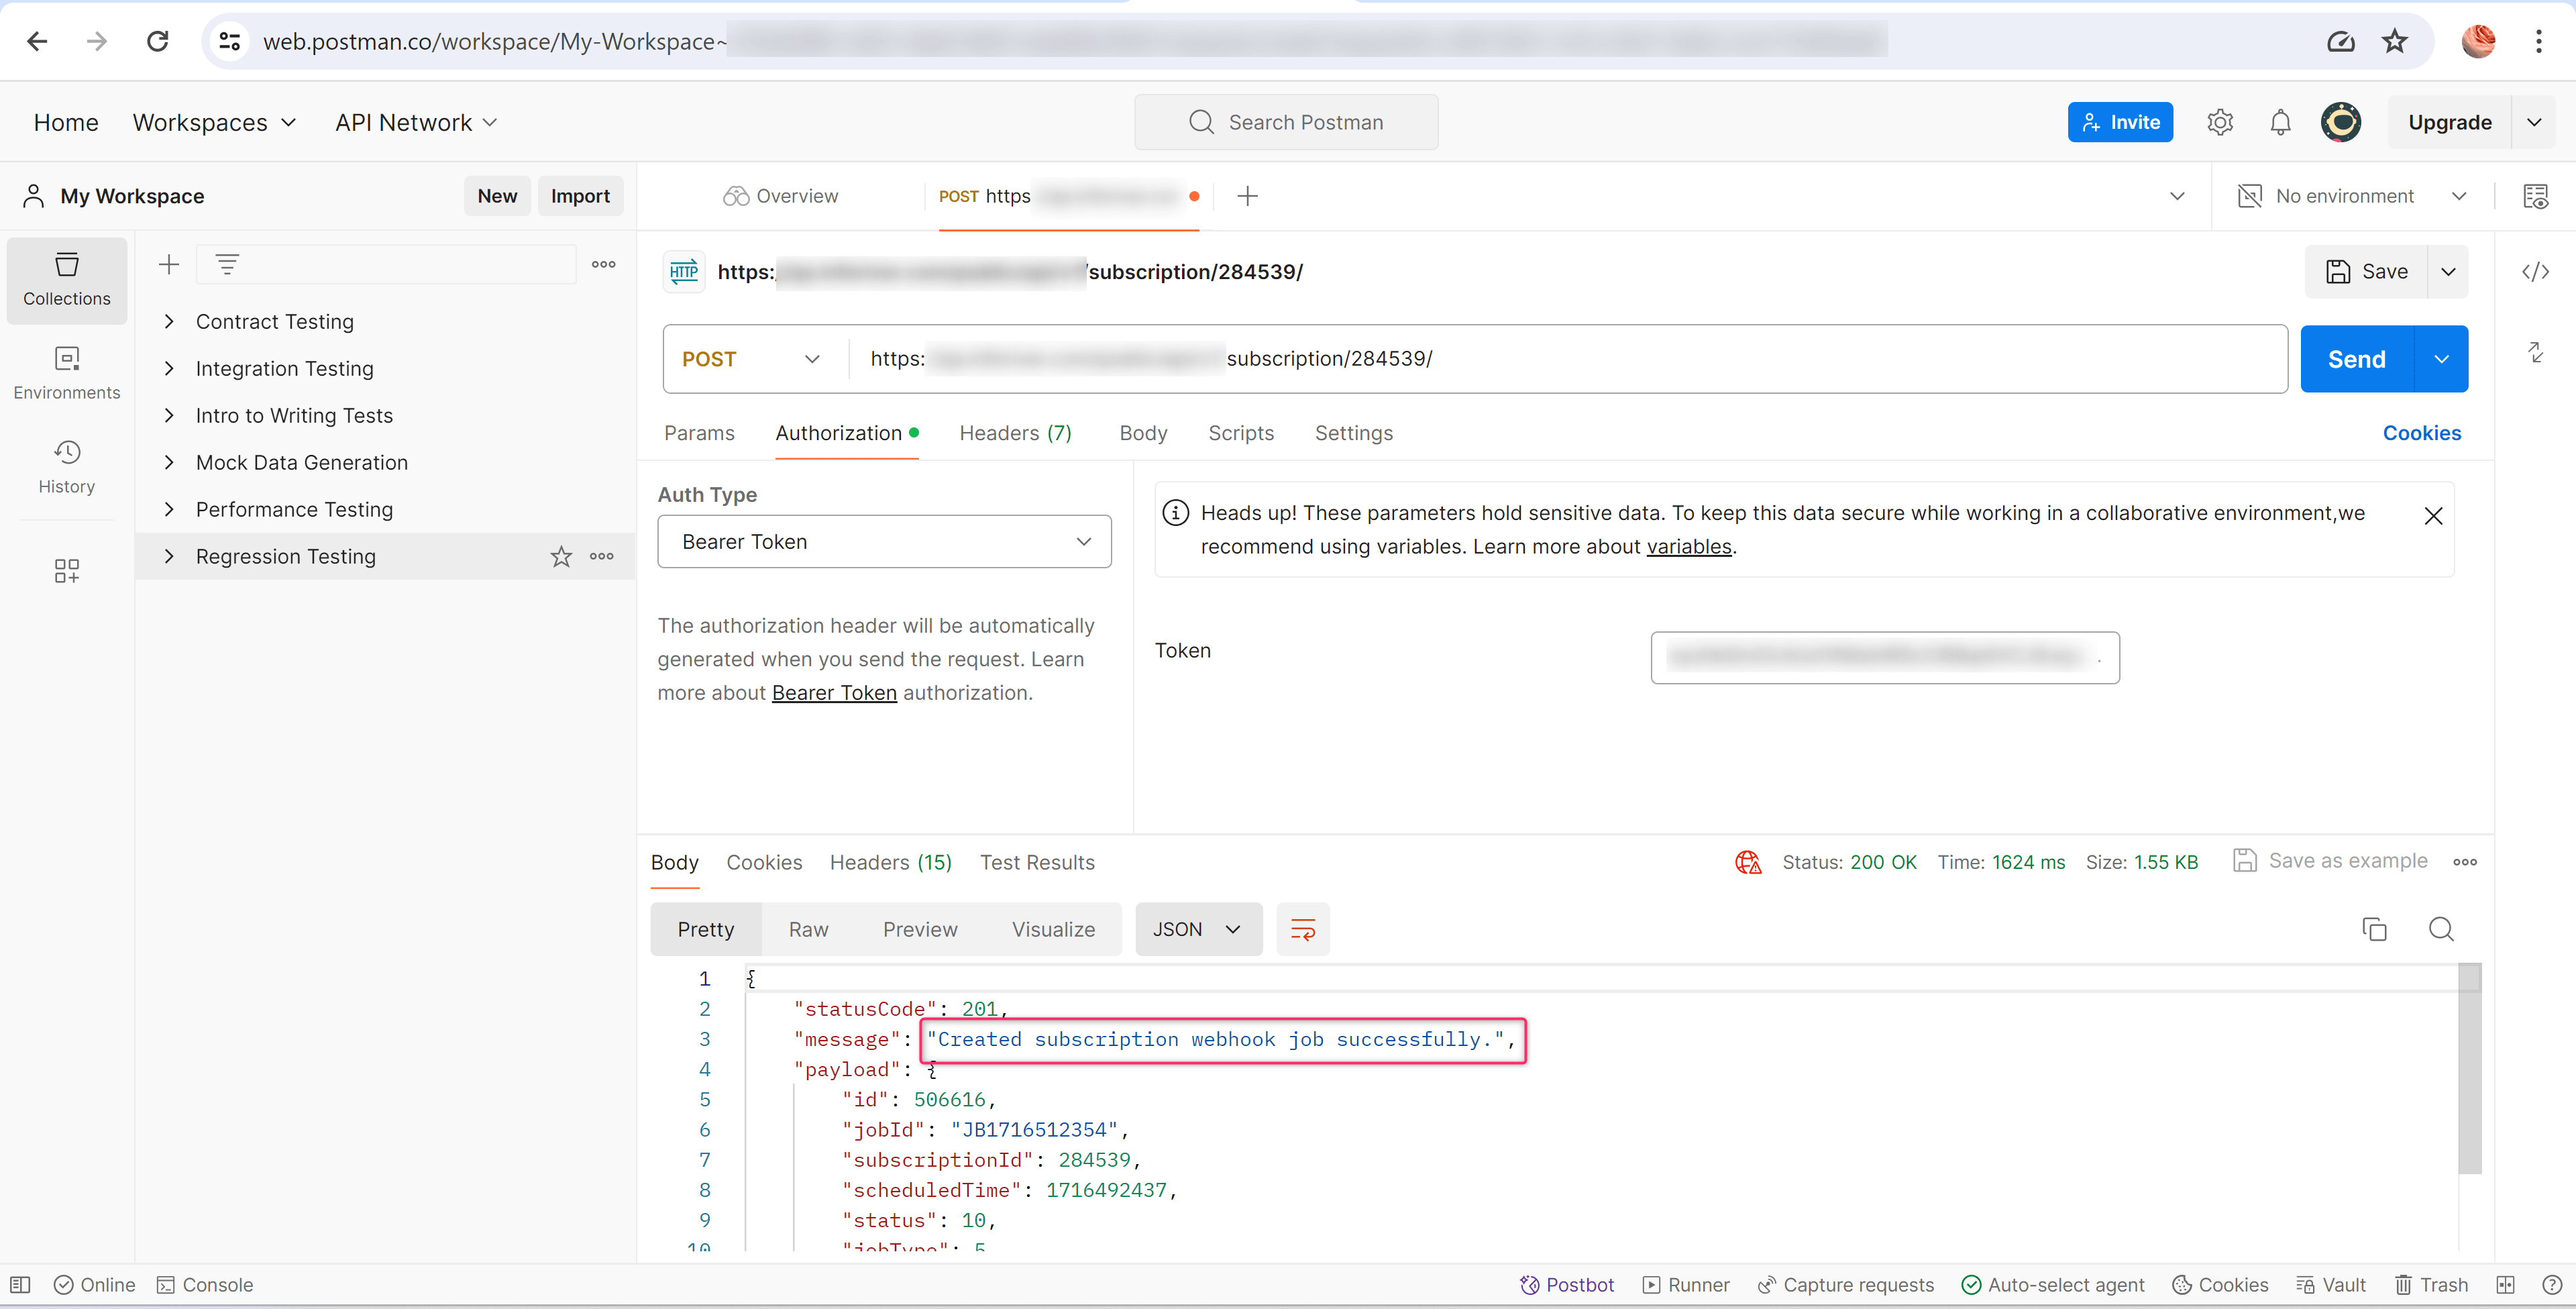
By integrating the created API token into the required application, you can create an API that triggers the required subscription job. The Postman application demonstrates this below.
You can also generate API tokens to sync the semantic data input model included in your report. In the API token management screen, check the ‘Refresh Semantic Data Input’ option and generate the token.
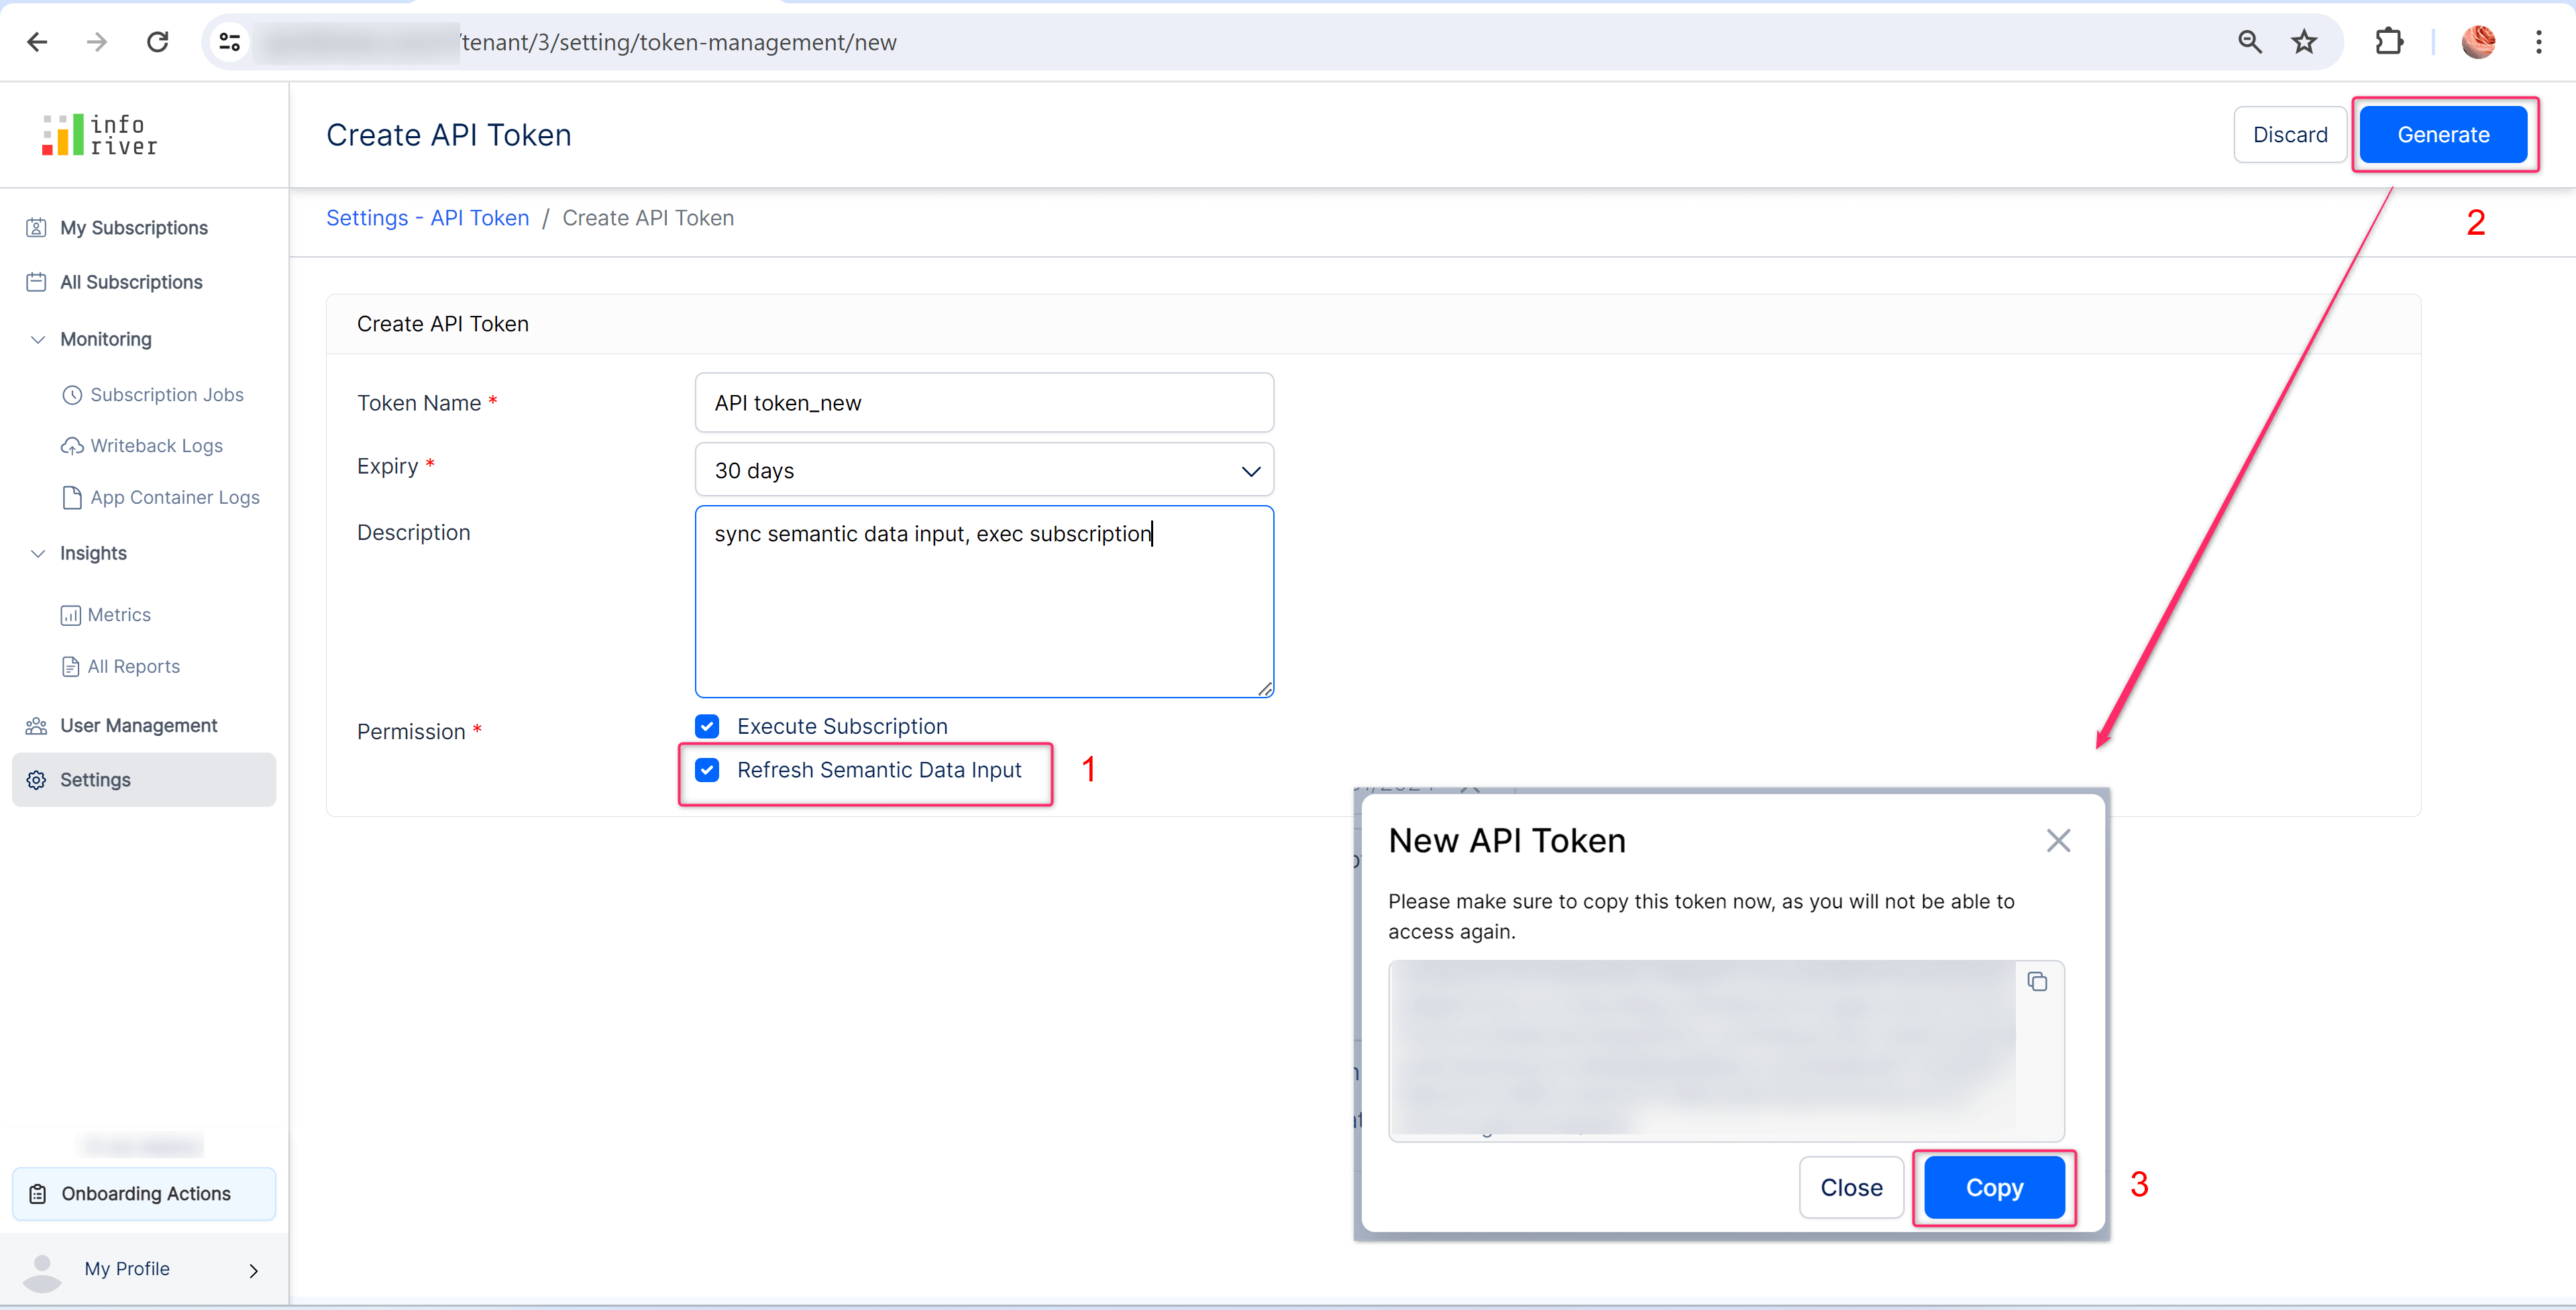
This token can create an API that refreshes the semantic data input source used in your report to make the latest data available.
The following sample report has a single-select data input column and uses a semantic data input model. Instead of a scheduled refresh, the semantic model is set to be refreshed manually by the user when required.
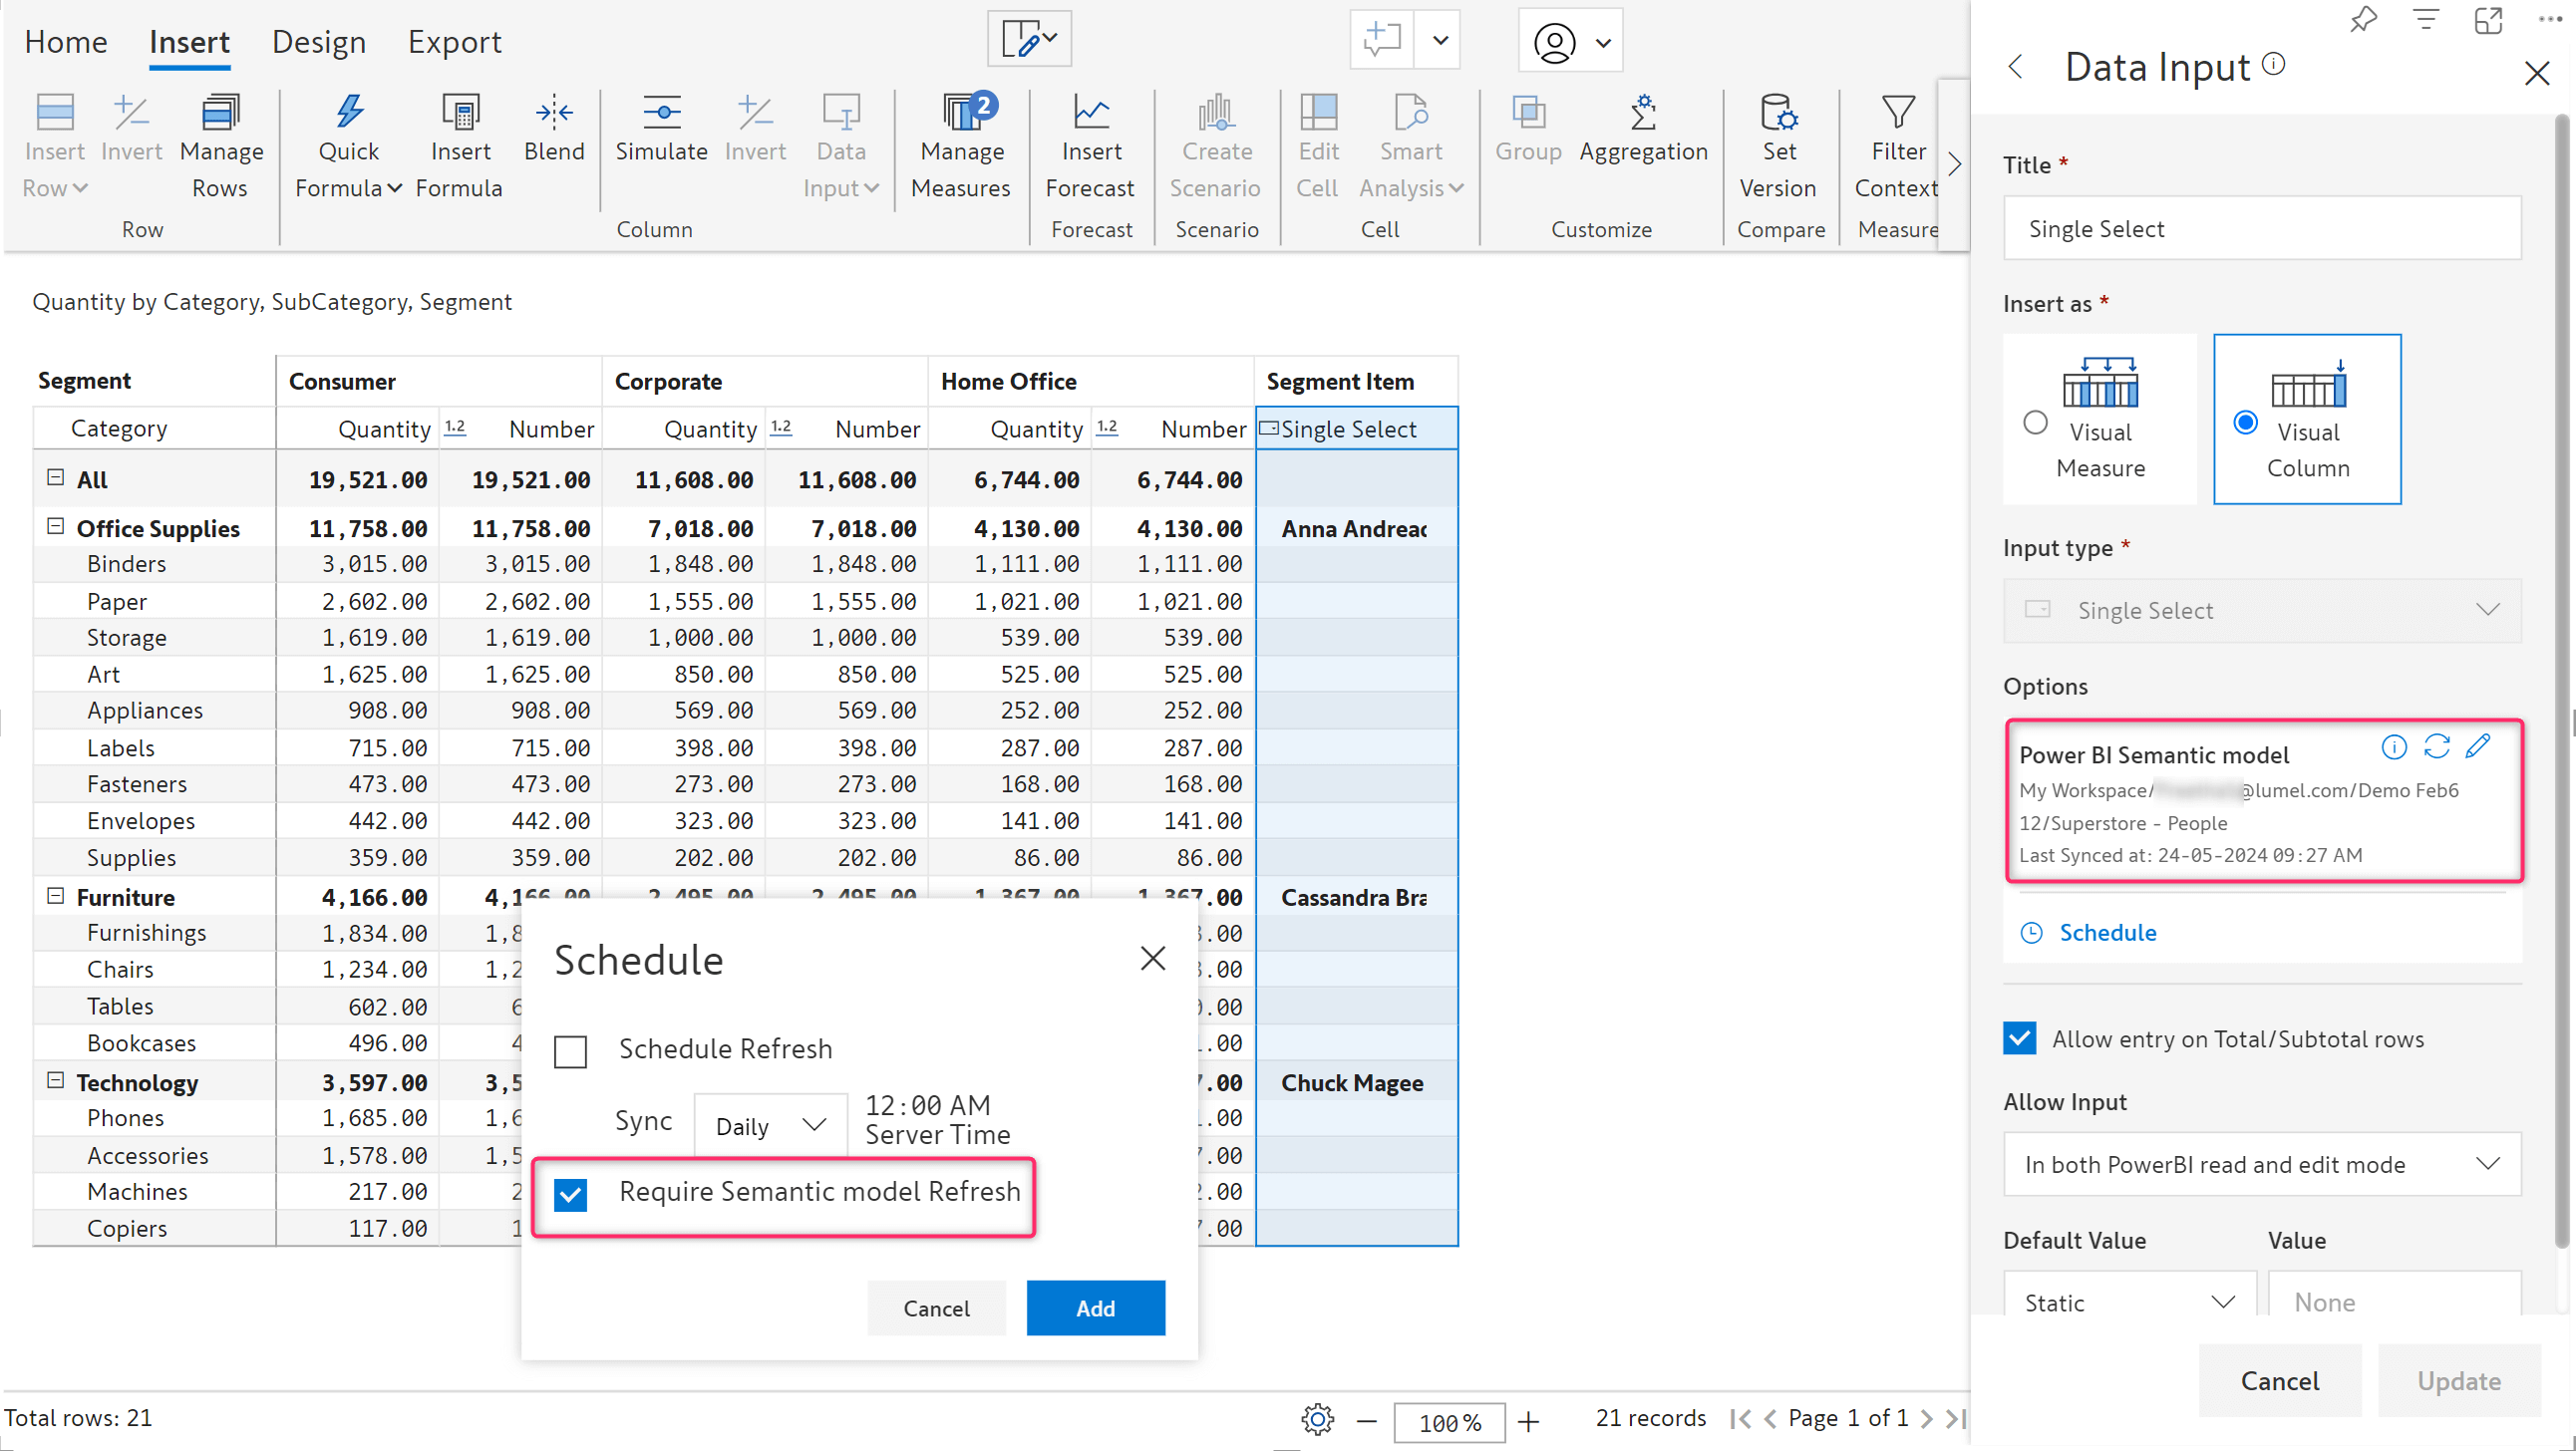
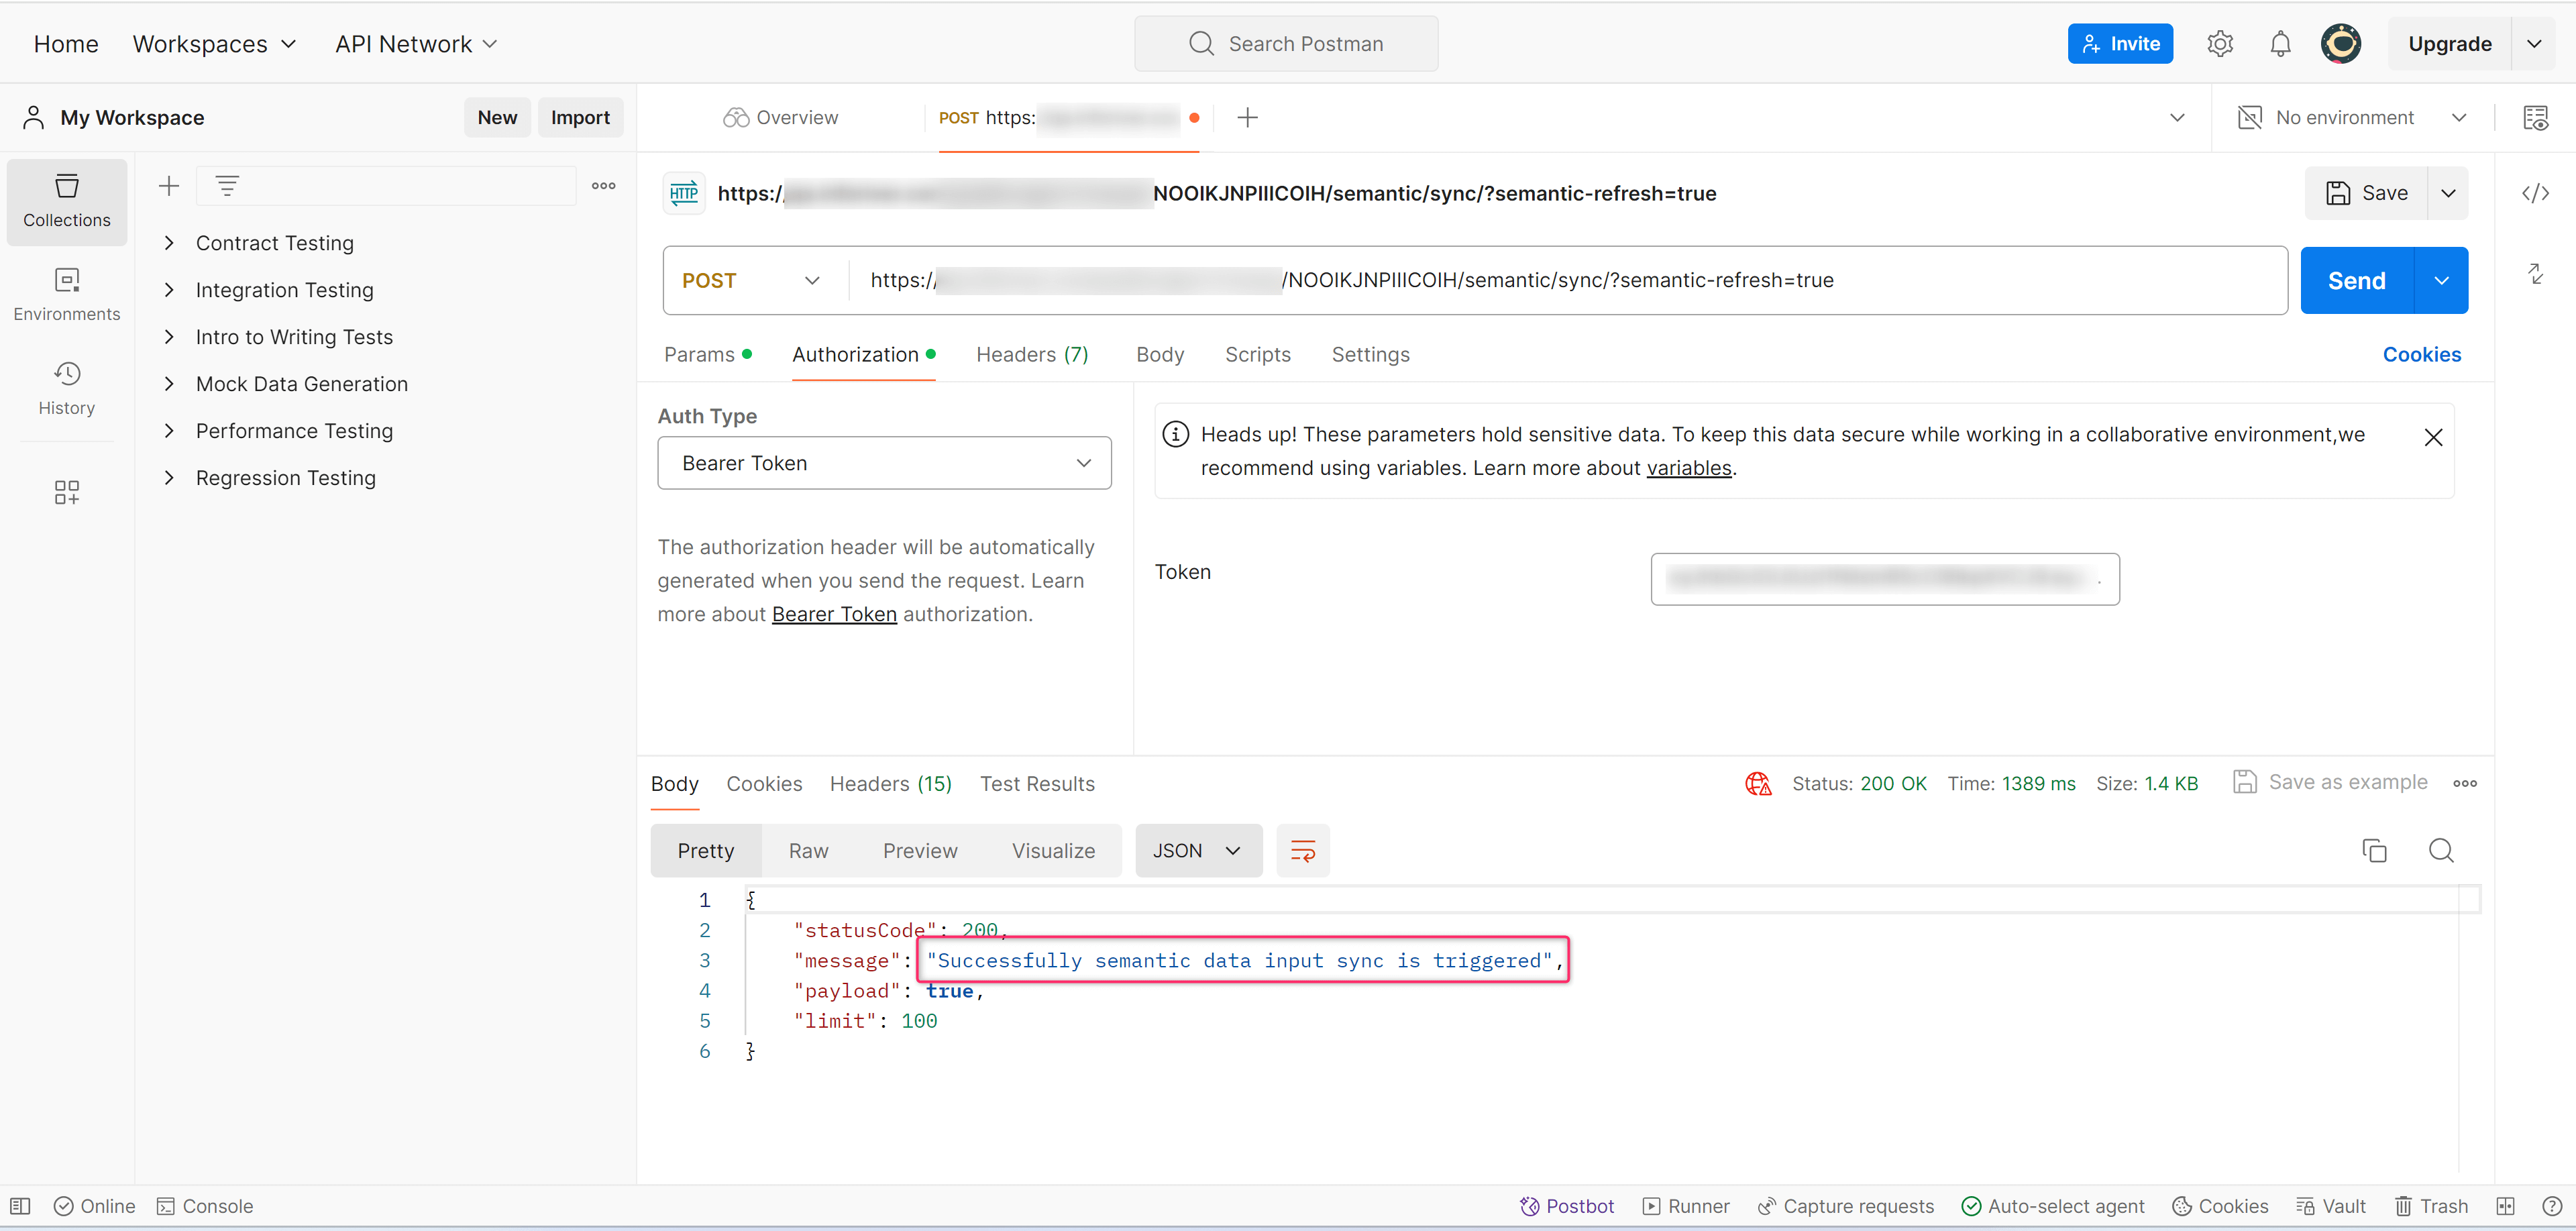
With the API token, we have triggered the synchronization of the semantic data input model, as demonstrated below using Postman.
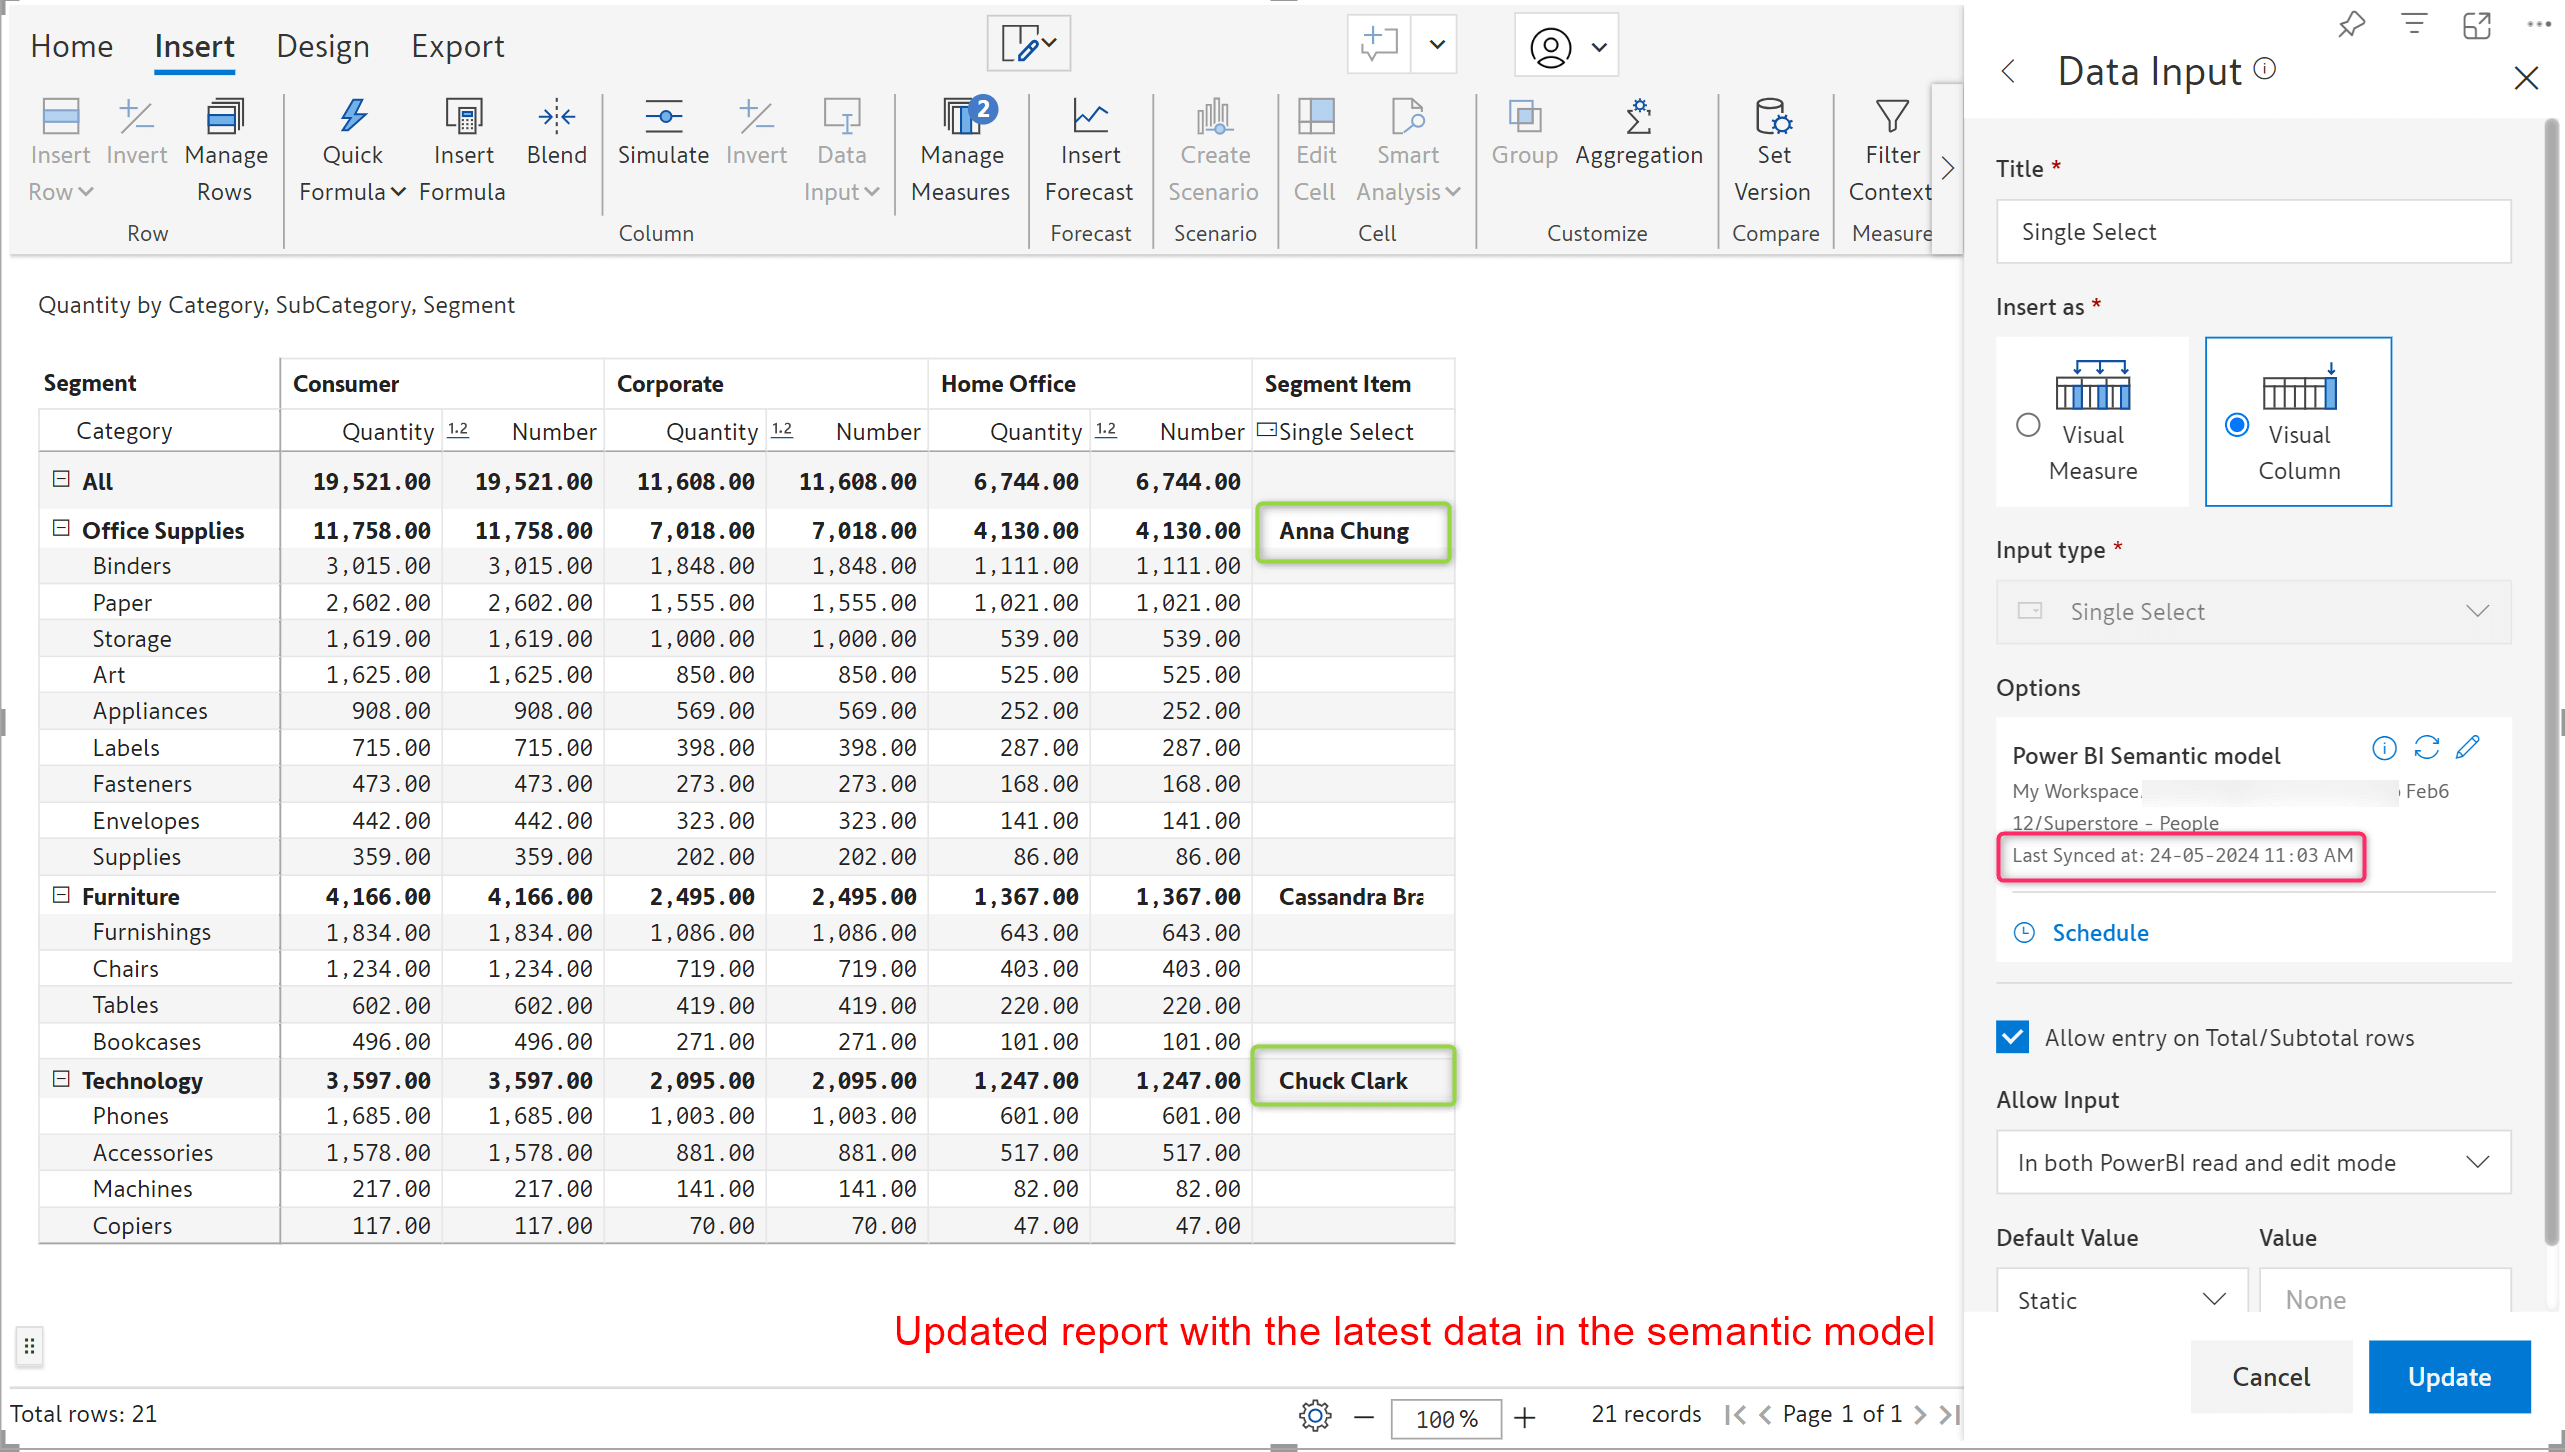
The data is refreshed, which can be verified from the updated report.
With that, we conclude the 2.9.8 Enterprise release updates.
Your support and feedback enabled us to continuously refine Inforiver. We look forward to your suggestions and have many more exciting innovations lined up! Visit the Inforiver Community to share your ideas, vote on others’ submissions, and interact with other users.
*Inforiver Enterprise has been renamed to Writeback Matrix. Learn more.

Inforiver helps enterprises consolidate planning, reporting & analytics on a single platform (Power BI). The no-code, self-service award-winning platform has been recognized as the industry’s best and is adopted by many Fortune 100 firms.
Inforiver is a product of Lumel, the #1 Power BI AppSource Partner. The firm serves over 3,000 customers worldwide through its portfolio of products offered under the brands Inforiver, EDITable, ValQ, and xViz.