Upcoming webinar on 'Inforiver Charts : The fastest way to deliver stories in Power BI', Aug 29th , Monday, 10.30 AM CST. Register Now
Upcoming webinar on 'Inforiver Charts : The fastest way to deliver stories in Power BI', Aug 29th , Monday, 10.30 AM CST. Register Now
When working with large datasets in Power BI, displaying thousands of records in a single table can quickly lead to endless scrolling and a cluttered reporting experience.
For detailed transactional, operational, and financial reports, users need an efficient way to navigate large volumes of data without compromising readability. However, Microsoft Power BI's native table and matrix visuals do not provide built-in, configurable pagination.
Pagination lets users view large datasets one page at a time, making it easier to navigate and review detailed tables.
With Inforiver Premium Table, pagination is built directly into the visual, allowing you to create clean, report-style layouts for large flat datasets without DAX or custom development.
Traditional Power BI tables and matrices rely primarily on continuous scrolling when displaying large datasets. As the number of records increases, this can create several challenges:
For business users working with hundreds or thousands of records, simply scrolling through a large table is not always the most effective way to consume information.
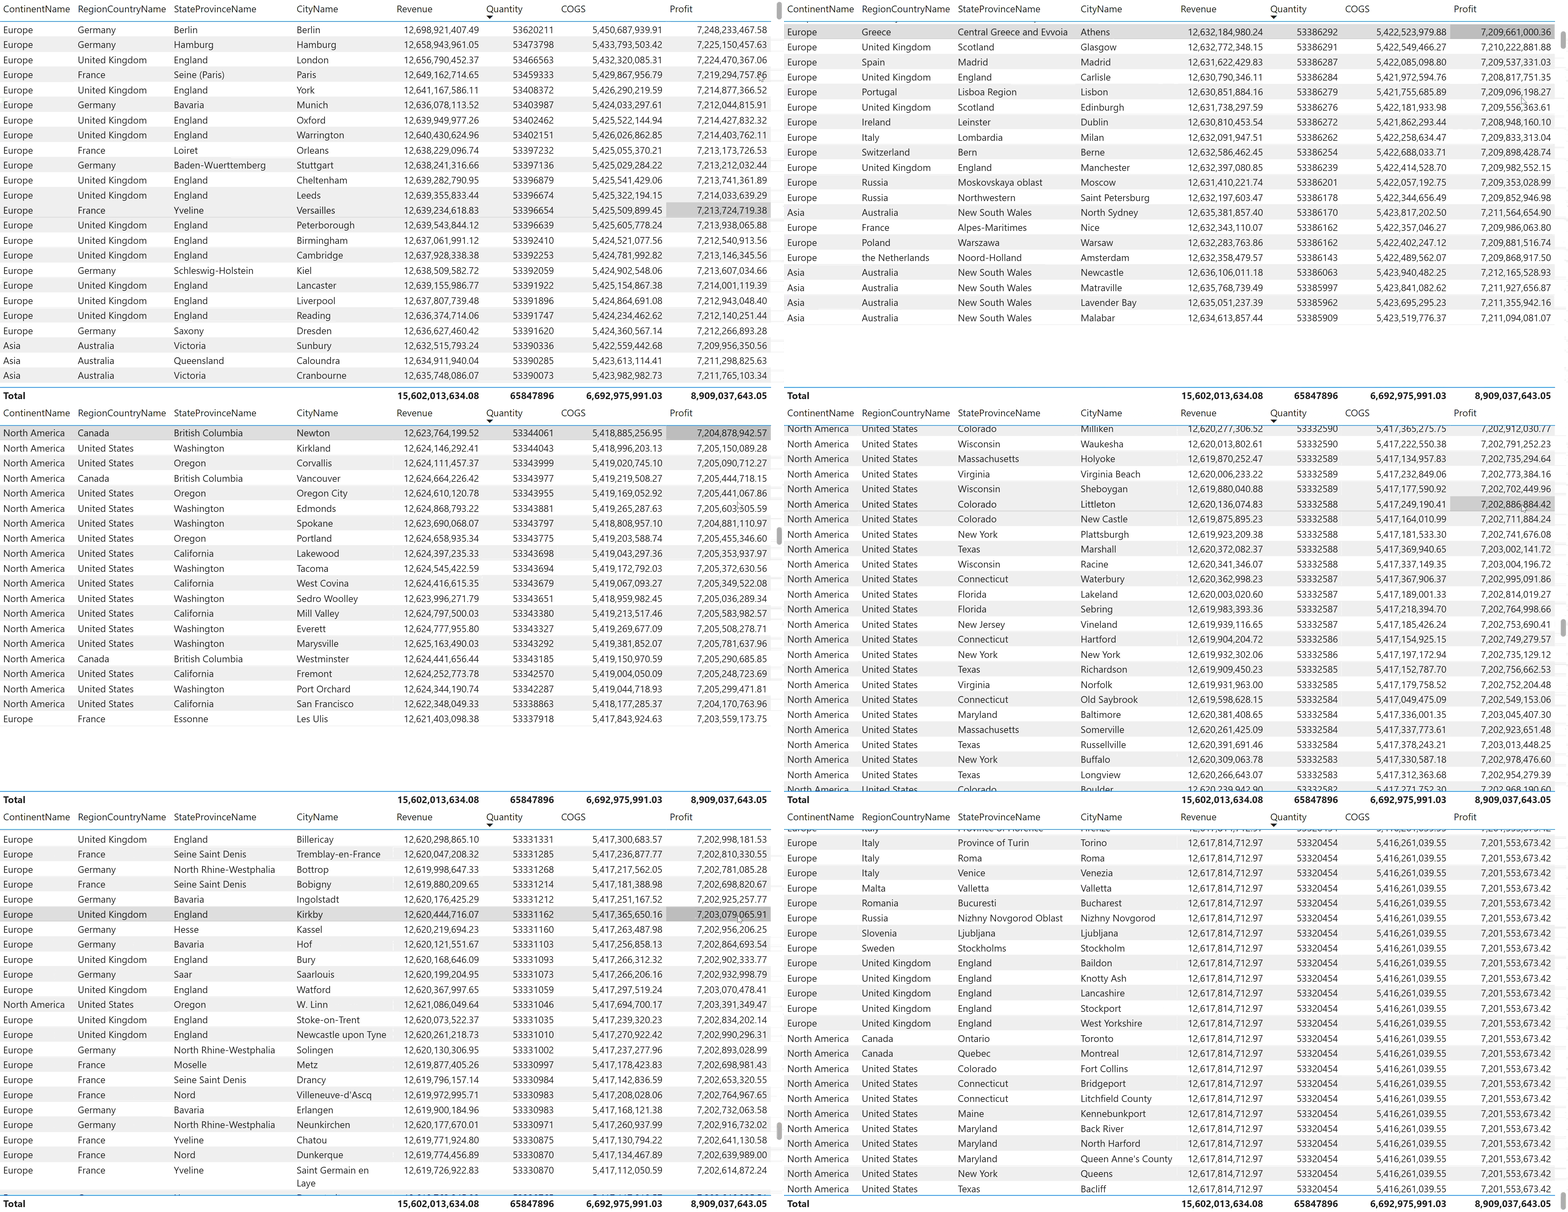
Pagination divides a large dataset into smaller, manageable pages instead of displaying all records in one continuously scrollable table.
For example, a report containing 1,000 records can display 50 or 100 records per page. Users can then navigate between pages to access the remaining records.
Unlike continuous scrolling, pagination provides a more structured reporting experience. It is particularly useful when tables need to resemble traditional business reports, where users review a defined set of records at a time.
Pagination is especially useful for flat Power BI tables containing detailed transactional or operational data where hierarchy and drill-down are not required.
Pagination can improve the overall reporting experience by helping users:
For business reports with large volumes of detailed data, these improvements can make reports easier to consume and work with.
Native Power BI tables and matrices do not provide configurable, interactive pagination in the same way that dedicated reporting visuals can.
As a result, users may need to rely on workarounds or additional report design techniques when they want a paginated experience for detailed tables.
Inforiver Premium Table provides pagination directly within the visual, eliminating the need for custom development or complex workarounds.
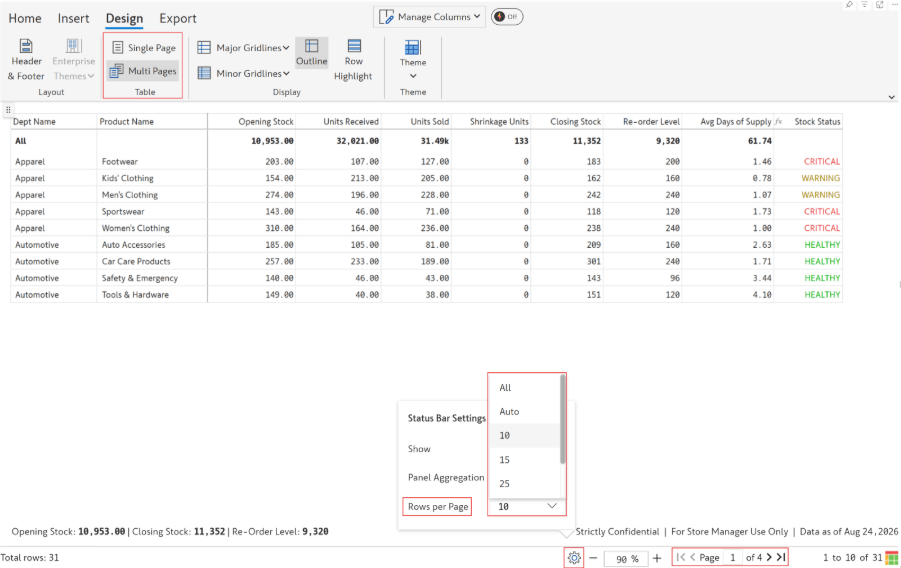
Inforiver Premium Table provides built-in pagination designed for large flat tables and report-style layouts.
Pagination can be configured from the Design tab, giving report designers flexibility over how records are presented.
Single Page Mode displays one page of records at a time.
Users can navigate between pages to view different sections of the dataset.
This mode is useful when:
Multi-Page Mode displays multiple pages continuously within the report.
This provides a more fluid browsing experience while still maintaining the structure of individual pages.
It is useful when users need to:
Inforiver Premium Table also allows users to configure the number of rows displayed on each page directly from the status bar.
Users can adjust the rows per page based on their reporting requirements—for example, displaying fewer rows for easier reading or more rows when reviewing large datasets.
This provides flexibility without requiring the report designer to redesign the visual.
Inforiver Premium Table provides several advantages for organizations that need pagination in their Power BI reports:
| Capability | Business Benefit |
| Built directly into Premium Table | Add pagination without introducing another visual or complex workaround |
| No DAX required | Configure pagination without creating additional calculations |
| No custom development | Reduce implementation effort and maintenance |
| Single & Multi-Page modes | Choose the browsing experience based on the reporting requirement |
| Dynamic rows per page | Let users control how much data they see at a time |
| Better export and print experience | Present large datasets in a more structured report format |
| Cleaner report layouts | Keep large datasets organized and easier to consume |
| Improved report usability | Make detailed reports easier for business users to navigate |
| Without Pagination | With Inforiver Pagination |
| Continuous scrolling through large datasets | Records are organized into manageable pages |
| Difficult to navigate large tables | Easier page-by-page navigation |
| Large tables can dominate the report canvas | Cleaner and more structured layouts |
| Users may need to scroll extensively to review records | Users can move directly between pages |
| Less suitable for print-style reporting | Better suited for report-style presentation |
| Large datasets can feel cluttered | Data is presented in focused sections |
| Limited control over how records are presented | Single/Multi-Page modes and configurable rows per page |
Pagination is particularly useful when a Power BI report contains a large number of detailed records that users need to review individually.
Common use cases include:
Pagination provides a more structured way to work with large tables in Power BI. Instead of relying on endless scrolling, users can navigate data in manageable pages, improving readability, usability, and report presentation.
Inforiver Premium Table brings this capability directly into the Power BI reporting experience with Single and Multi-Page modes, configurable rows per page, and built-in pagination—without requiring DAX or custom development.
For organizations working with detailed flat tables, transactional data, and report-style layouts, Inforiver provides a practical way to make large Power BI tables easier to navigate, present, export, and consume.

Inforiver helps enterprises consolidate planning, reporting & analytics on a single platform (Power BI). The no-code, self-service award-winning platform has been recognized as the industry’s best and is adopted by many Fortune 100 firms.
Inforiver is a product of Lumel, the #1 Power BI AppSource Partner. The firm serves over 3,000 customers worldwide through its portfolio of products offered under the brands Inforiver, EDITable, ValQ, and xViz.