
Upcoming webinar on 'Inforiver Charts : The fastest way to deliver stories in Power BI', Aug 29th , Monday, 10.30 AM CST. Register Now
Upcoming webinar on 'Inforiver Charts : The fastest way to deliver stories in Power BI', Aug 29th , Monday, 10.30 AM CST. Register Now
We are pleased to announce that Inforiver charts is featured in the monthly Microsoft Power BI Blog of February 2023 and is now MS Power BI certified. Some highlights from the blog:
Inforiver Charts 2.1, the fastest way to visualize, explore and tell data stories, is now Microsoft Power BI certified. The latest version 2.1 features significant feature updates, user experience (UX) enhancements, and a new developer-only pricing plan that can be directly purchased from Microsoft AppSource. This new pricing plan allows for unlimited viewers and avoids license management & administration hassles.
What’s new in Inforiver Charts 2.1:
1.New visualizations
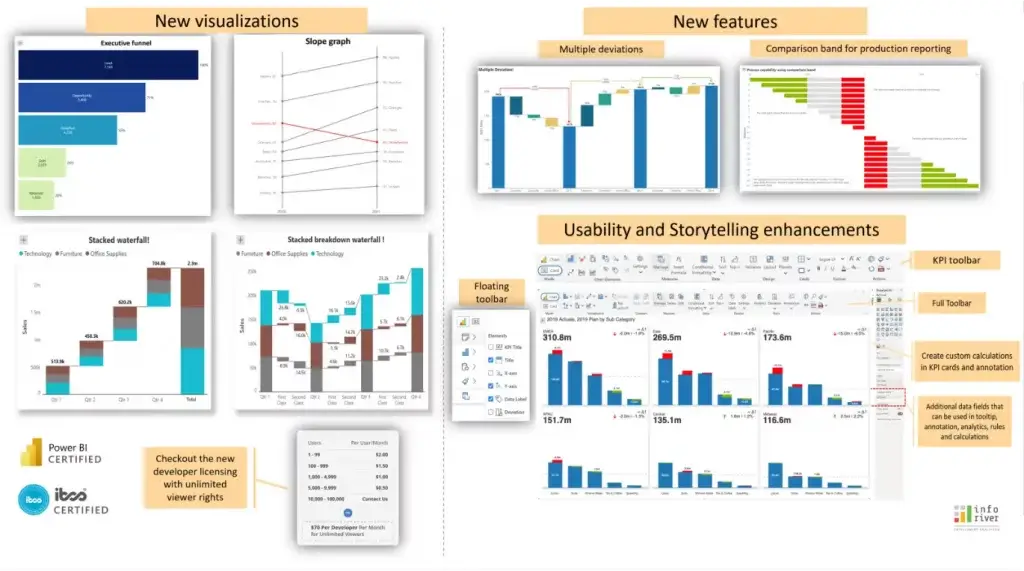
2.New Use Cases
3.Enhanced User experience (UX) and productivity
4.Storytelling enhancements
Customizable legends, titles, KPI card headers, annotations, analytics and more
5.Themes
Choose between classic Power BI-like color themes, IBCS standards or custom themes matching your corporate branding.
See Inforiver Charts demos here.
Please note Inforiver Charts is now Inforiver Analytics+ (Charts + Cards + Tables) Read more. We have suspended developer-based subscription plans from AppSource – for the reasons outlined in detail.

Inforiver helps enterprises consolidate planning, reporting & analytics on a single platform (Power BI). The no-code, self-service award-winning platform has been recognized as the industry’s best and is adopted by many Fortune 100 firms.
Inforiver is a product of Lumel, the #1 Power BI AppSource Partner. The firm serves over 3,000 customers worldwide through its portfolio of products offered under the brands Inforiver, EDITable, ValQ, and xViz.
 Transform Power BI dashboards into decision-driving tools. Discover data visualization best practices tailored for Power BI users.