
Upcoming webinar on 'Inforiver Charts : The fastest way to deliver stories in Power BI', Aug 29th , Monday, 10.30 AM CST. Register Now
Upcoming webinar on 'Inforiver Charts : The fastest way to deliver stories in Power BI', Aug 29th , Monday, 10.30 AM CST. Register Now
The Analytics+ visual has undergone significant optimizations to enhance the ease of use and make your experience smoother. We are releasing features like image support, flexible KPI containers along with a range of new charts. Know more about the innovations that are part of 4.0 here. Given the scale of the release, we would like to keep you apprised of the possible migration impact when upgrading to Analytics+ 4.0.
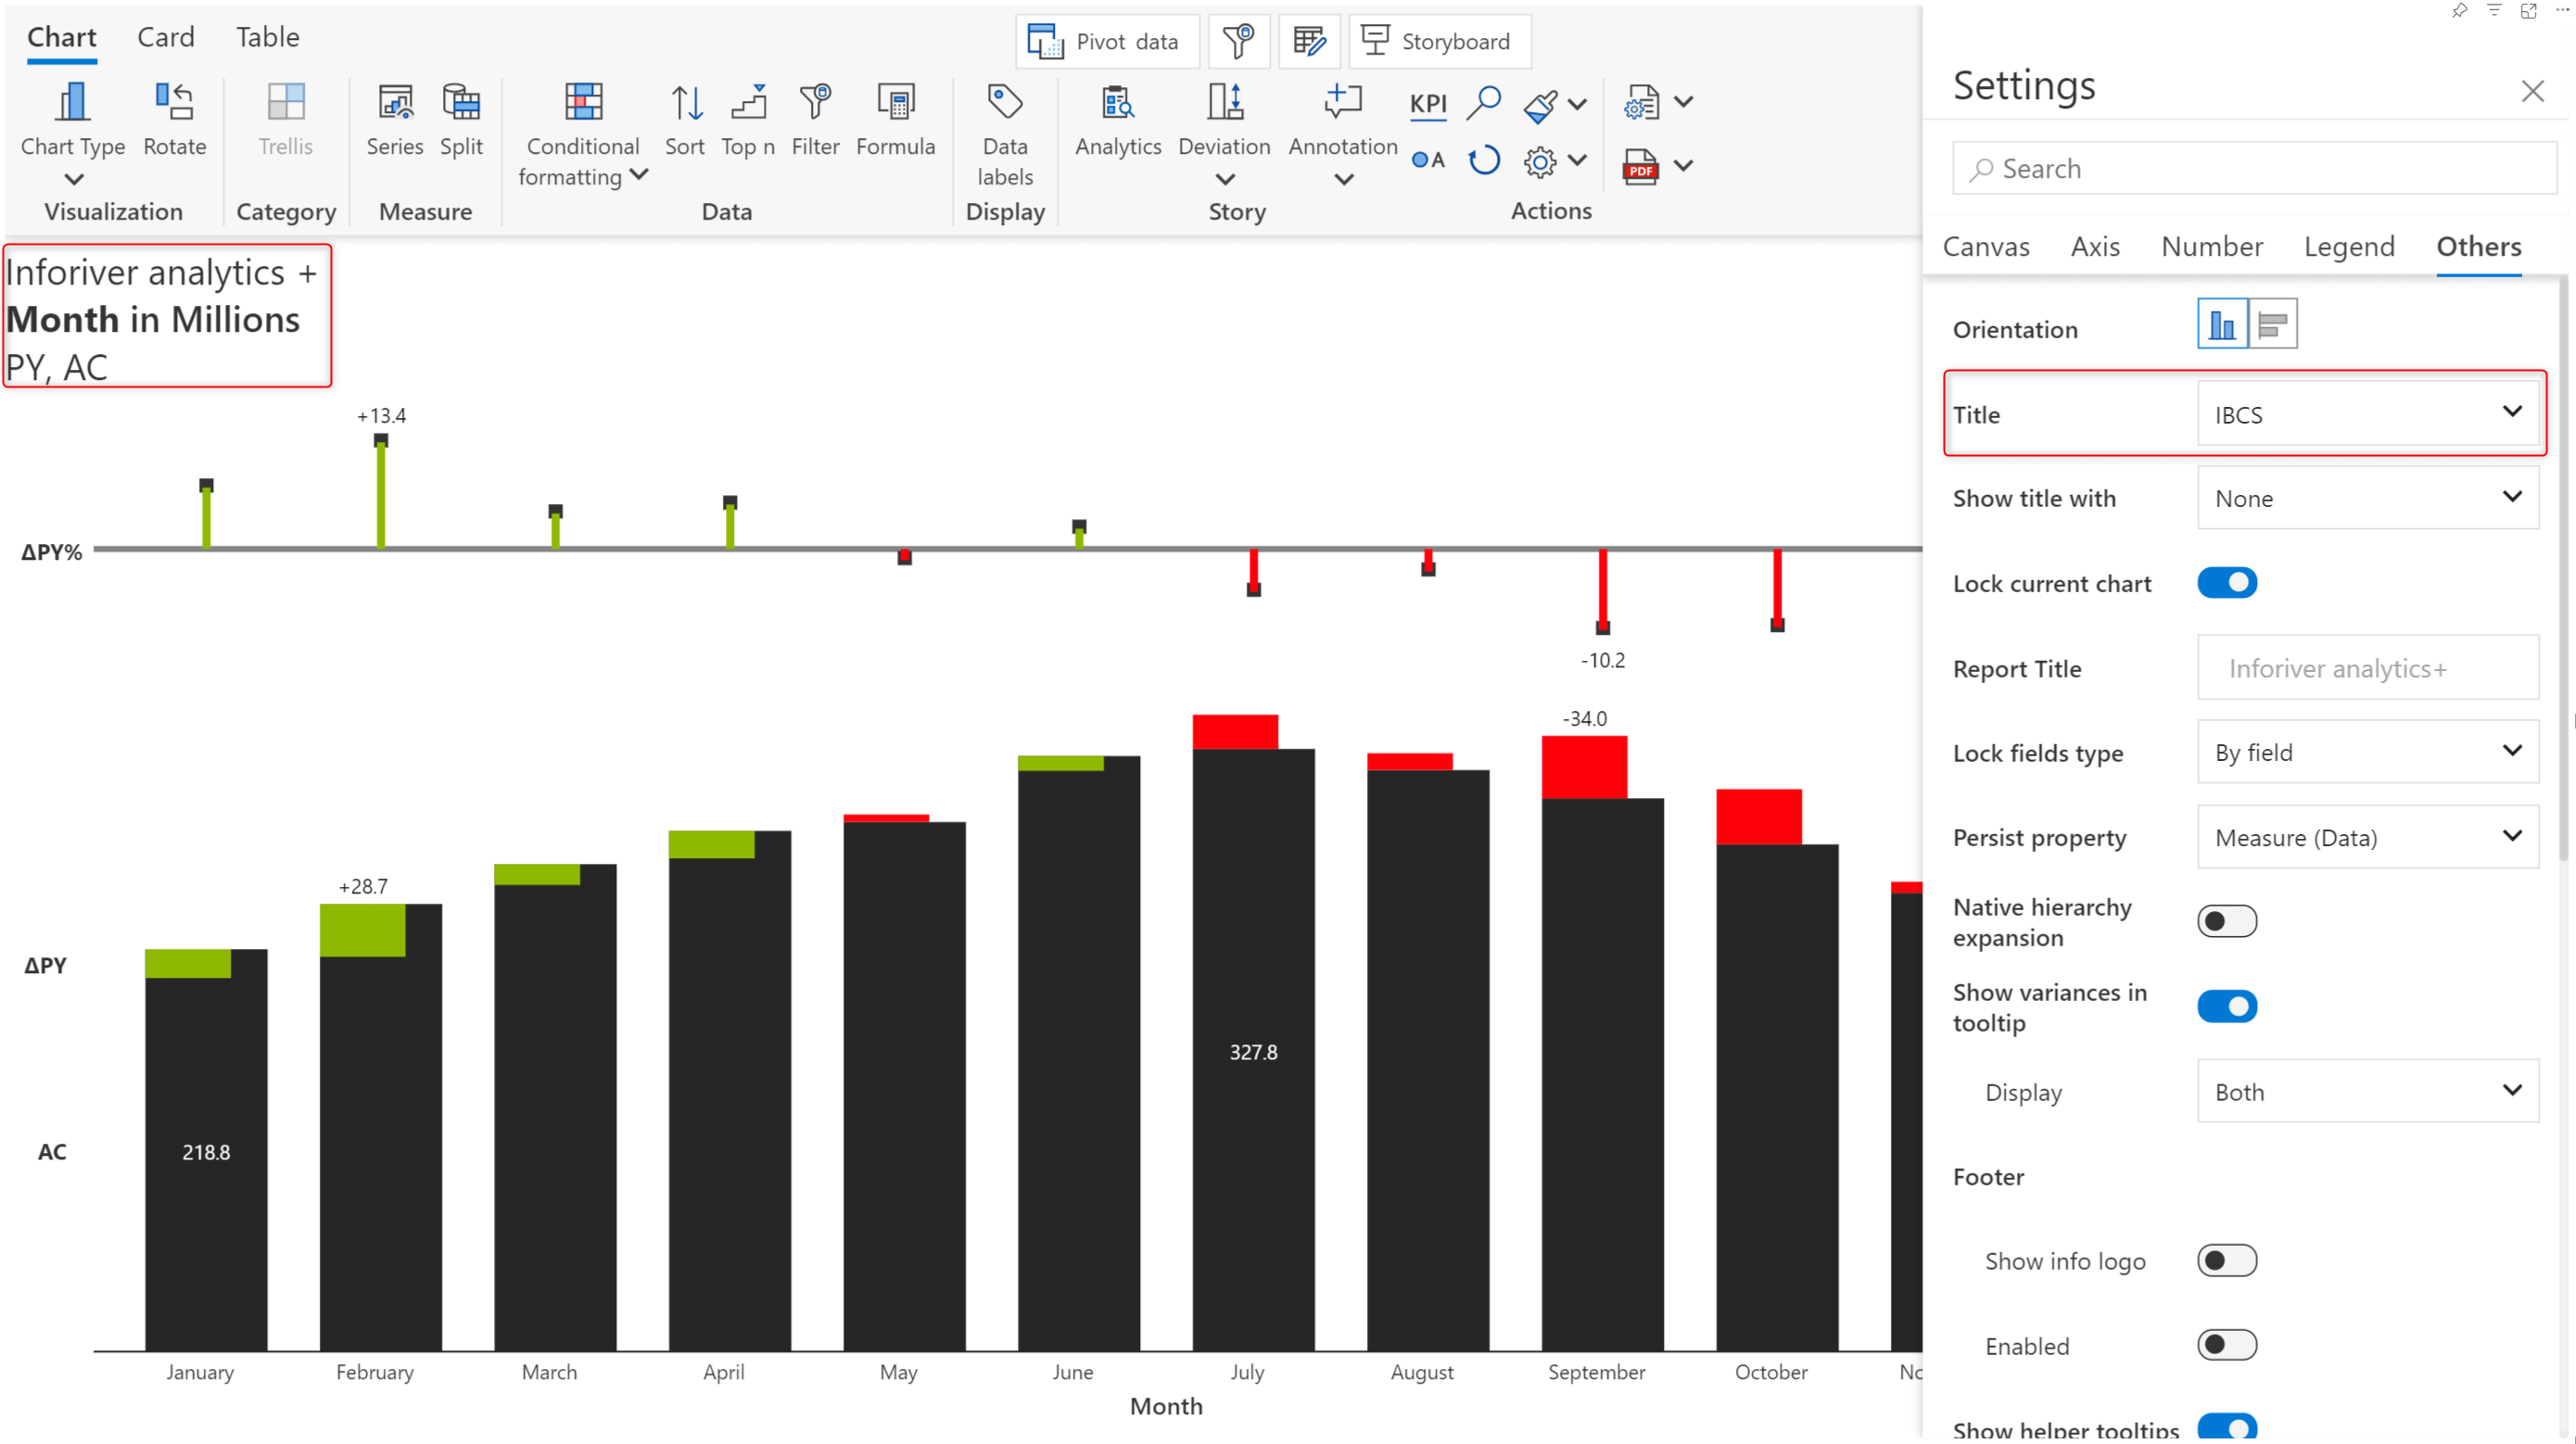
1. IBCS title
When you enforce IBCS for new reports, you’ll notice that the chart title conforms to the prescribed multi-line standard.
If you have customized the title by adding any text, after migrating to 4.0, it will not be retained when you choose the IBCS title option under Other Settings.
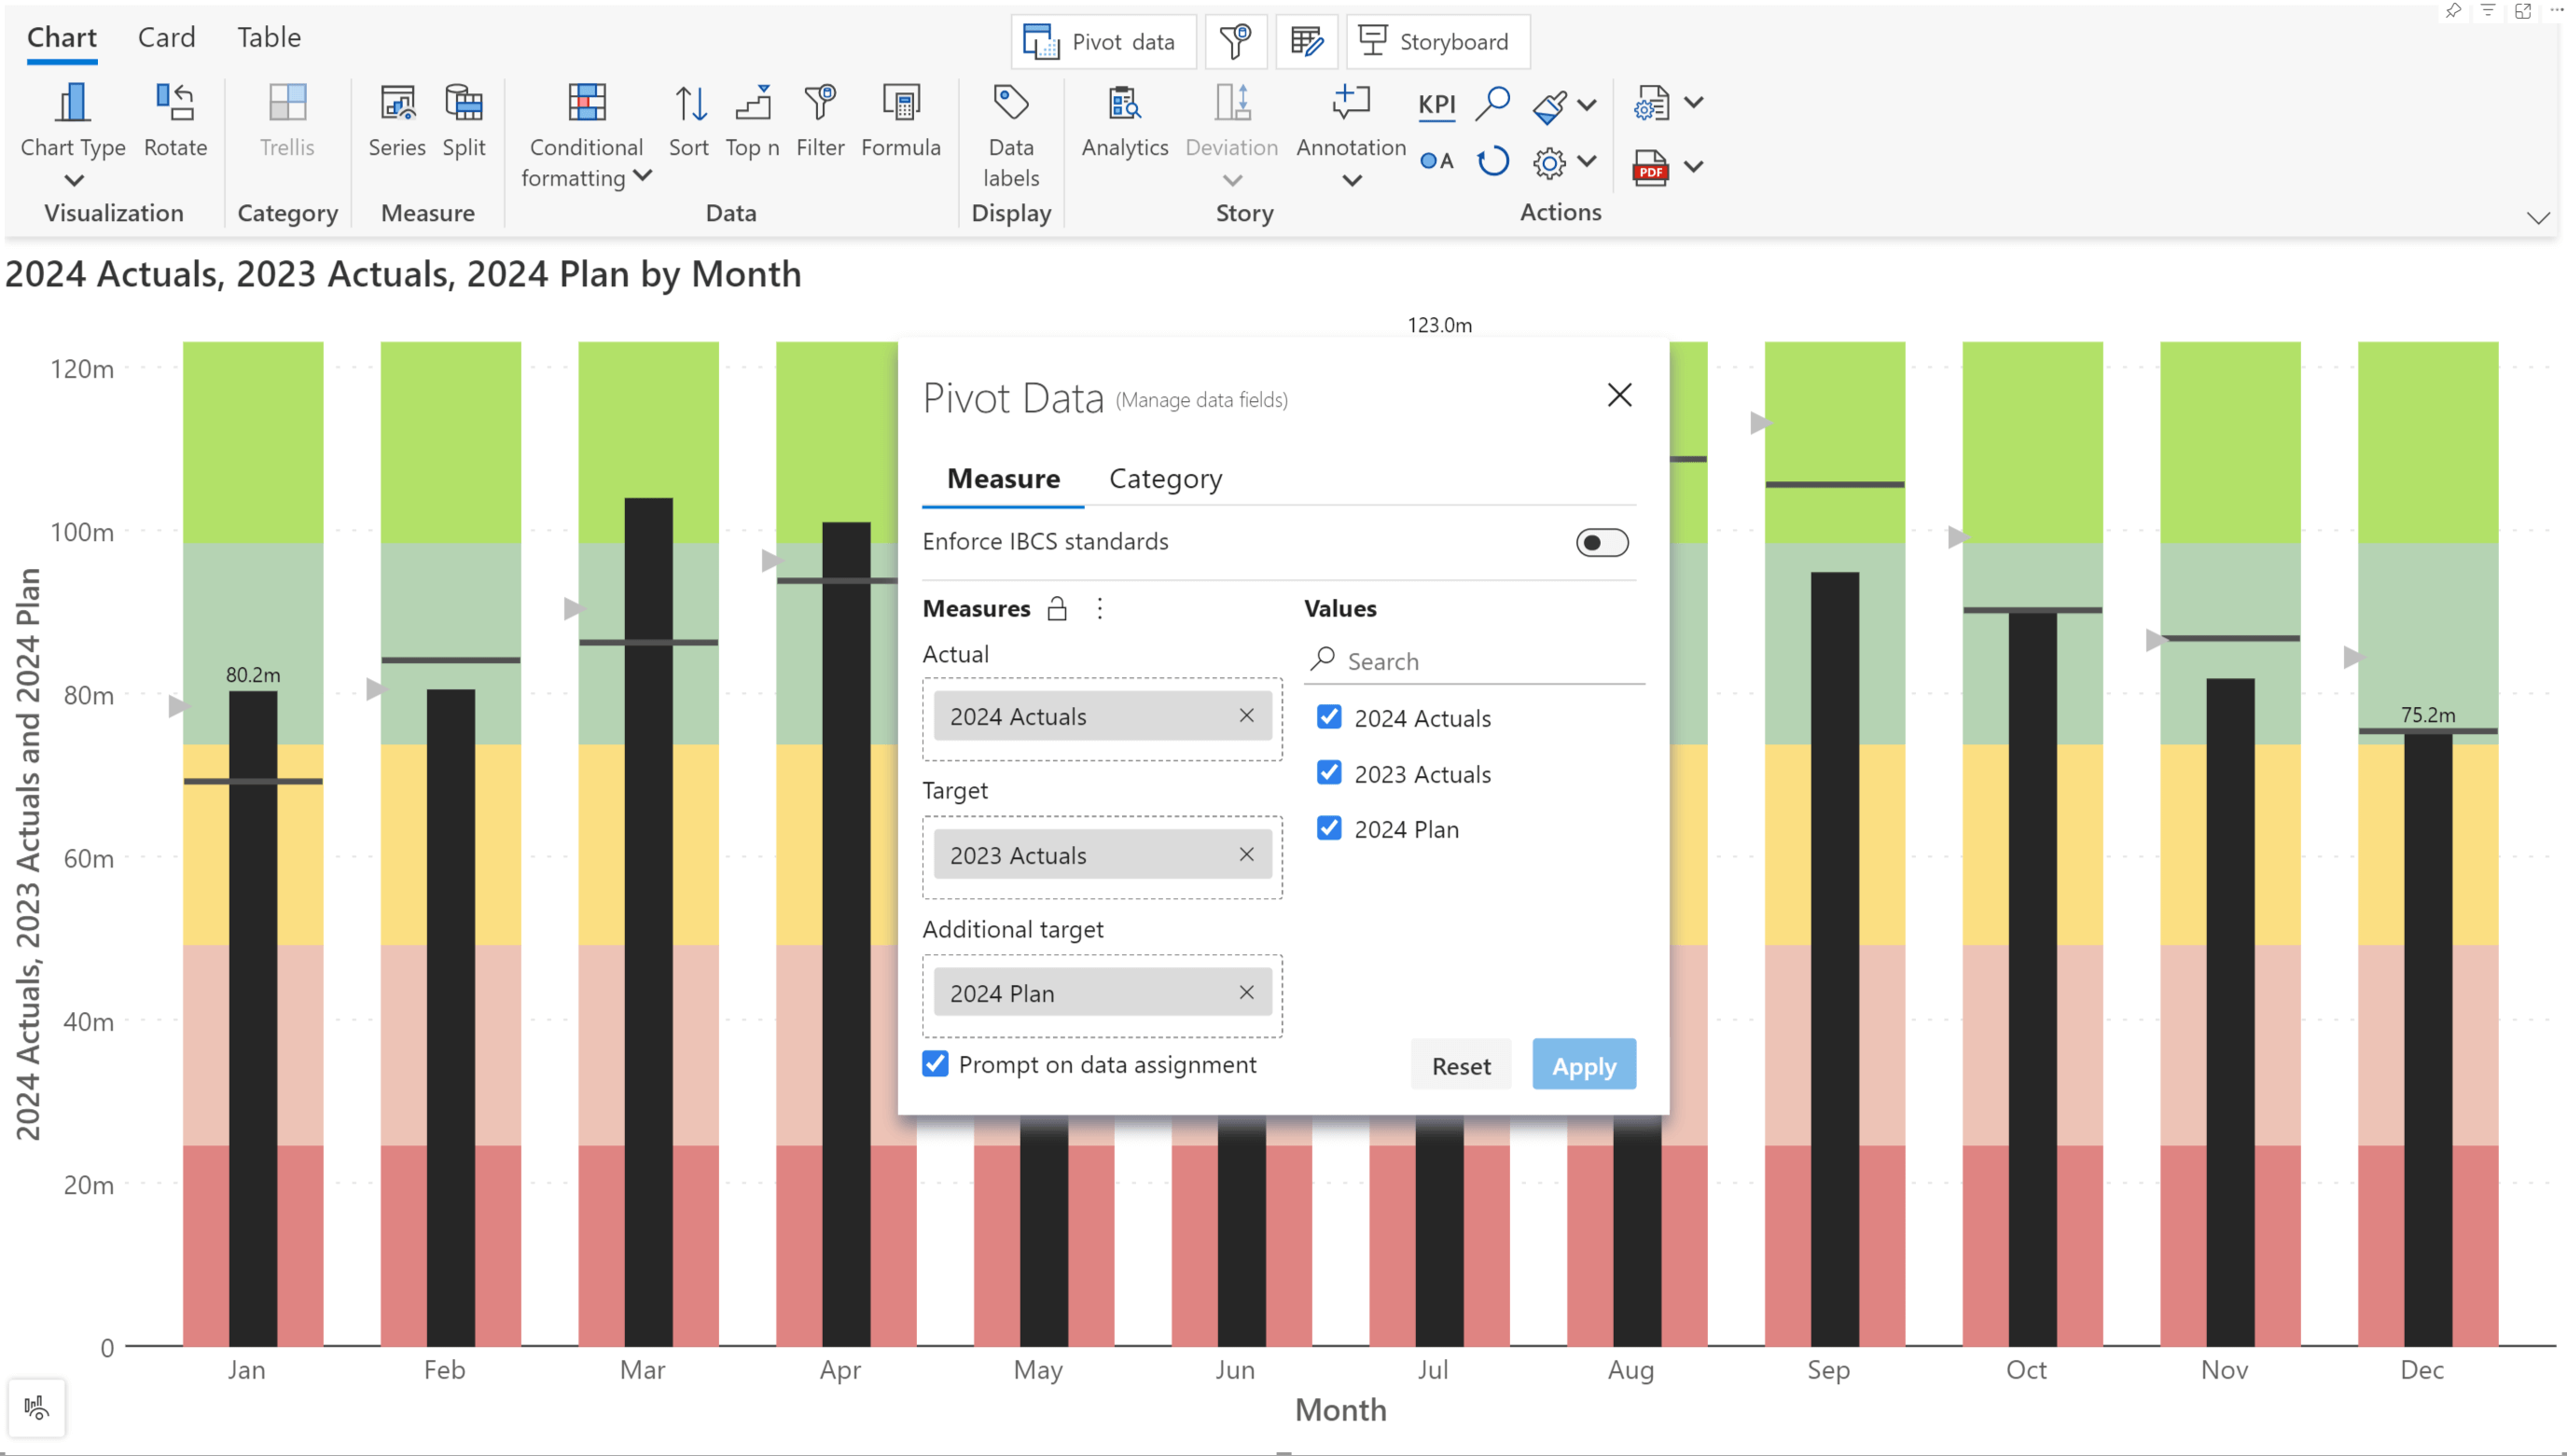
2. Bullet charts
Bullet charts have dedicated pivot data settings that reflect the Actuals, Target, and Additional Target plotted in the chart.
Versions prior to 3.5. had these options under Canvas settings.
3. Tables
You can expect look and feel changes while migrating your tabular reports to 4.0. As we have refactored the Annotations feature - please be mindful that your data point annotations and footnotes may be lost in migration.
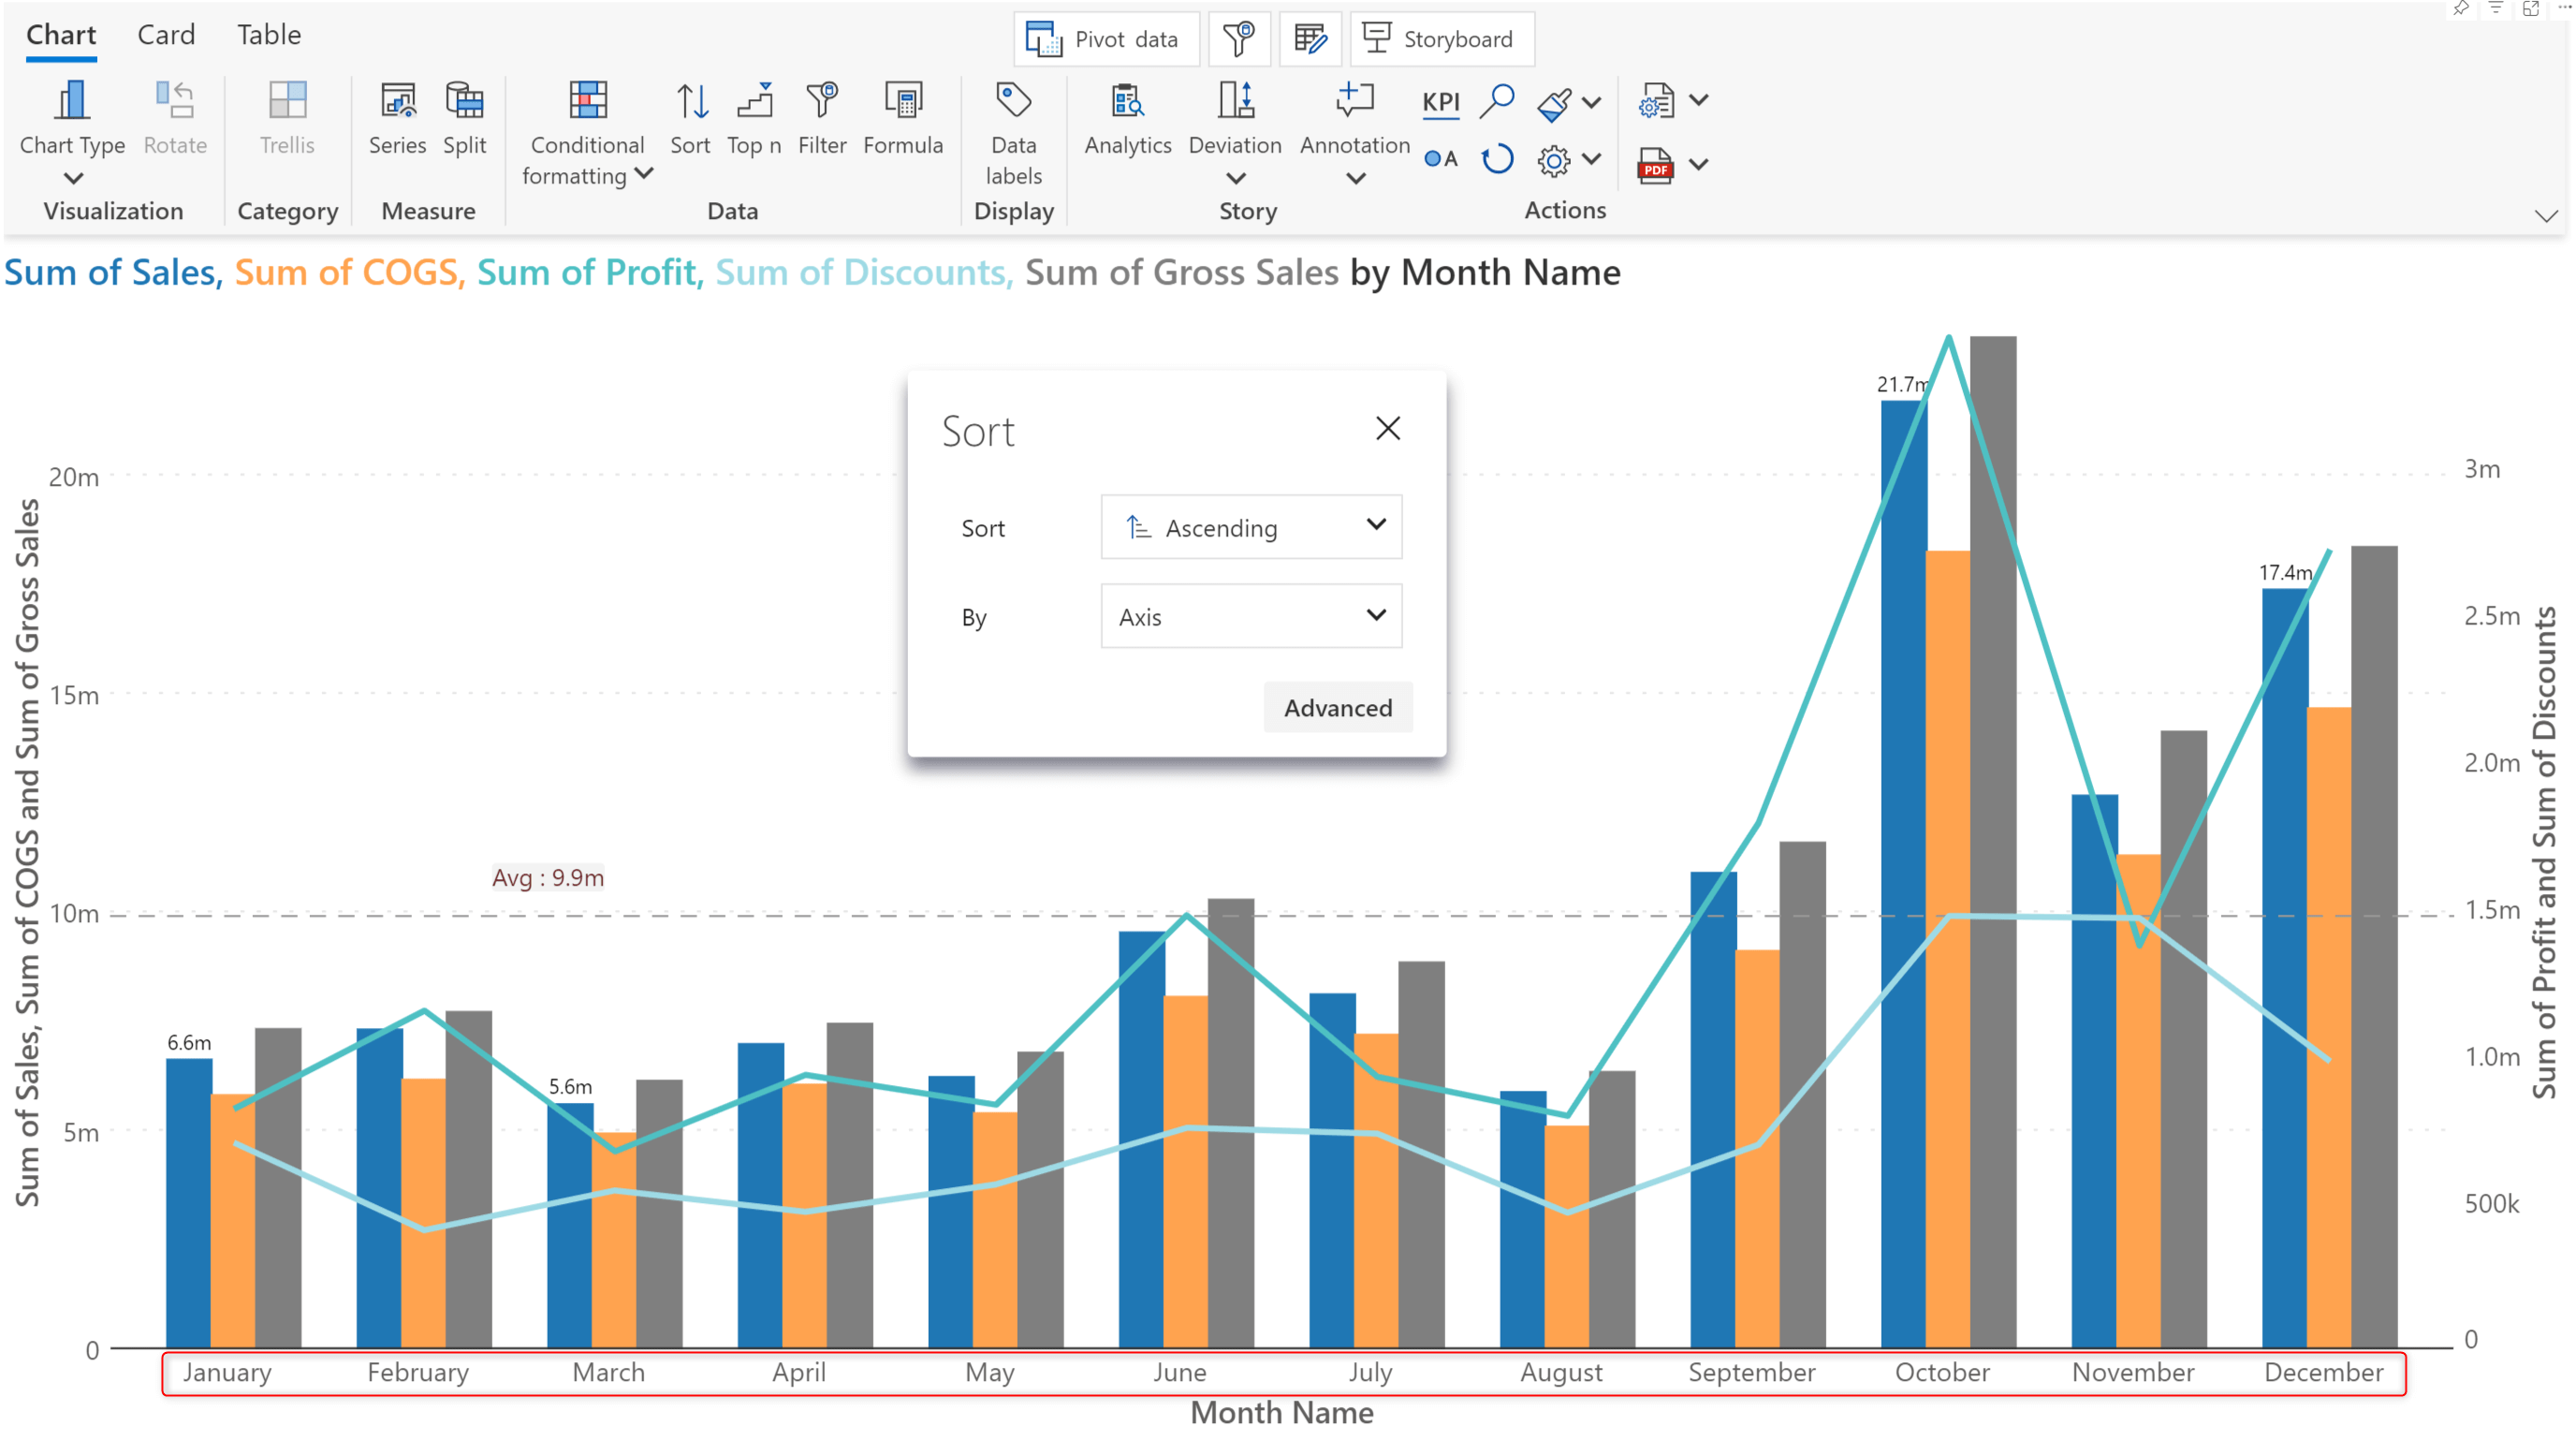
4. Sorting
The default sorting has been changed for time and non-time dimension axis parameters.
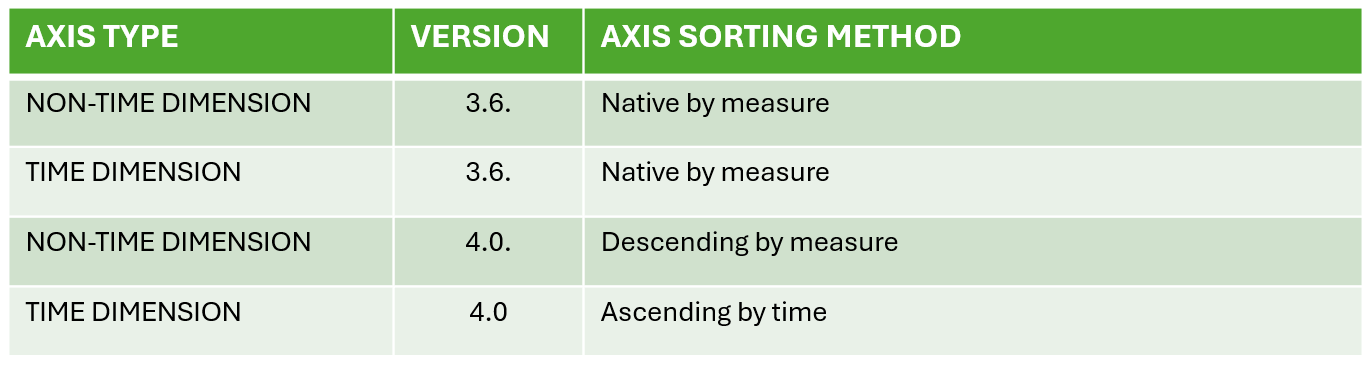
A date hierarchy need not be available in all datasets. You may be using a non-Power BI date format month name as axis parameter. In the 3.6. version, when you apply an ascending sort method based on axis, the month names get sorted alphabetically instead of chronologically.
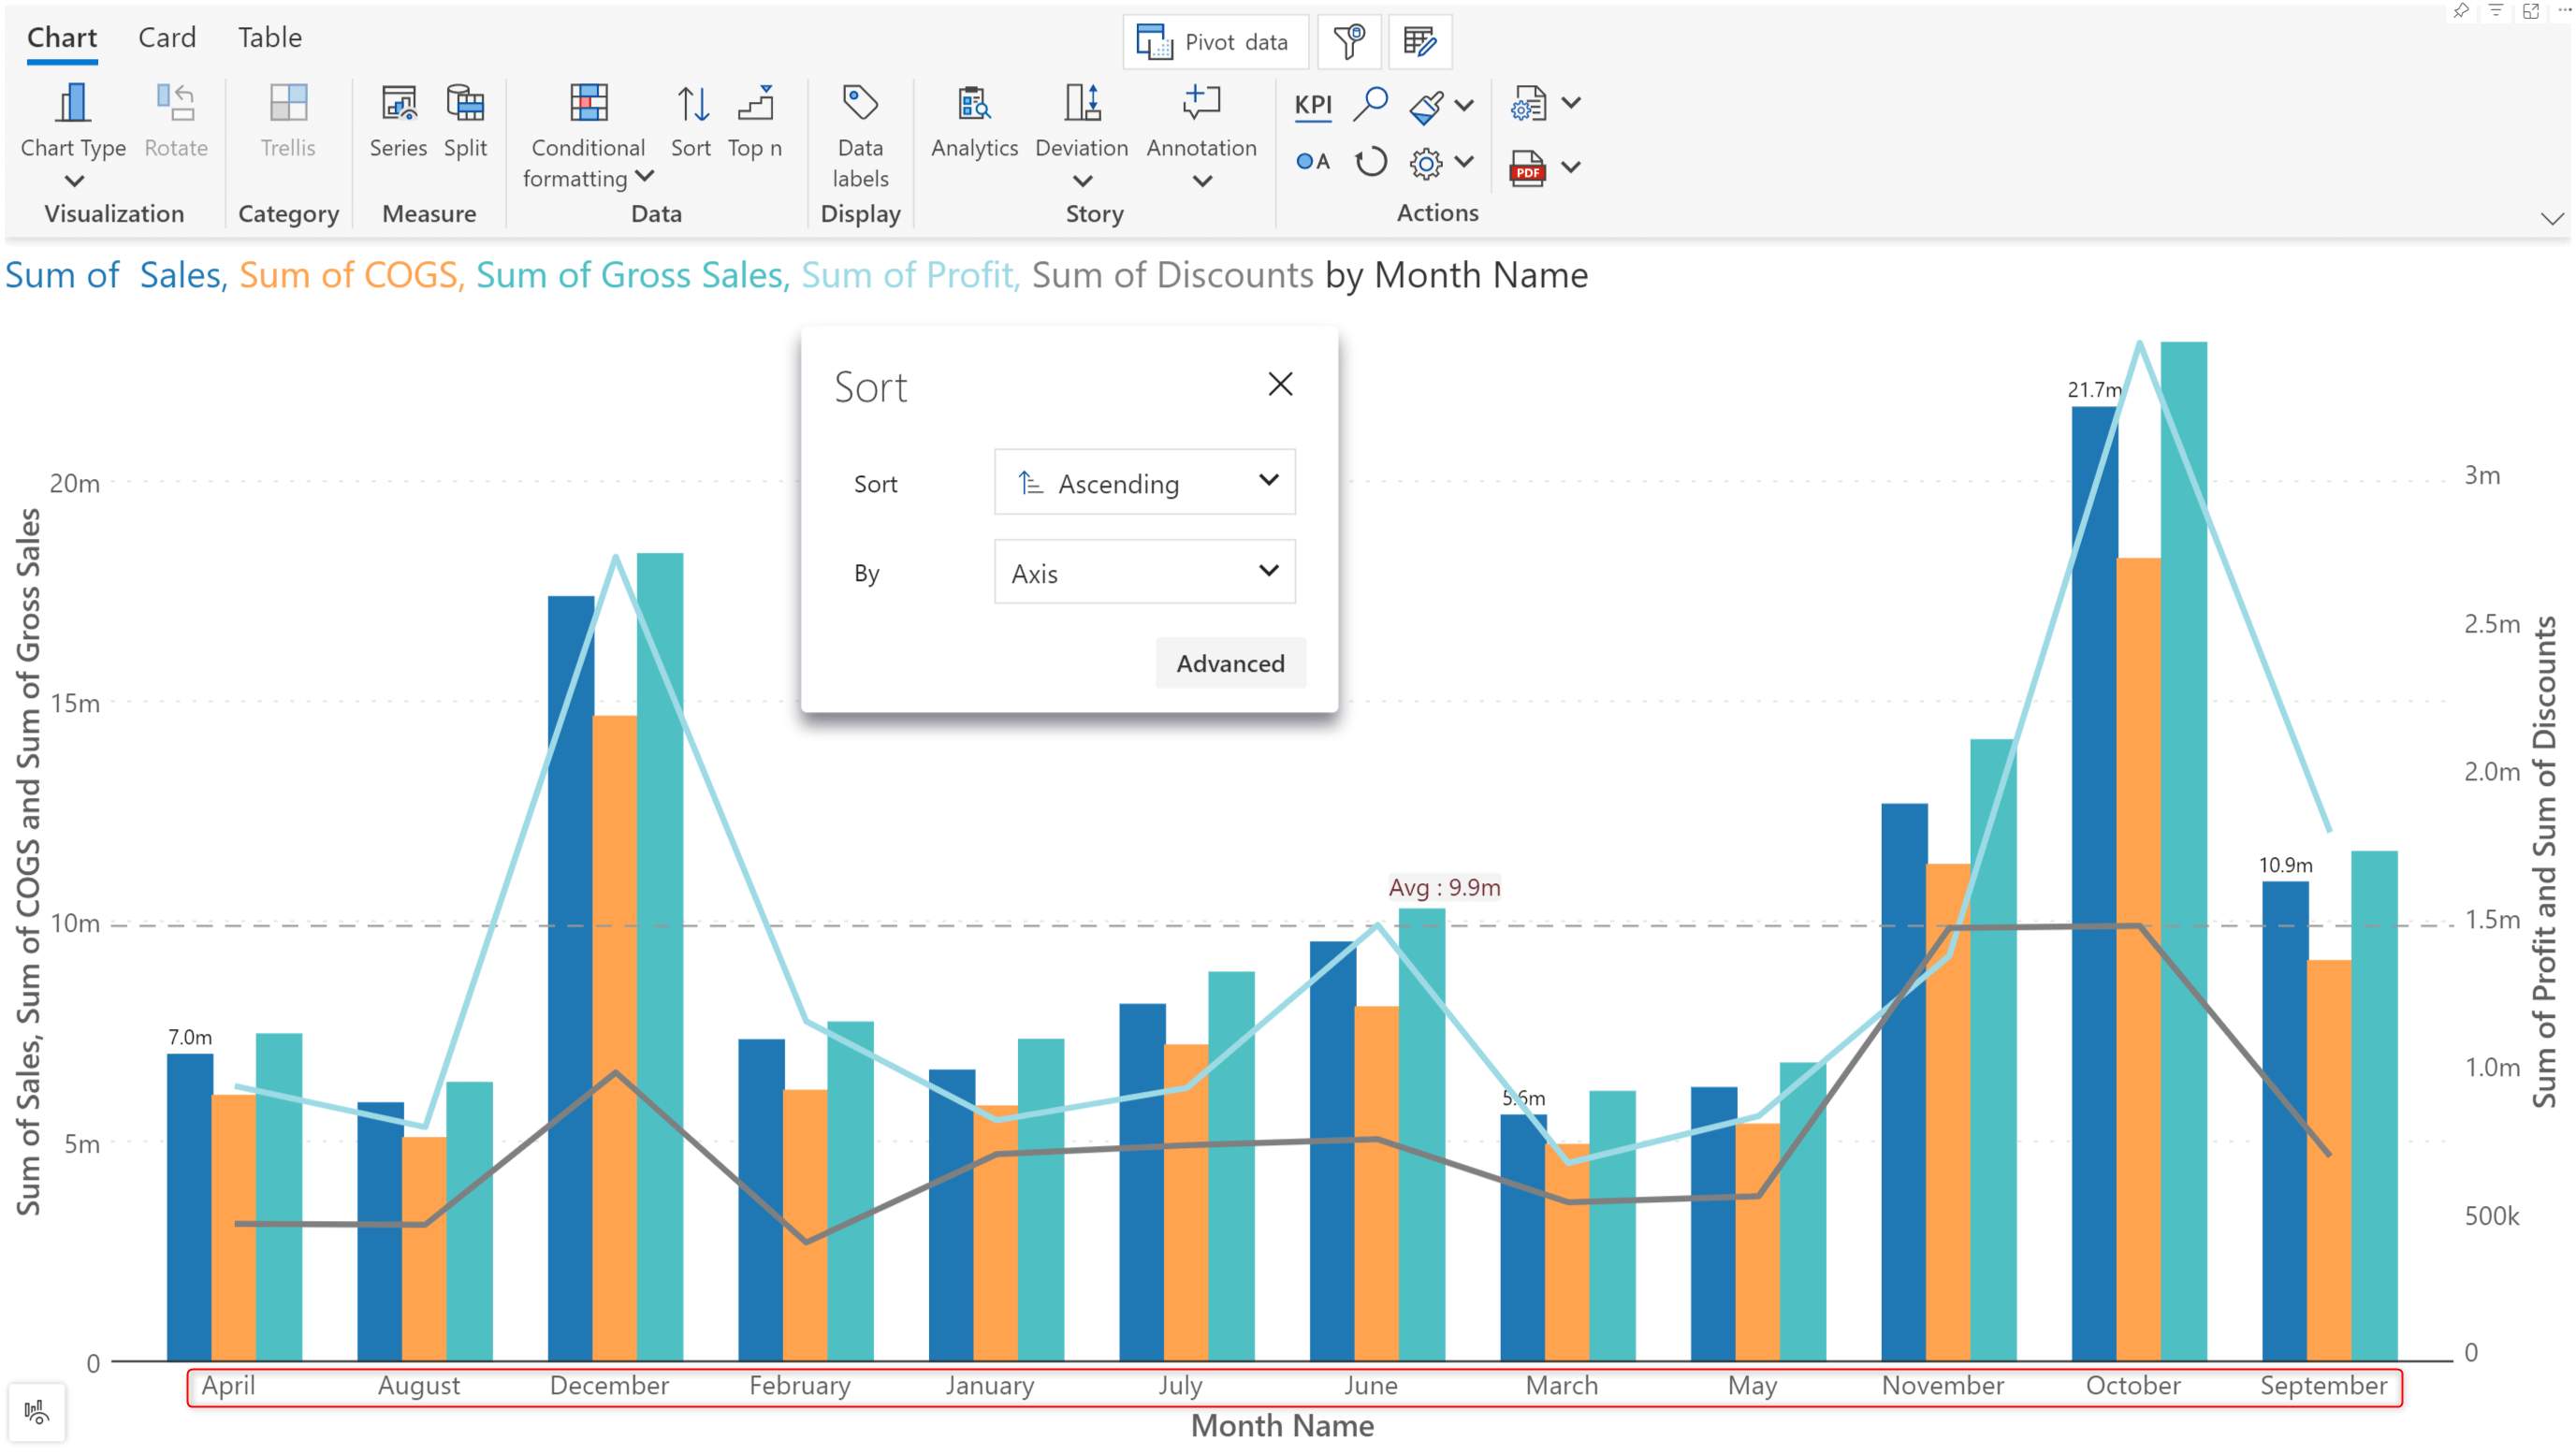
When you migrate to 4.0., the month categories will automatically be sorted chronologically, and the incorrect alphabetical sorting will be removed.
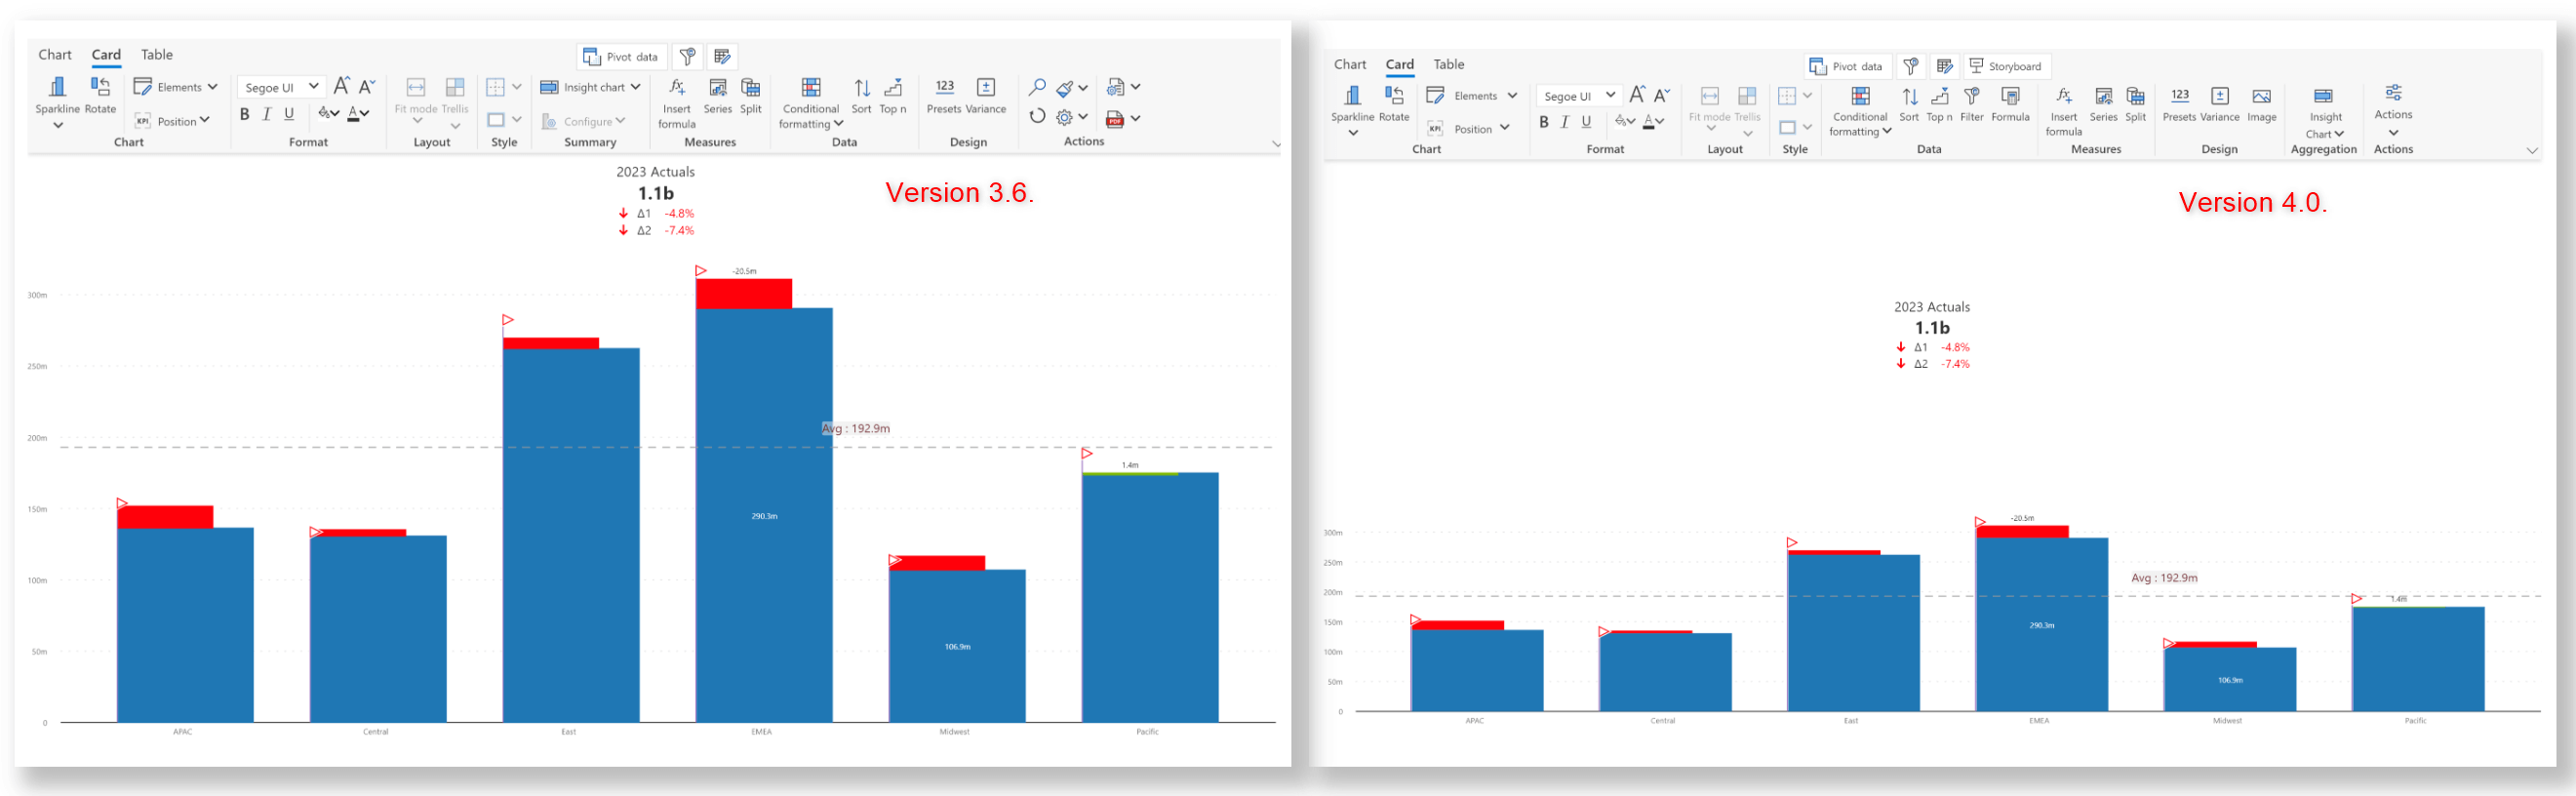
5. KPI
In card mode, you can expect alignment and size changes to the KPI container after migration. In the 4.0. version, the KPI container will occupy 60% of the card and the sparkline will occupy the remaining space.
6. Trellis - x-axis position
In trellis mode, a pre-requisite for applying the 'Frozen bottom row' x-axis position is that the axis sorting should be set to native.
As we have made changes to the default sorting method in 4.0., the axis position will be set to 'All'.
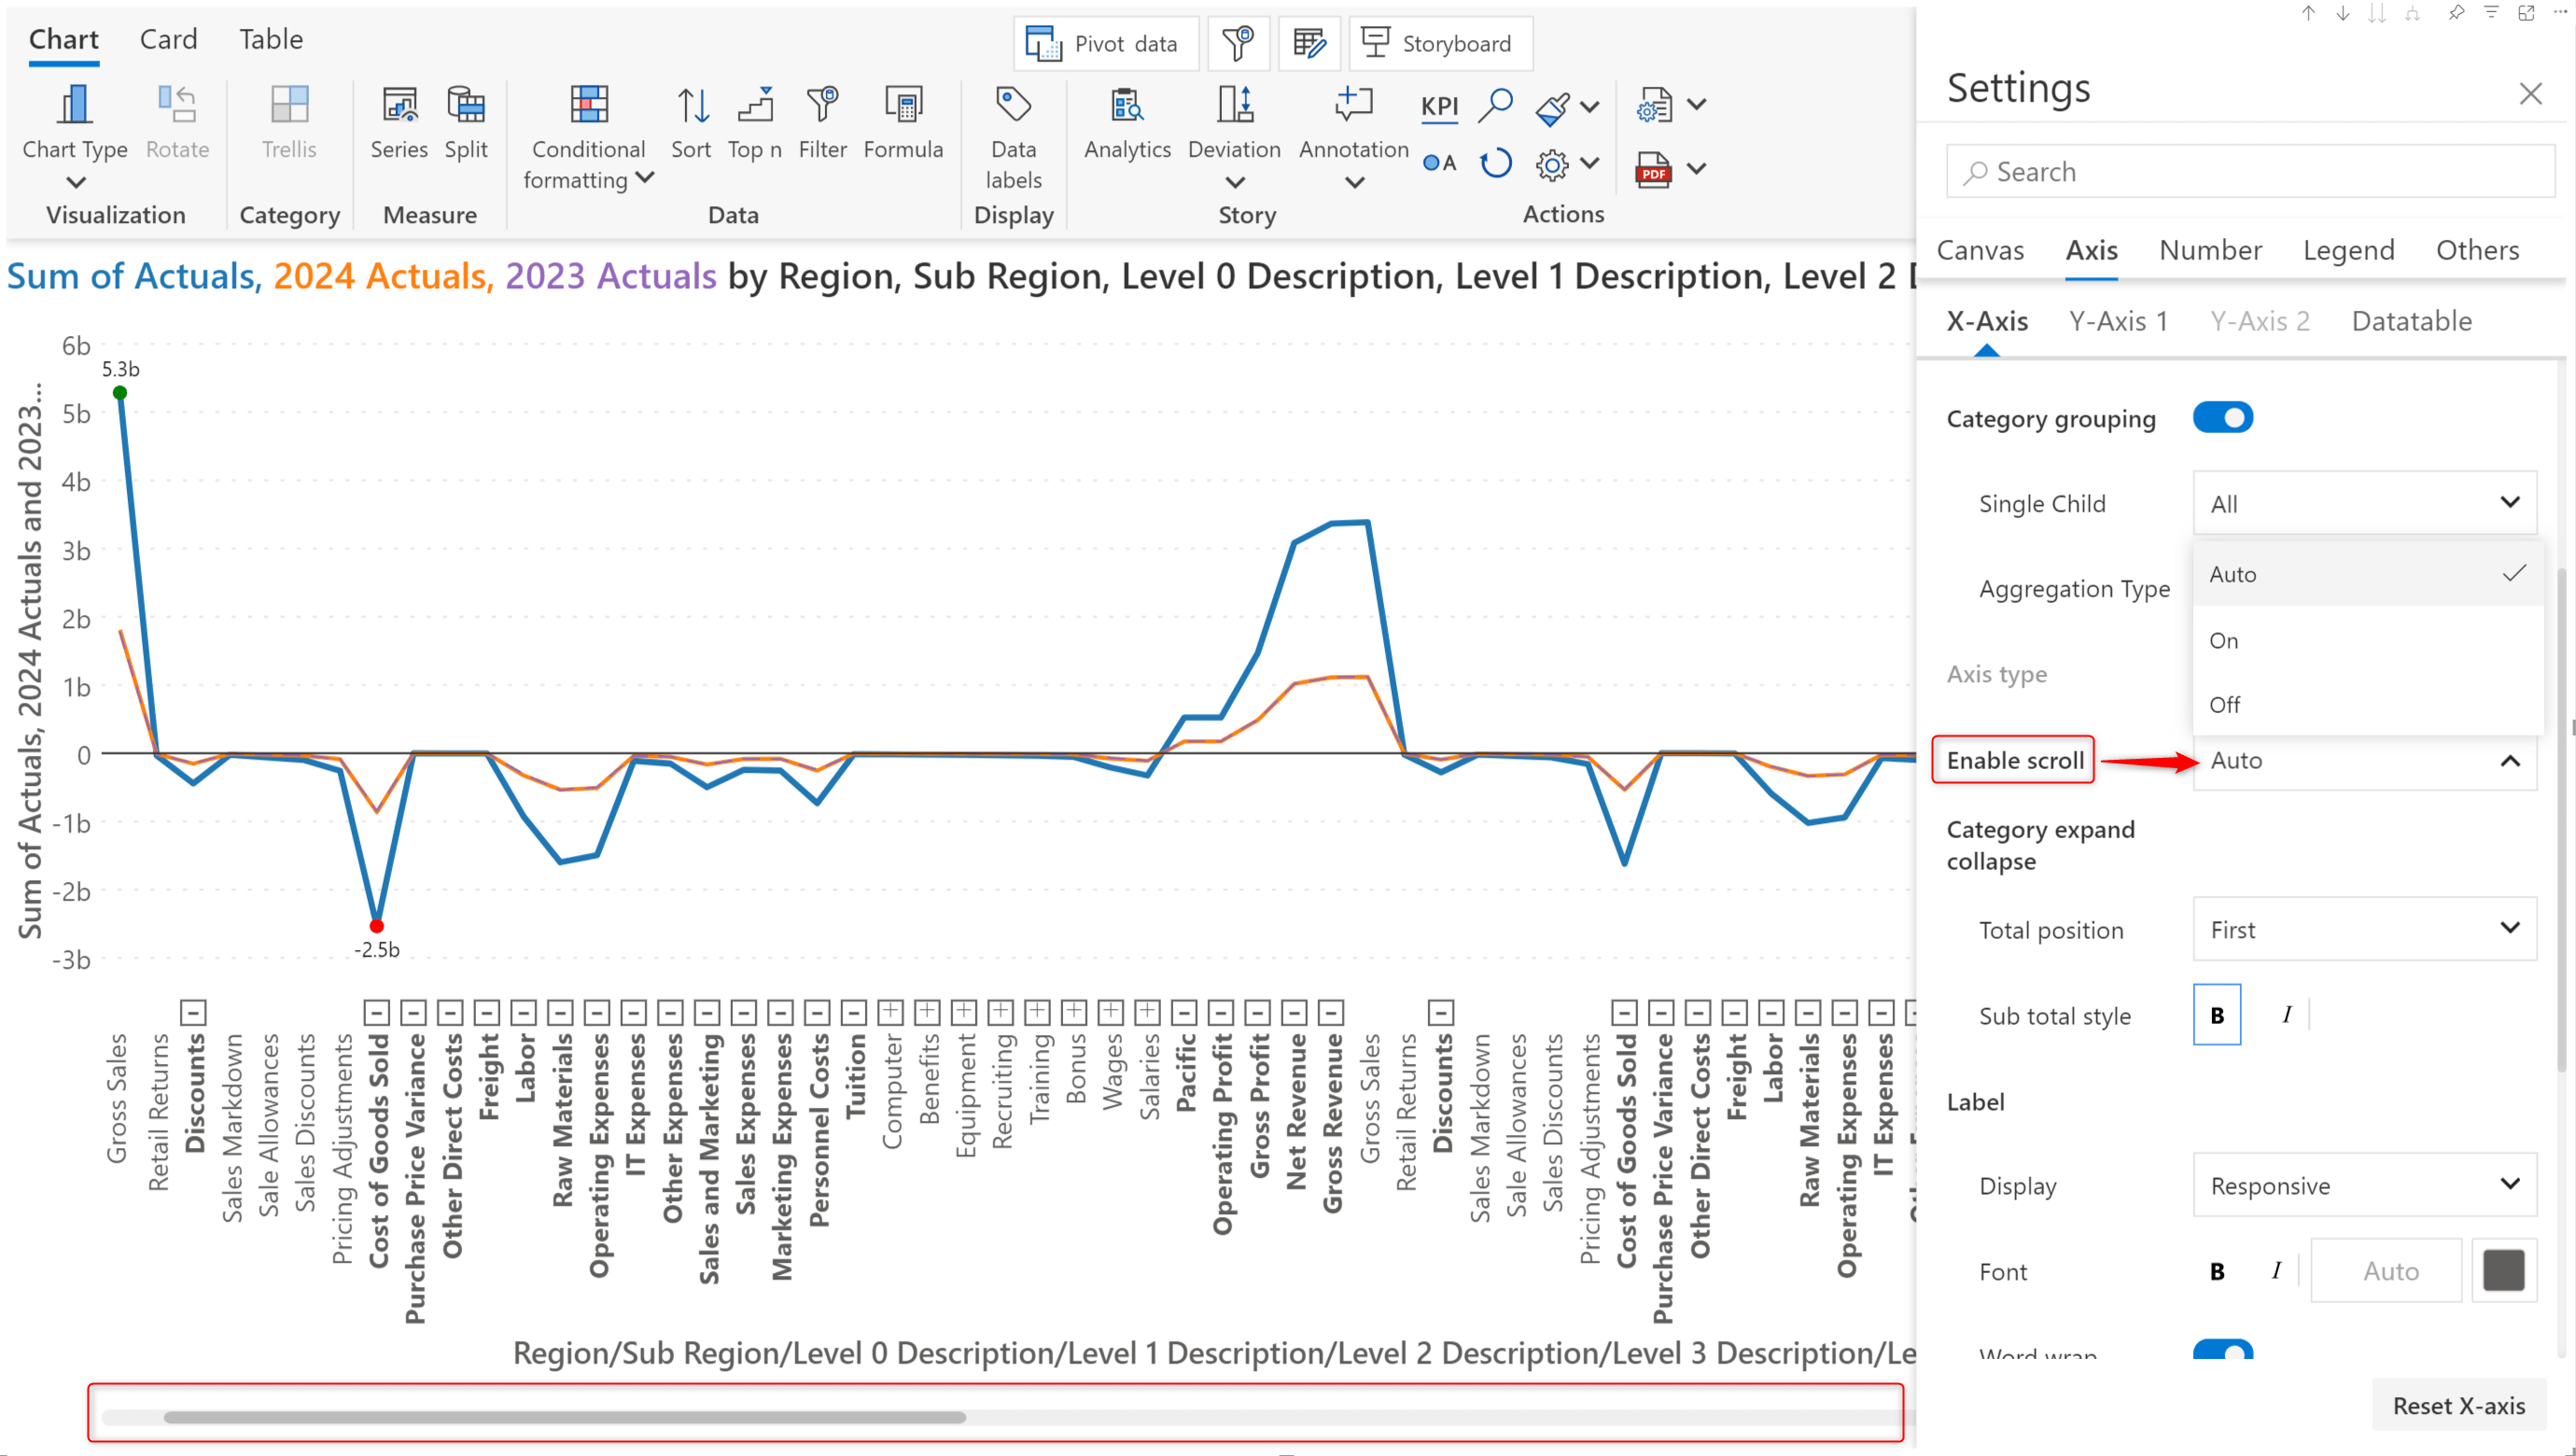
7. Line charts
Line charts with over 500 points will have a scroll bar enabled on migration.
To view all the data points without scrolling, you can disable the scroll bar from Axis settings > X-Axis > Enable scroll > select the 'Off' option.
We hope that you will enjoy working with the latest Analytics+ version. We look forward to and value your suggestions and feedback. Happy dashboarding!

Inforiver helps enterprises consolidate planning, reporting & analytics on a single platform (Power BI). The no-code, self-service award-winning platform has been recognized as the industry’s best and is adopted by many Fortune 100 firms.
Inforiver is a product of Lumel, the #1 Power BI AppSource Partner. The firm serves over 3,000 customers worldwide through its portfolio of products offered under the brands Inforiver, EDITable, ValQ, and xViz.