
Upcoming webinar on 'Inforiver Charts : The fastest way to deliver stories in Power BI', Aug 29th , Monday, 10.30 AM CST. Register Now
Upcoming webinar on 'Inforiver Charts : The fastest way to deliver stories in Power BI', Aug 29th , Monday, 10.30 AM CST. Register Now
The origin of data-driven visualizations and story-telling can be traced back to the beginning of mankind. The early humans sculpted visuals of animals, weapons, and the position of stars on the walls of caves. The Turin Papyrus Map, dated 1150 BC, is the oldest surviving visualization. It illustrates the distribution of geological resources with quarrying information.

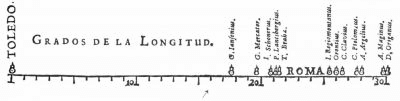
The initial visualizations around the world focused mostly on maps and astrological displays. Visualization of other forms is data lagged as there wasn't very much data to look at and few people were numerate. As we approached the 17th century, advancements in technology and literacy drove the beginnings of modern scientific thought. This in turn created an appreciation for a new form of visualizations. In 1644, Michael Florent Van Langren, a Flemish astronomer, provided the first visual representation of statistical data in a one-dimensional line graph.
In the 18th century, there was an explosion of interest in visualization culminating with the work of William Playfair, the father of our current notions of data visualization. Playfair developed the line chart, bar chart, area chart, and pie chart. The line chart and bar chart first appeared in 1786, and the pie chart and circle graph in 1801.
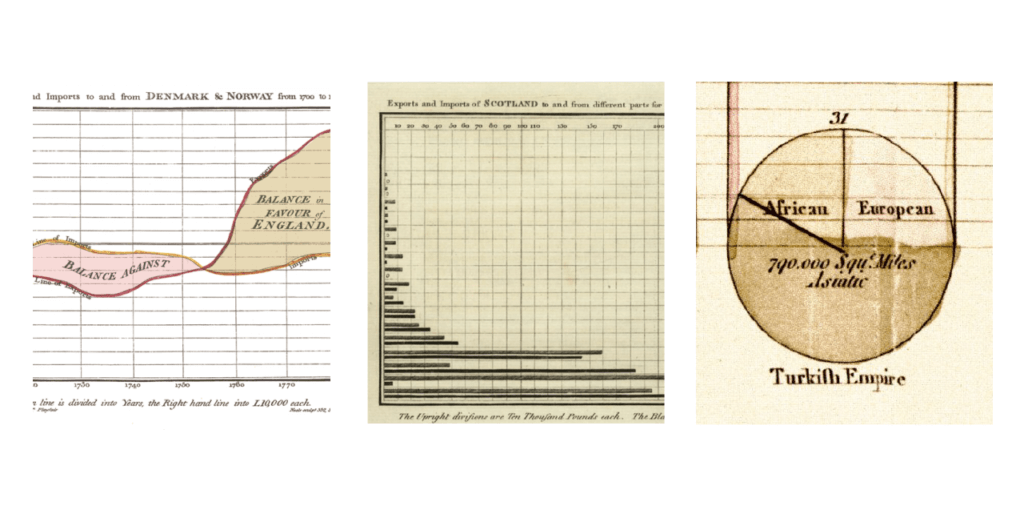
As these concepts were so new in 1786, he had to describe how to read and understand them.
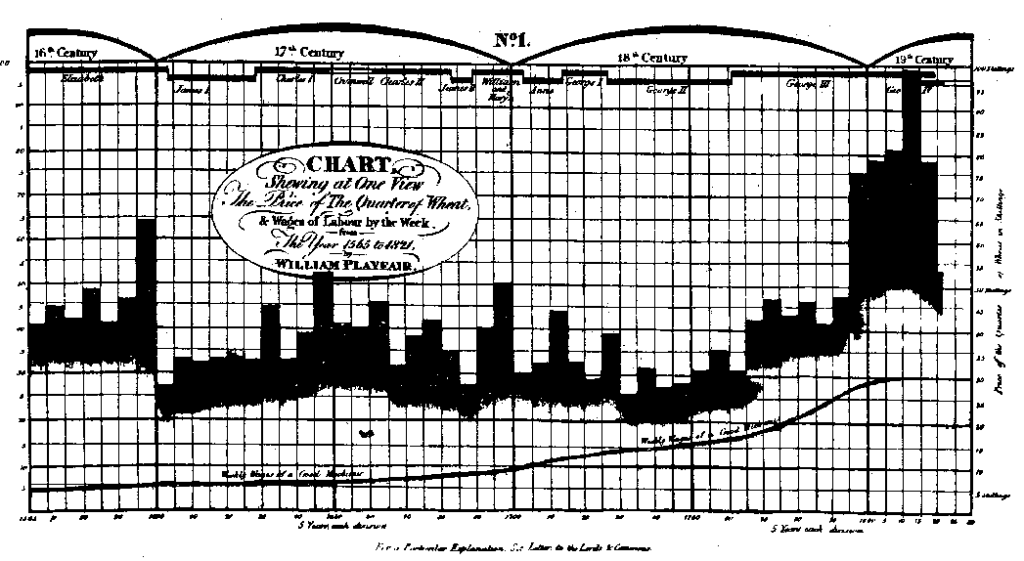
The best-known example of Playfair's work is his comparison of the price of wheat to wages to establish a link between cost-of-living and the average pay of workers.
Playfair also apprenticed with James Watt, the inventor of the modern steam engine.
In 1805, he remarked, "whatever can be expressed in numbers may be expressed by lines". He also wrote that data should "speak to the eyes". A good data visualization, he wrote, "produces form and shape to a number of separate ideas which are otherwise abstract and unconnected", (from A Real Statement of the Finances and Resources of Great Britain, 1796). Playfair's work stretched to the very beginning of the 19th century, where visualization really began to take off.
In the 19th century, the Industrial Revolution began to develop in earnest. The great visualizers of this era were concerned with specific problems. It was now enabled by greater numeracy, availability of data, knowledge of statistics, and an interest in perfecting processes. Countries began to publish reams of information about economics, commerce, population, births and deaths, religion, and illnesses.
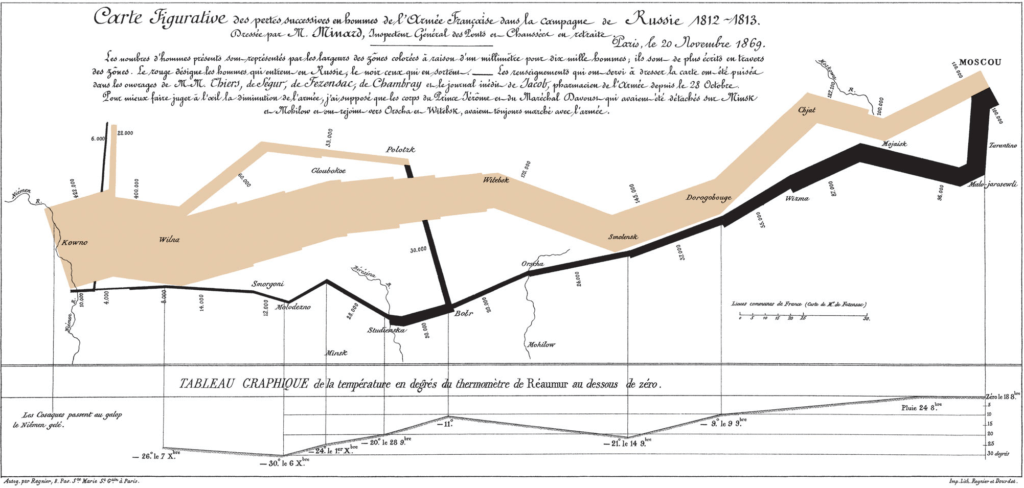
Notable figures of this time include Charles Joseph Minard, a civil engineer in Paris often called the Playfair of France. He was an early proponent of the mosaic plot and is also most famous for a flow map of the fate of armies of Napoleon.
Another notable figure was John Snow in London (this John Snow knew a lot 😀), who drew a dot map of cholera deaths in 1854. This graphically demonstrated all of the cases that appeared near the location of a particular well. The effectiveness of this strategy highlighted the use of visualizations and their benefits in showing patterns in the data which would otherwise have been invisible.

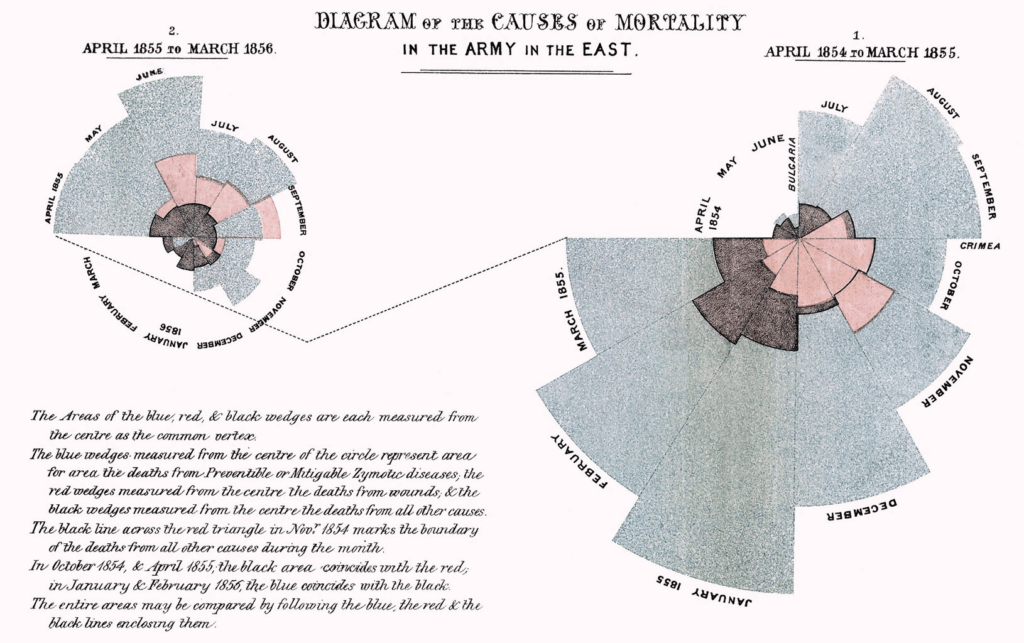
Florence Nightingale, an advocate of sanitation, visualized the extensive data she had collected using polar area graphs, called rose diagrams, to support her fight for better hospital conditions. According to Nightingale, the visualization was able "to affect through the Eyes what we fail to convey to the public through their word-proof years". During the late 19th century, most major countries produced state-sponsored statistical albums, filled with visualizations.
In the early 20th century, graphical visualizations entered textbooks and government departments adopted them. Scientific communities also adopted graphical methods to provide insights and details on discoveries in astronomy, physics, biology, and other sciences. In 1914, Willard C. Brinton published Graphic Methods for Presenting Facts, outlining a survey of basic statistical diagrams and graphic techniques.
In the second half of the century, John W. Tukey published The Future of Data Analysis (in 1962). This paper called for the recognition of data analysis as a legitimate branch of statistics. Tukey also invented a wide variety of new graphic displays, including stem-leaf plots, box plots, hanging roof programs, two-way display tables, and the like.
Meanwhile, Jacques Bertin in France developed information visualization and statistics in cartography and in 1967 published his Semiologie Graphique, a large-scale attempt to break down and organize the basic visual elements of graphics. This is the first systemic treatment of how graphic representations encode data.
The emergence of computers in this era also accelerated developments in data visualization. Visualization methods were applied to an ever-expanding set of problems, thus producing many new graphical methods. The experimentation on a psychological and perceptual basis for visualization, thus, created a more scientific view of data visualization.
In 2001, Edward Tufte wrote The Visual Display of Quantitative Information. This remains a staple in courses for data visualization and statistical analysis. He wrote, "Graphics reveal data. Indeed, graphics can be more precise and revealing than conventional statistical computations."
Stephen Few @ Perceptual Edge popularized visual business intelligence with more structure and best practices with his books and blogs.
The International Business Communication Standards (IBCS) founded by Rolf Hichert, emerged in the 2000s. Today, a wide variety of software providers adopt these standards.
As Brinton wrote in the early twentieth century, "The principles for a grammar of graphic presentation are so simple that a minimal number of rules would be sufficient to give a universal language. It is interesting to note, also, that there are possibilities of the graphic presentation becoming an international language, like music, which is now written by such standard methods that sheet music may be played in any country". When he wrote this, graphics were relatively simple and completed by hand. However, the push for standards today is as important as the collection and distribution of ideas for visual presentation.
In our upcoming blog(s), we will review why IBCS is the future for visualizations and storytelling. You can also learn more about IBCS standards from the book "Solid, Outlined and Hatched for Consistency in Presentations"

Inforiver helps enterprises consolidate planning, reporting & analytics on a single platform (Power BI). The no-code, self-service award-winning platform has been recognized as the industry’s best and is adopted by many Fortune 100 firms.
Inforiver is a product of Lumel, the #1 Power BI AppSource Partner. The firm serves over 3,000 customers worldwide through its portfolio of products offered under the brands Inforiver, EDITable, ValQ, and xViz.


