Upcoming webinar on 'Inforiver Charts : The fastest way to deliver stories in Power BI', Aug 29th , Monday, 10.30 AM CST. Register Now
Upcoming webinar on 'Inforiver Charts : The fastest way to deliver stories in Power BI', Aug 29th , Monday, 10.30 AM CST. Register Now
Visual BI Solutions Inc. today announced the launch of Inforiver, a product that facilitates low code / no code analytics for enterprises to drive productivity & velocity in end-user reporting and analysis.
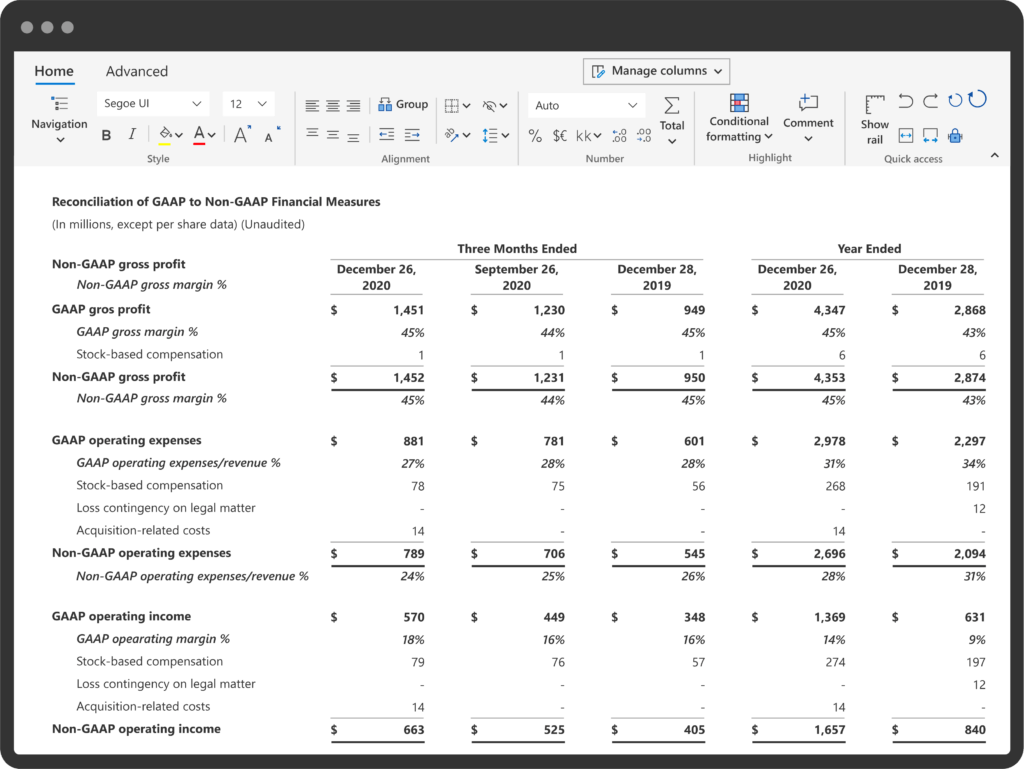
Inforiver supports various use cases such as pivot analysis, management & performance analytics, financial reporting, what-if analysis, and more. The product's quick launch templates, menu-based on-the-fly configuration, one-click business actions and visual calculations deliver true self-service, interactivity and collaboration not seen in other BI products.
Inforiver delivers the best of both worlds – spreadsheets & standardized BI reporting and visualizations – through a low-code / no-code architecture that drives excellent authoring, consumer & collaboration experiences for unrivaled analysis productivity and ROI.

Inforiver is being launched in three variants:
* * *
Over the last couple of decades, we witnessed the democratization of visualization & self-service analytics across organizations. Today, analysts are empowered with self-service visualizations and run their analyses without having to rely on their IT departments. Despite this progress, they still face a few key challenges:
Beyond the simple visualizations, filters & interactions, reports often require a lot of scripting. This is common across most BI tools. This has limited user adoption, constrained productivity and prevented organizations from realizing the full potential of their technology investments. We believe a no-code / low-code self-service approach to analytics is the way of the future.
Despite the new visualization tools, consumers tend to miss the power, flexibility, and freedom of spreadsheets. This is not without merit. Reports published with read-only rights often have the flexibility restricted to predefined drill-downs and filters. We believe users need more power & freedom – just as with spreadsheets – so long as it does not compromise the underlying data or consumption experience for other consumers. (This is another reason why ‘download to excel’ is the most sought-after feature in BI tools.)
Enterprise users today need collaboration experiences that go beyond the basic report-level annotations or sharing reports through emails. For example, if they realize margins are low in a specific sales region, they need the capabilities to initiate a conversation with the specific sales representative from right within the report at the data/cell level through commentary & annotations. But today’s BI tools miss such capabilities that Enterprises need.
* * *
Organizations today are hungry to have the best of both worlds – spreadsheets & standardized BI tools – through a low-code / no-code architecture that drives excellent authoring, consumer & collaboration experiences for unrivaled analysis productivity and ROI. Inforiver re-imagines the future where users can build dynamic and interactive reports in a few clicks without resorting to coding or extensive scripting. This will be the future for Data-as-a-Service (DaaS) supported by data cloud platforms like Snowflake, Google BigQuery, Azure Synapse and others.