Upcoming webinar on 'Inforiver Charts : The fastest way to deliver stories in Power BI', Aug 29th , Monday, 10.30 AM CST. Register Now
Upcoming webinar on 'Inforiver Charts : The fastest way to deliver stories in Power BI', Aug 29th , Monday, 10.30 AM CST. Register Now
Summary: Inforiver offers the flexibility to deliver tabular reports in multiple layouts in Power BI, including the Pivot Table layout in Excel that many users are familiar with.
(a) we have a need to display multiple records, or
(b) when we have a larger number of dimensions & measures that need to be displayed at once.
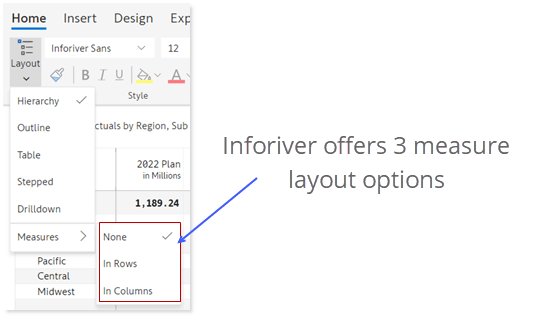
All the above are accessible from the Home -> Layout menu item.
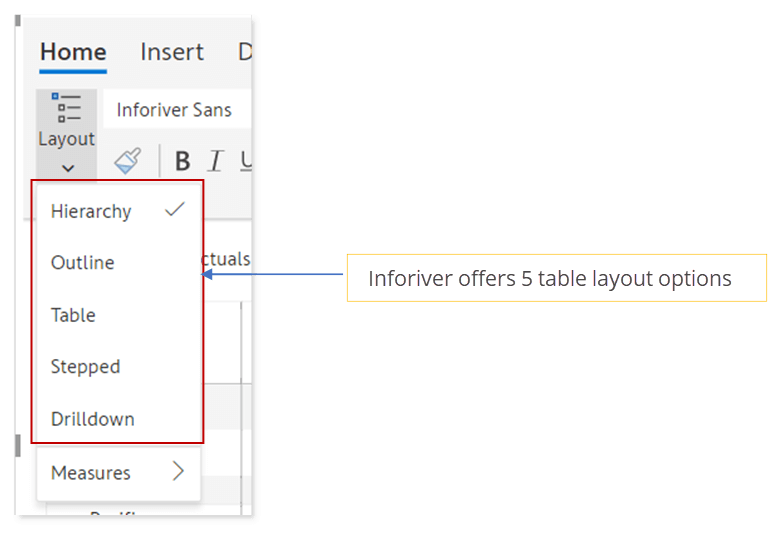
Let’s take a quick look at each of them.
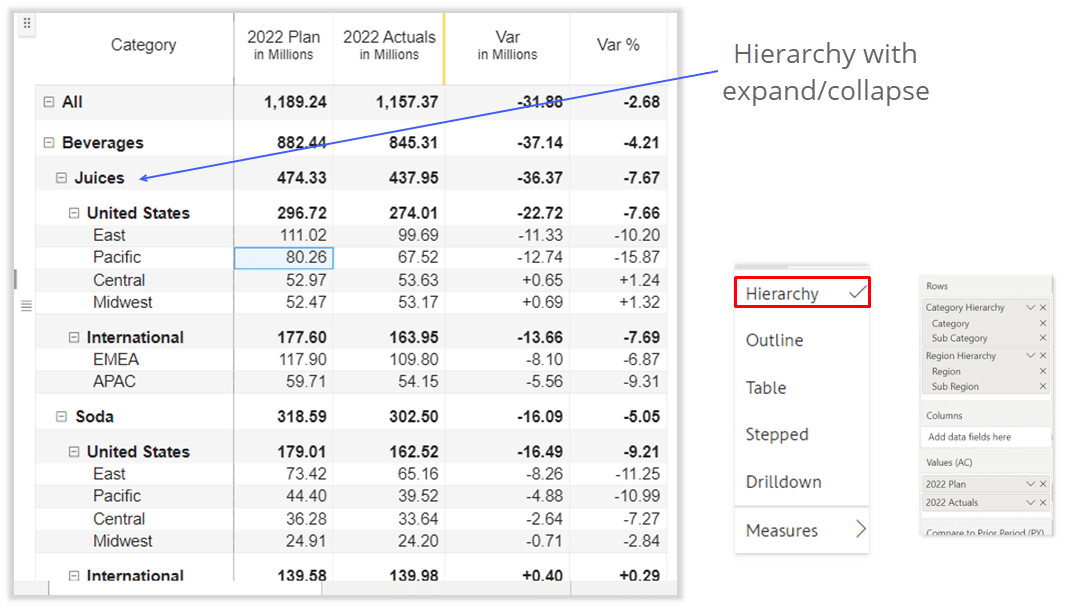
By default, Inforiver delivers data in a hierarchical, expand/collapse-enabled format. Note that ragged hierarchy support is provided out-of-the-box without the need to write any code
The Outline layout is similar to the Hierarchy layout except that each dimension is captured in a separate column.
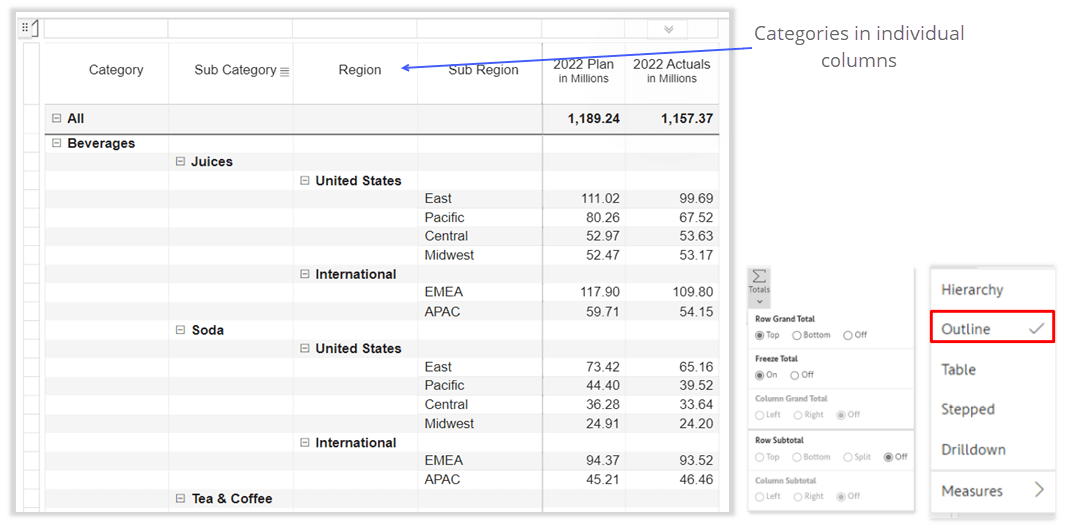
By default, the Excel-like 'ruler' is enabled for this layout (seen above the first row & before the first column). The ruler is used to easily resize or select specific rows and columns as you do in spreadsheets. You can hide this ruler by de-selecting the ruler icon on the toolbar.
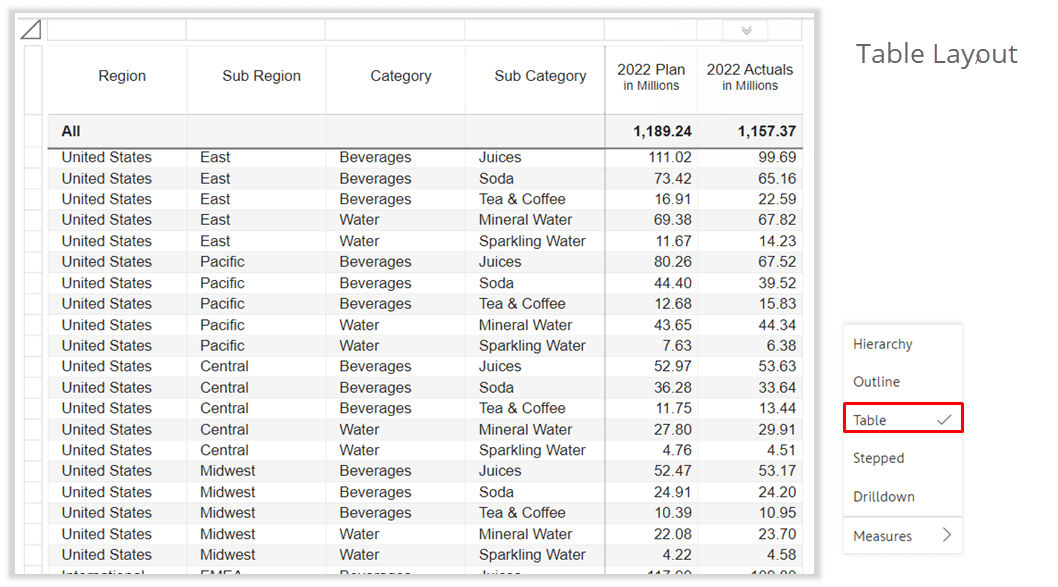
The table option shows categories in a tabular format, without any expand-collapse hierarchies for rows.
This layout allows us to sort based on any dimension first (e.g.,) Category – something that is not possible in Hierarchy or Outline layouts.
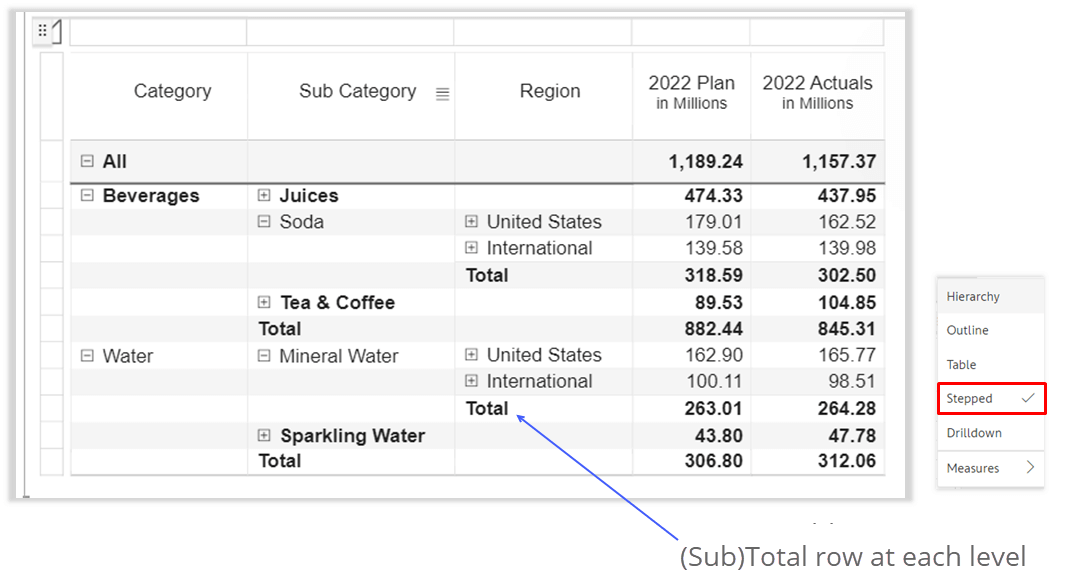
The Stepped layout is similar to the Outline layout but with the addition of an additional Total row for each category member.
The drill down layout lets you explore one branch at a time in the hierarchy. This is also an ideal option when you have a huge volume of rows.
Inforiver also allows you to customize all the above layouts when you have multiple measures. These options are available at the bottom of the Layout menu. We will explore this in one of our upcoming posts.

Inforiver helps enterprises consolidate planning, reporting & analytics on a single platform (Power BI). The no-code, self-service award-winning platform has been recognized as the industry’s best and is adopted by many Fortune 100 firms.
Inforiver is a product of Lumel, the #1 Power BI AppSource Partner. The firm serves over 3,000 customers worldwide through its portfolio of products offered under the brands Inforiver, EDITable, ValQ, and xViz.