
Upcoming webinar on 'Inforiver Charts : The fastest way to deliver stories in Power BI', Aug 29th , Monday, 10.30 AM CST. Register Now
Upcoming webinar on 'Inforiver Charts : The fastest way to deliver stories in Power BI', Aug 29th , Monday, 10.30 AM CST. Register Now
Rounding in financial statements needs to work a bit differently from what we are used to in Excel and tabular reports from popular software like Power BI, Tableau, Qlik, Cognos, etc.
One key rule as per generally accepted financial standards & practices is that the totals must match the sum of the individual account values. (When was the last time you read an annual report where the values in a table did not add up to the total?)
Let us take an example below, where we have several General Ledger (GL) accounts adding up to provide the total expense in an organization.
When you try to round off the decimals to integer values, you get the following.
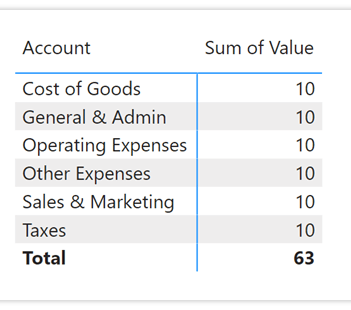
While the total is correctly rounded up to 63, the sum of the individual values adds up only to 60. This is not acceptable when it comes to financial statement standards and practices, which mandate that the total must be 60. In other words, the numbers must visibly add up to the total.
In Power BI, the total value directly comes from the underlying measures, and is not calculated by adding the values shown in the visual.
This inconsistency between the reporting software and accounting practices is a key issue that makes accountants either explore workarounds (using DAX) to get the right totals or fall back on Excel.
However, if you are a Power BI user, you can get the right totals for financial statements in a few clicks.
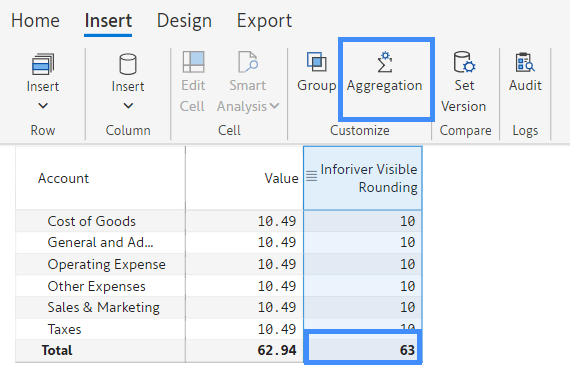
Step 1 : Once you load the data in Inforiver, select the column and click on Aggregation from the ribbon bar (available inside the Insert menu).
Step 2 : You will see a Manage Aggregation pane. Assign the aggregation type of ‘Visible Rounding’ to this column. This option adds up visibly rounded values, instead of adding values from the underlying measure.
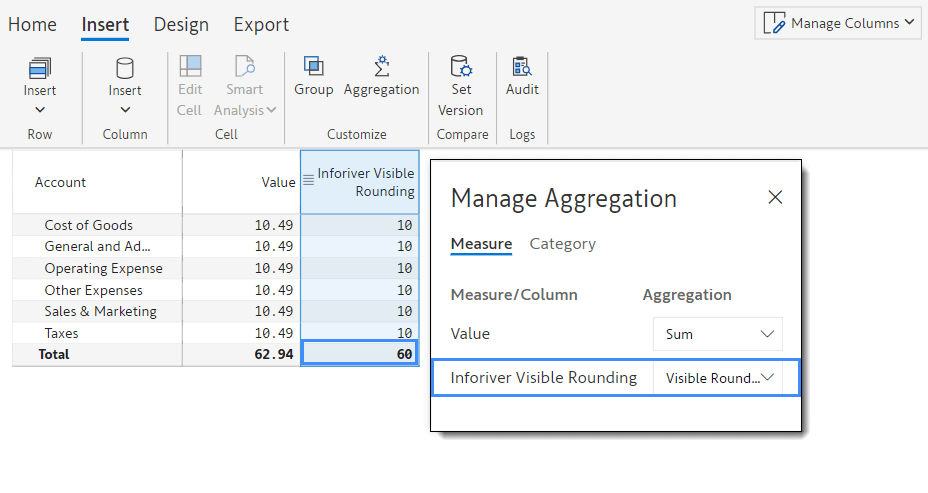
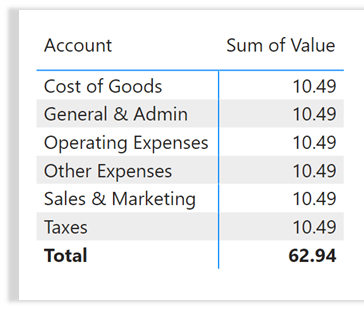
Once the Visible Rounding option is selected, the totals add up to the sum of the individual values as shown in the above table.
There is another shorter way. You may also use the hamburger menu on the top of the column and select Aggregation 🡪Visible Rounding
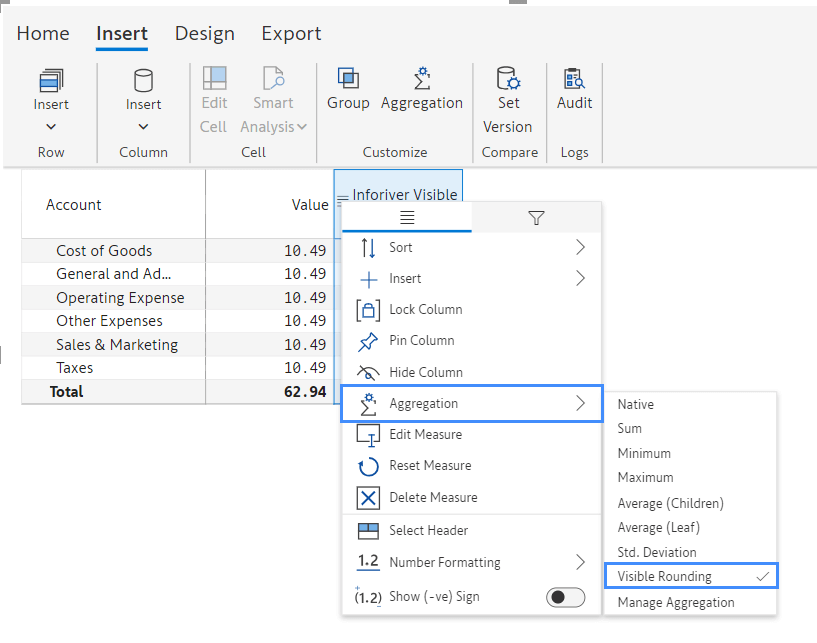
Note that Inforiver allows you to select different aggregation methods for different columns & measures.
* * *
In Summary, Inforiver allows you to override the native Power BI aggregation defined in the data model as per your needs – without having to make extensive workarounds or scripting to fulfil needs like the above.
For more information, visit here.

Inforiver helps enterprises consolidate planning, reporting & analytics on a single platform (Power BI). The no-code, self-service award-winning platform has been recognized as the industry’s best and is adopted by many Fortune 100 firms.
Inforiver is a product of Lumel, the #1 Power BI AppSource Partner. The firm serves over 3,000 customers worldwide through its portfolio of products offered under the brands Inforiver, EDITable, ValQ, and xViz.


