Upcoming webinar on 'Inforiver Charts : The fastest way to deliver stories in Power BI', Aug 29th , Monday, 10.30 AM CST. Register Now
Upcoming webinar on 'Inforiver Charts : The fastest way to deliver stories in Power BI', Aug 29th , Monday, 10.30 AM CST. Register Now
This blog is reproduced from here.
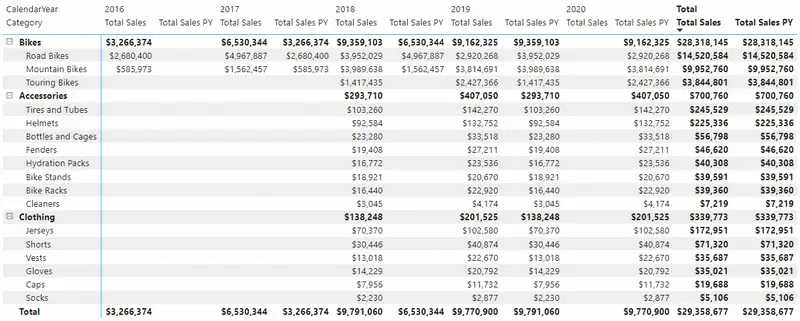
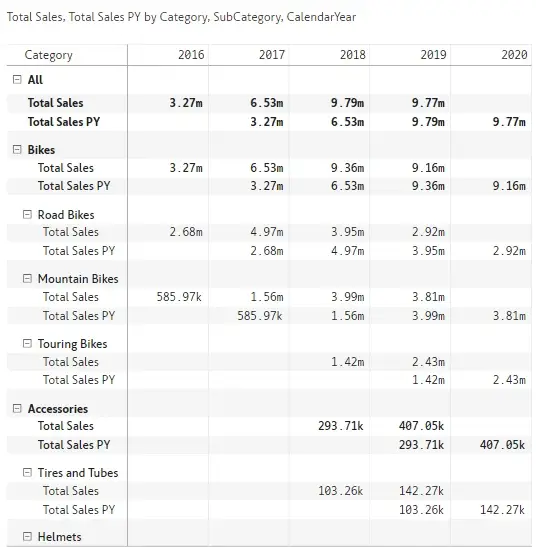
The Power BI Matrix visual is similar to an Excel Pivot table, however there are quite a few limitations in the Matrix. In the Power BI Matrix below I have put the product categories on Rows, Calendar Year on Columns and the measure [Total Sales] on Values. At this point, it looks pretty much the same as an Excel Pivot table. It is possible to add more measures to the same matrix, ie [Total Sales PY] as shown below. The default behavior for a Power BI Matrix is that the column (Year in this case) is on top followed by the 2 measures nested below.
For contrast, let me show the same scenario with an Excel Pivot table. There is an option to drag the Values to Rows so the measures are stacked beneath the rows as an alternate presentation if desired. This actually can be done in the standard Power BI matrix, too.
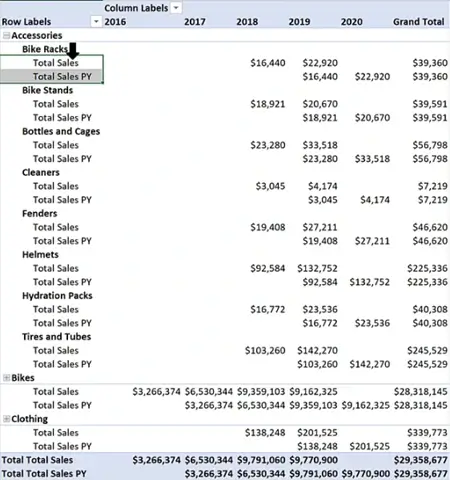
However, in a Pivot Table there is also a third option to drag the Values above the Year in Columns in effect nesting the years below the measures instead of the measures below the years.

This third alternative is not possible in the standard Power BI matrix
I have been fortunate to work with Lumel, the company that has developed the Inforiver custom visual. In that capacity, I get to see what they are building and sometimes even influence the features. The Inforiver custom matrix visual has many more features to visualise data than the standard matrix visual including the ability to nest measures this way.
Below is the standard display – the same as the standard matrix.
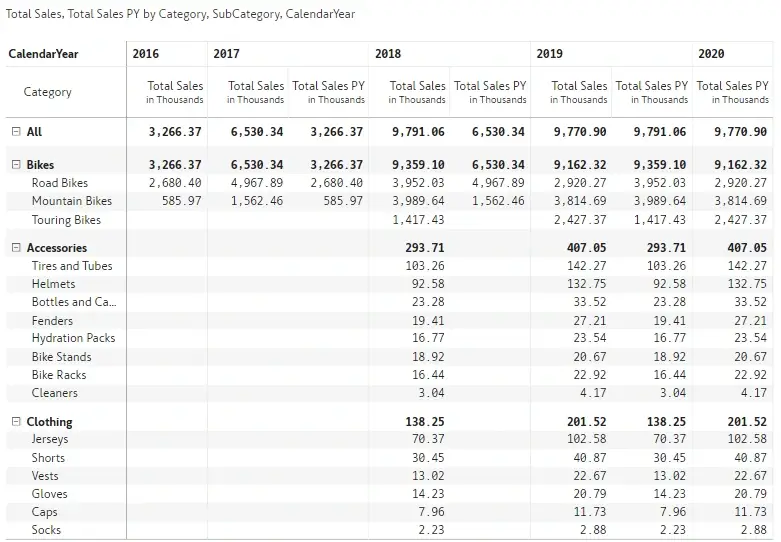
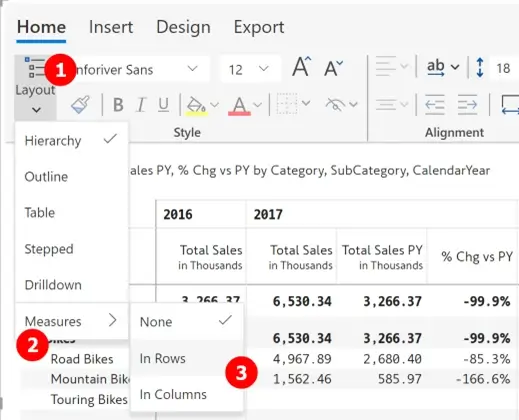
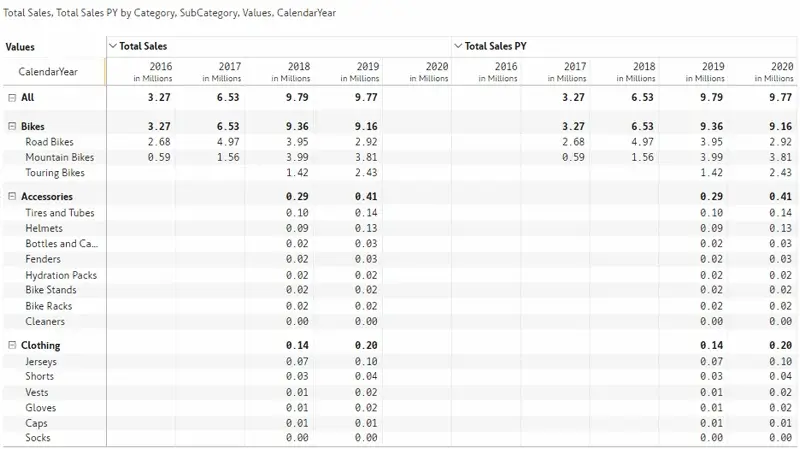
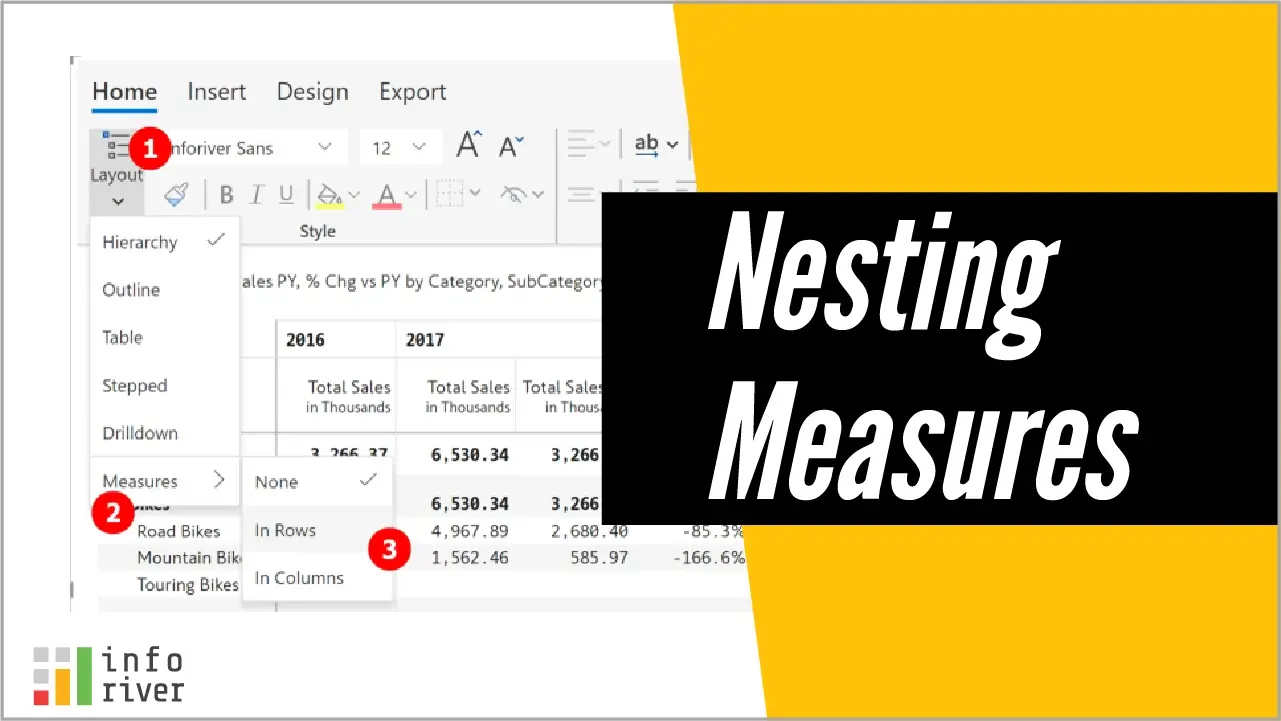
The same two alternatives provided in Excel are available in Inforiver. Go to Layout\Measures\ and select either “in Rows” or “in Columns”.
In rows looks like this.
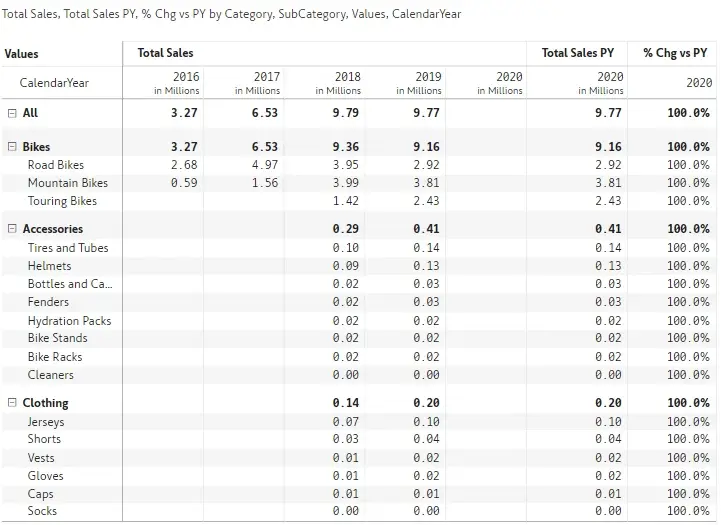
And in columns looks like this.
With Inforiver custom visual it is also possible to hide some of the columns in the display. Just right click the columns you don’t want to see, select “column display”, then “hide column”.
More information available at https://inforiver.com/

Inforiver helps enterprises consolidate planning, reporting & analytics on a single platform (Power BI). The no-code, self-service award-winning platform has been recognized as the industry’s best and is adopted by many Fortune 100 firms.
Inforiver is a product of Lumel, the #1 Power BI AppSource Partner. The firm serves over 3,000 customers worldwide through its portfolio of products offered under the brands Inforiver, EDITable, ValQ, and xViz.