
Upcoming webinar on 'Inforiver Charts : The fastest way to deliver stories in Power BI', Aug 29th , Monday, 10.30 AM CST. Register Now
Upcoming webinar on 'Inforiver Charts : The fastest way to deliver stories in Power BI', Aug 29th , Monday, 10.30 AM CST. Register Now
In an earlier post, we learned how you can leverage multiple tabular report layouts in Power BI in a single click using Inforiver. In each of these layouts, you can also customize how you want your measures to be displayed (let’s call them ‘Measure Layouts’).
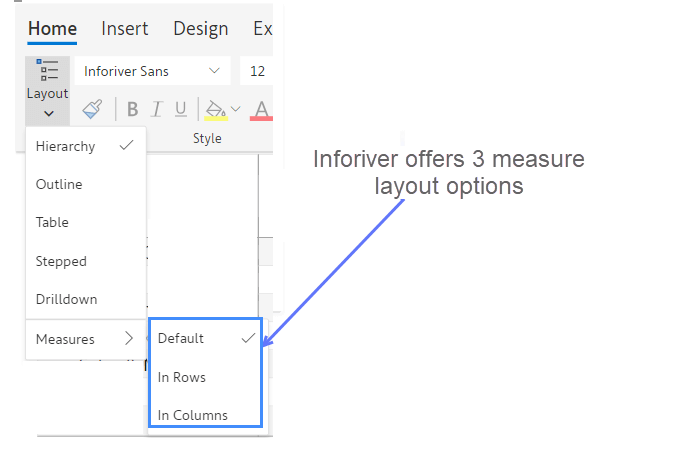
Measure layouts give you the flexibility to determine how measures are displayed.
Inforiver delivers three (3) ways in which you can deliver measure layouts in a single click. All of these are accessible from the Layout --> Measures menu.
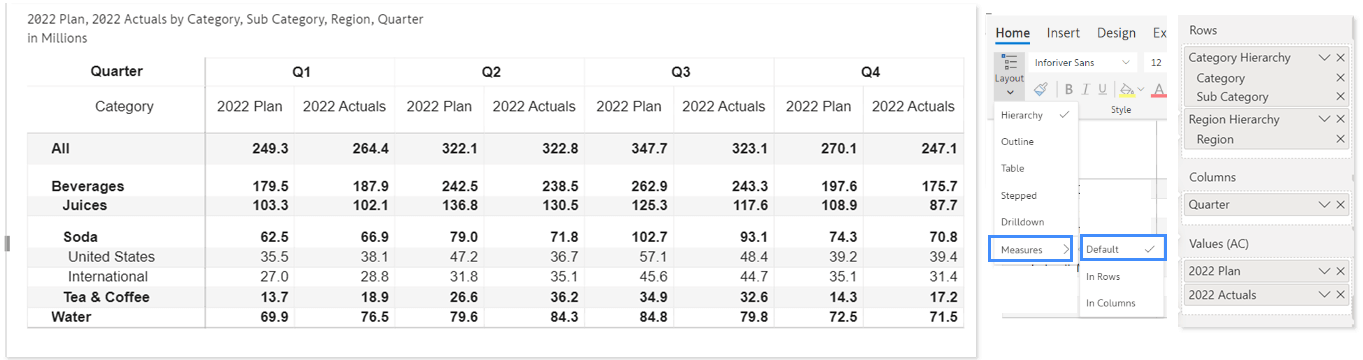
By default, all measures are displayed in columns beneath any categories assigned to columns. For example, within Q1, we have 2022 Plan and 2022 Actuals.
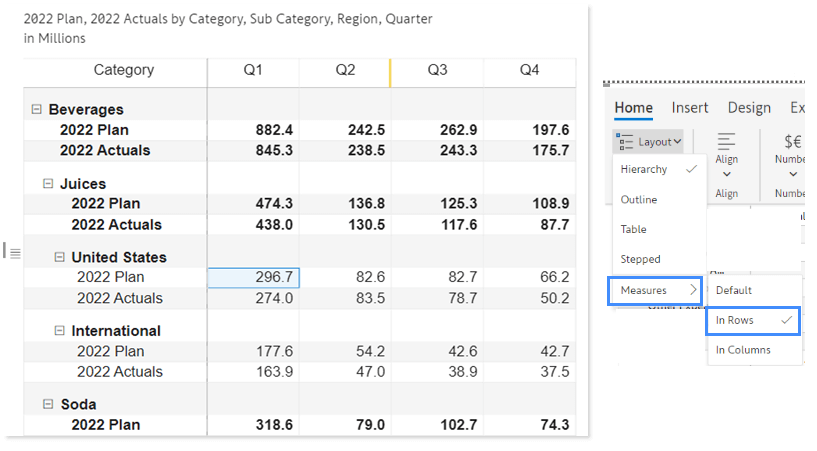
This option moves the measures from the columns and displays them in the rows. Note that 2022 Plan and 2022 Actuals are listed (and repeated) under each product category in rows.
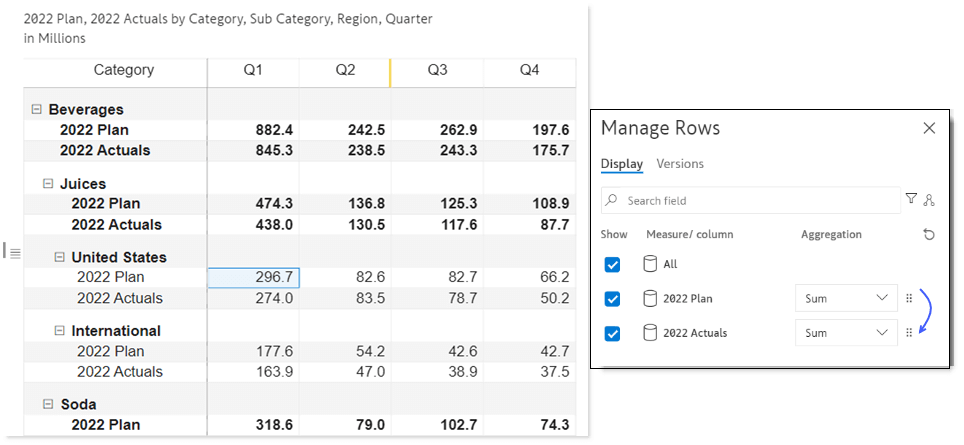
To re-order the measures in this layout, you can click on row gripper and drag the rows to be re-ordered. You can also achieve this via the ‘Manage rows’ popup screen, where you can drag and drop the gripper to reorder measures.
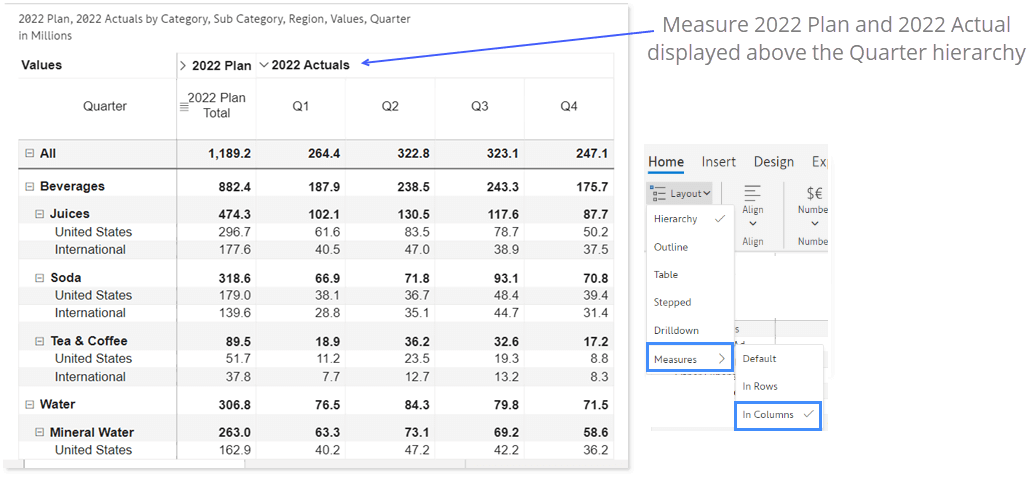
This option puts the measures (2022 Plan and 2022 Actual) in the columns, but with one difference. The measures here are above the column hierarchy categories.
In this case, you will have 2022 Plan and 2022 Actuals listed on the top of the columns, which can be expanded to reveal the four quarters below. This is very helpful when you are focusing only on one measure at a time.
For additional information on Nested Measures, click here.

Inforiver helps enterprises consolidate planning, reporting & analytics on a single platform (Power BI). The no-code, self-service award-winning platform has been recognized as the industry’s best and is adopted by many Fortune 100 firms.
Inforiver is a product of Lumel, the #1 Power BI AppSource Partner. The firm serves over 3,000 customers worldwide through its portfolio of products offered under the brands Inforiver, EDITable, ValQ, and xViz.


