Upcoming webinar on 'Inforiver Charts : The fastest way to deliver stories in Power BI', Aug 29th , Monday, 10.30 AM CST. Register Now
Upcoming webinar on 'Inforiver Charts : The fastest way to deliver stories in Power BI', Aug 29th , Monday, 10.30 AM CST. Register Now
Inforiver provides a wide array of customizations, data entry capabilities, analysis options, report design, and export options. Let’s take a quick look at the various moving parts of the Inforiver toolbar and how to navigate the different sections.
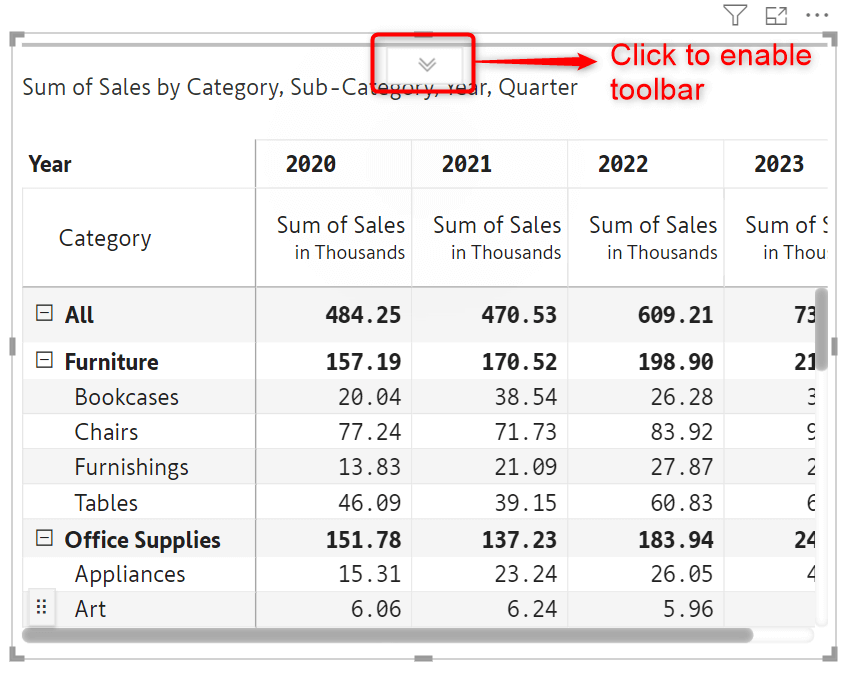
To enable the toolbar, after assigning data, hover over the top portion of the visual and click on the arrow icon. Note that that toolbar will automatically be displayed if you resize the visual to fill the canvas.
The Inforiver toolbar has 4 main ribbons:
Additional ribbons are displayed depending on the customization:
We’ll start with the Home tab.
The Home ribbon is divided into 7 different sections based on the functionality provided. Let’s explore the home ribbon.
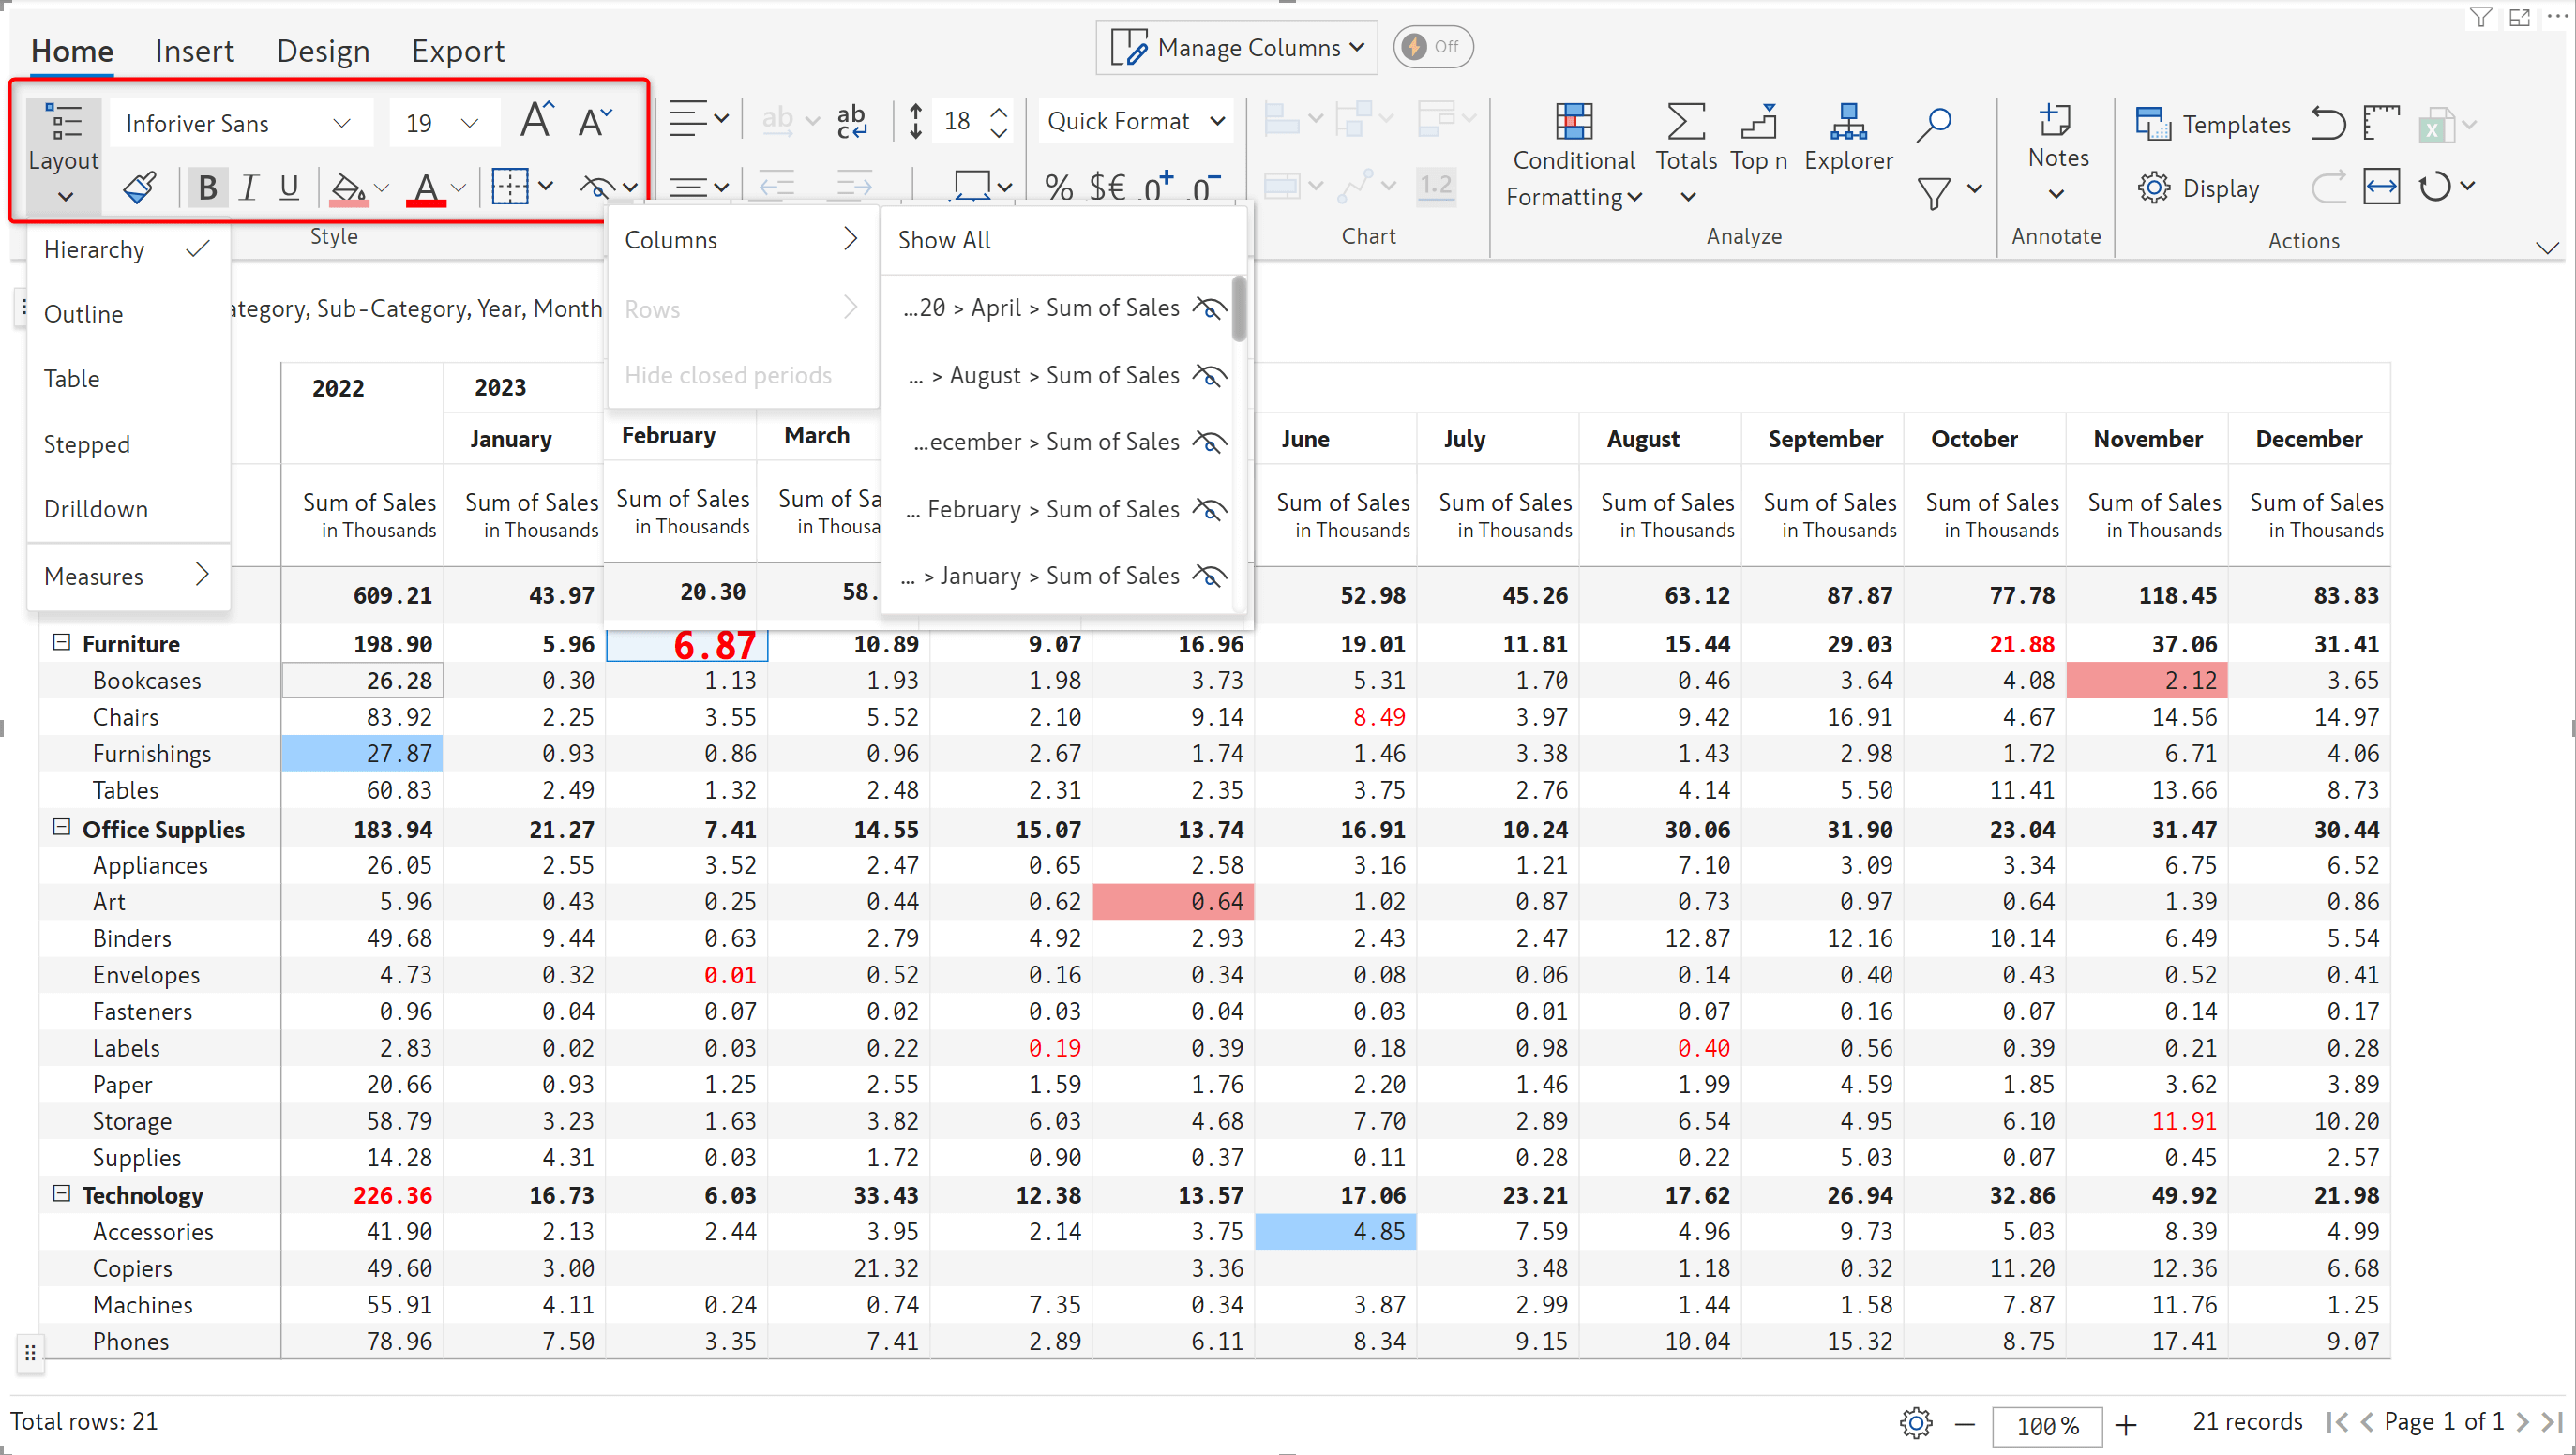
The options in this section can be used to:
Learn more about the Style section.
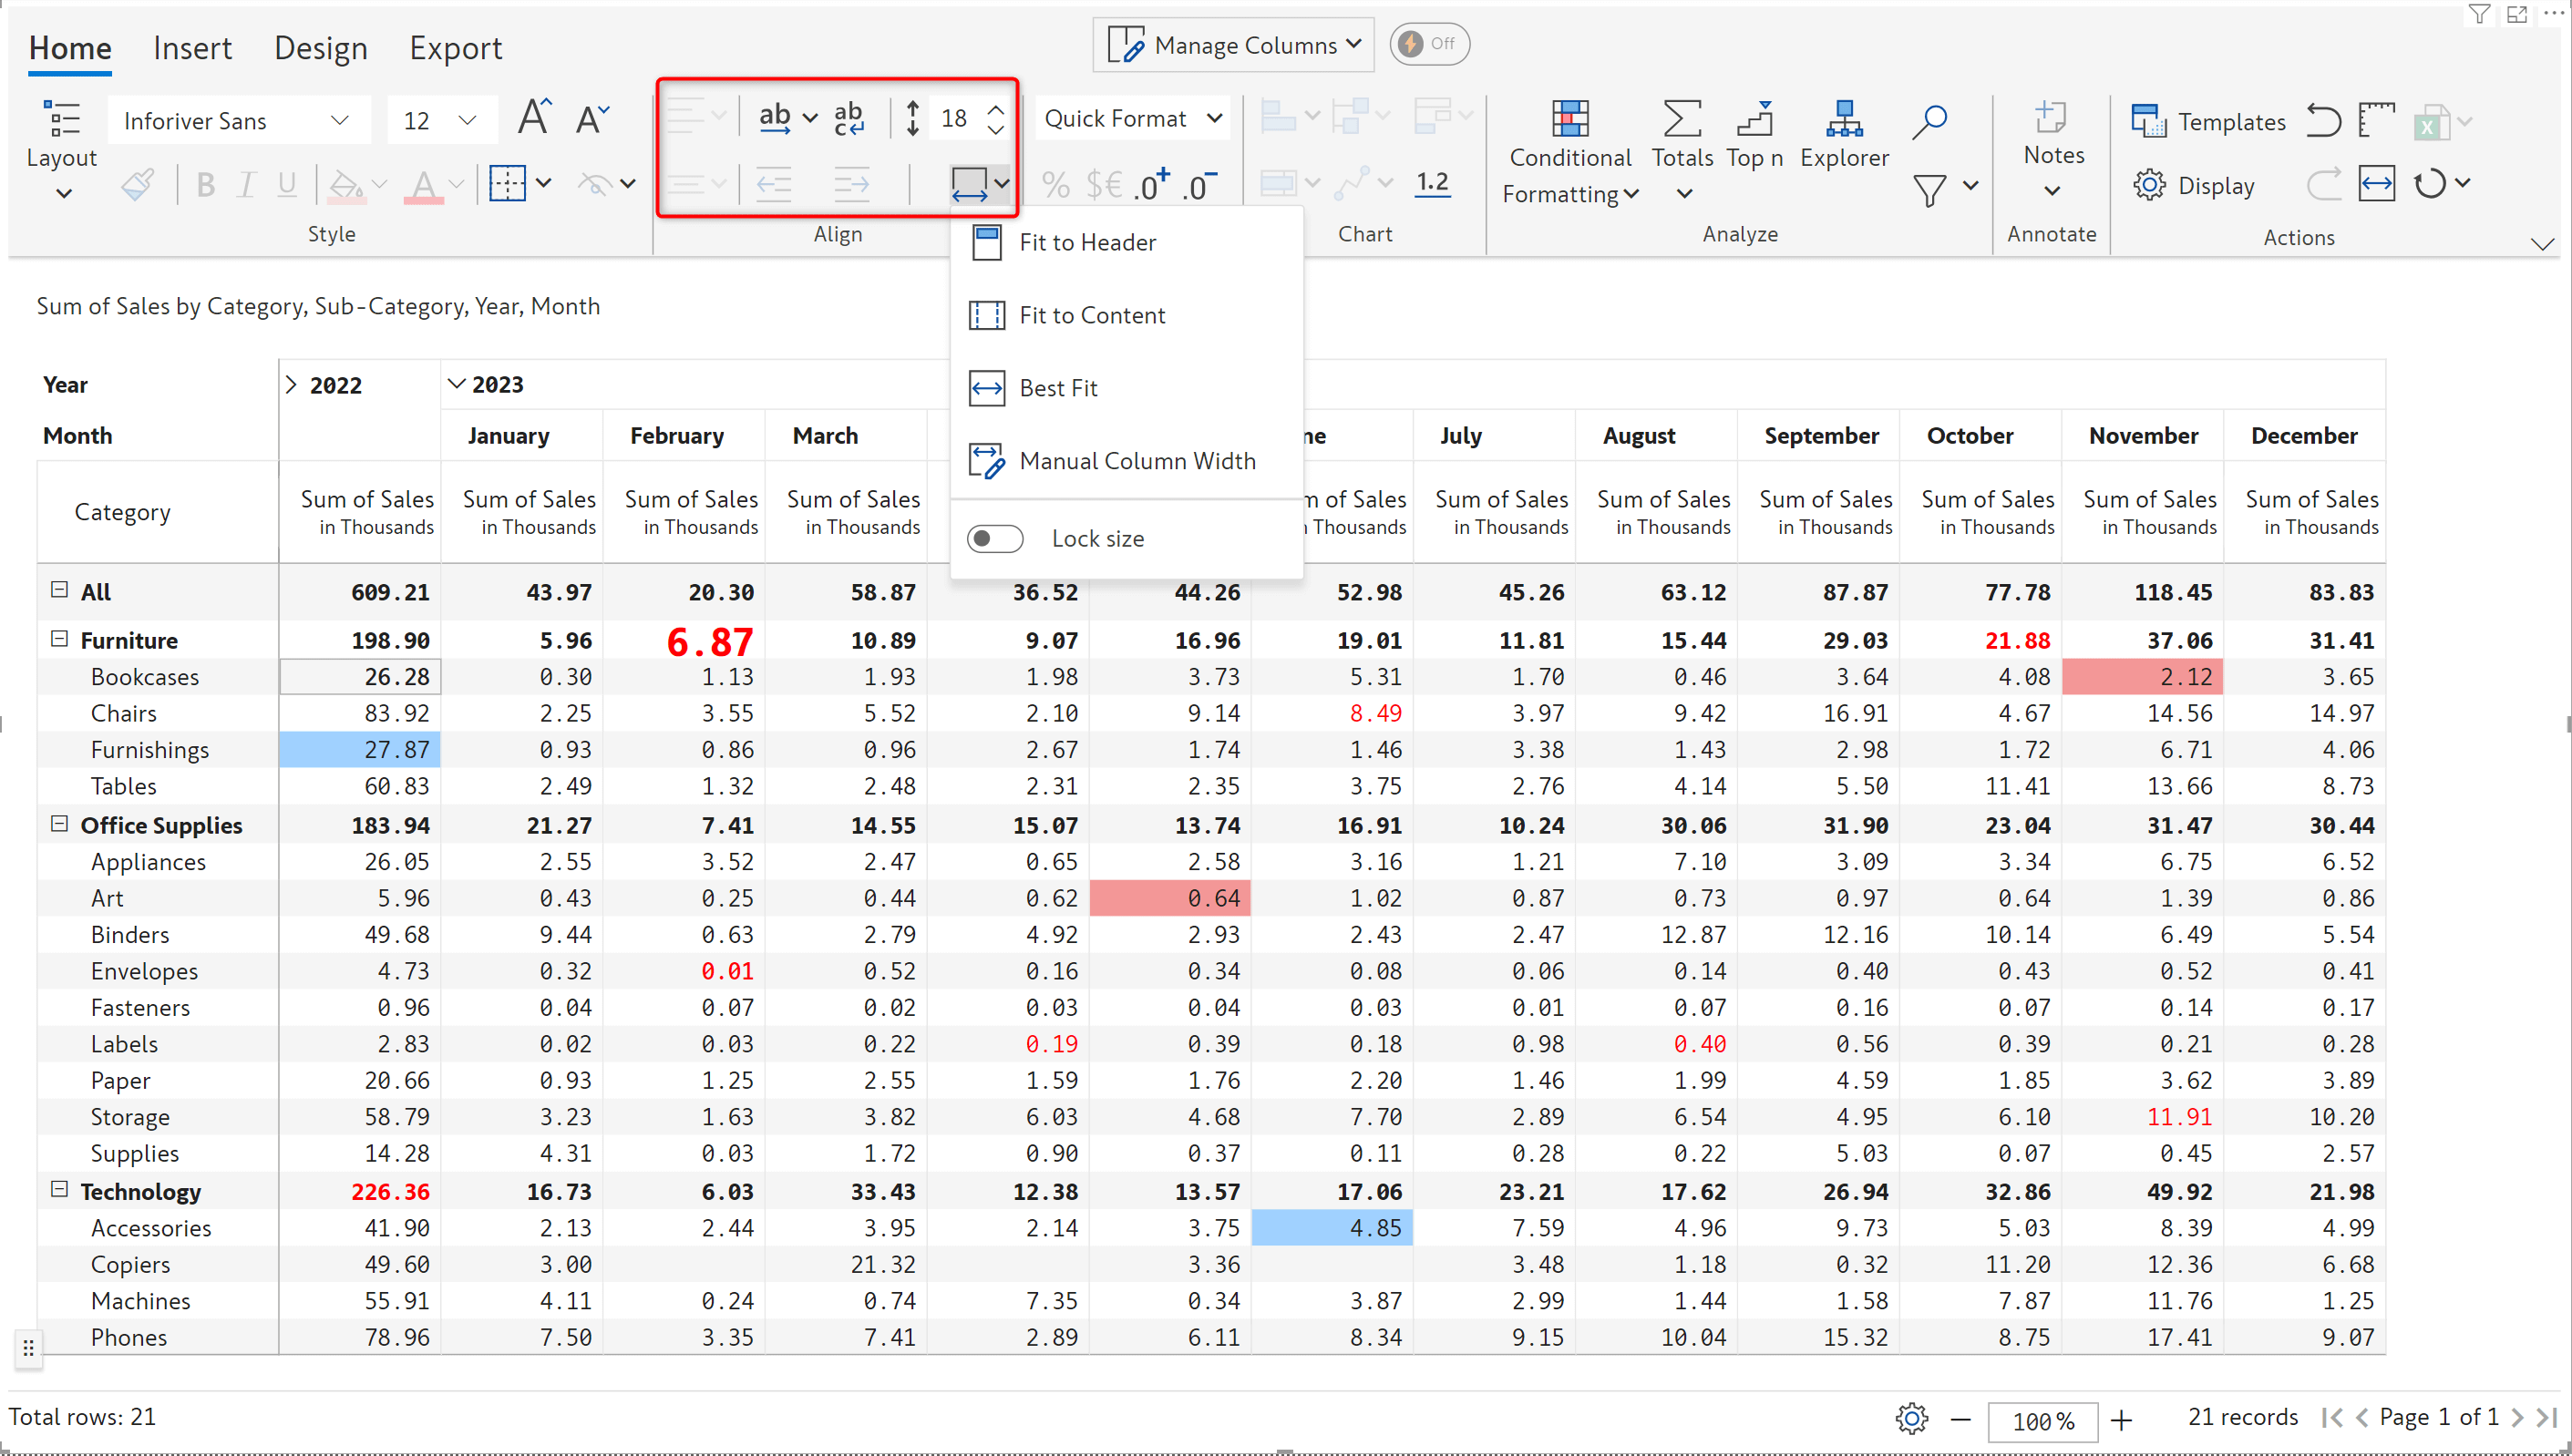
The options in this section can be used to:
Learn more about alignment options.
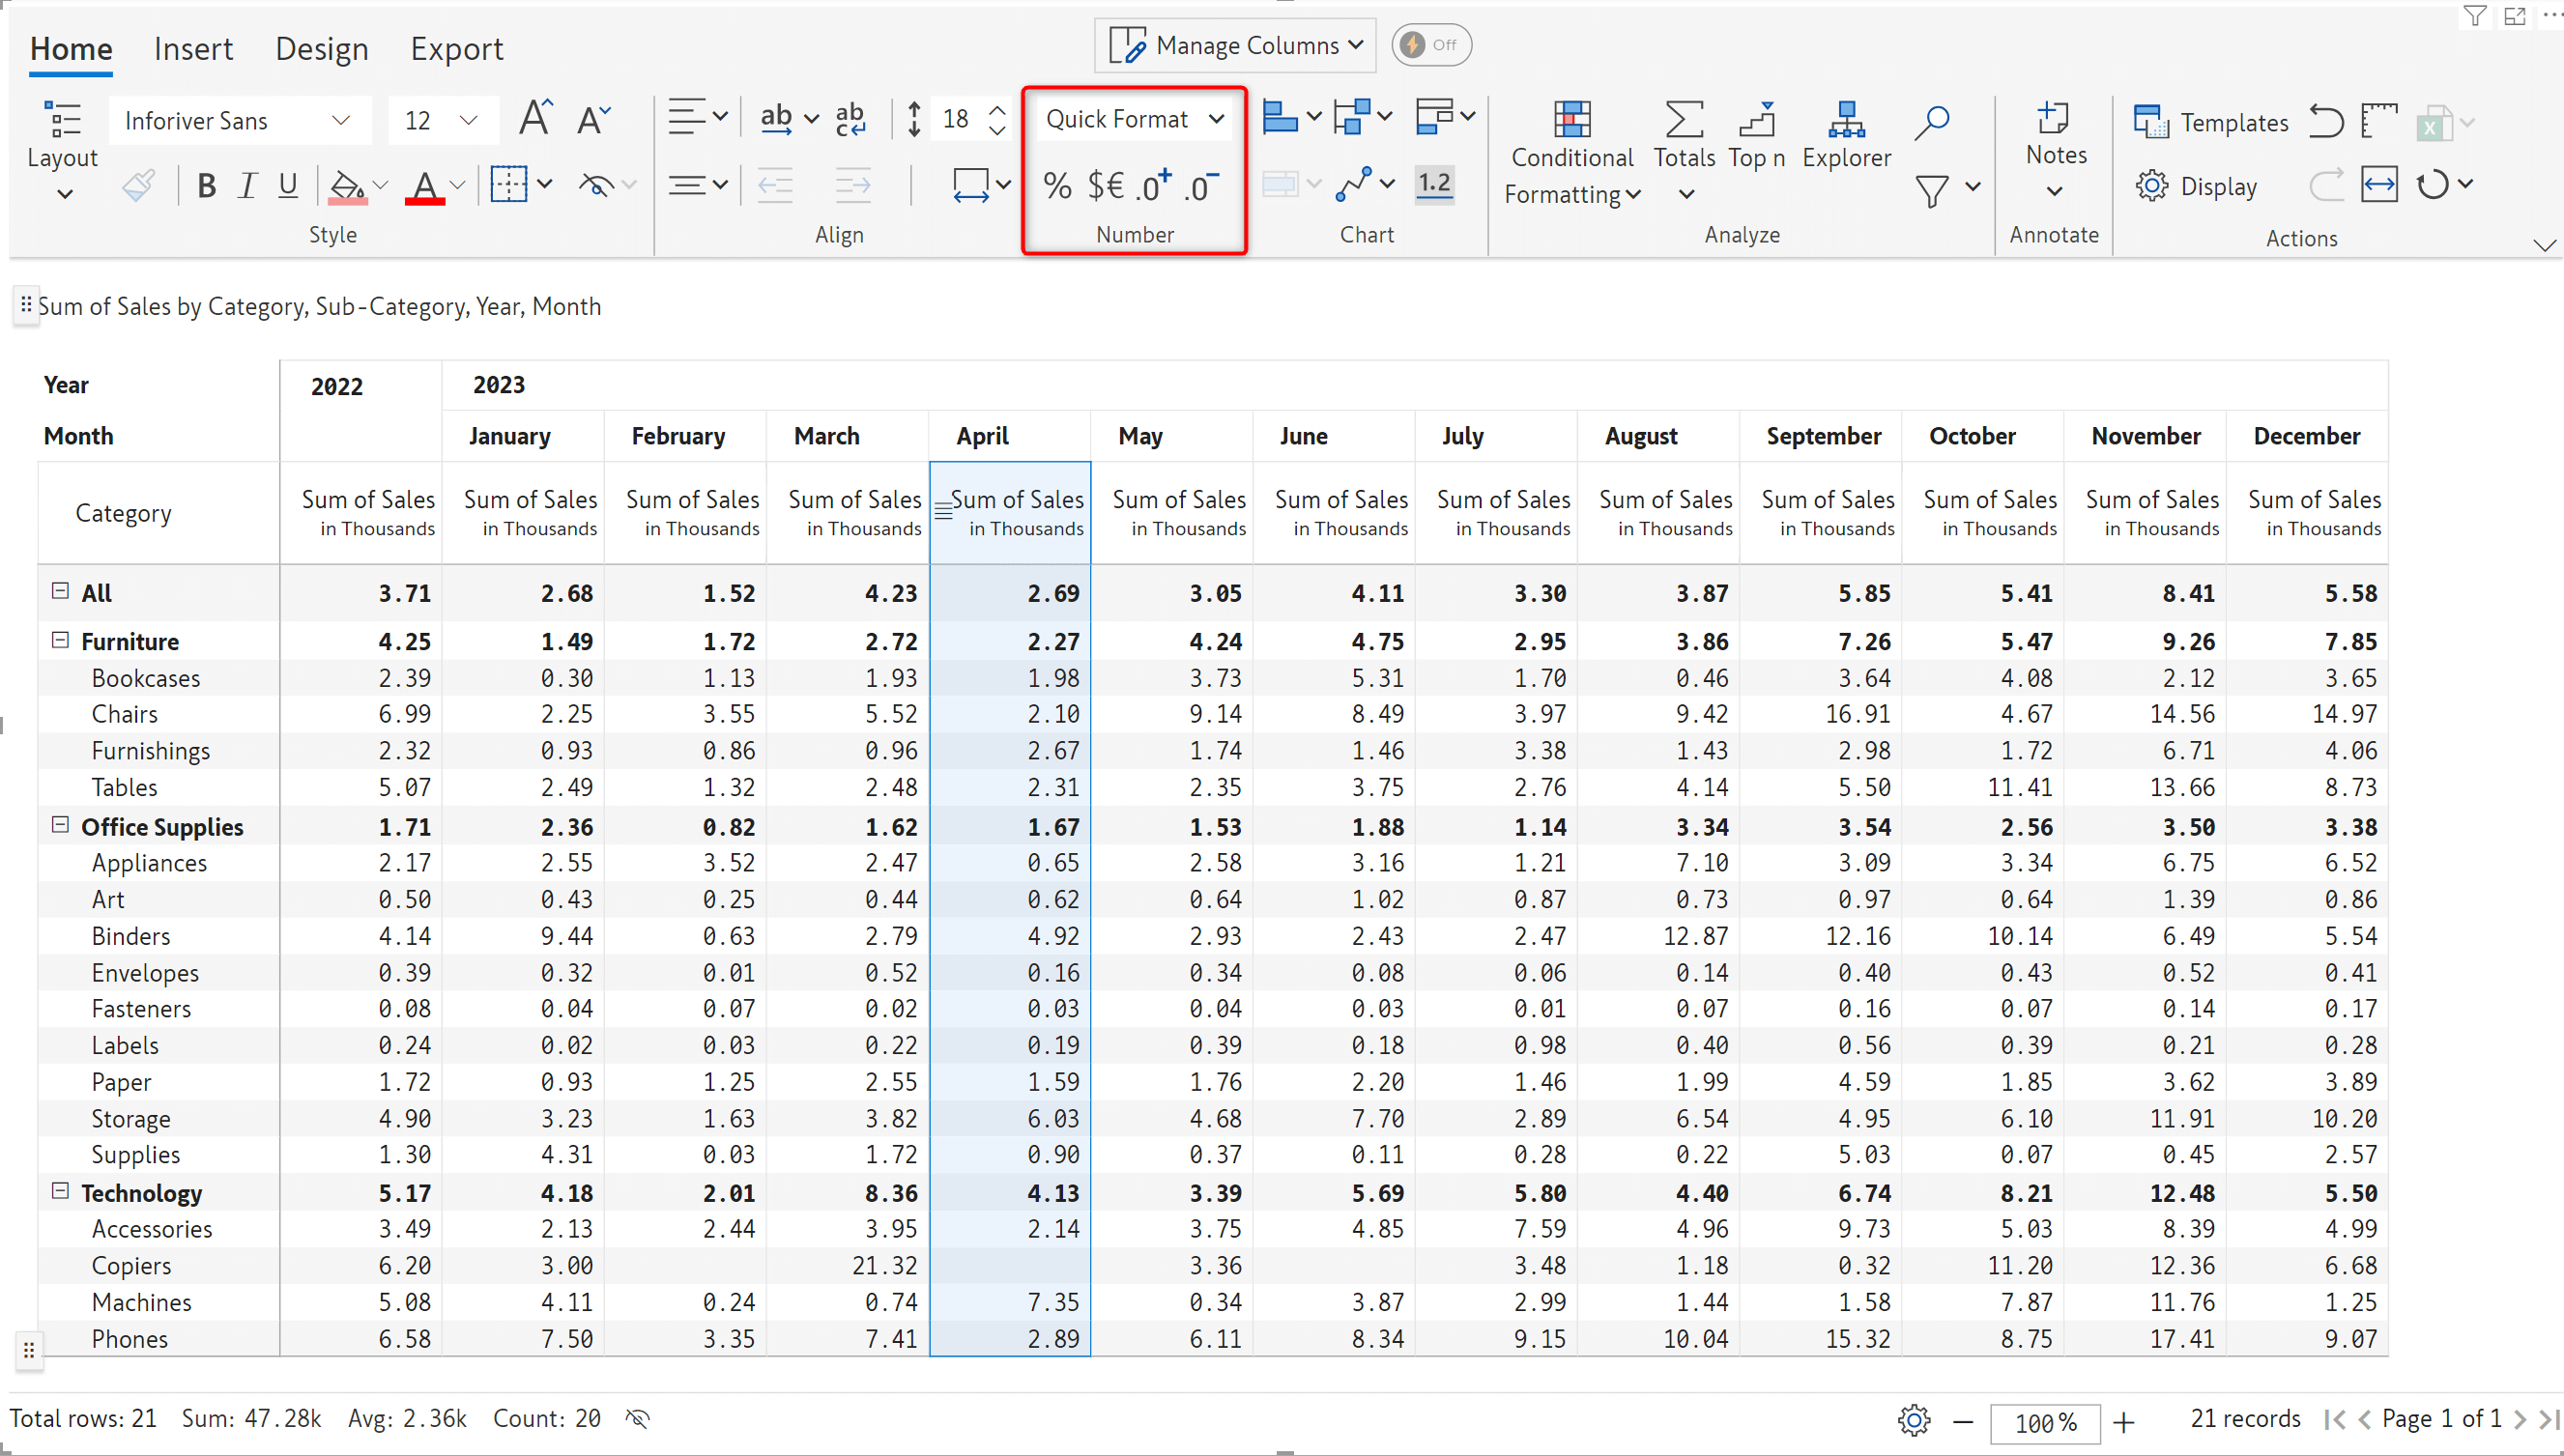
The options in this section can be used to set the scaling factor for the entire report or for individual measures; convert and display values as percentages; add a prefix or suffix to the values; increase or decrease the number of digits to be displayed after the decimal point.
Learn more about number formatting.
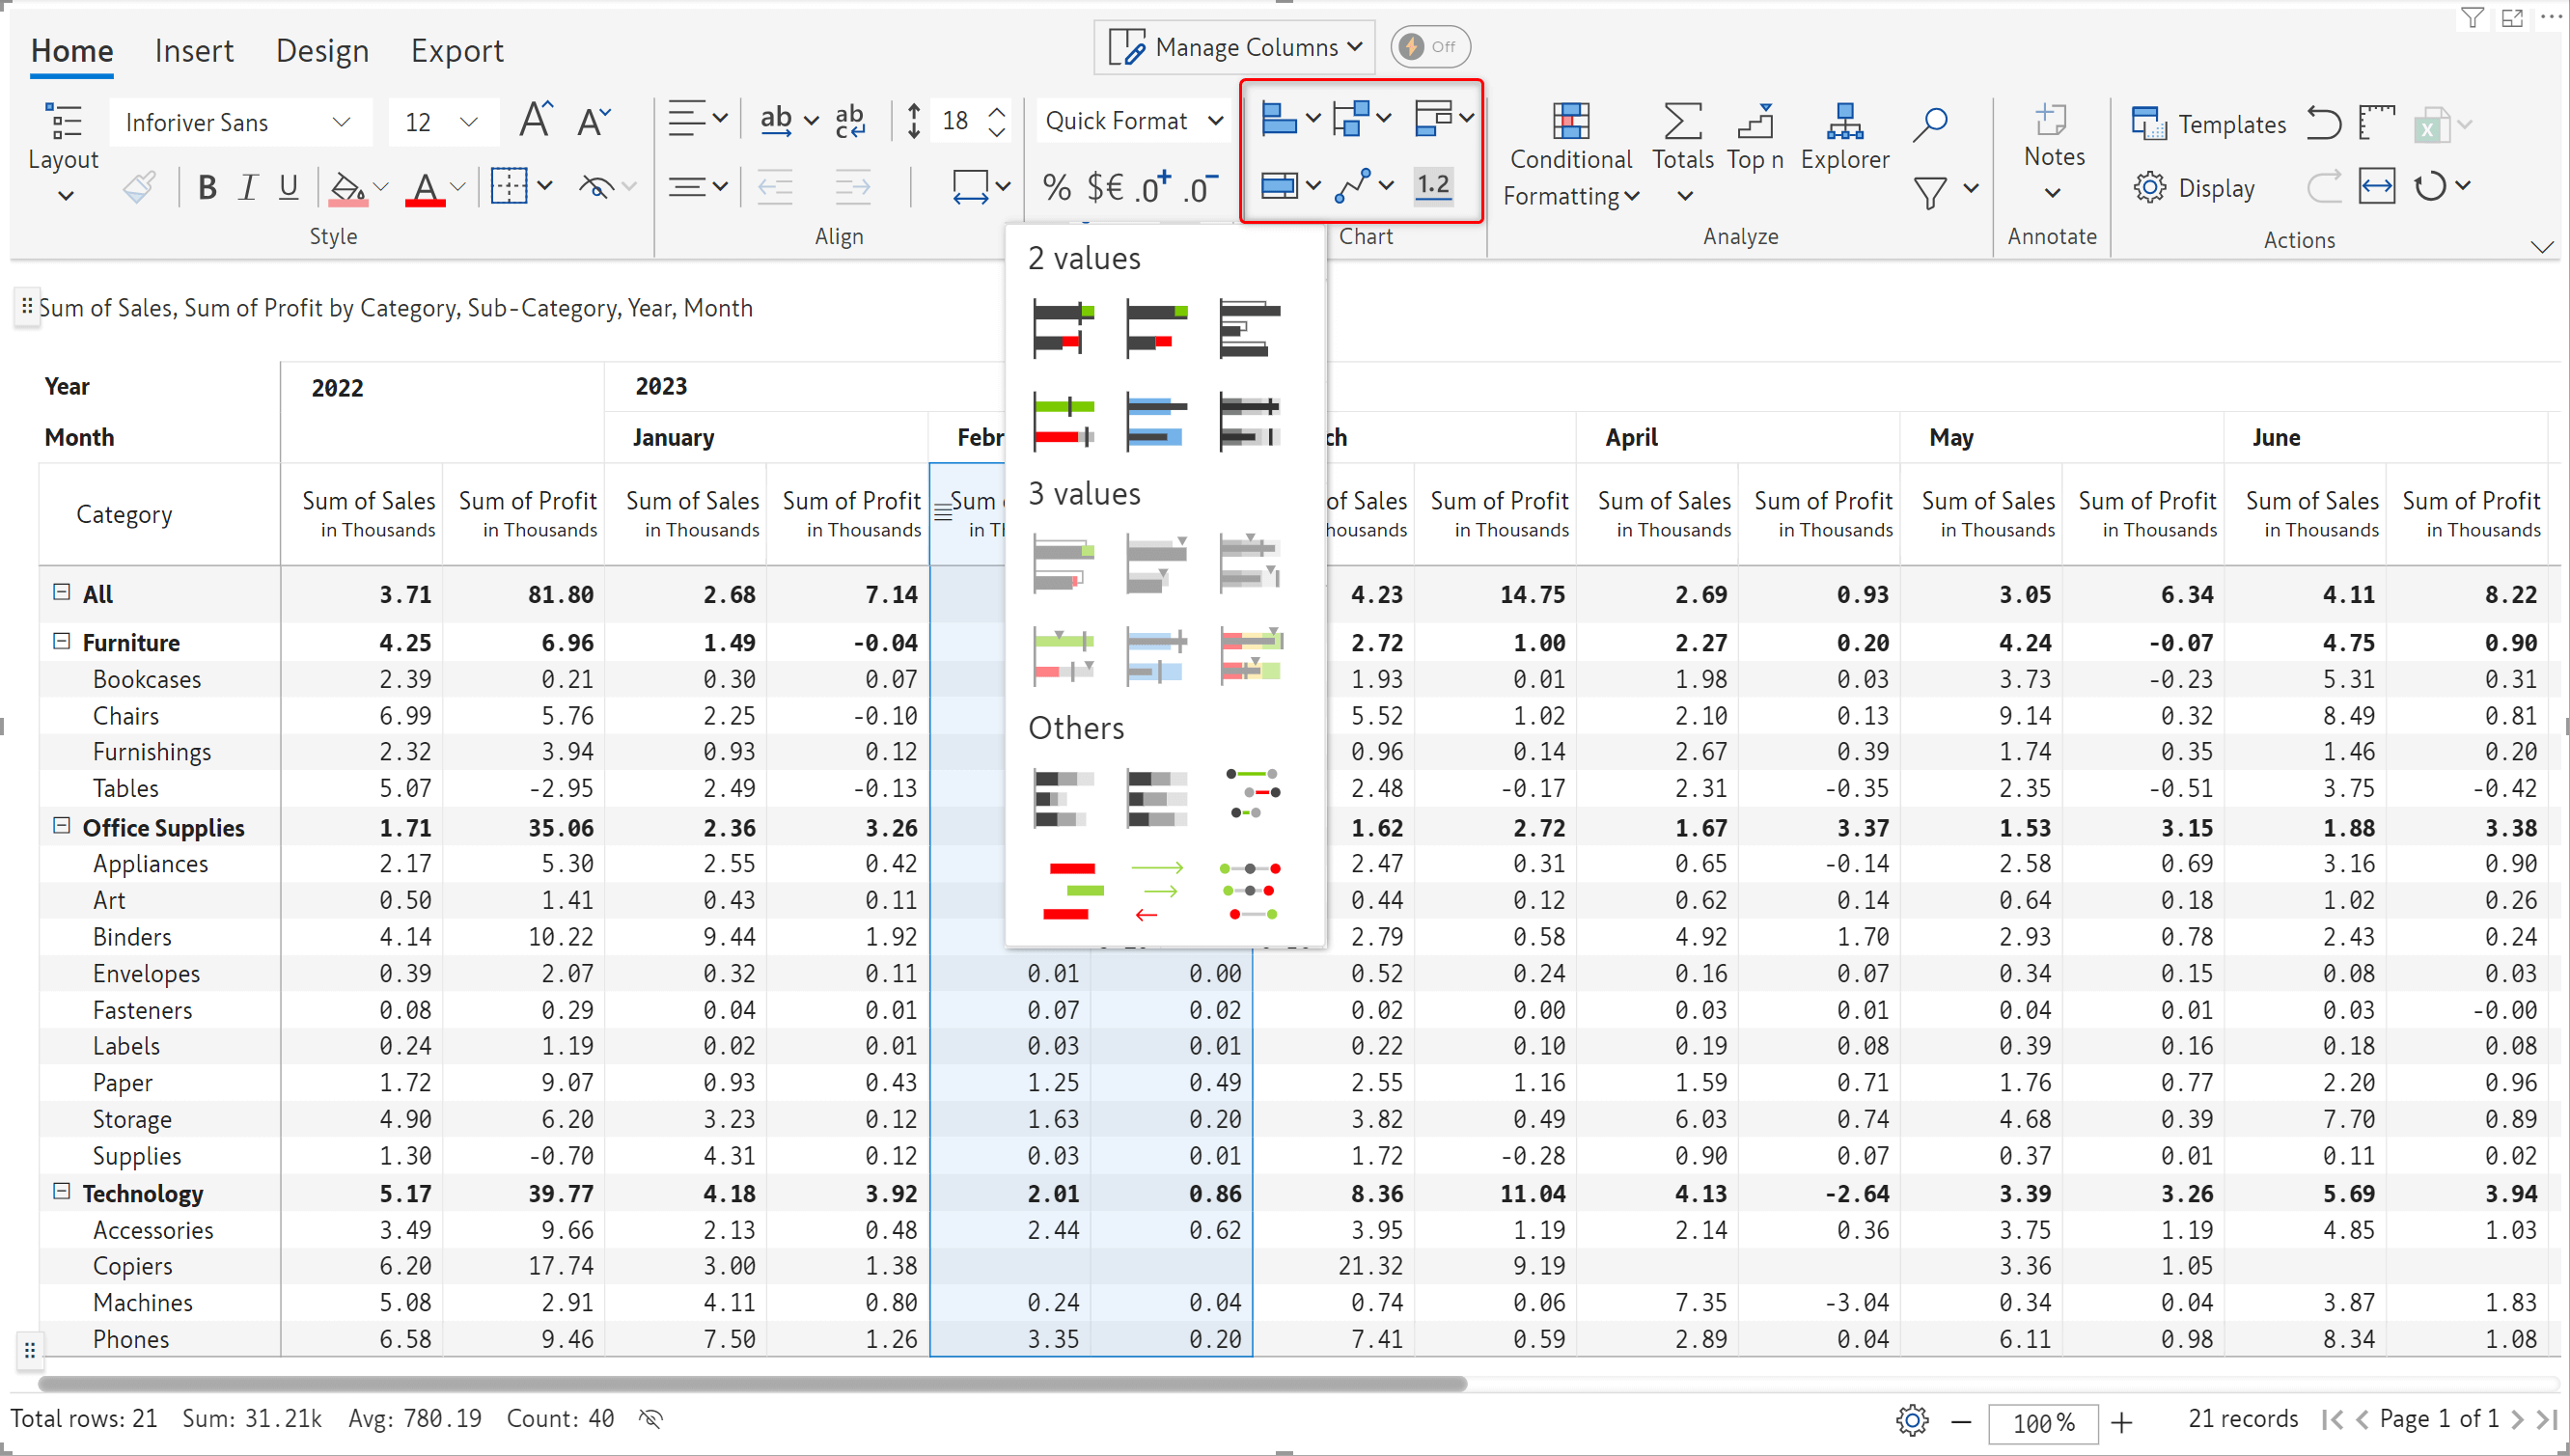
With Inforiver, you can add more perspective to your reports by embedding charts. You can choose from a range of charts, including bar charts, pin and lollipops, waterfall, bullets, and sparklines. This feature is explored later in this blog.
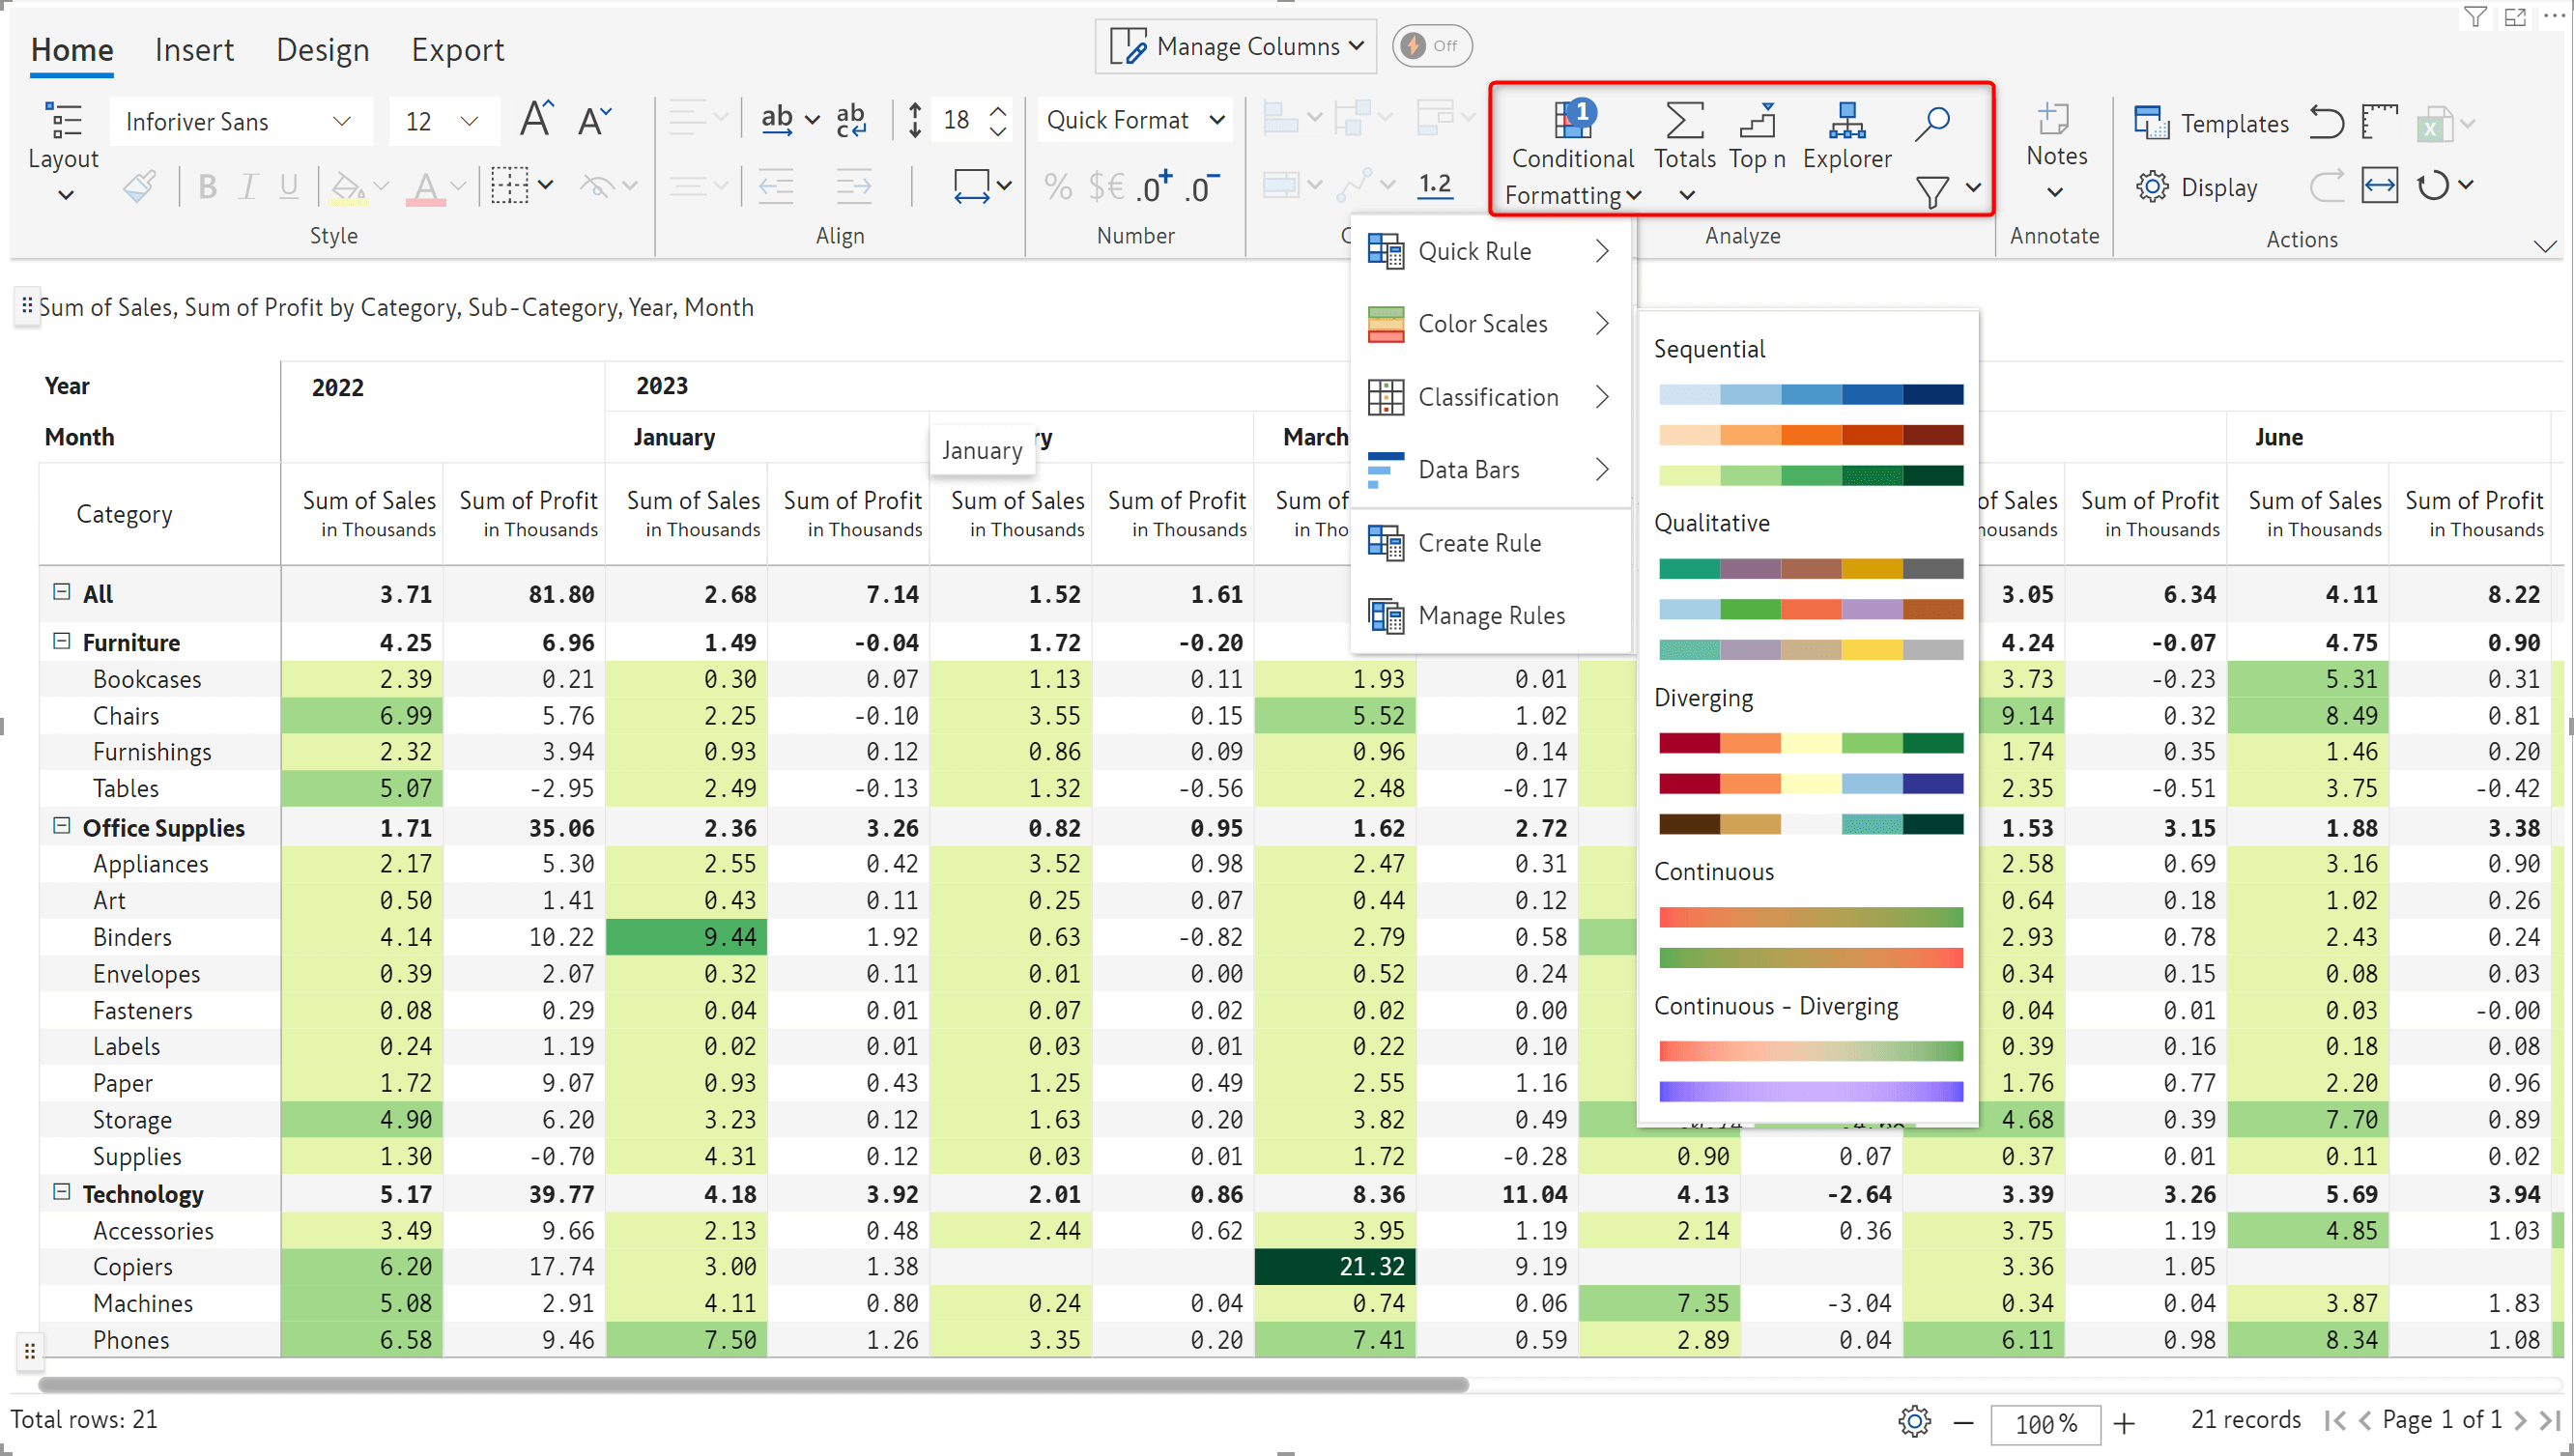
Conditional formatting: Emphasize your data using colours or data bars. You can set custom conditional formatting rules as well. For instance, if the sales measure is below a certain limit, then display those cells in red. Learn more about conditional formatting.
Totals: Display the grand total and subtotals for each category. The totals can be enabled for rows and columns. Learn more about setting totals and subtotals.
Top N: Rank your data and display the top-performing or bottom-performing categories. Learn more about Inforiver’s Top N feature.
Explorer: KPI explorer can be used to filter rows, columns, and measures, sort by name or value, and highlight row/column hierarchies using rules or ranges. Learn more about using the KPI explorer.
Search: Locate characters, words, and phrases in your Inforiver report easily with a keyword search.
Filter: Inforiver enables you to define custom filters on your data categories.
Learn more about searching and filtering in Inforiver.
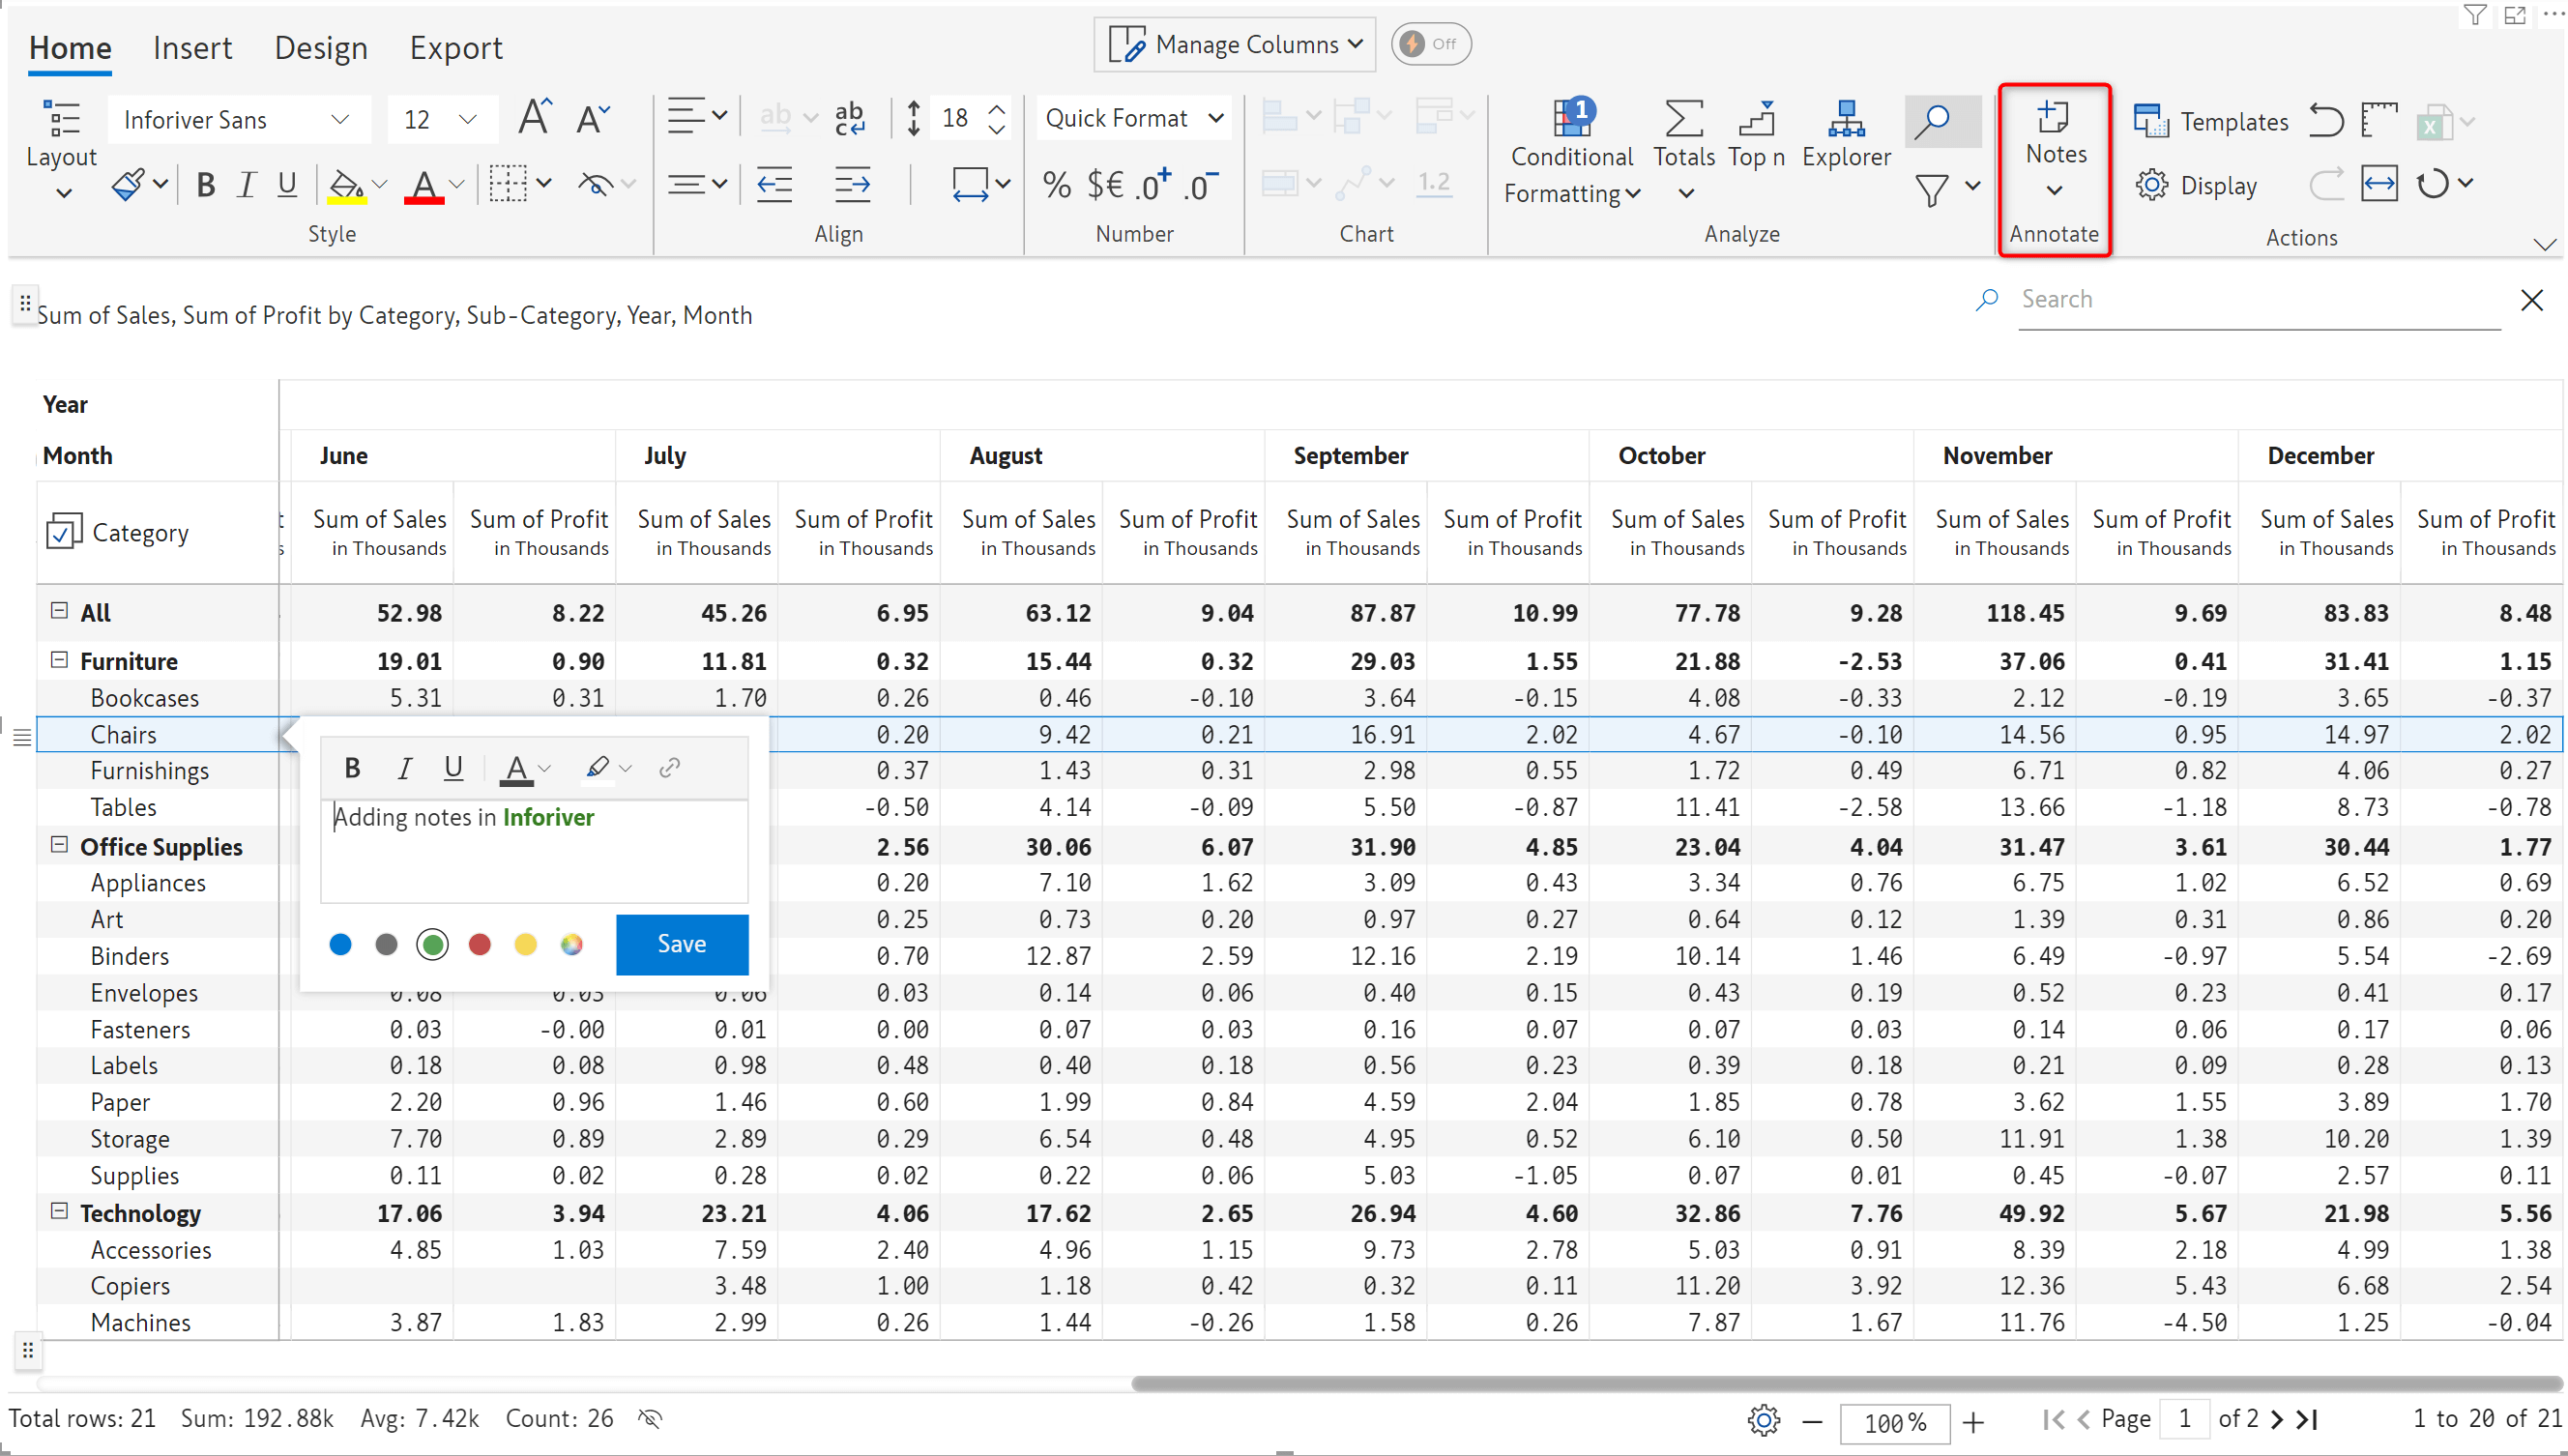
Add more context to your data using the notes feature. You can insert notes at a cell level, row/column header level, as notes column, and as footnotes. Learn more about leveraging notes.
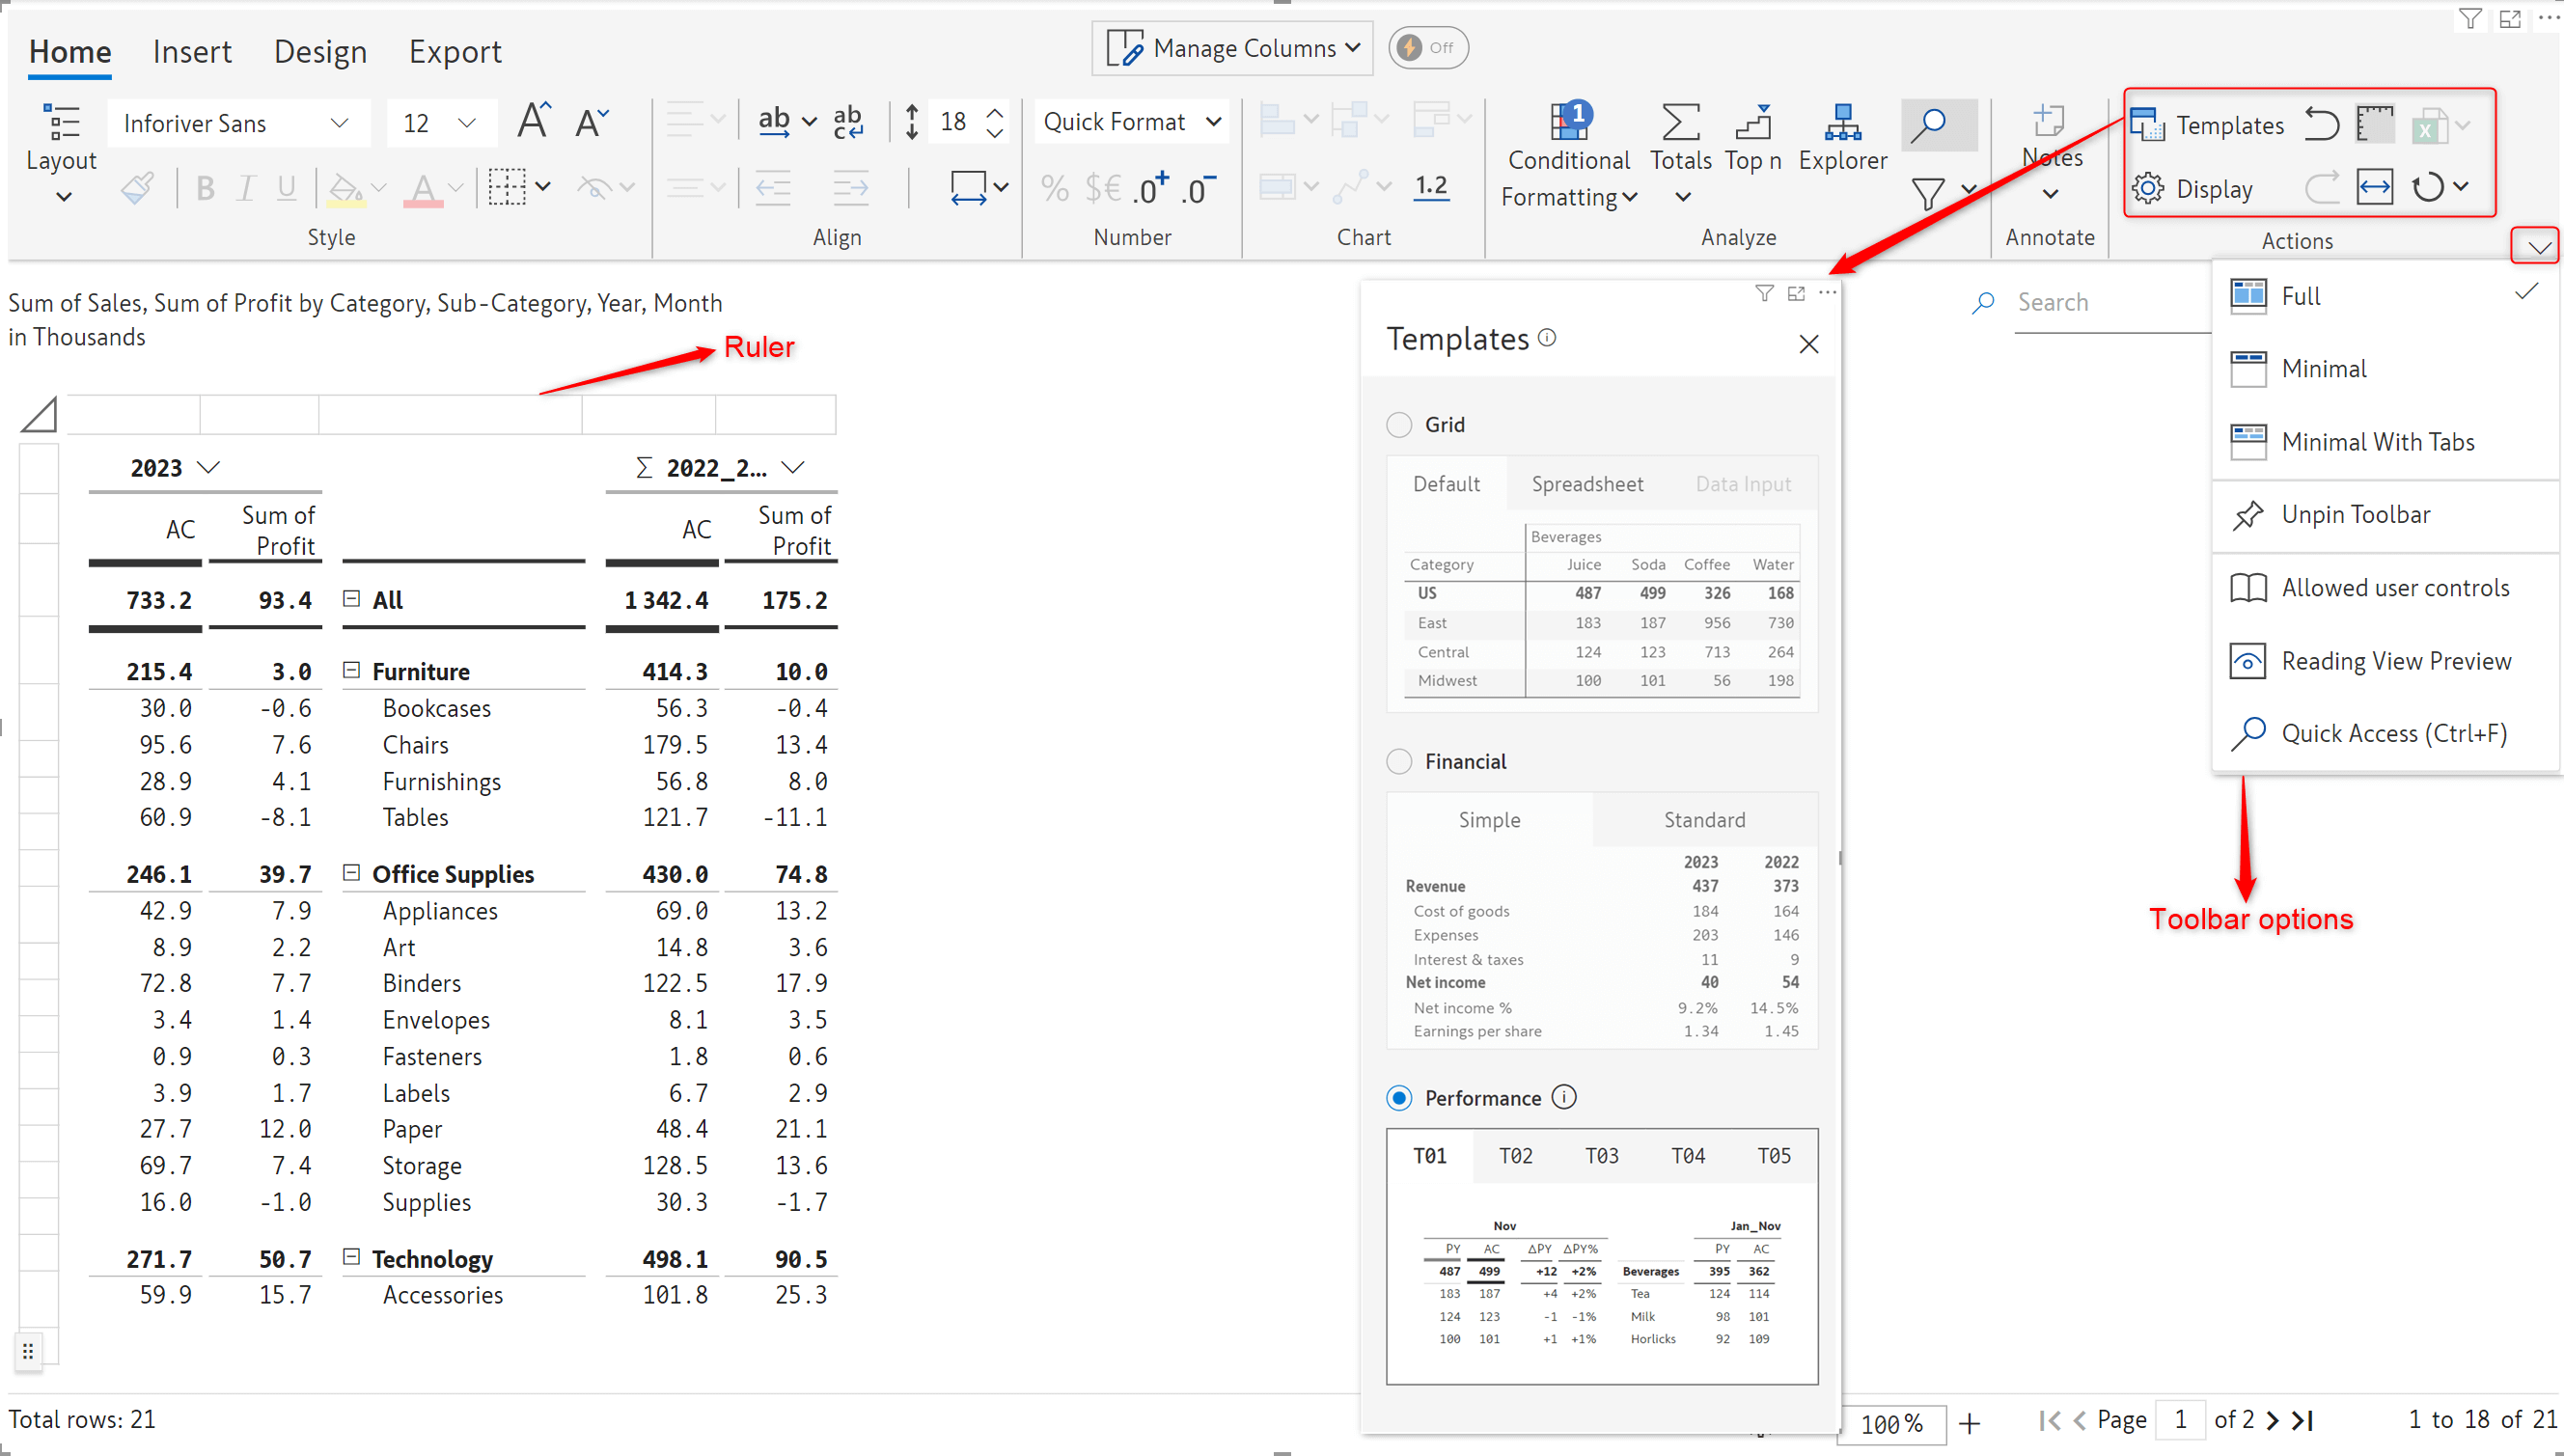
Templates: Inforiver offers 3 types of templates to display your data. Learn more about templates.
Display: Apply customizations for displaying data, hierarchical structures, and numbers. Use on-load scripts perform actions when the visual is loaded. Learn more about display settings.
Learn more about toolbar options, reverting changes to default settings, and enabling rails.
The Insert ribbon is divided into 7 different sections – let’s see what each section does.
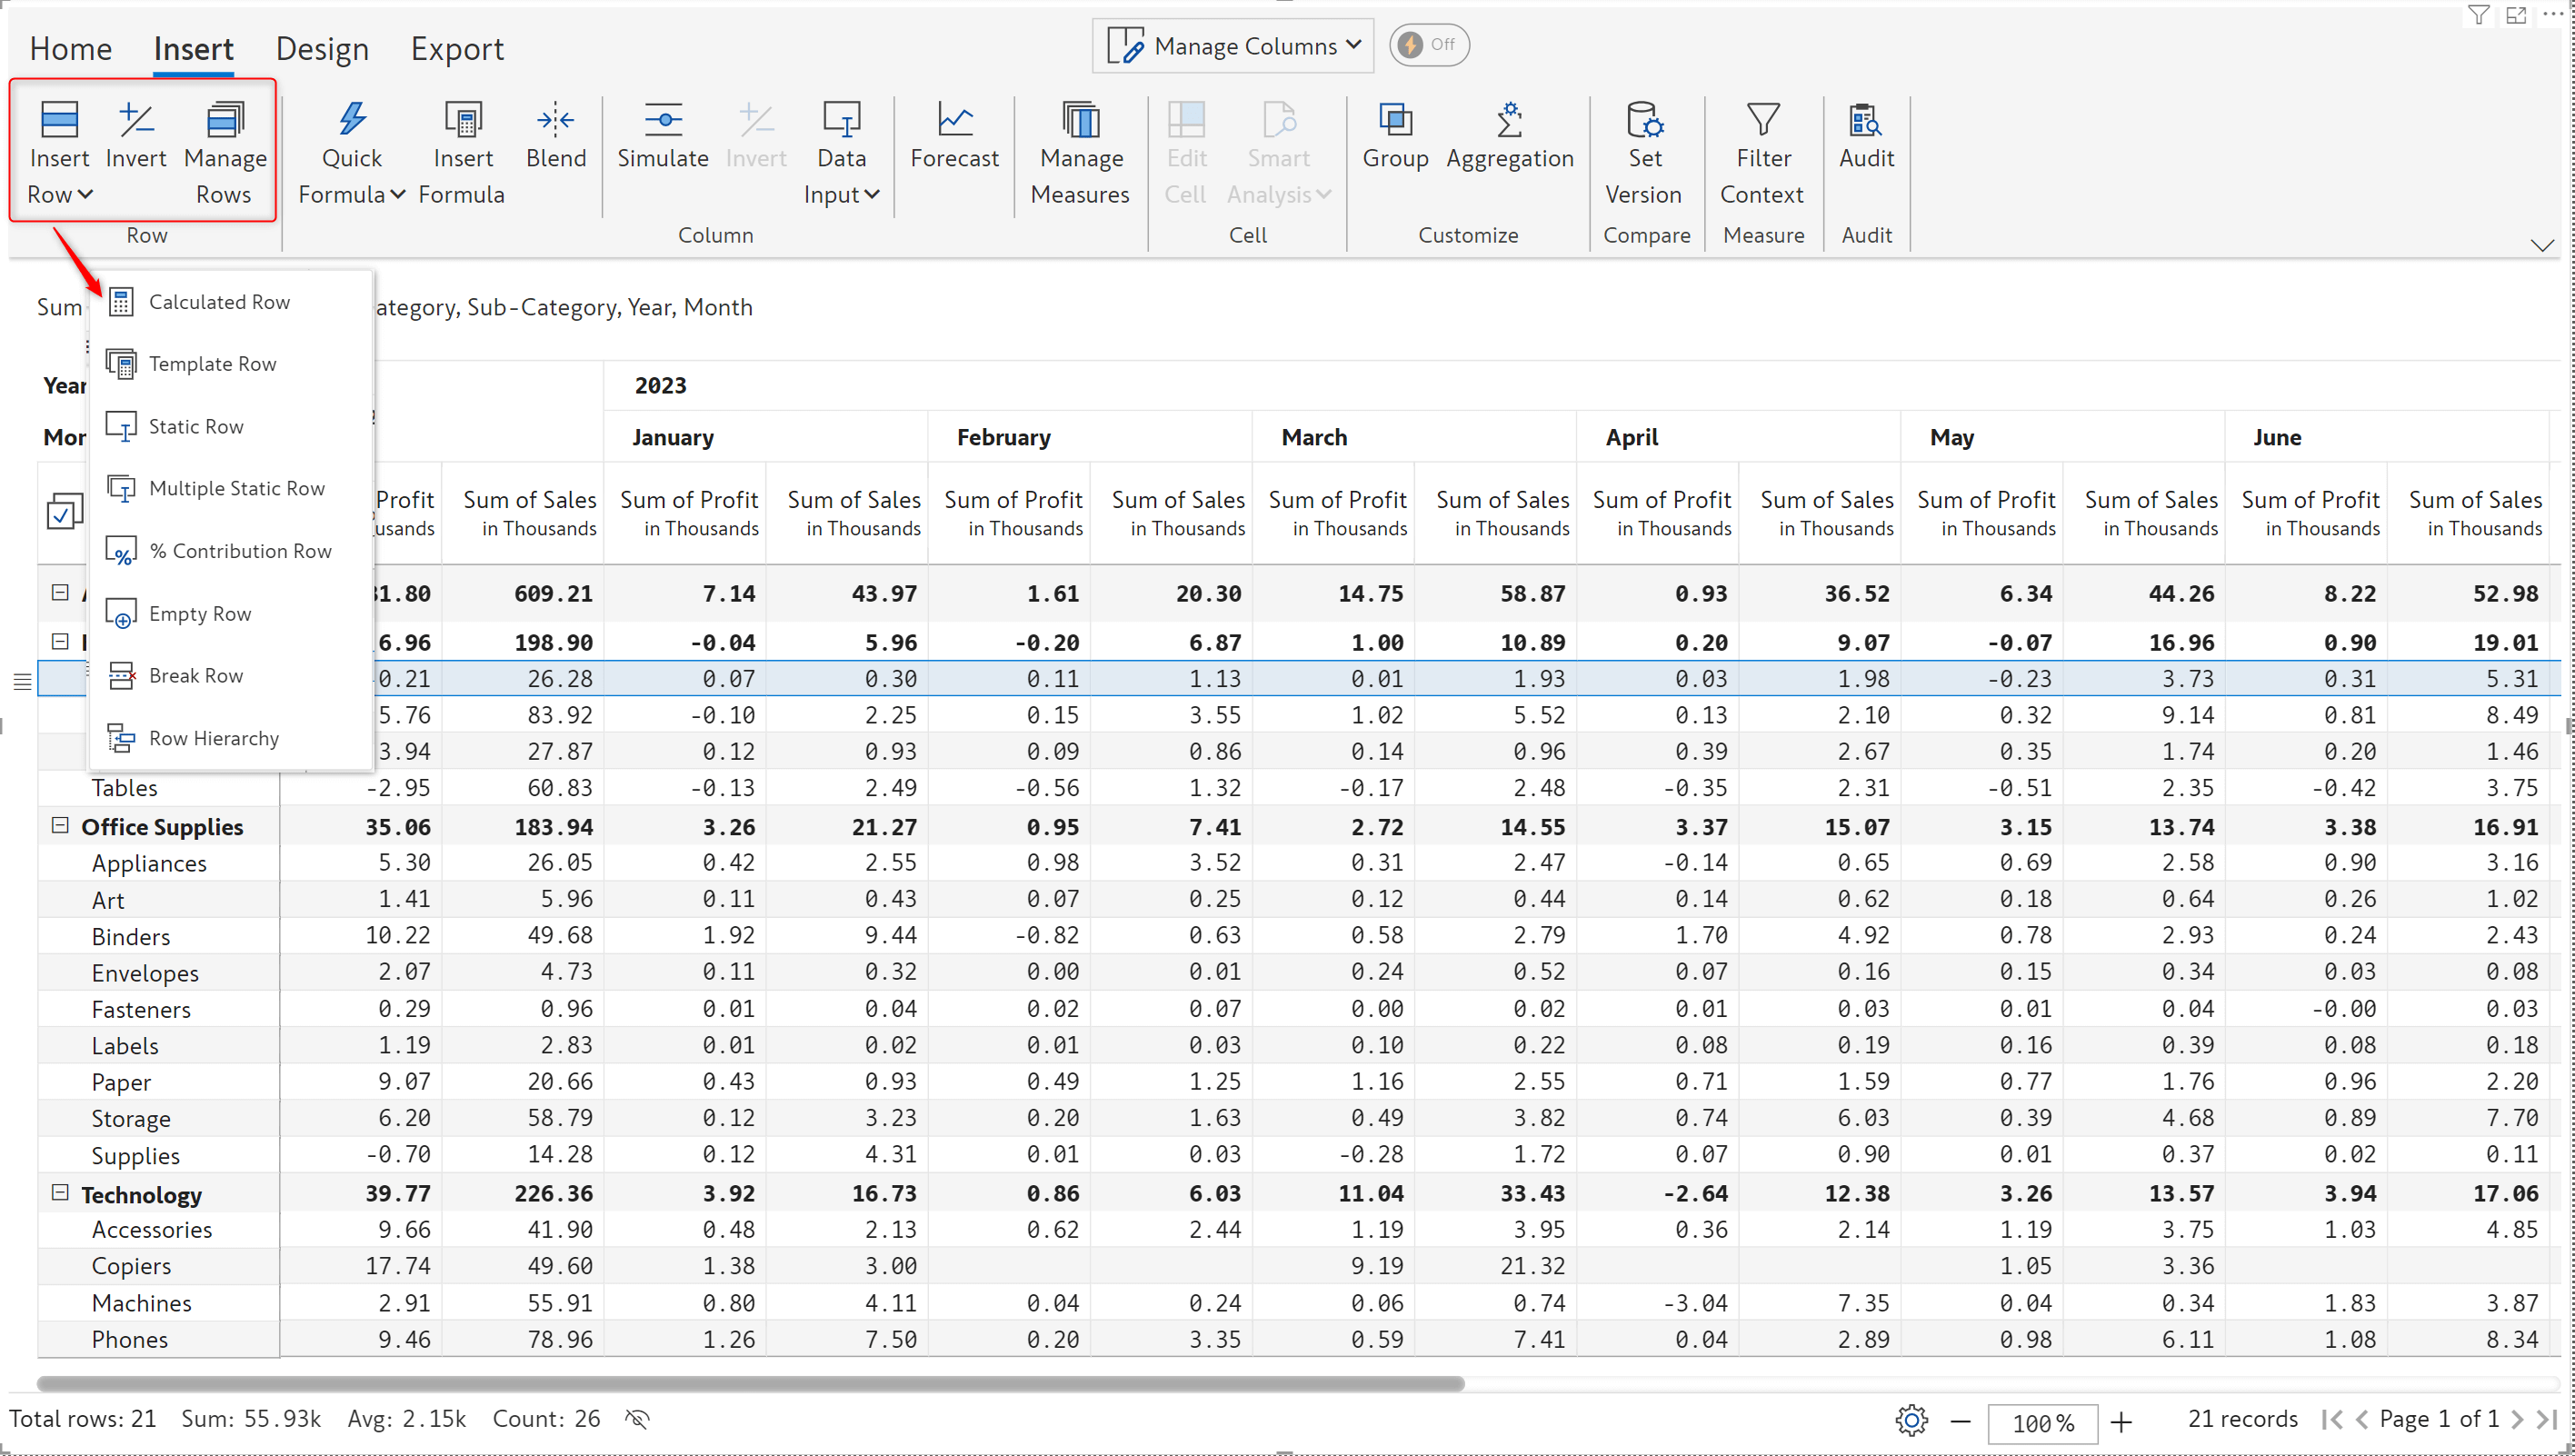
Insert data input rows and calculated rows using the options in this section. You can also invert rows in a single click. Learn more about working with calculated rows, manual input rows, and inverting rows.
You can insert calculated columns using Inforiver’s built-in formulae or write custom formulae. You can also create manual input columns with numeric, text, drop down, checkboxes and date options. Inforiver also enables you to run simulations on your data and create rolling forecasts.
Learn more about creating columns using quick formulae, custom formulae, data input columns, running simulations, and forecasting.

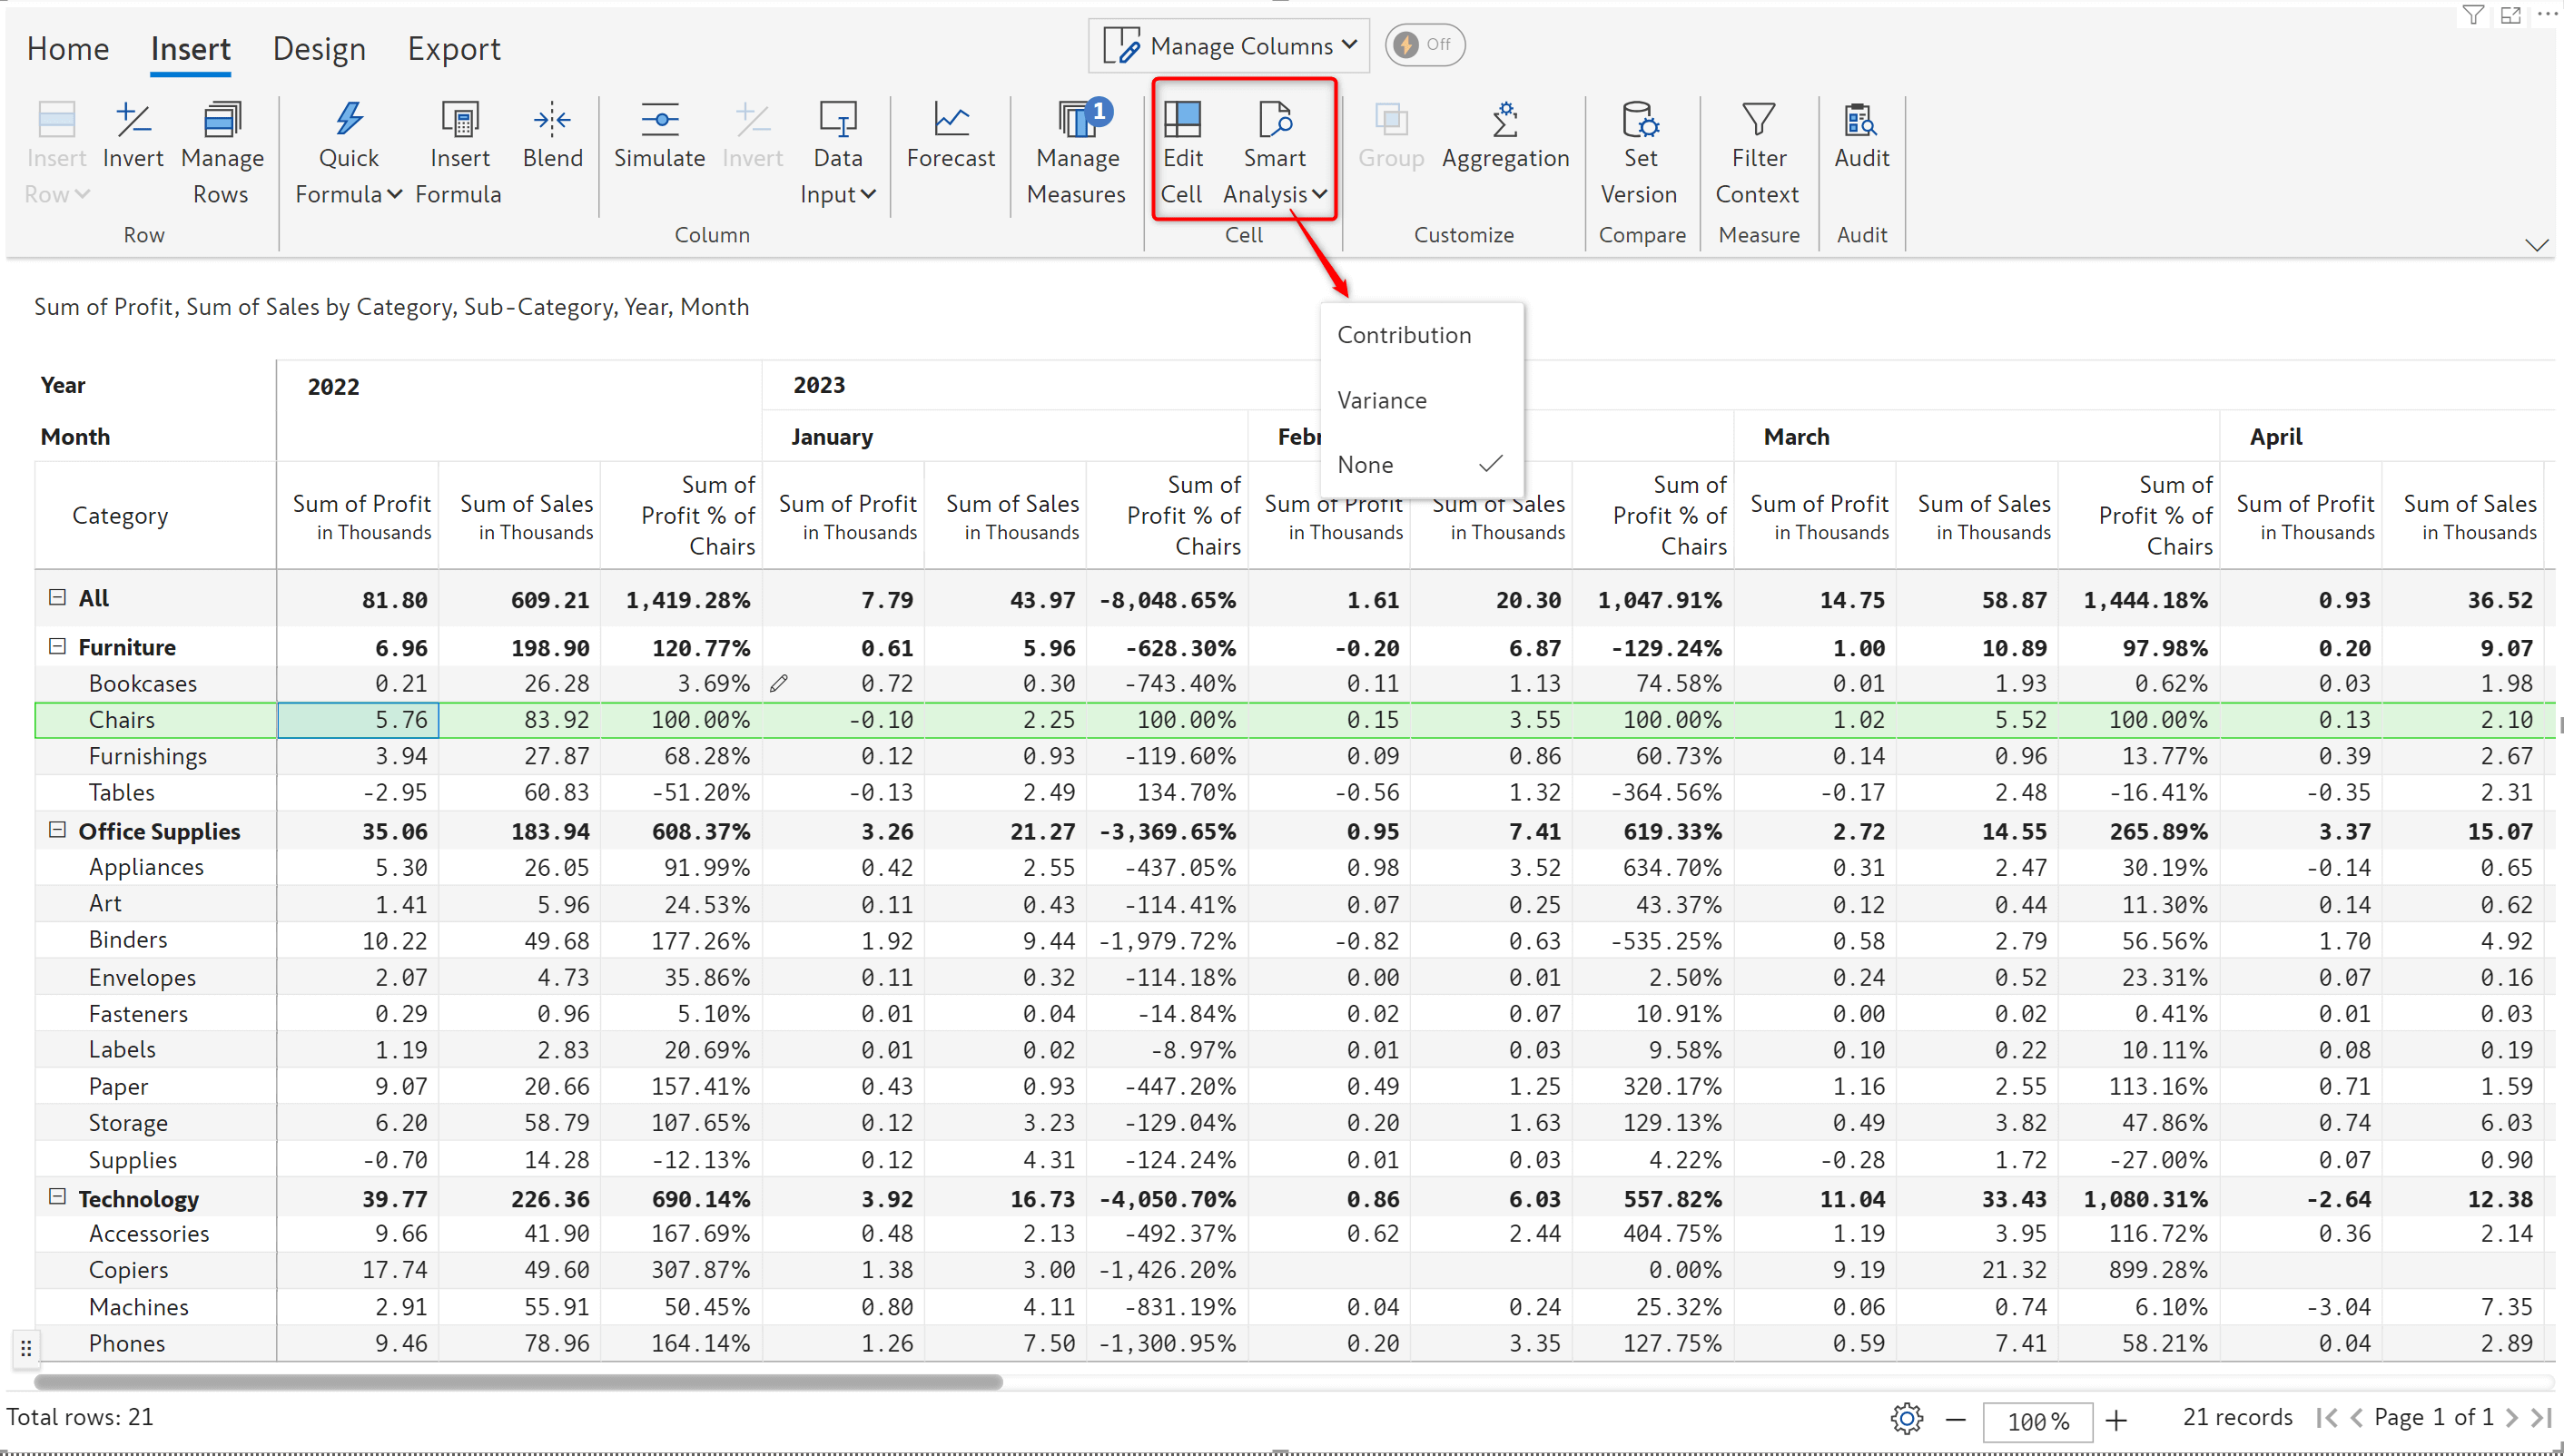
You can use the edit cell button to enable the formula bar and key in a custom calculation for a particular cell. Use the smart analysis option to add % contribution and variance % columns based on any cell. Learn more about smart analysis.
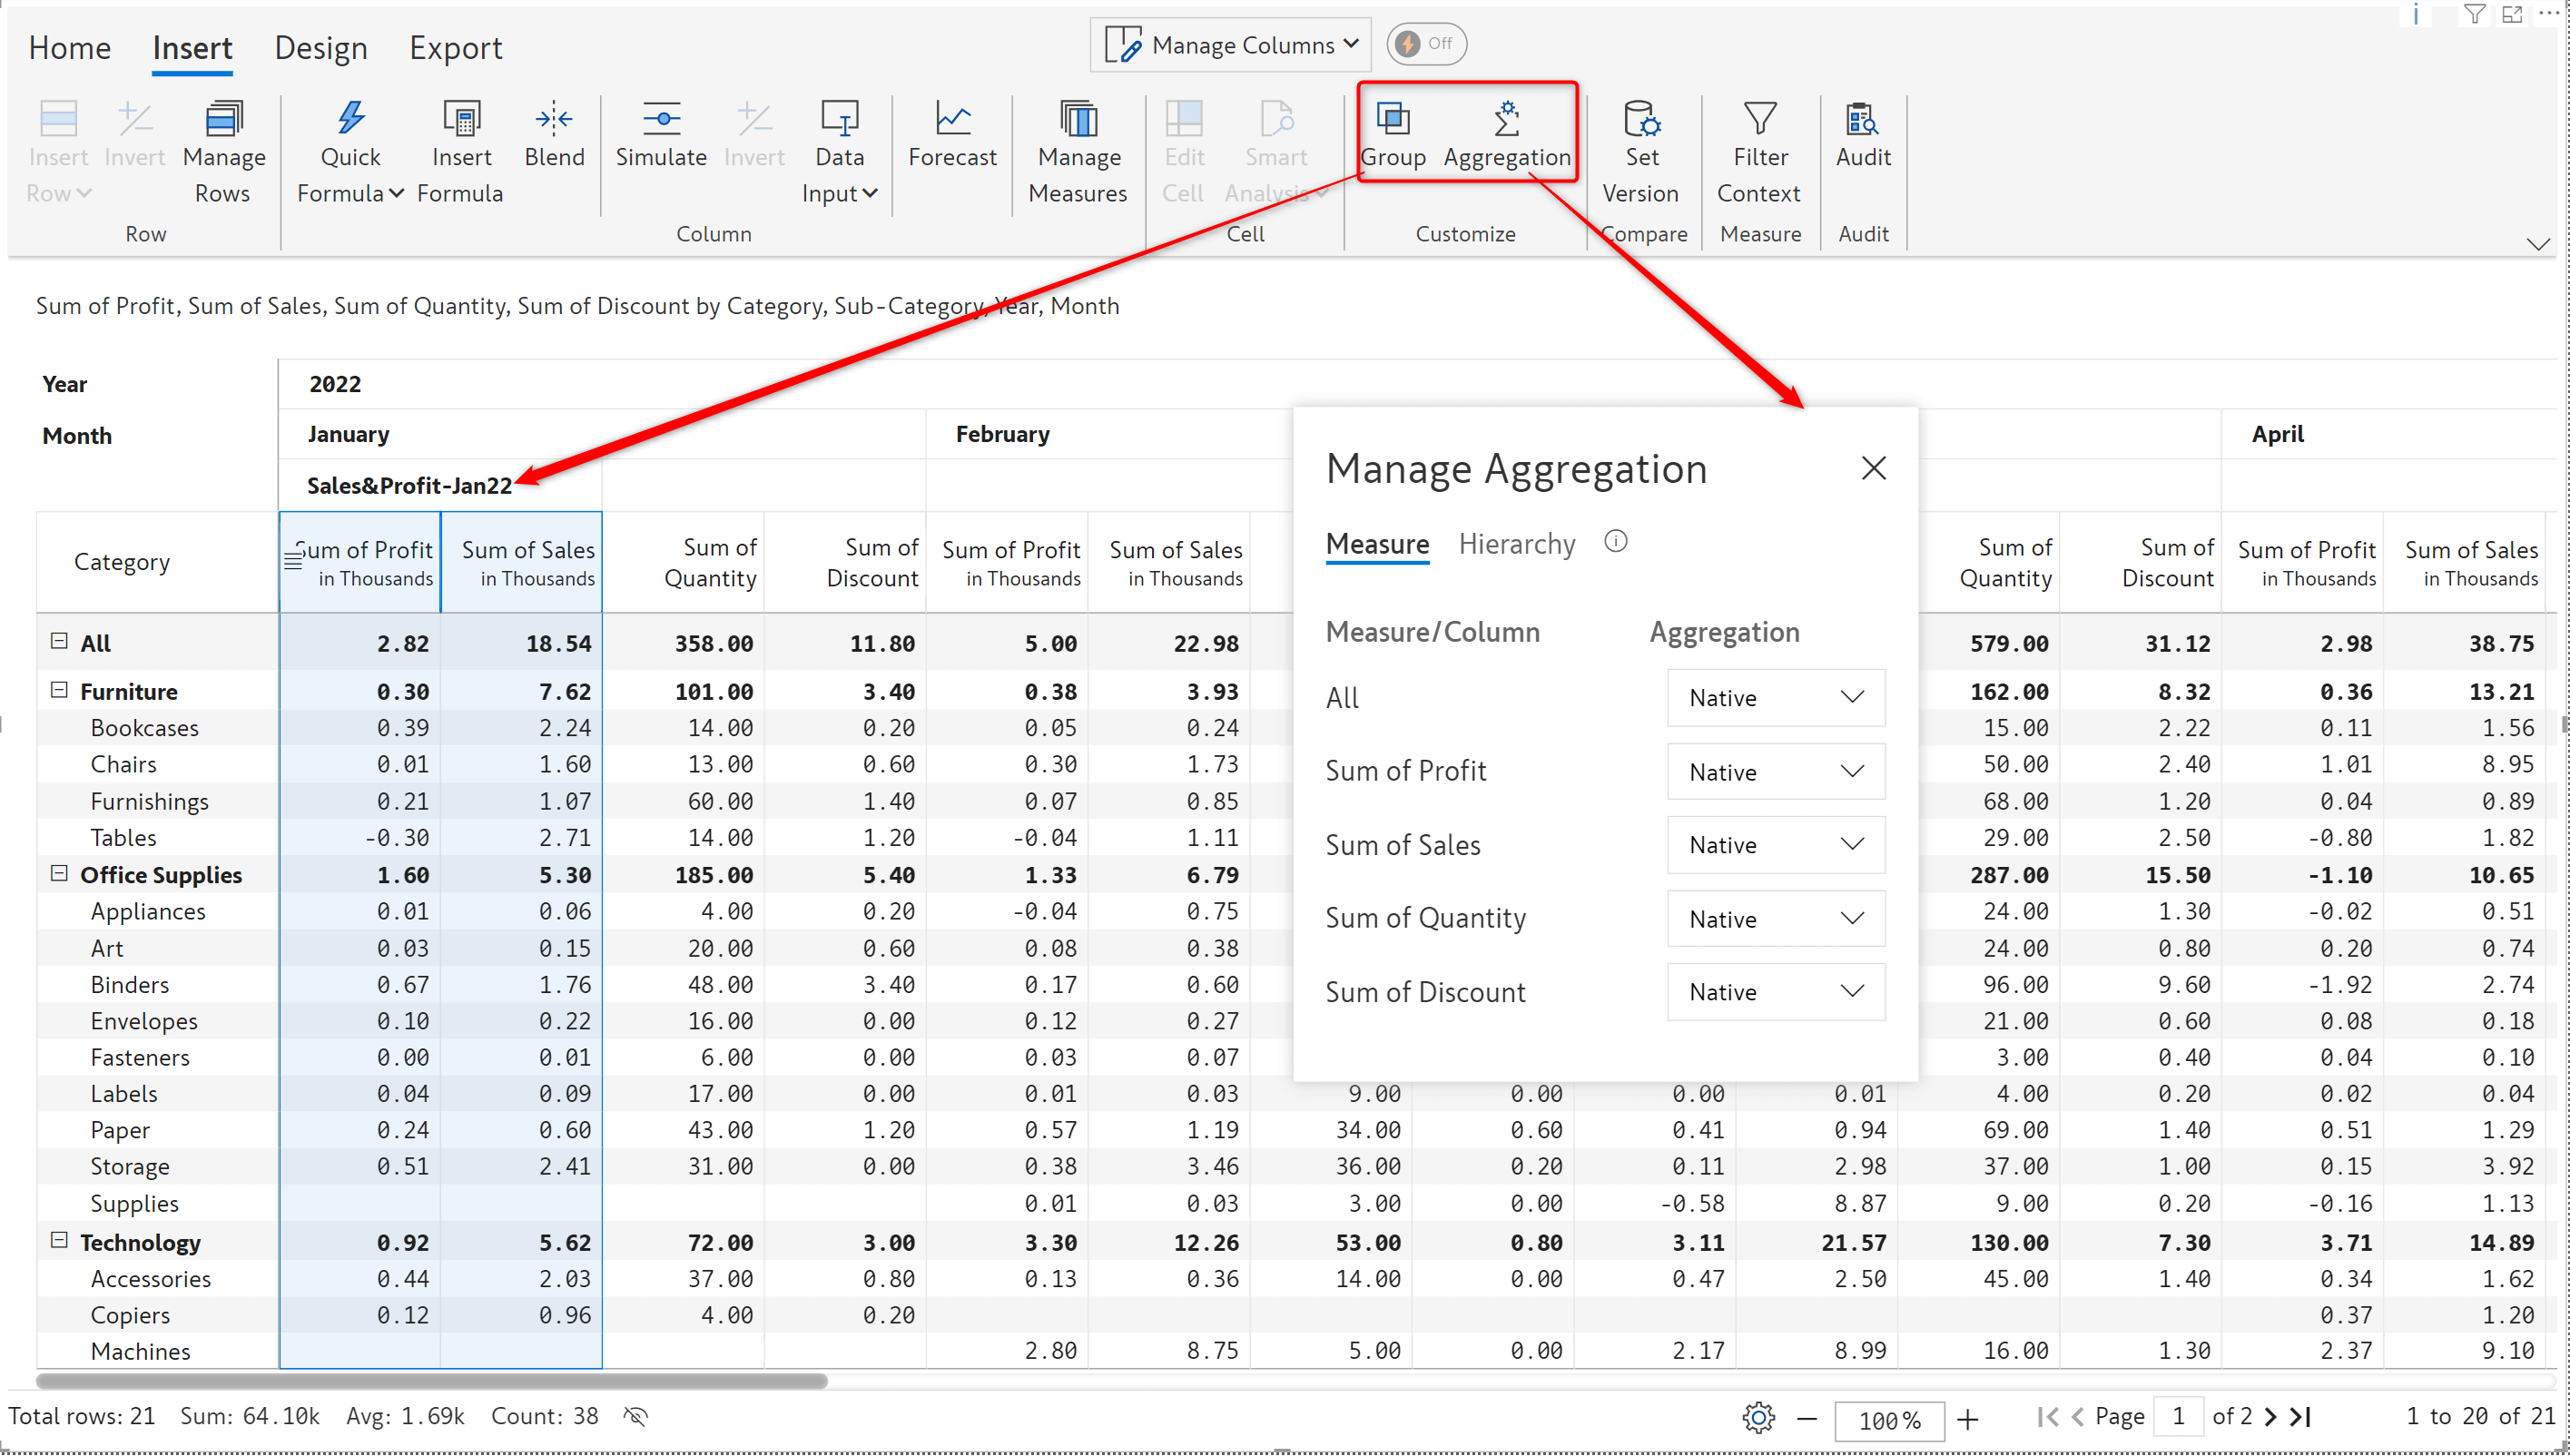
Click on the Group option to create visual-level hierarchies in your data by creating custom groups. Inforiver allows to set aggregation at the report, measure, and category levels. You can manage the aggregation assignments from the UI.
Learn more about creating custom groups and managing aggregation.
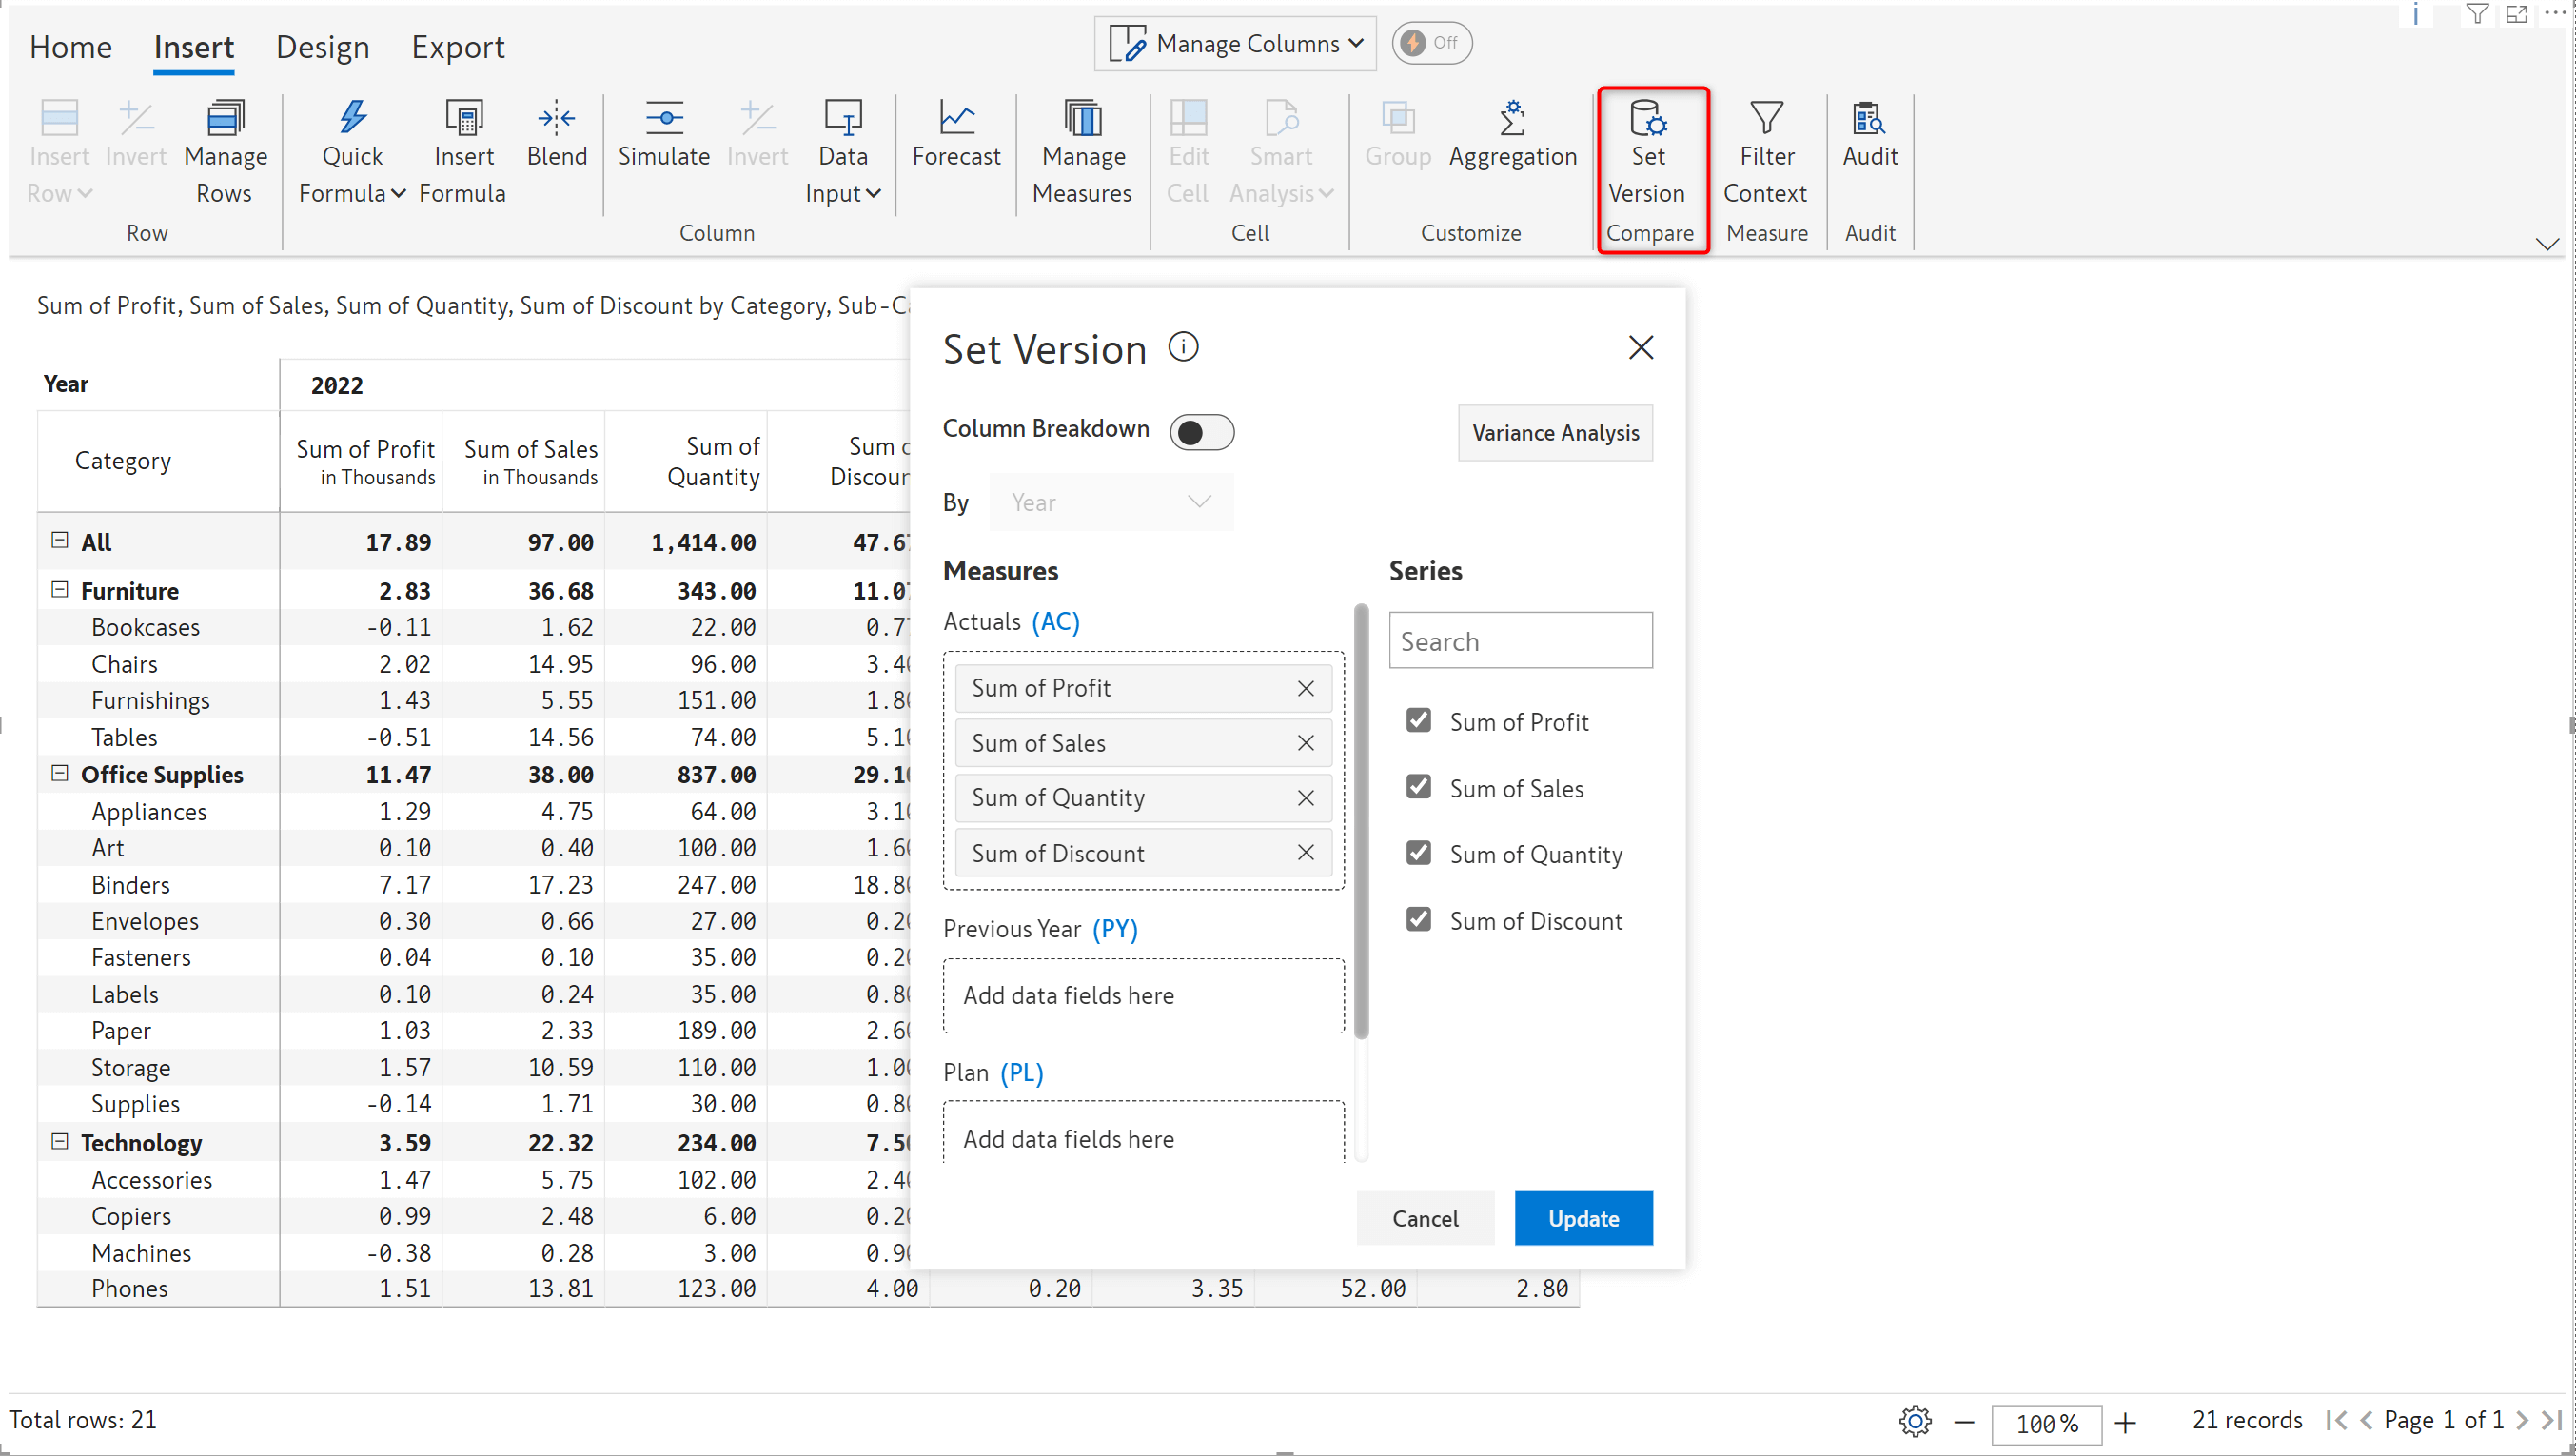
In Inforiver, you can compare two or more measures in the report and calculate absolute and percentage variances automatically using the set version feature.
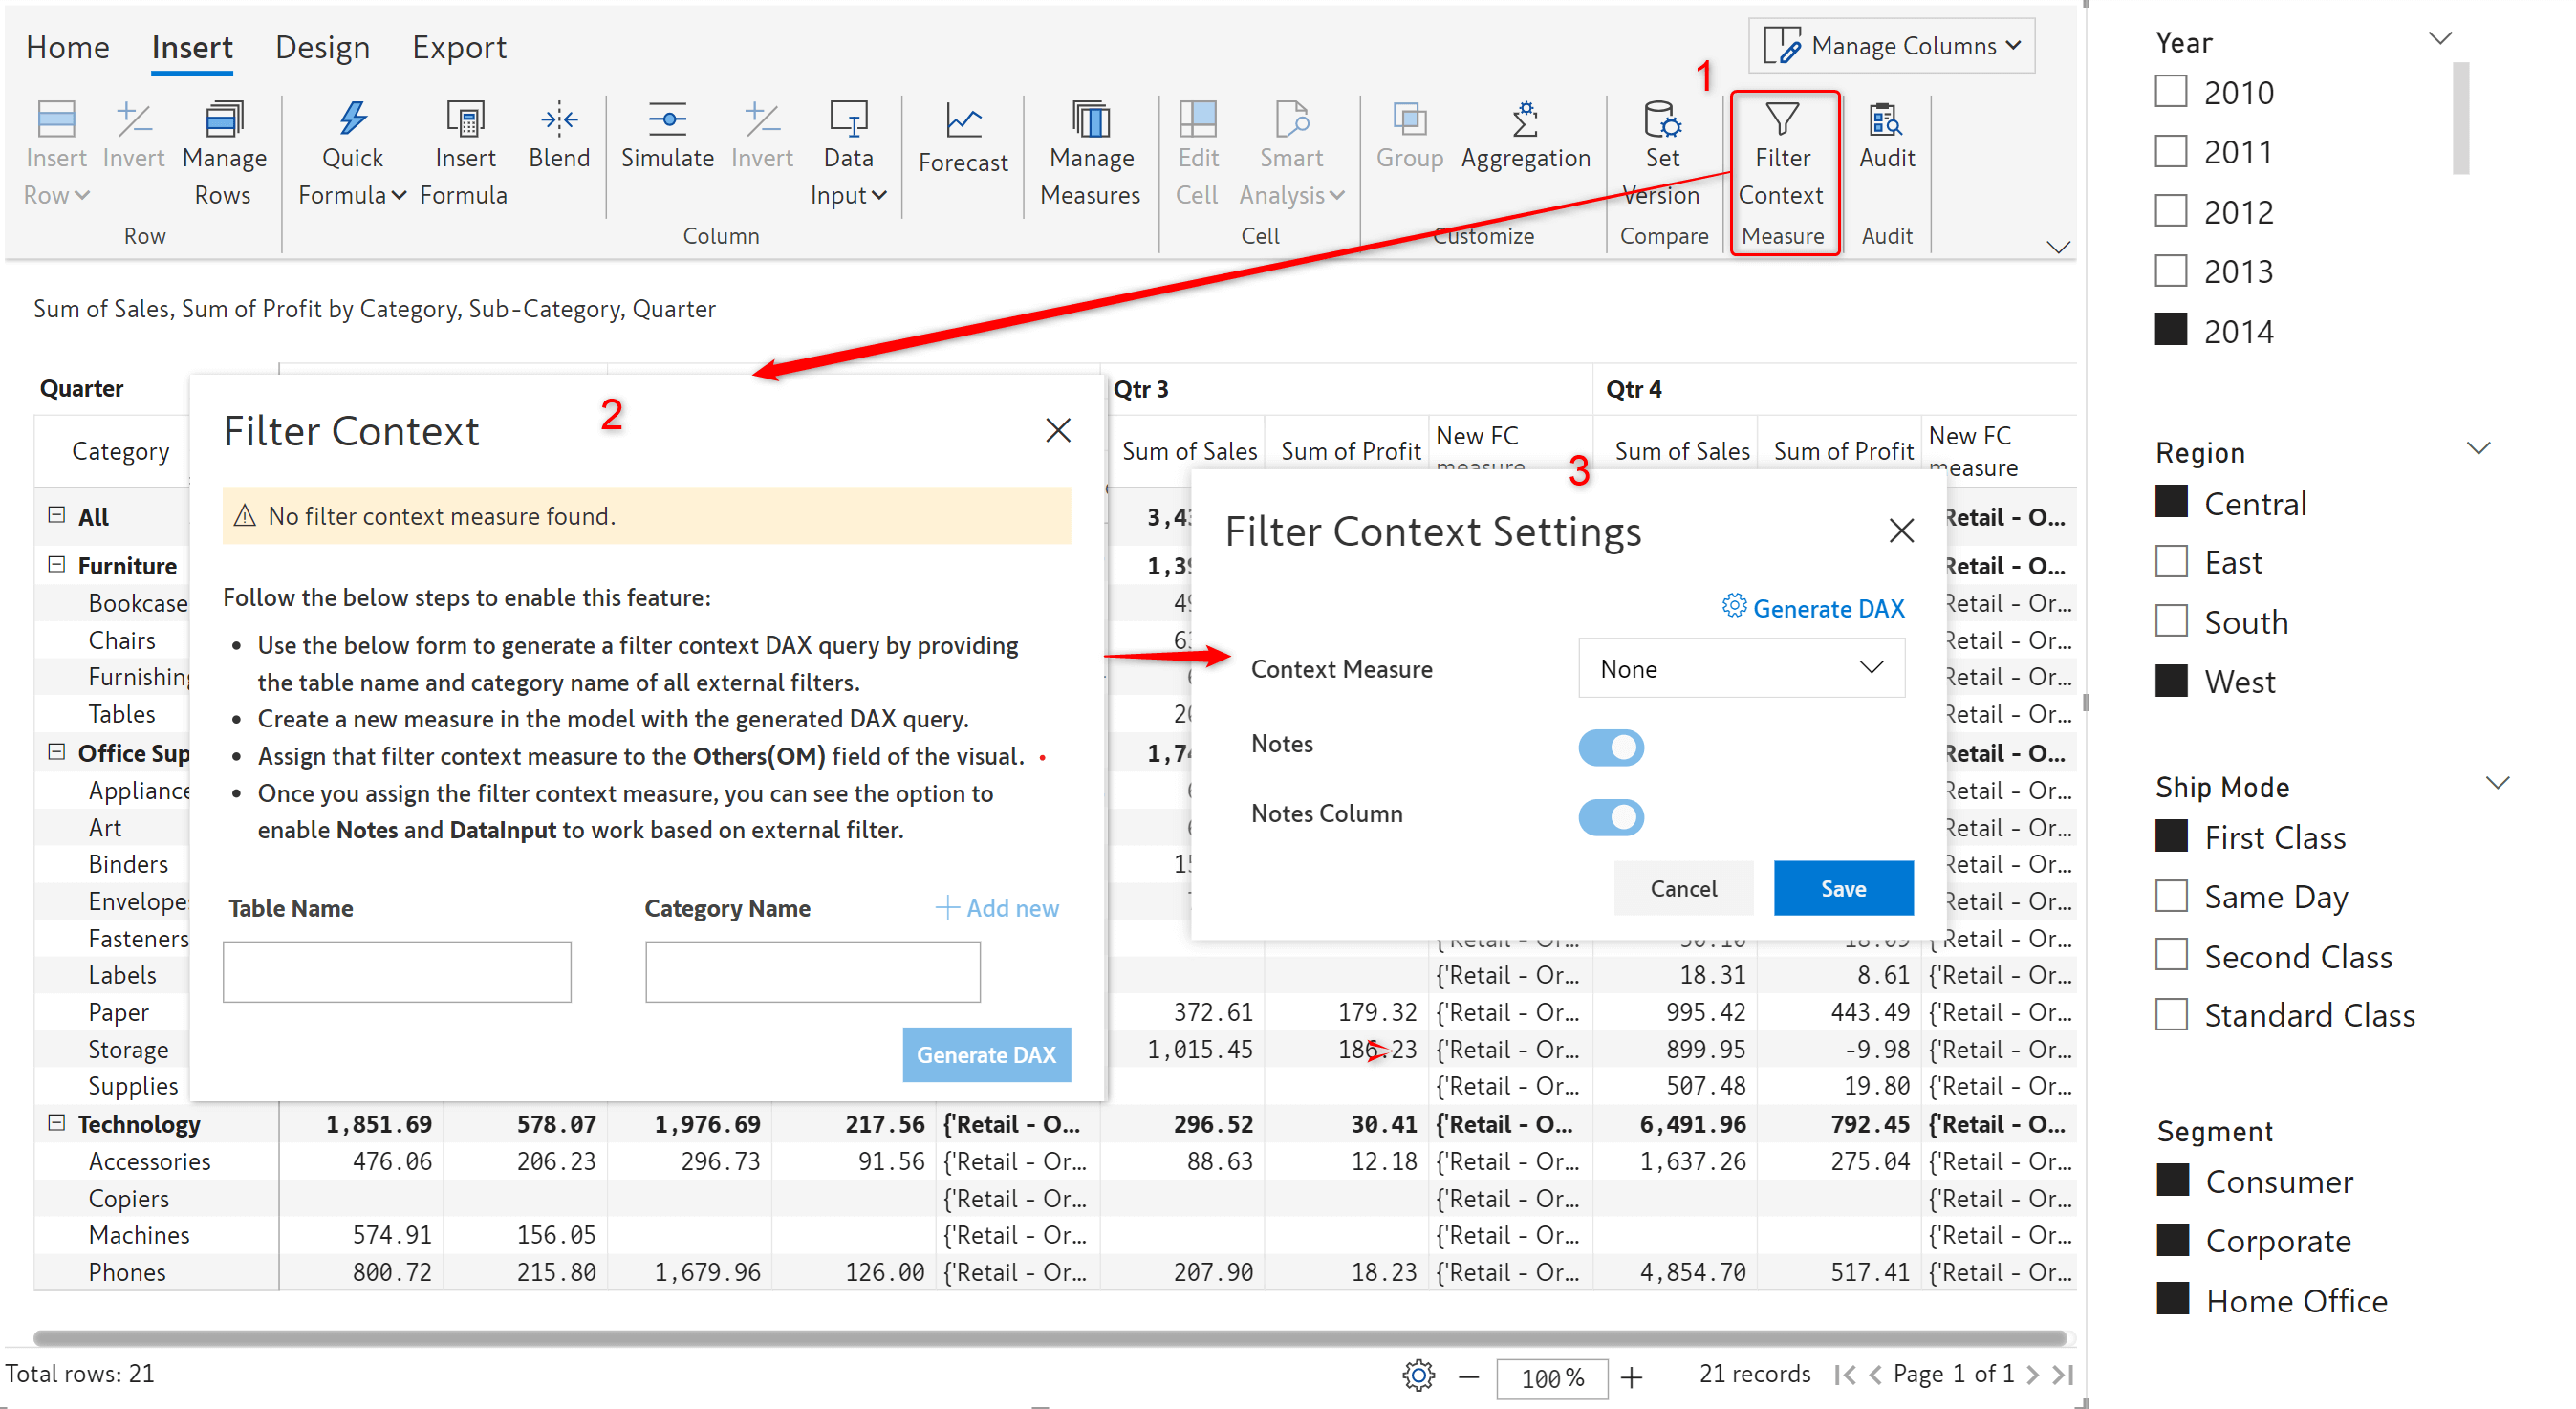
Inforiver provides built-in context awareness i.e., any comments, notes, or even headers that you add will be updated dynamically based on external filter or slicer selection.
Learn more about setting up context-awareness in Inforiver.
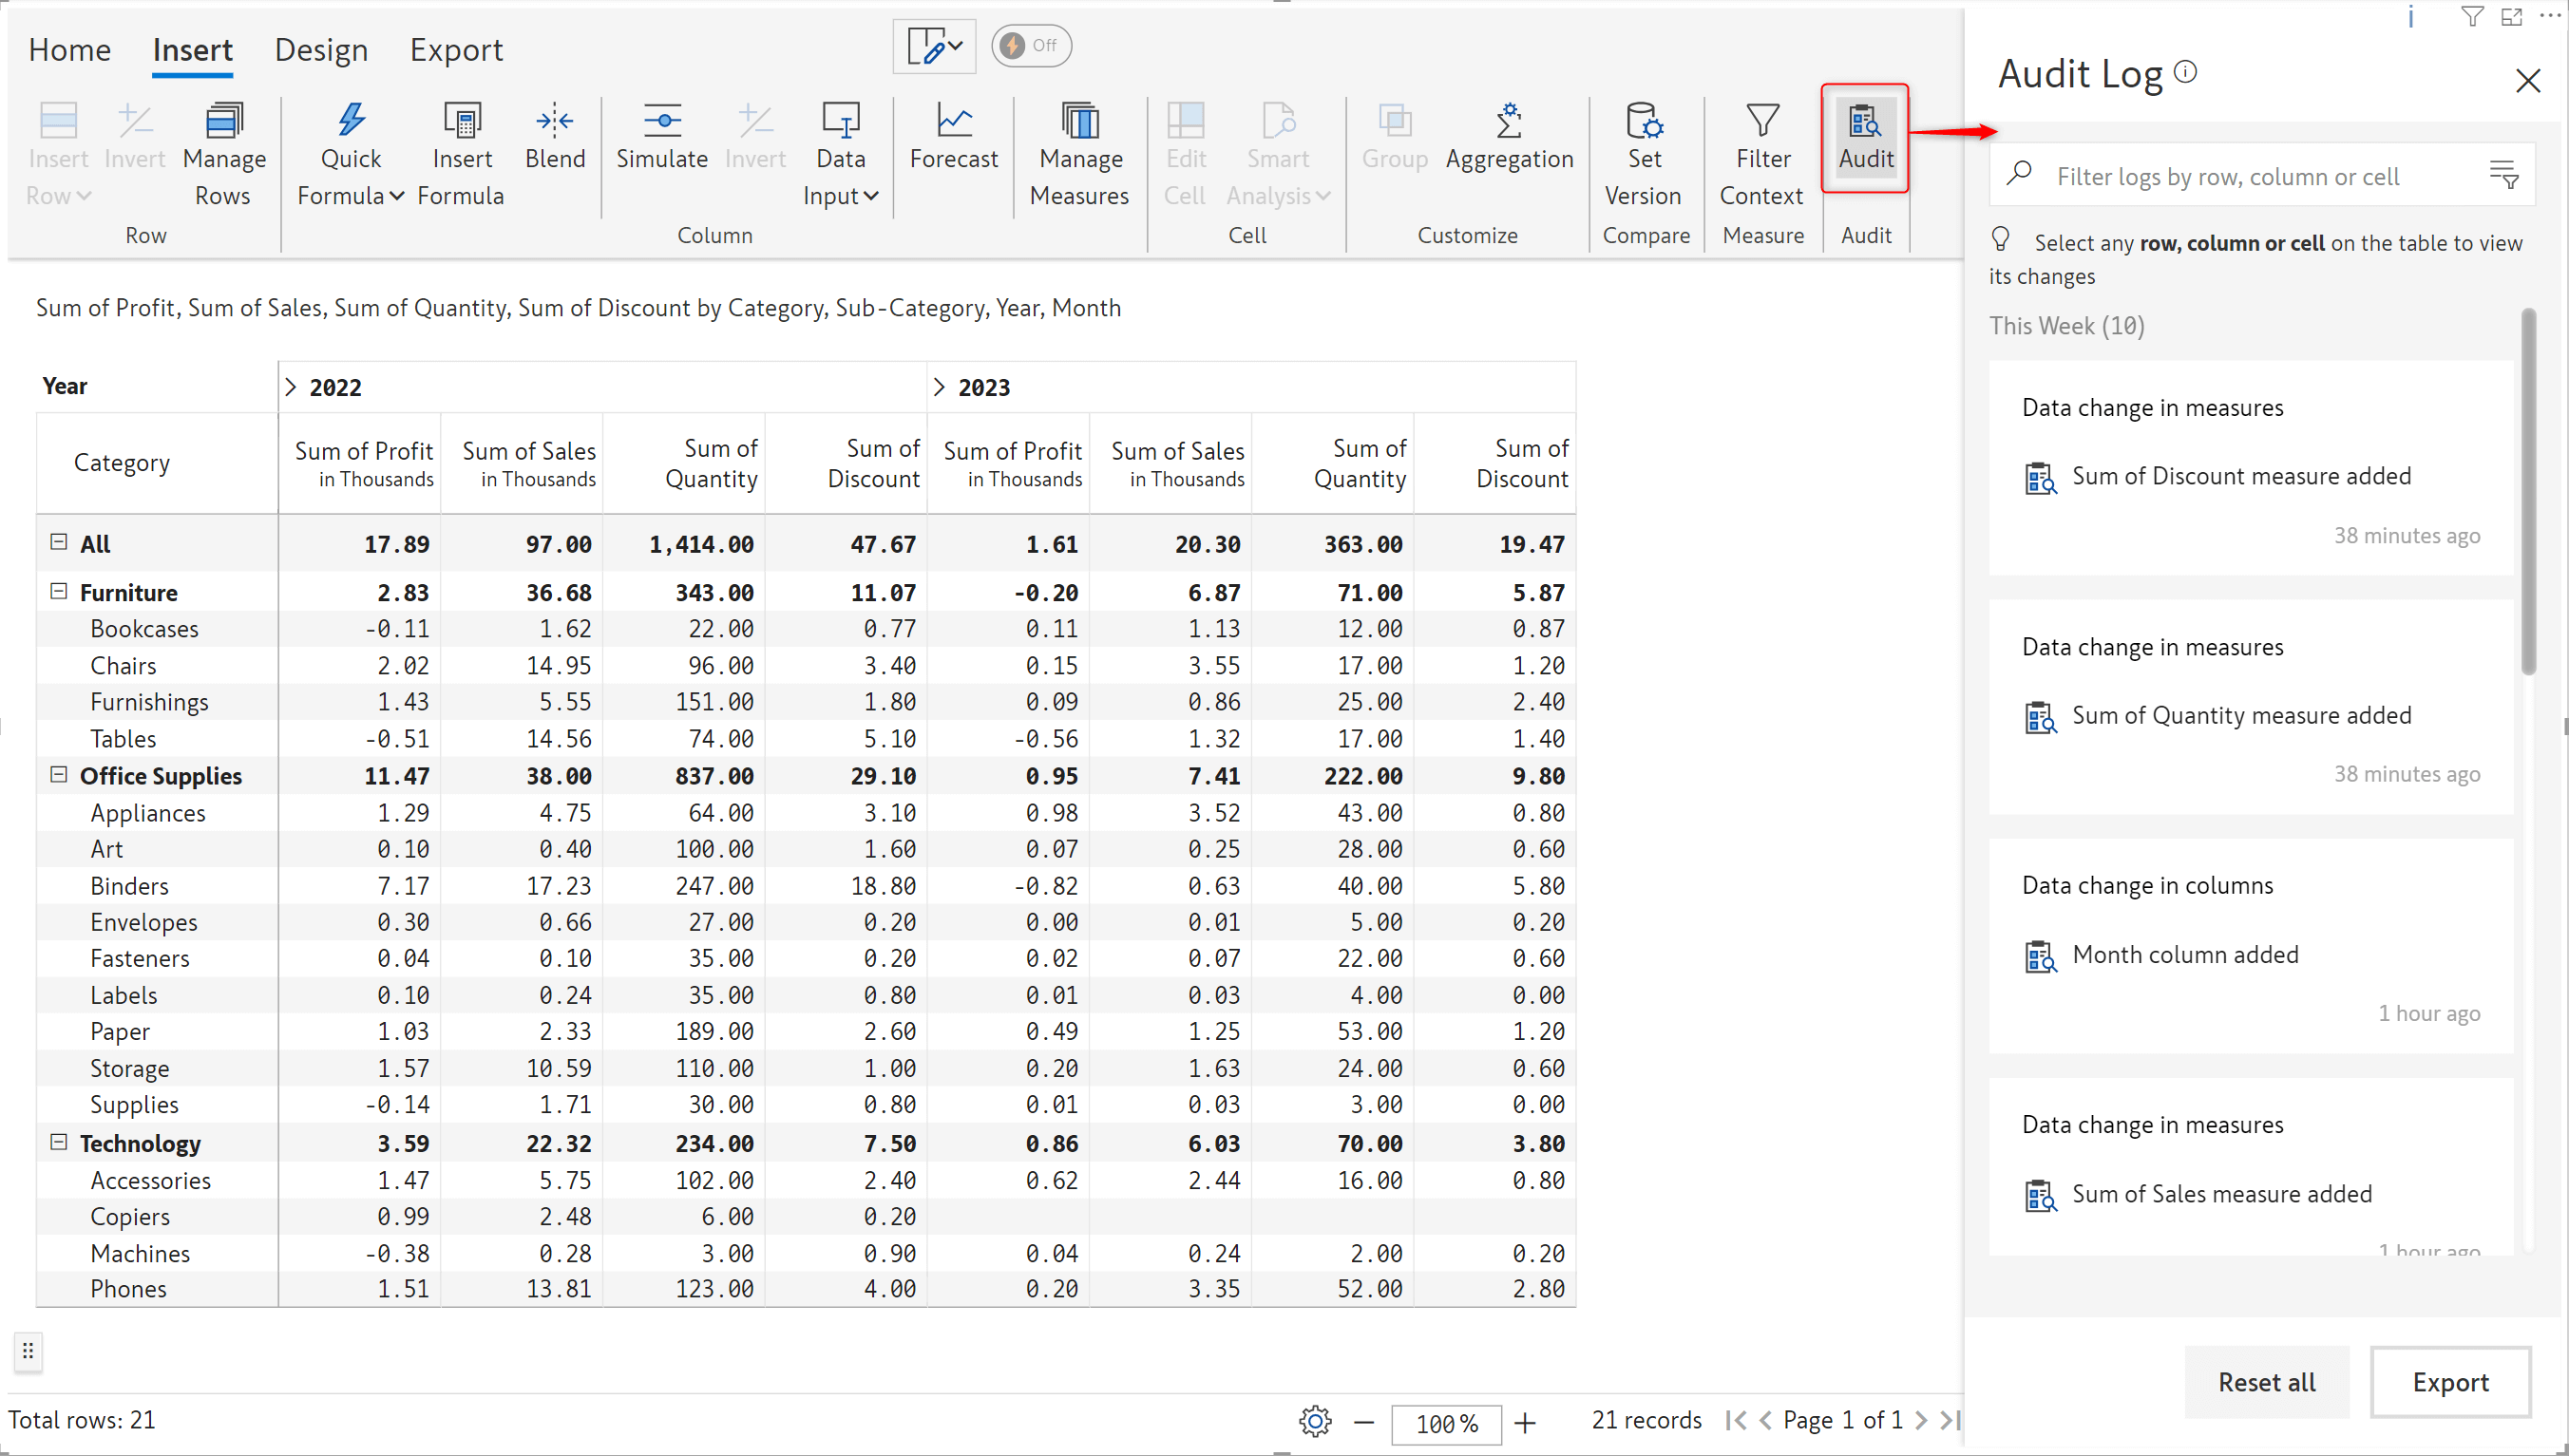
Inforiver provides an interactive, filterable, exportable, and comment-enabled audit log to track changes to your report.
Learn more about tracking change using the audit log feature.
The Design ribbon is divided into 6 different sections, let’s take a look.
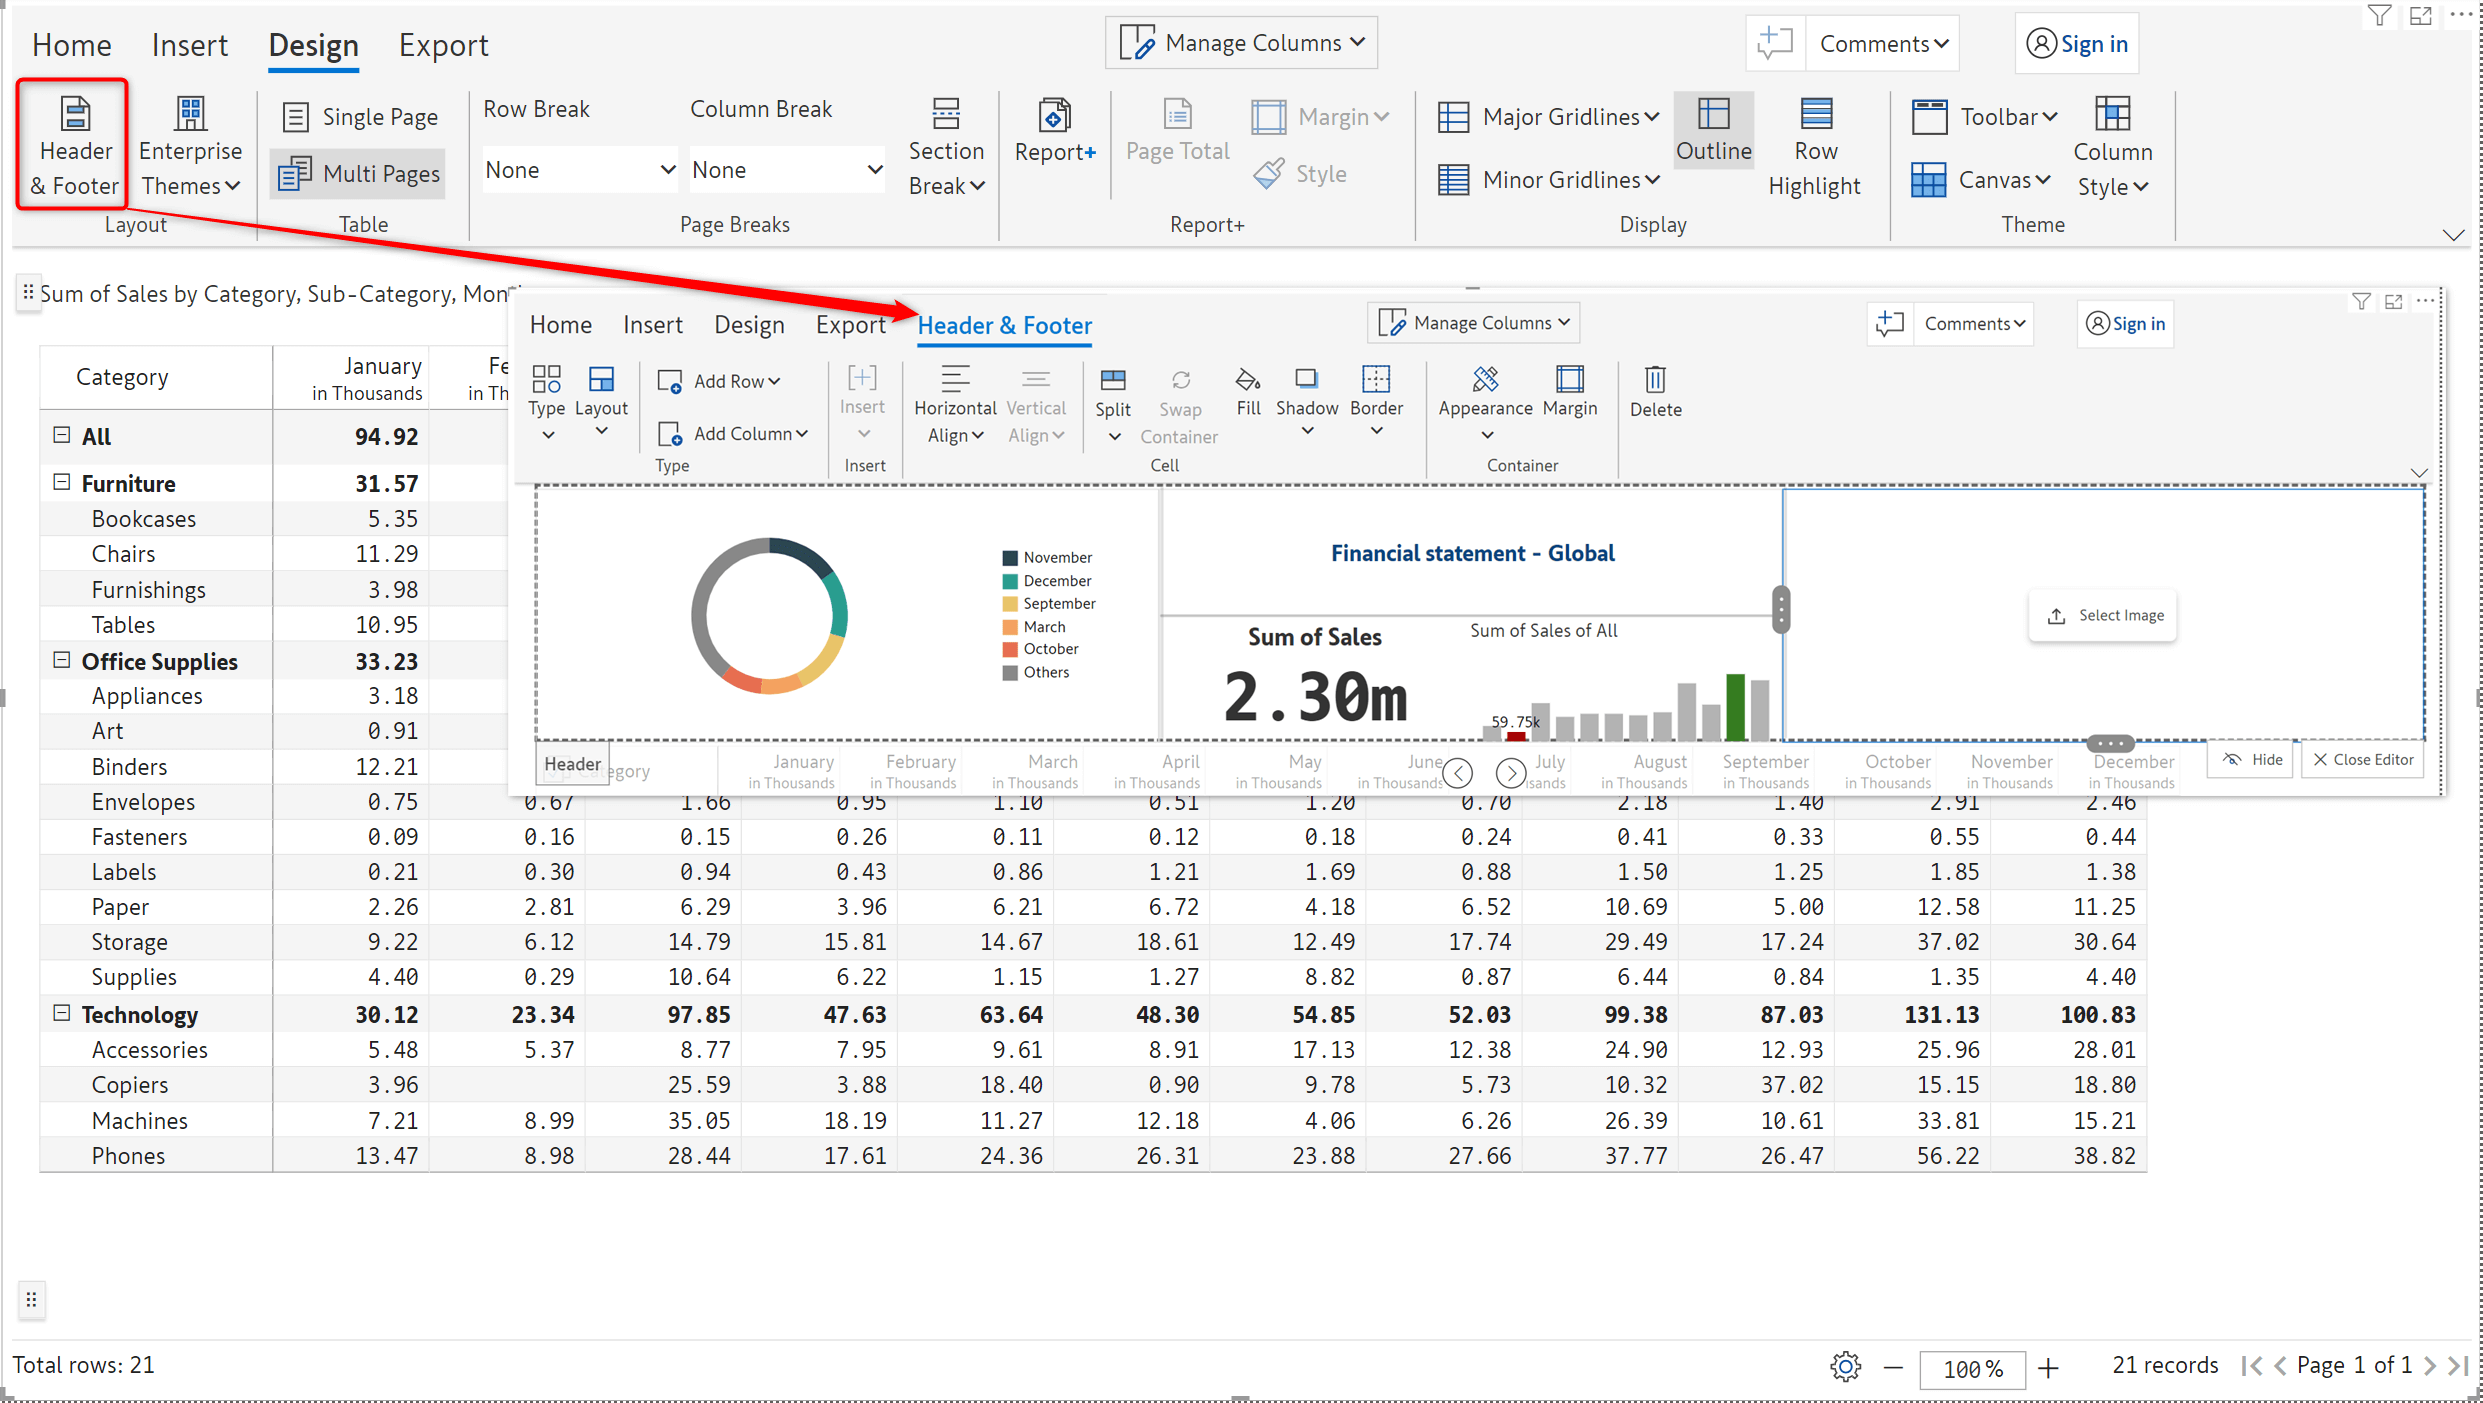
Customize the header and footer using this option. Clicking on the Header & Footer button will display the customization ribbon for headers and footers. This feature is explored later in this blog.
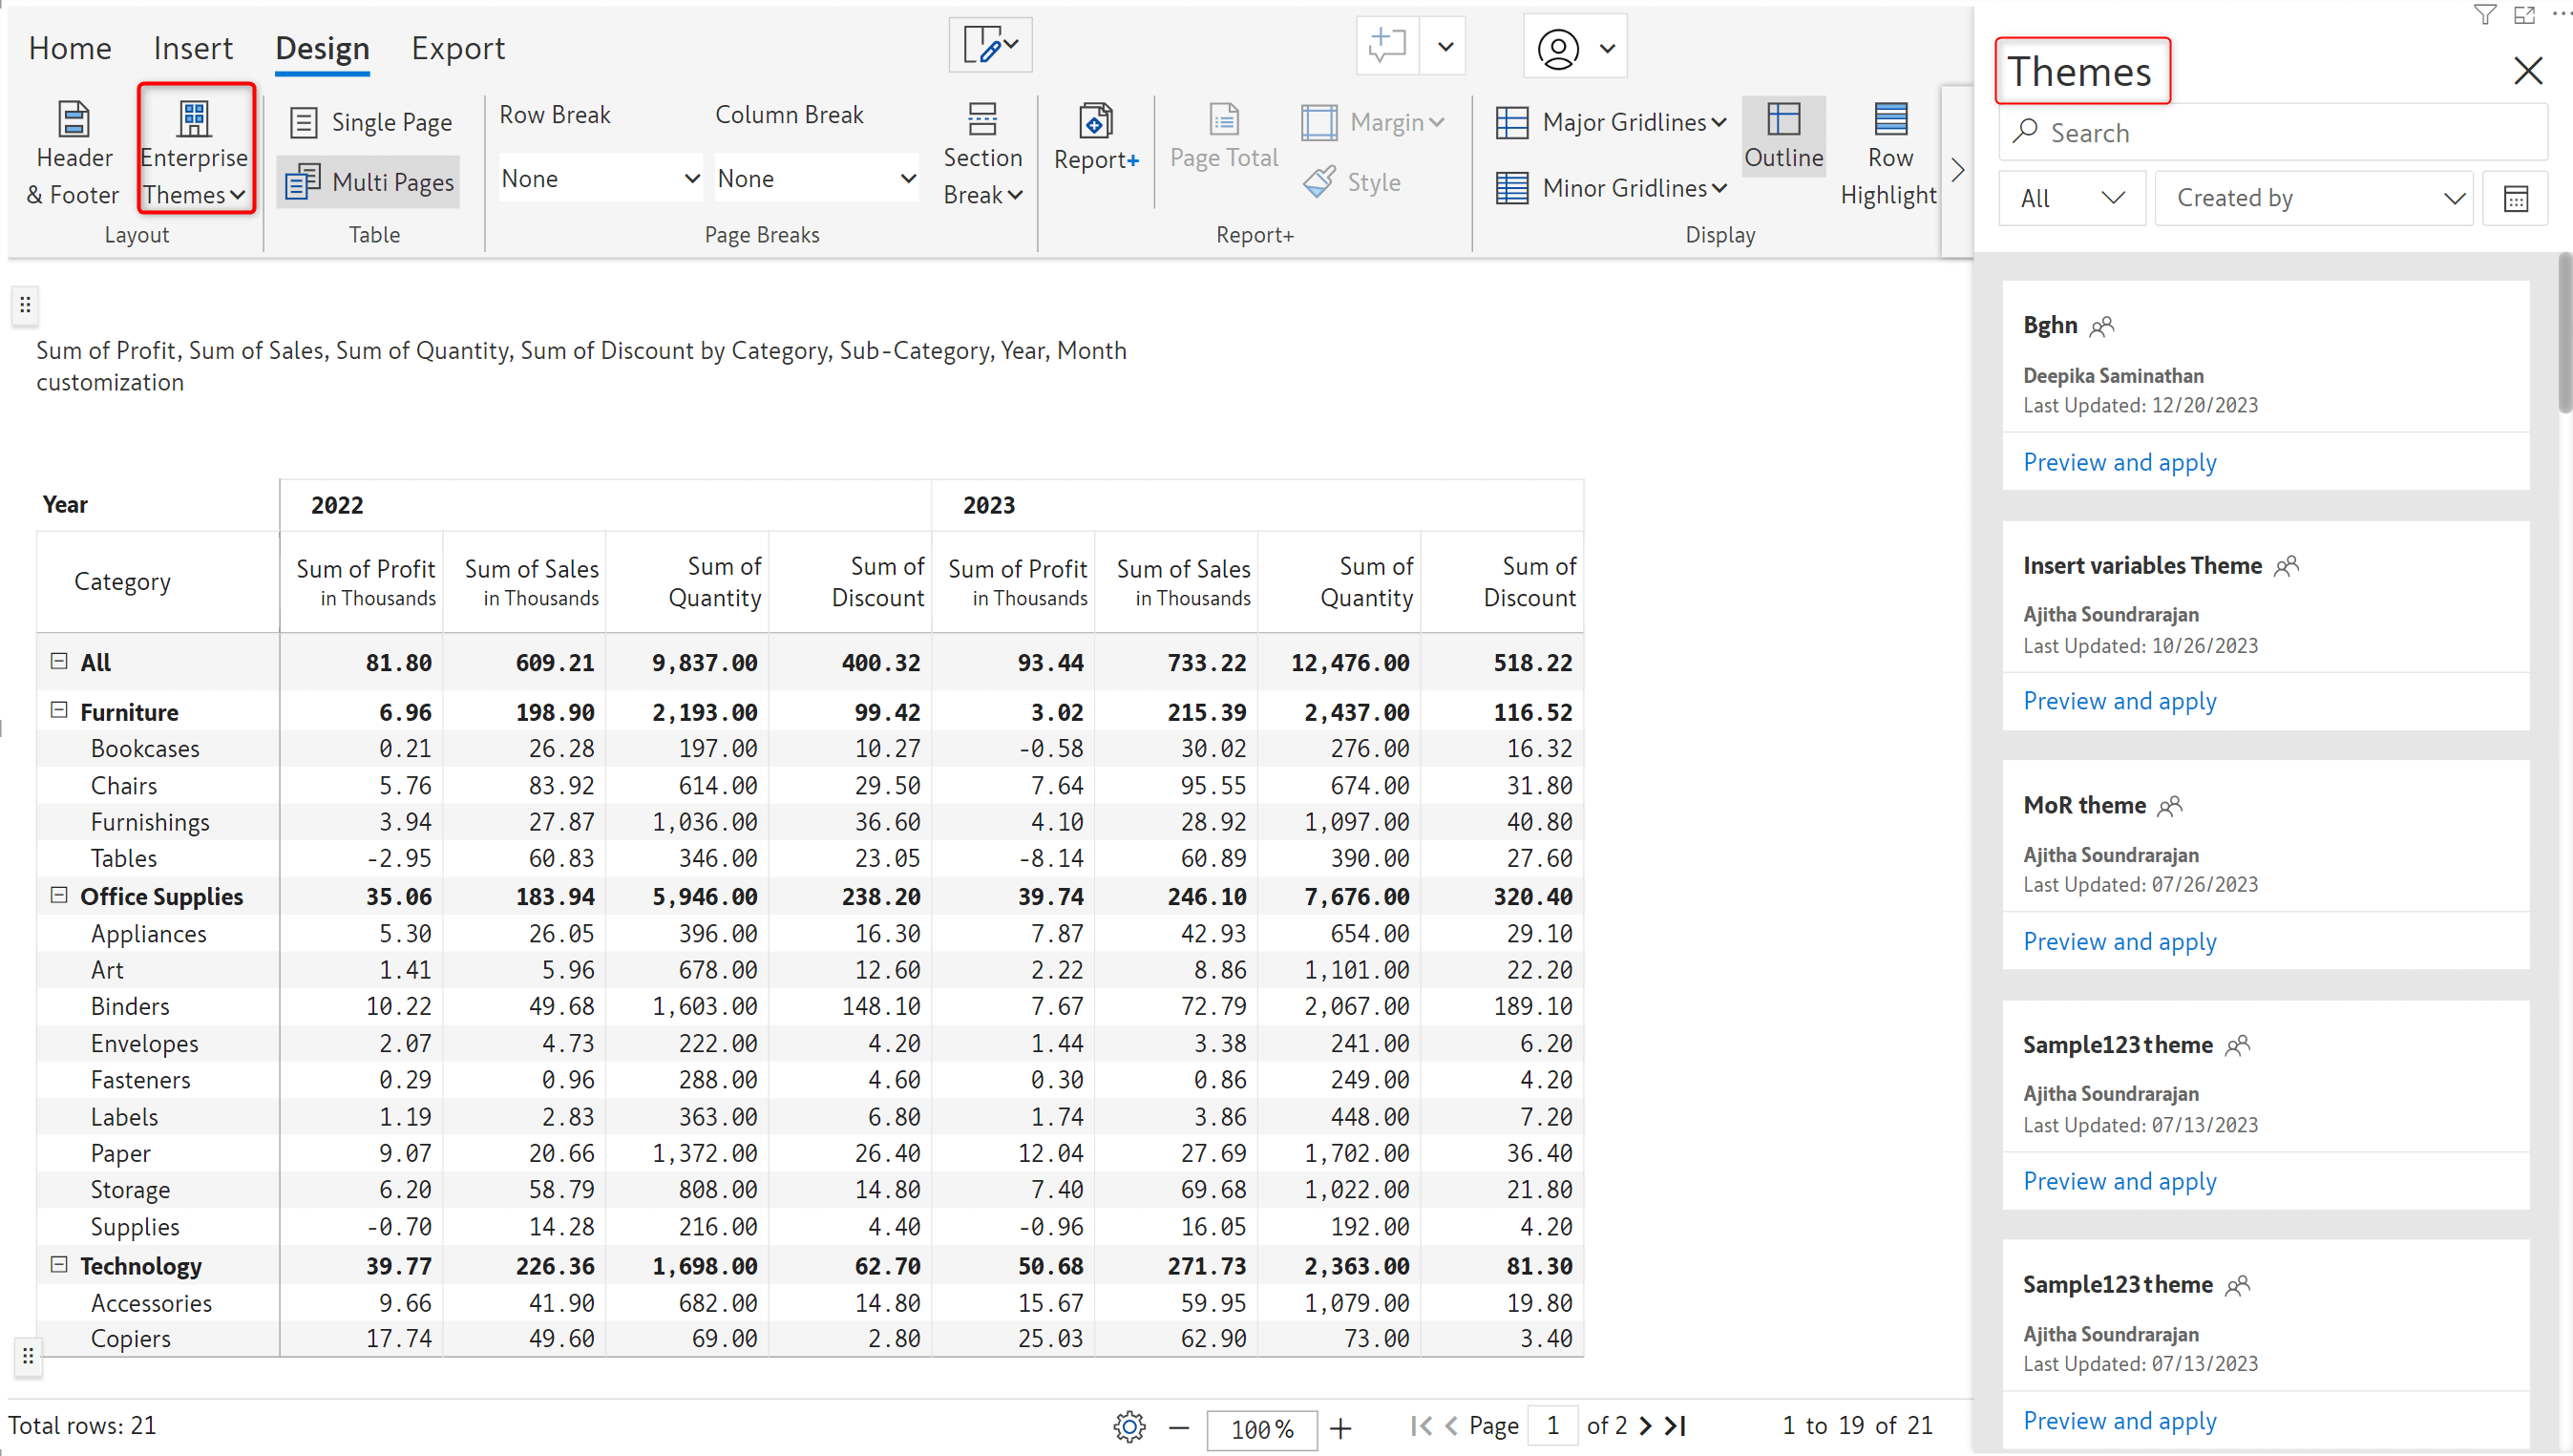
With Inforiver's Enterprise themes feature, you can create and upload custom themes to the repository which can be accessed by others in the organization. Learn more about working with enterprise themes.
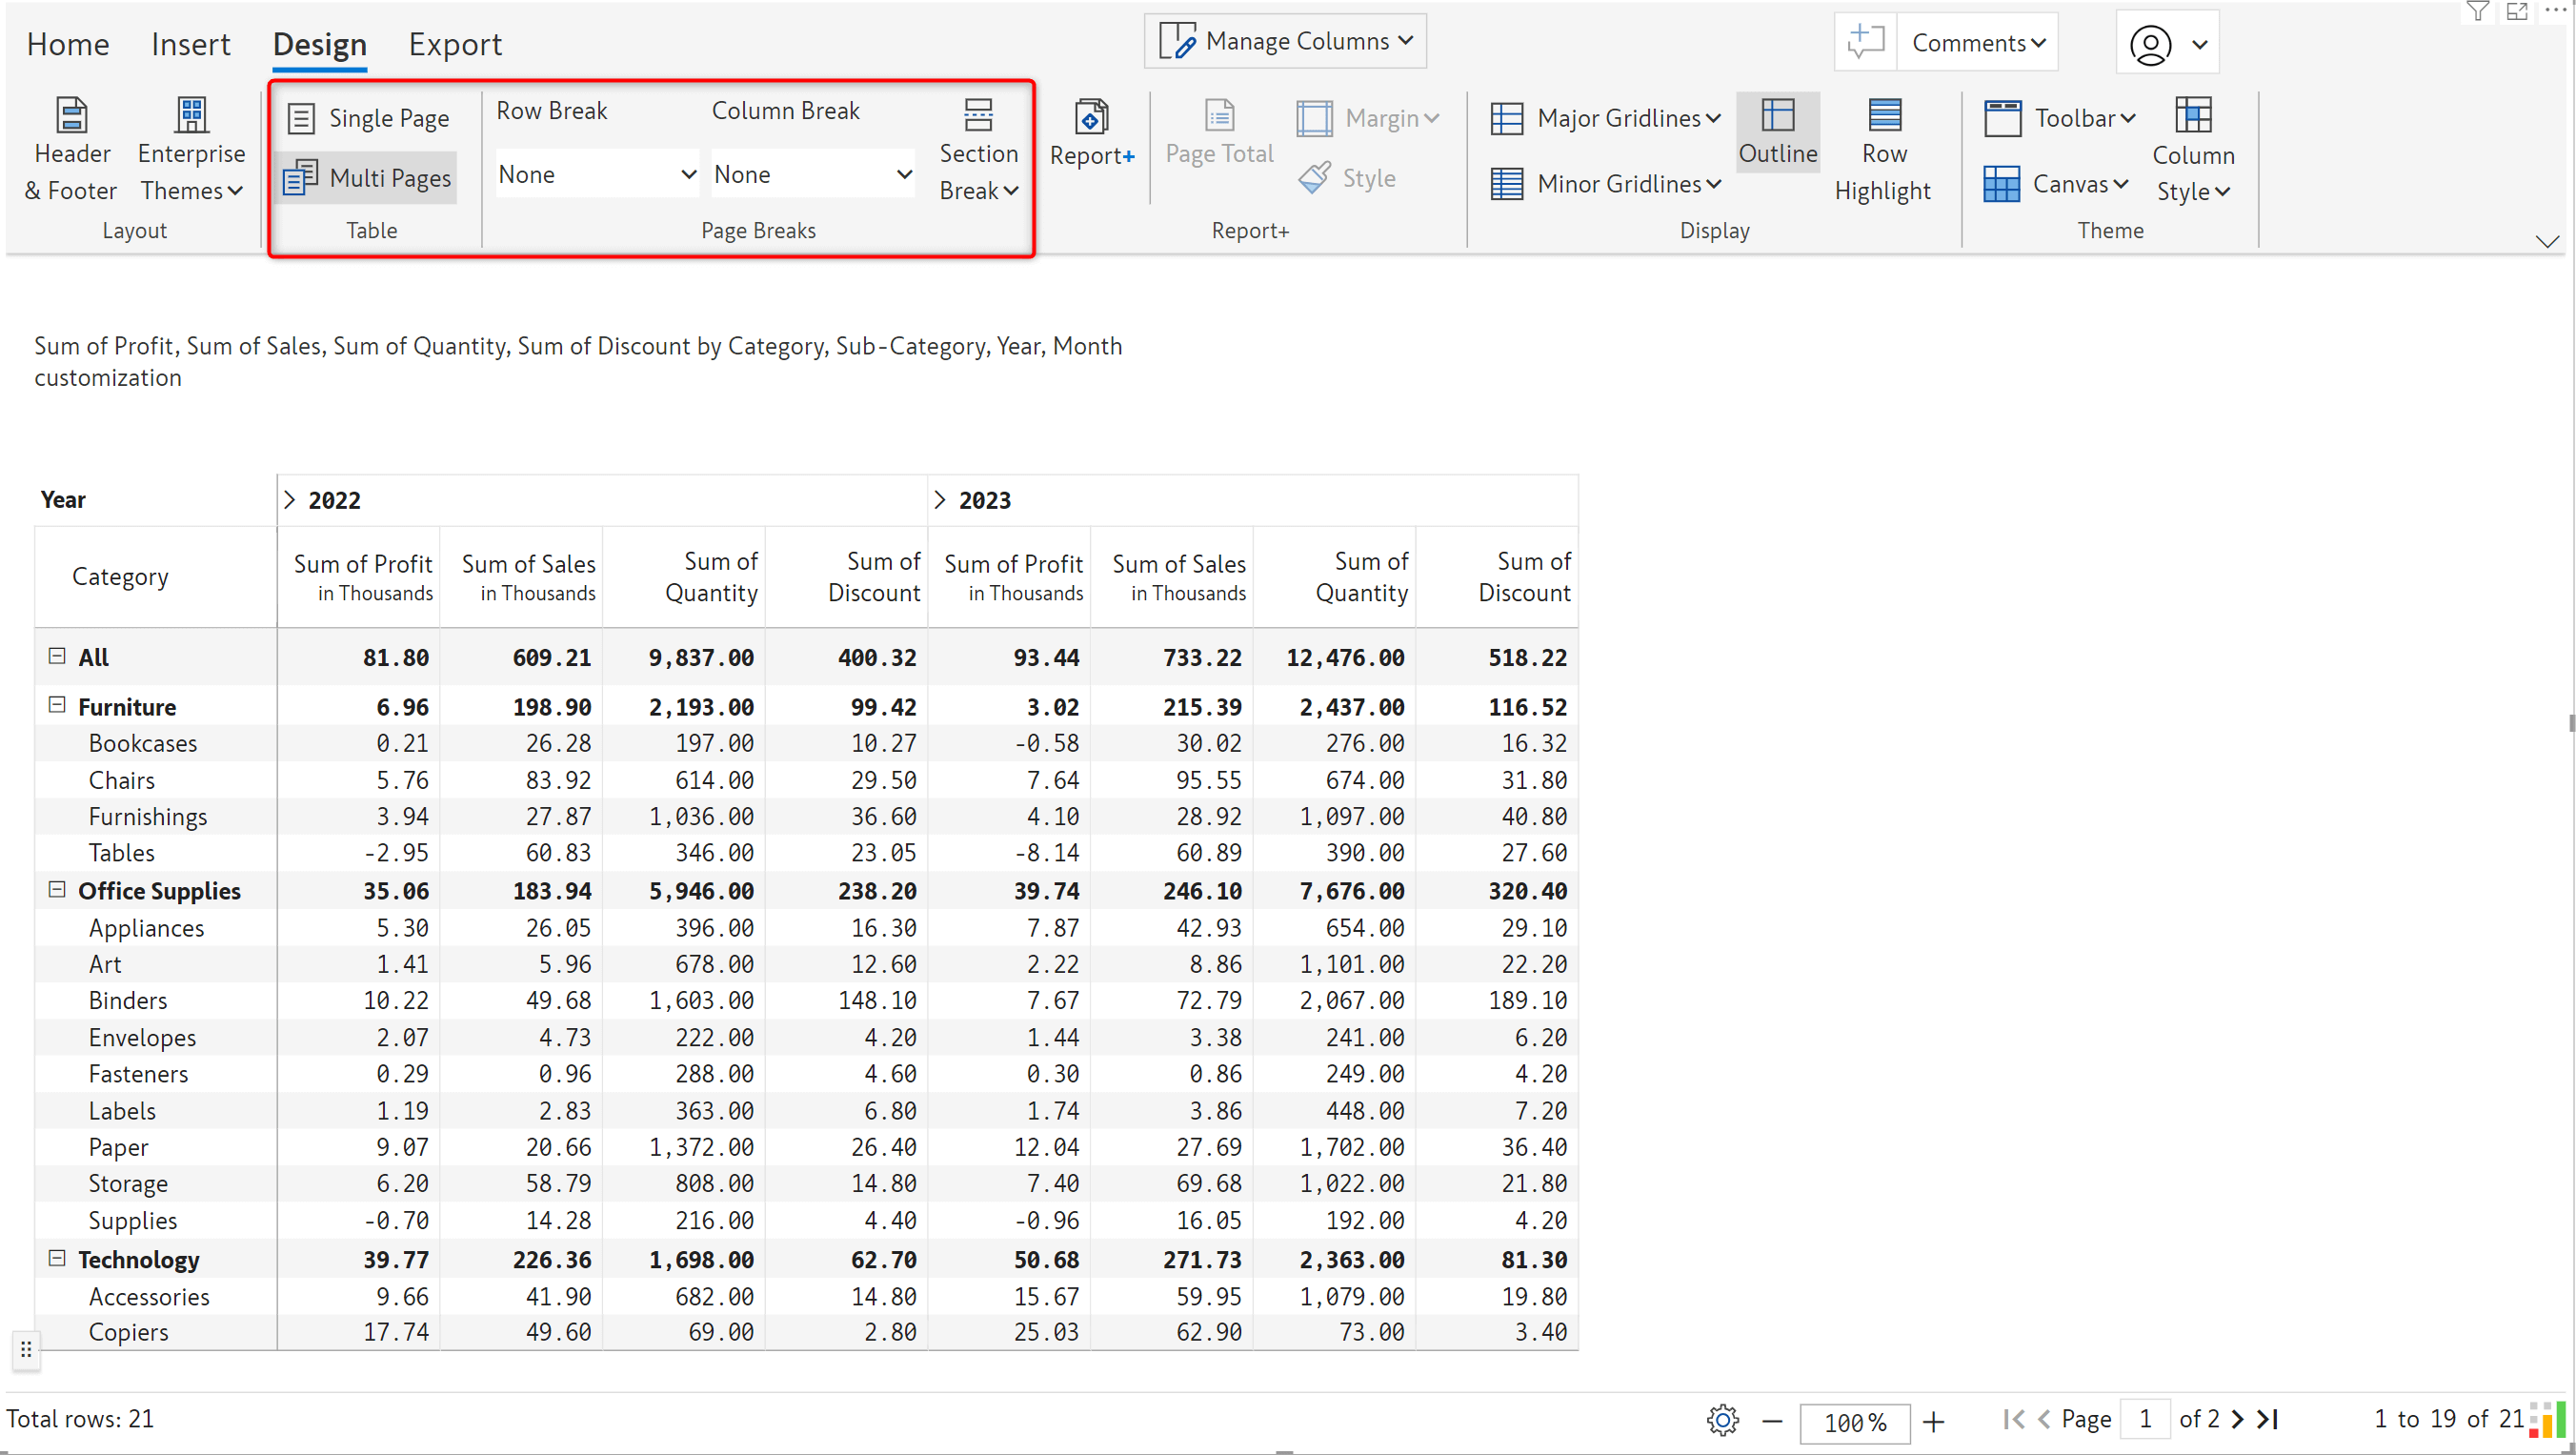
These sections can be used to set pagination options – whether to display the data in a single page with scrolling or multiple pages; set row, column, and section breaks based on category.
Learn more about pagination options in Inforiver.
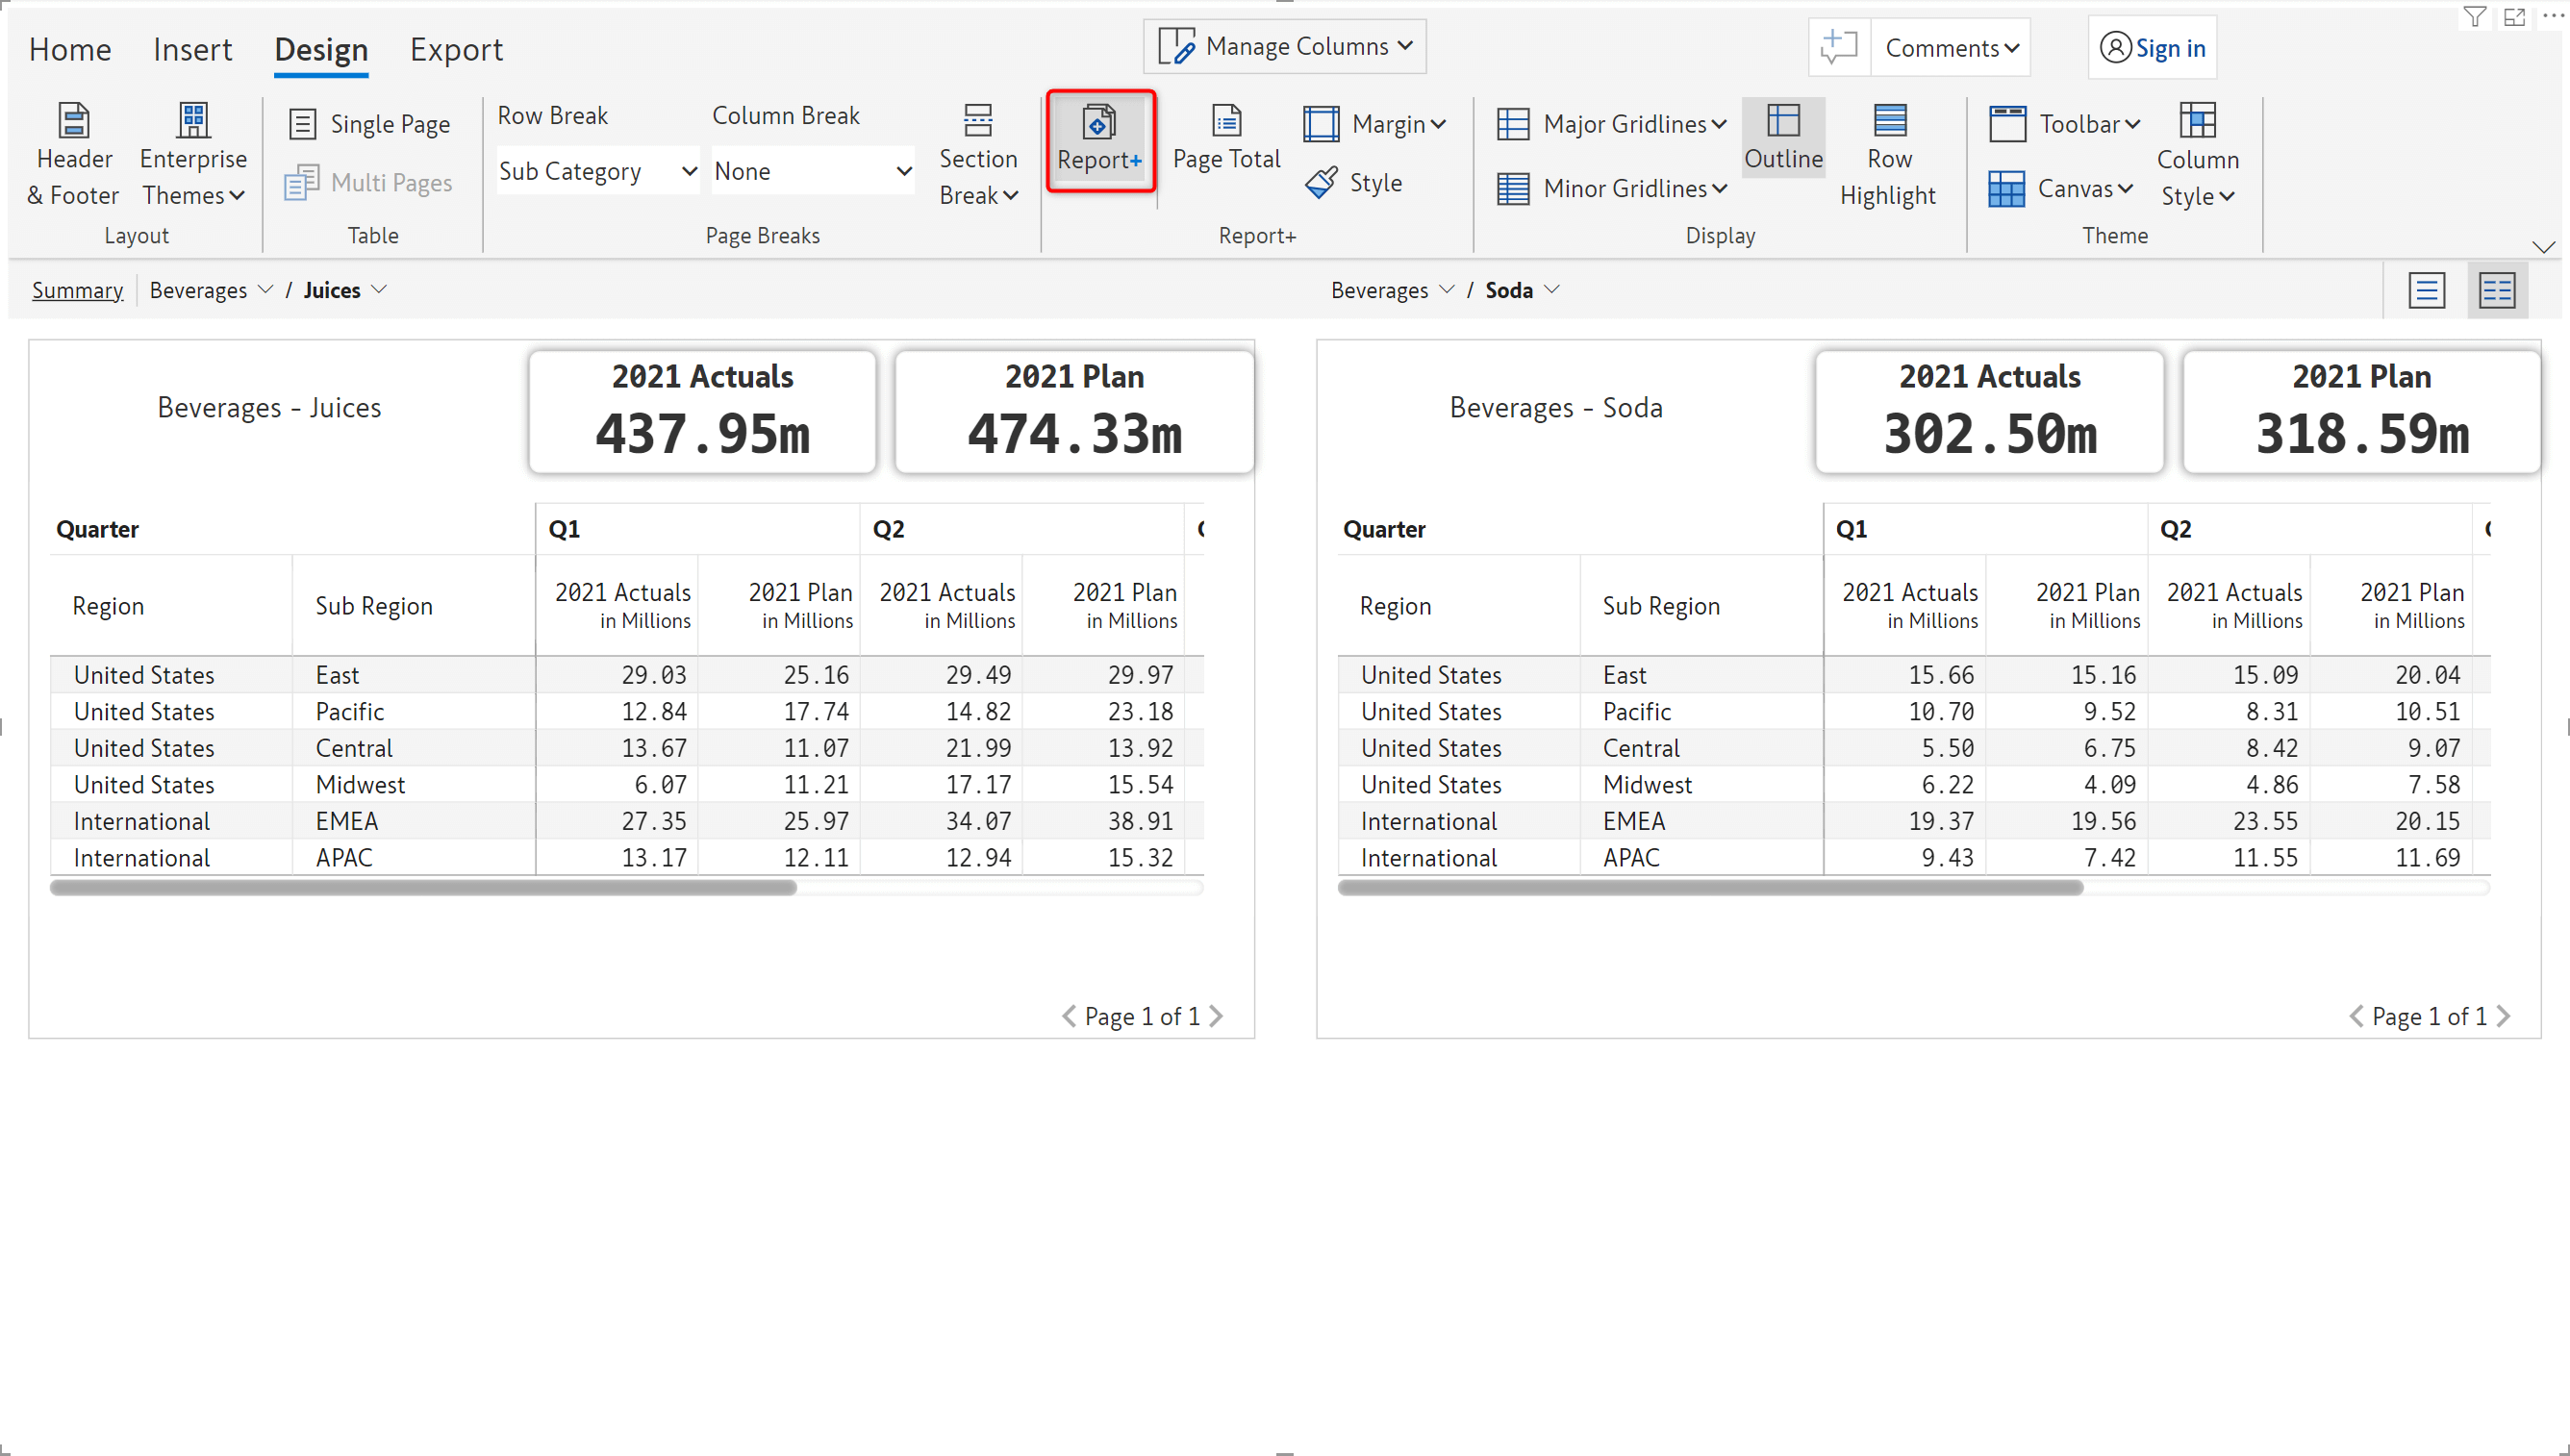
With Report+, you can build no-code paginated reports using preset designs, header/footer formatting capabilities, row/column/section breaks, summary/list/comparison views and more in a matter of minutes.
Learn more about the Report+ capability
You can use the options in the display section to demarcate categories by setting gridlines and customize the highlight settings for rows. In the theme section, you can set a dark or light theme for the toolbar and canvas. You can also set the styles for locked cells/ data input fields and native measures.
Learn more about the display and theme sections.
Display section:
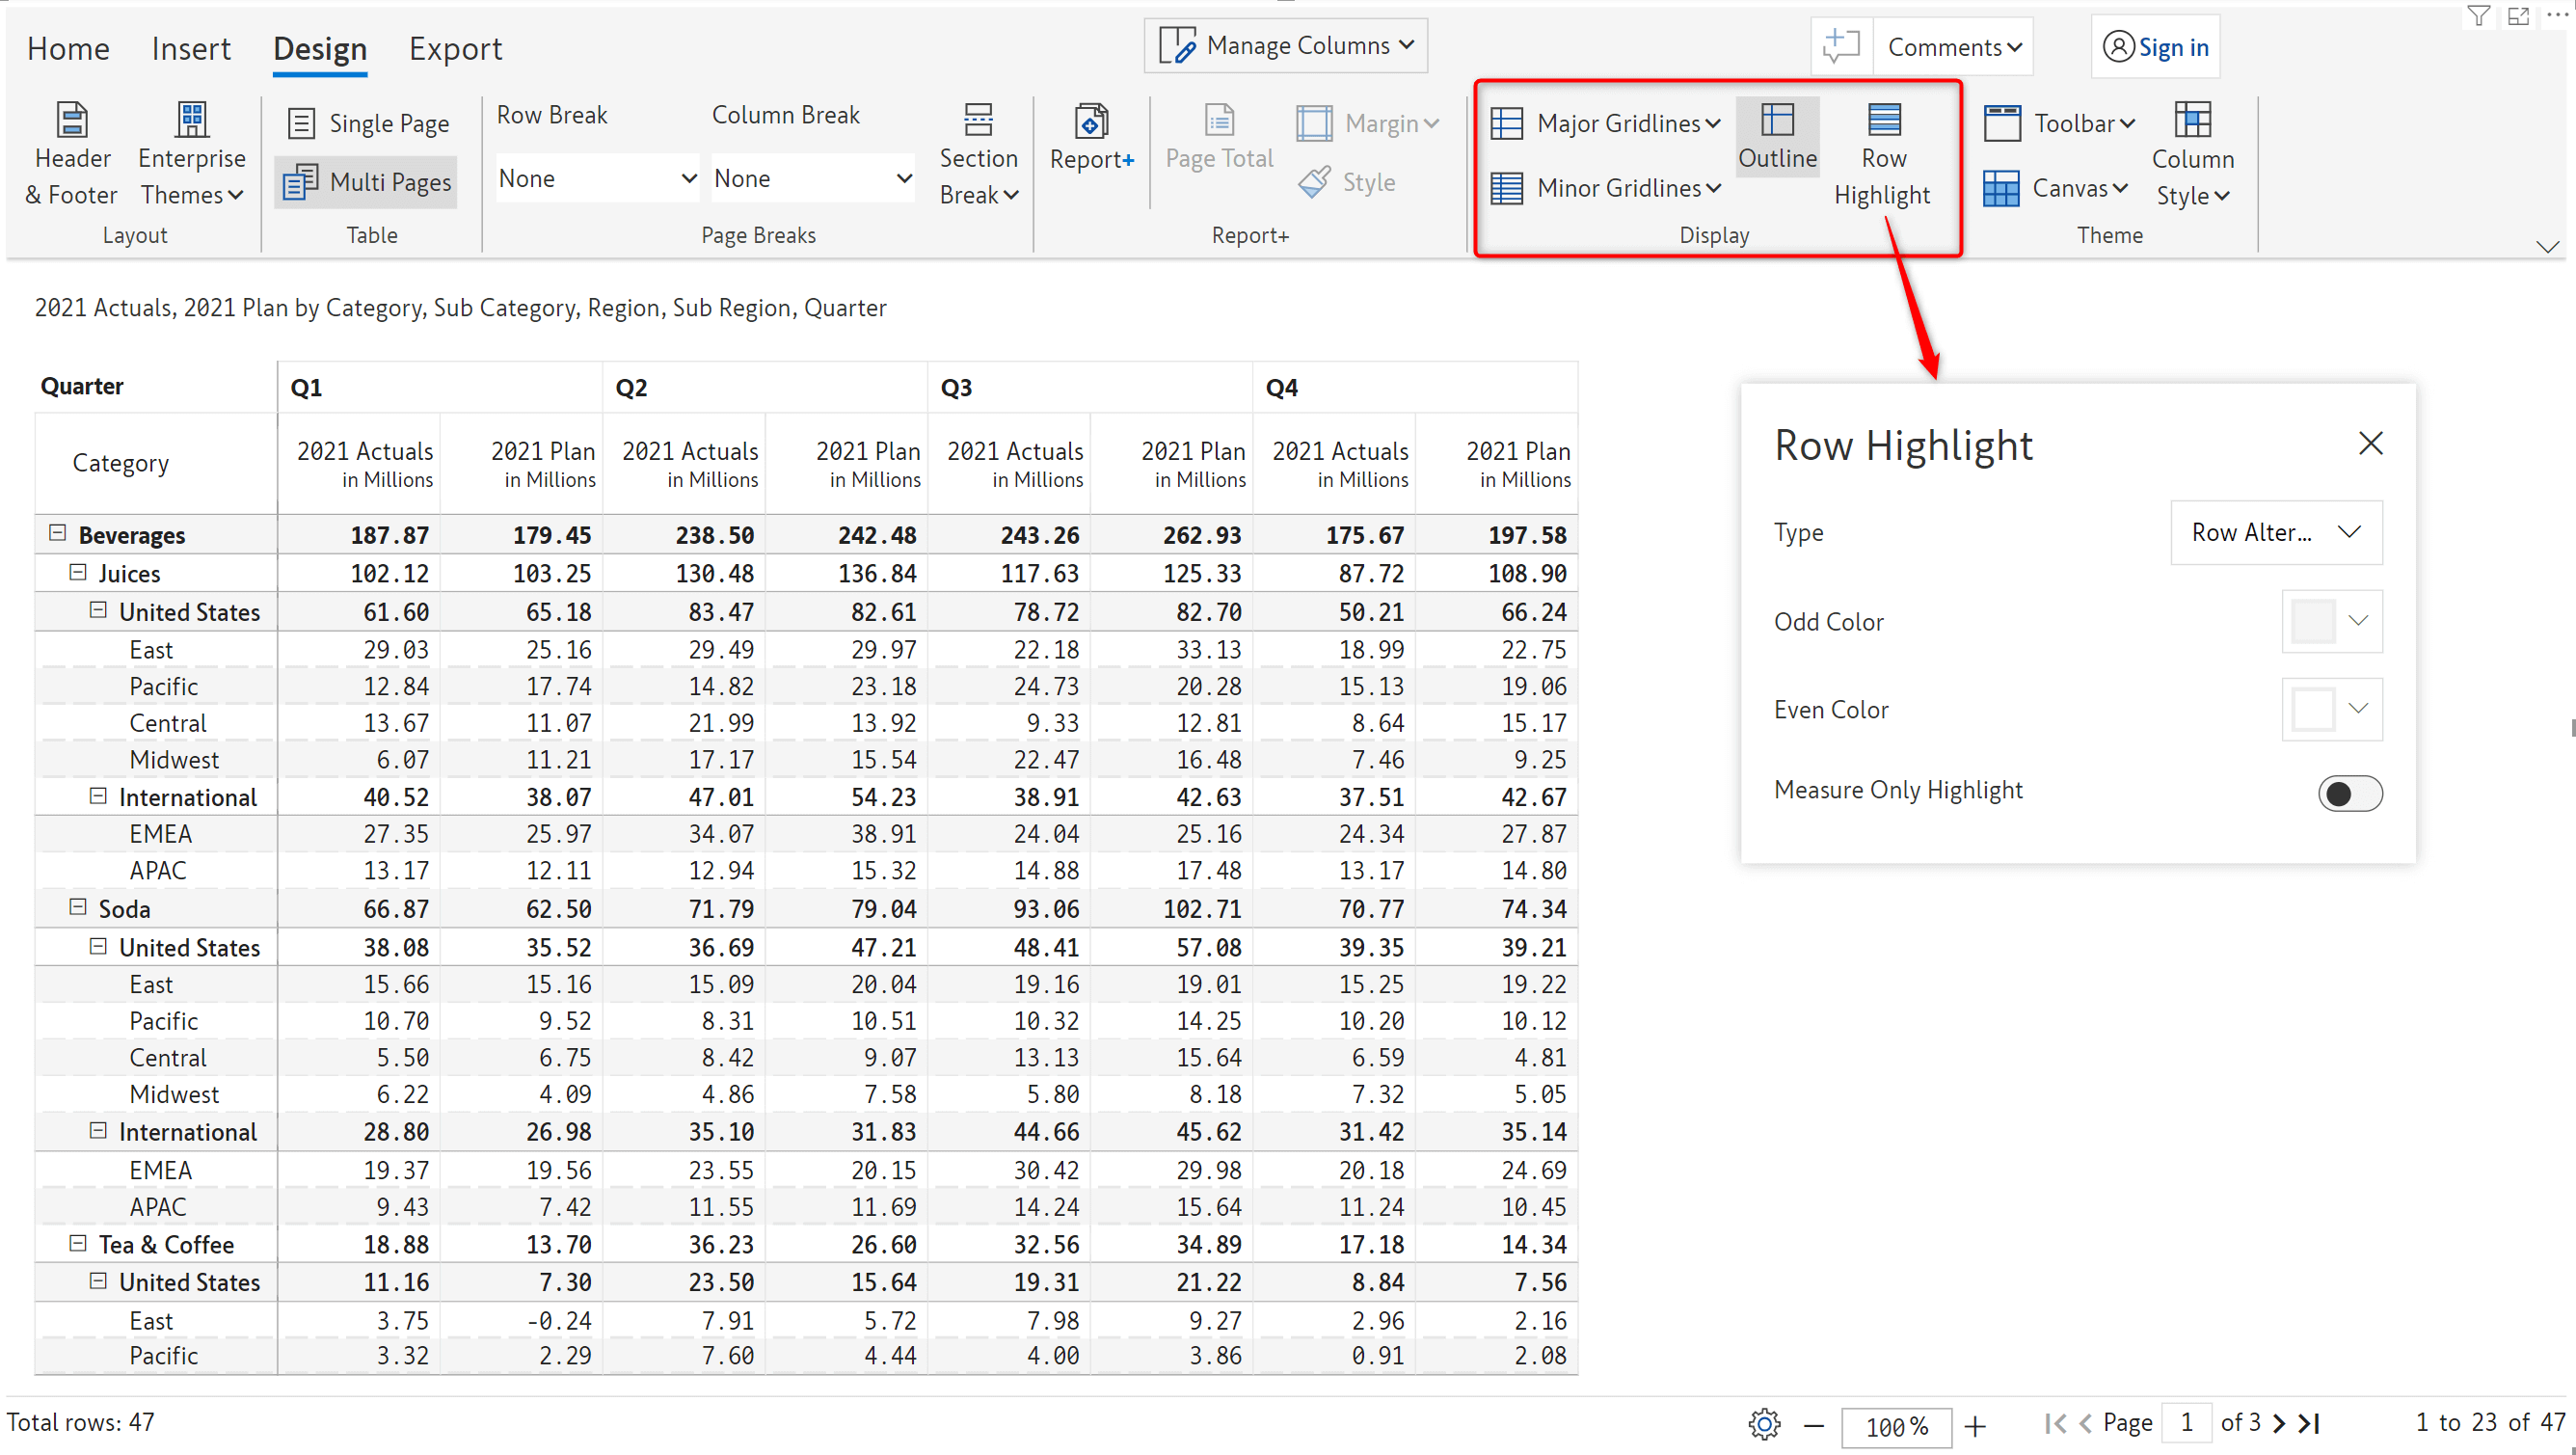
Theme section:
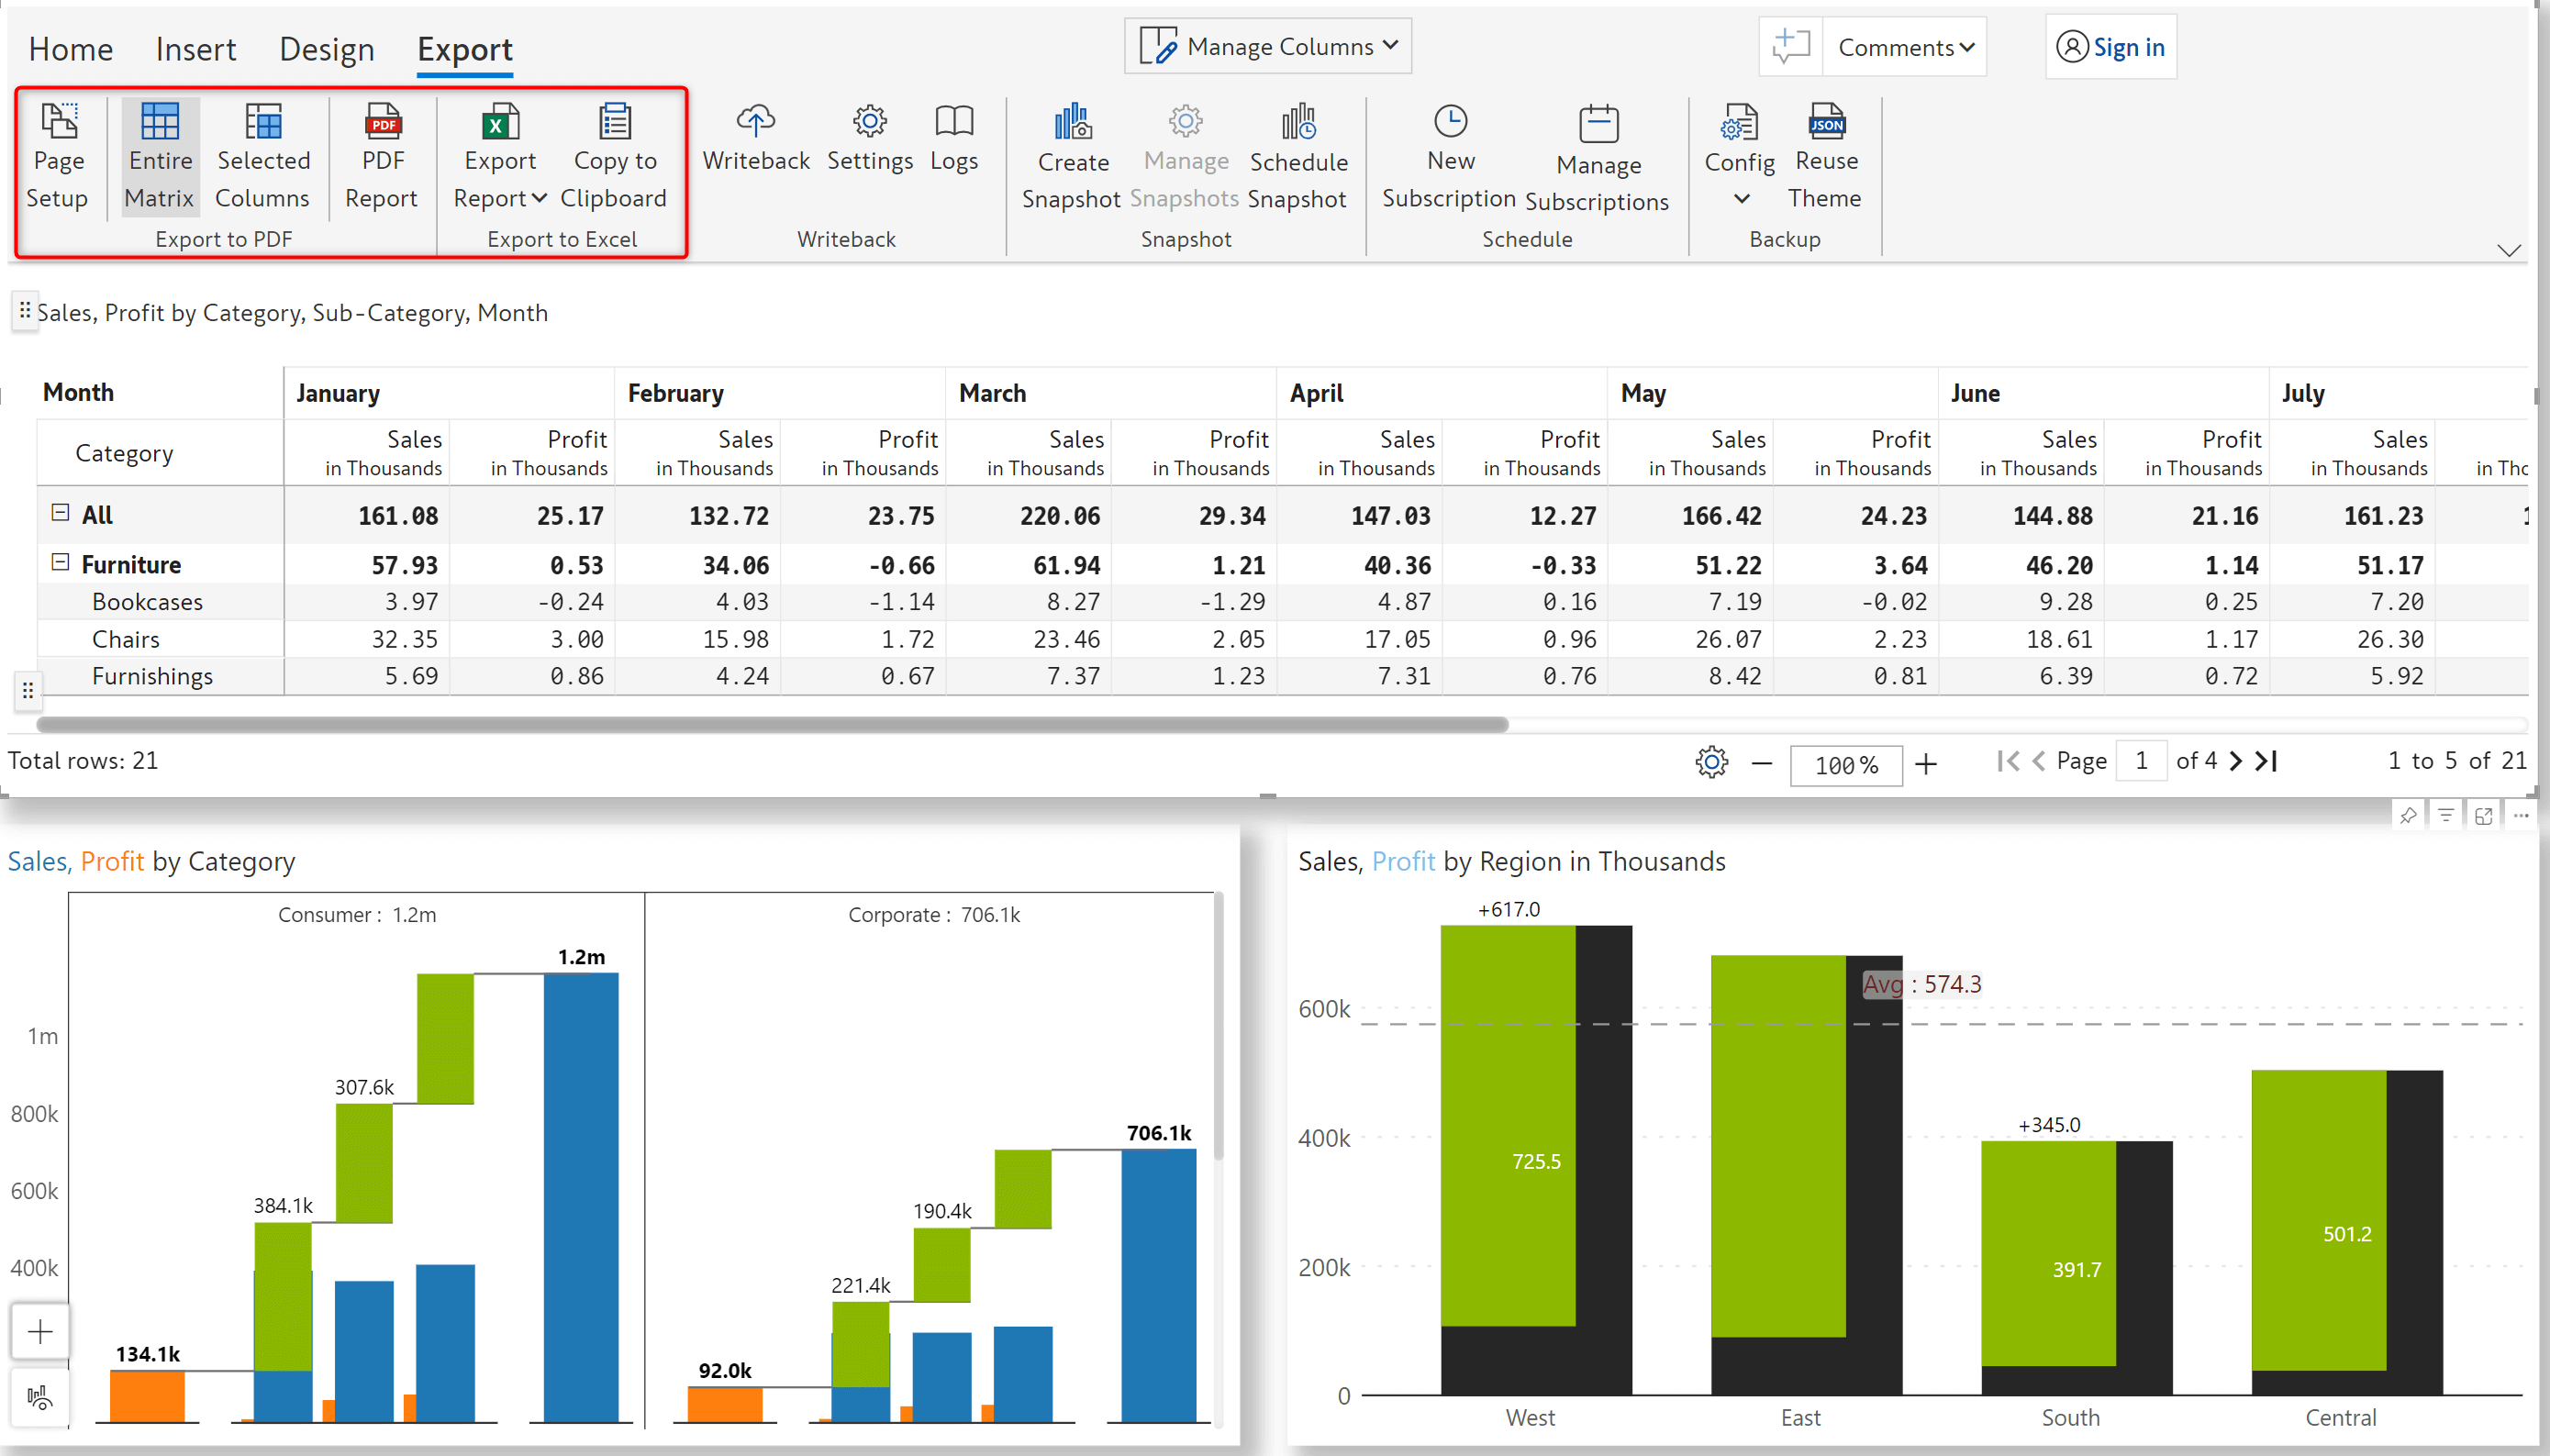
This tab provides options create fully formatted PDF or Excel exports of your report with expand/collapse, pagination and include calculated data along with comments and replies.
Learn more about exporting reports.
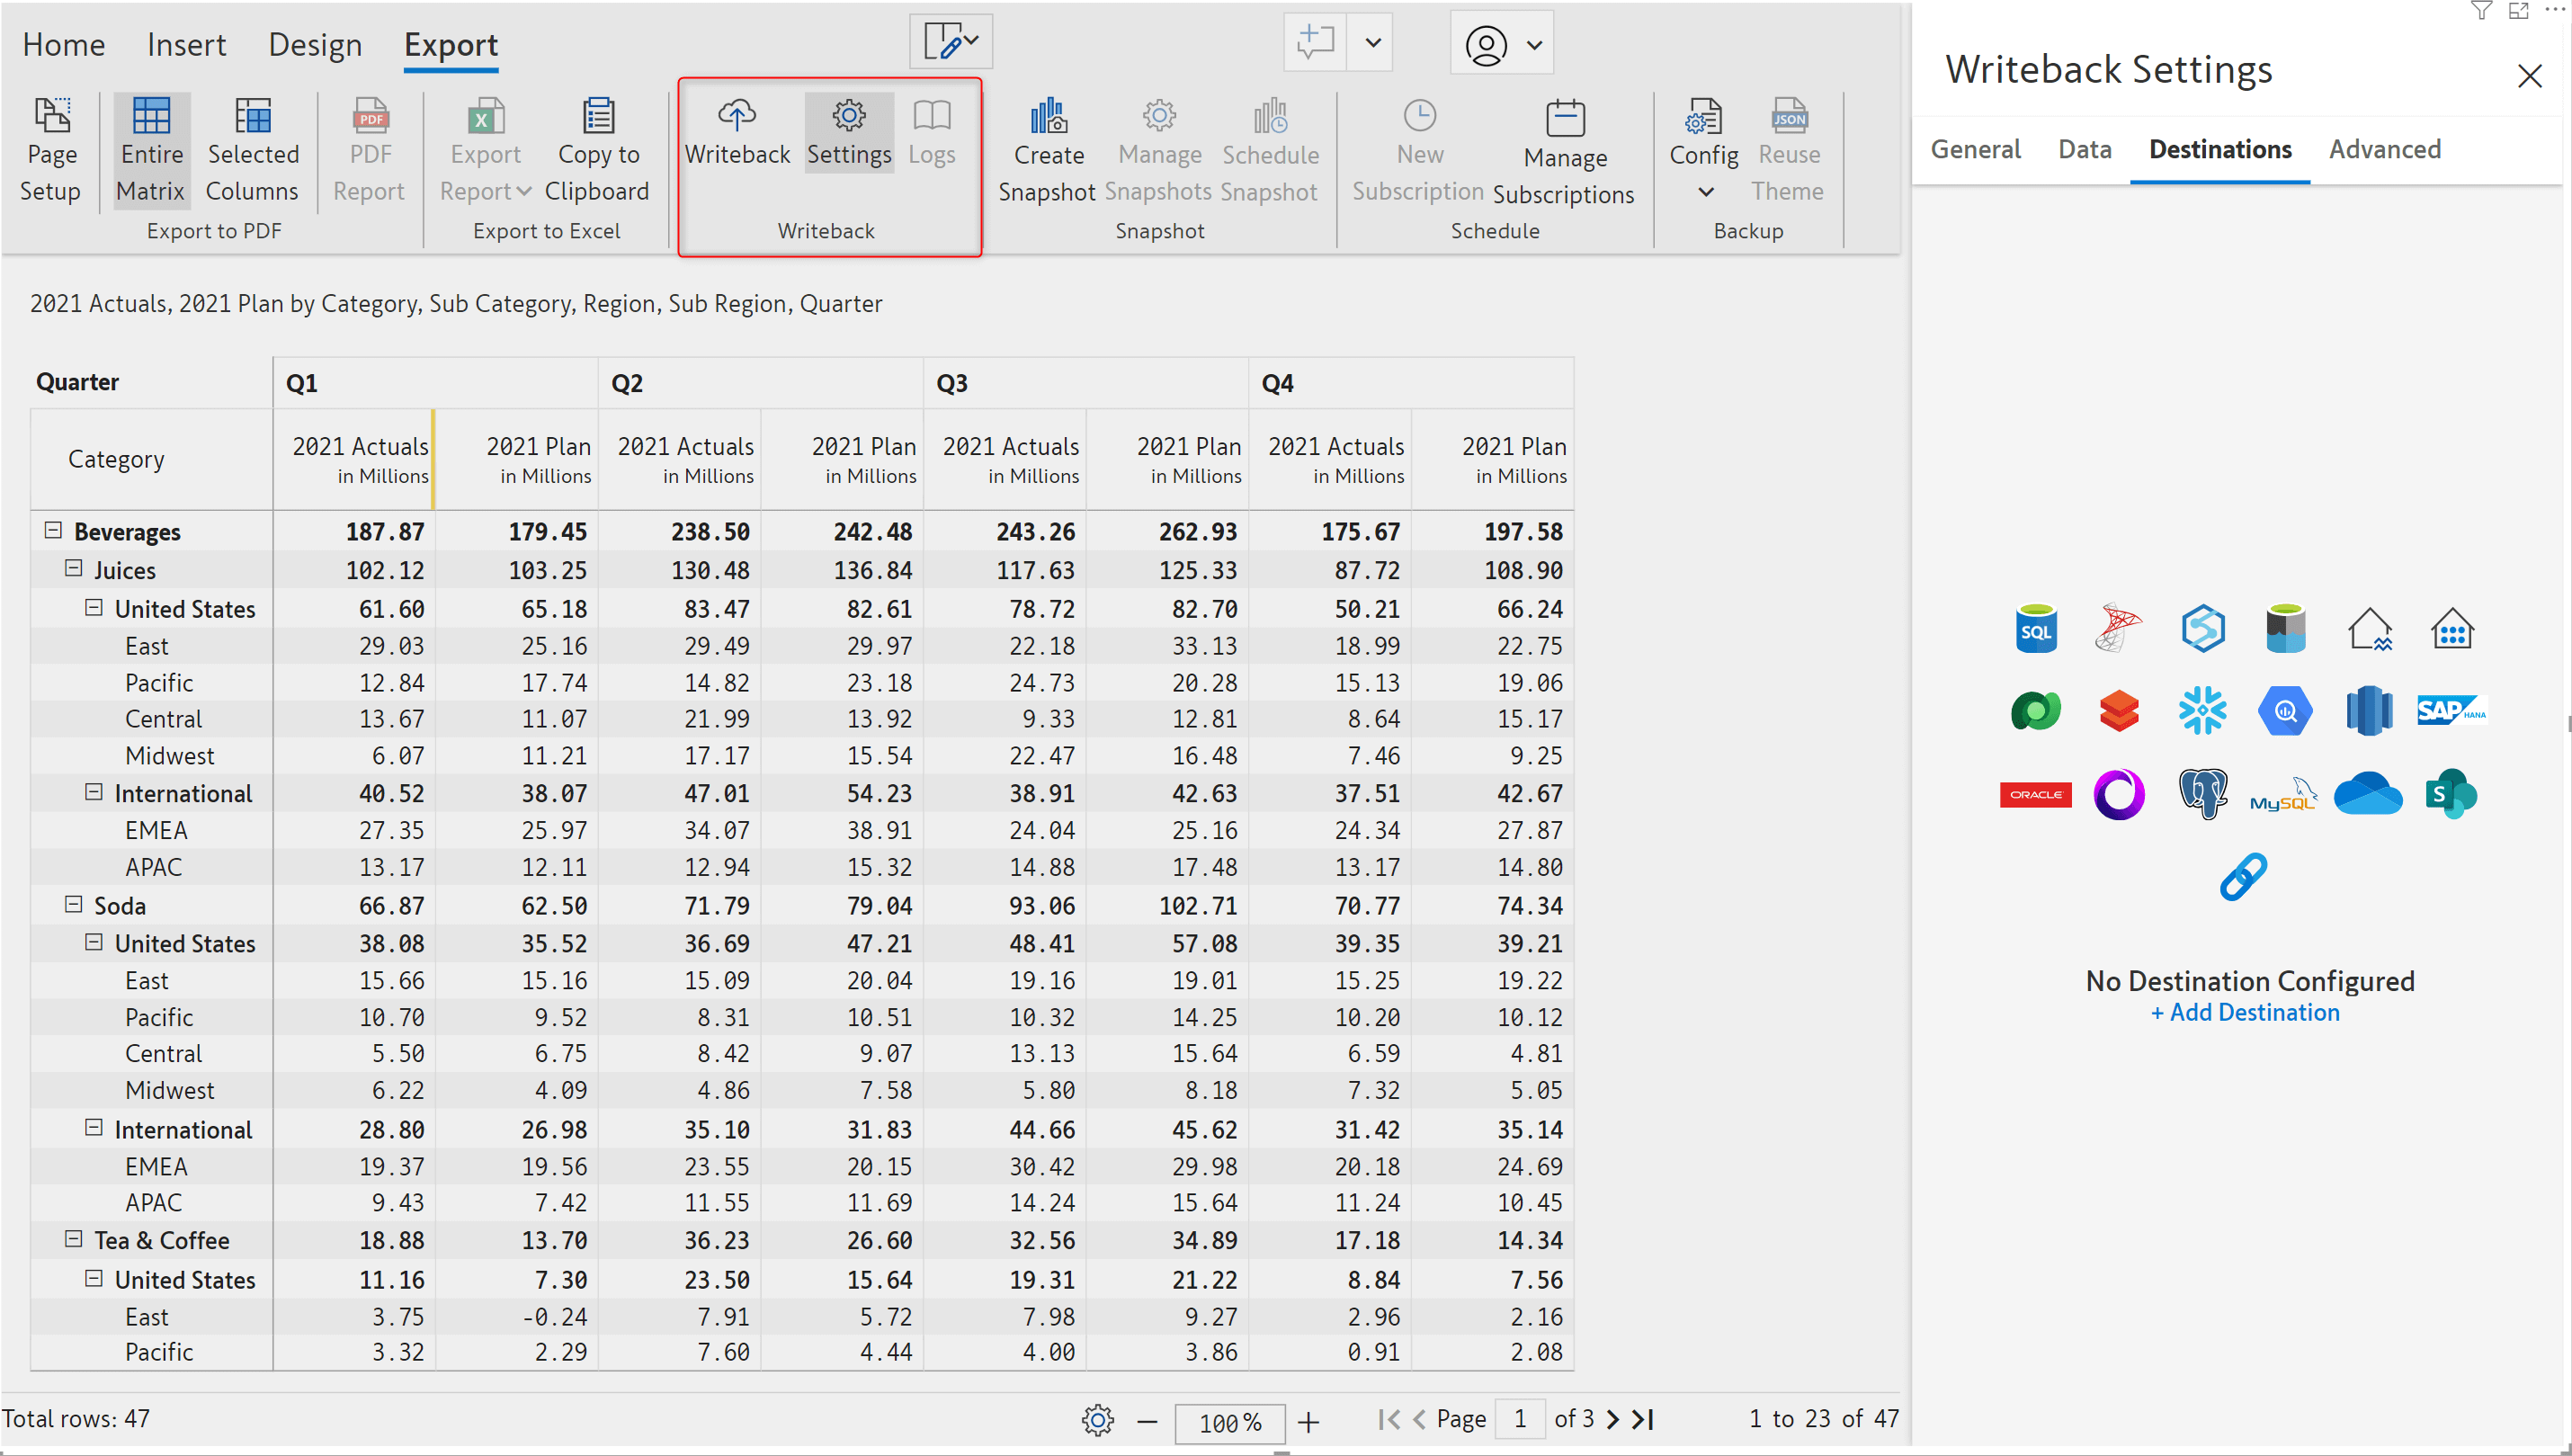
With Inforiver’s signature writeback feature, you can save the report data to several database, file, data lake and data warehouse destinations.
Learn more about data writeback.
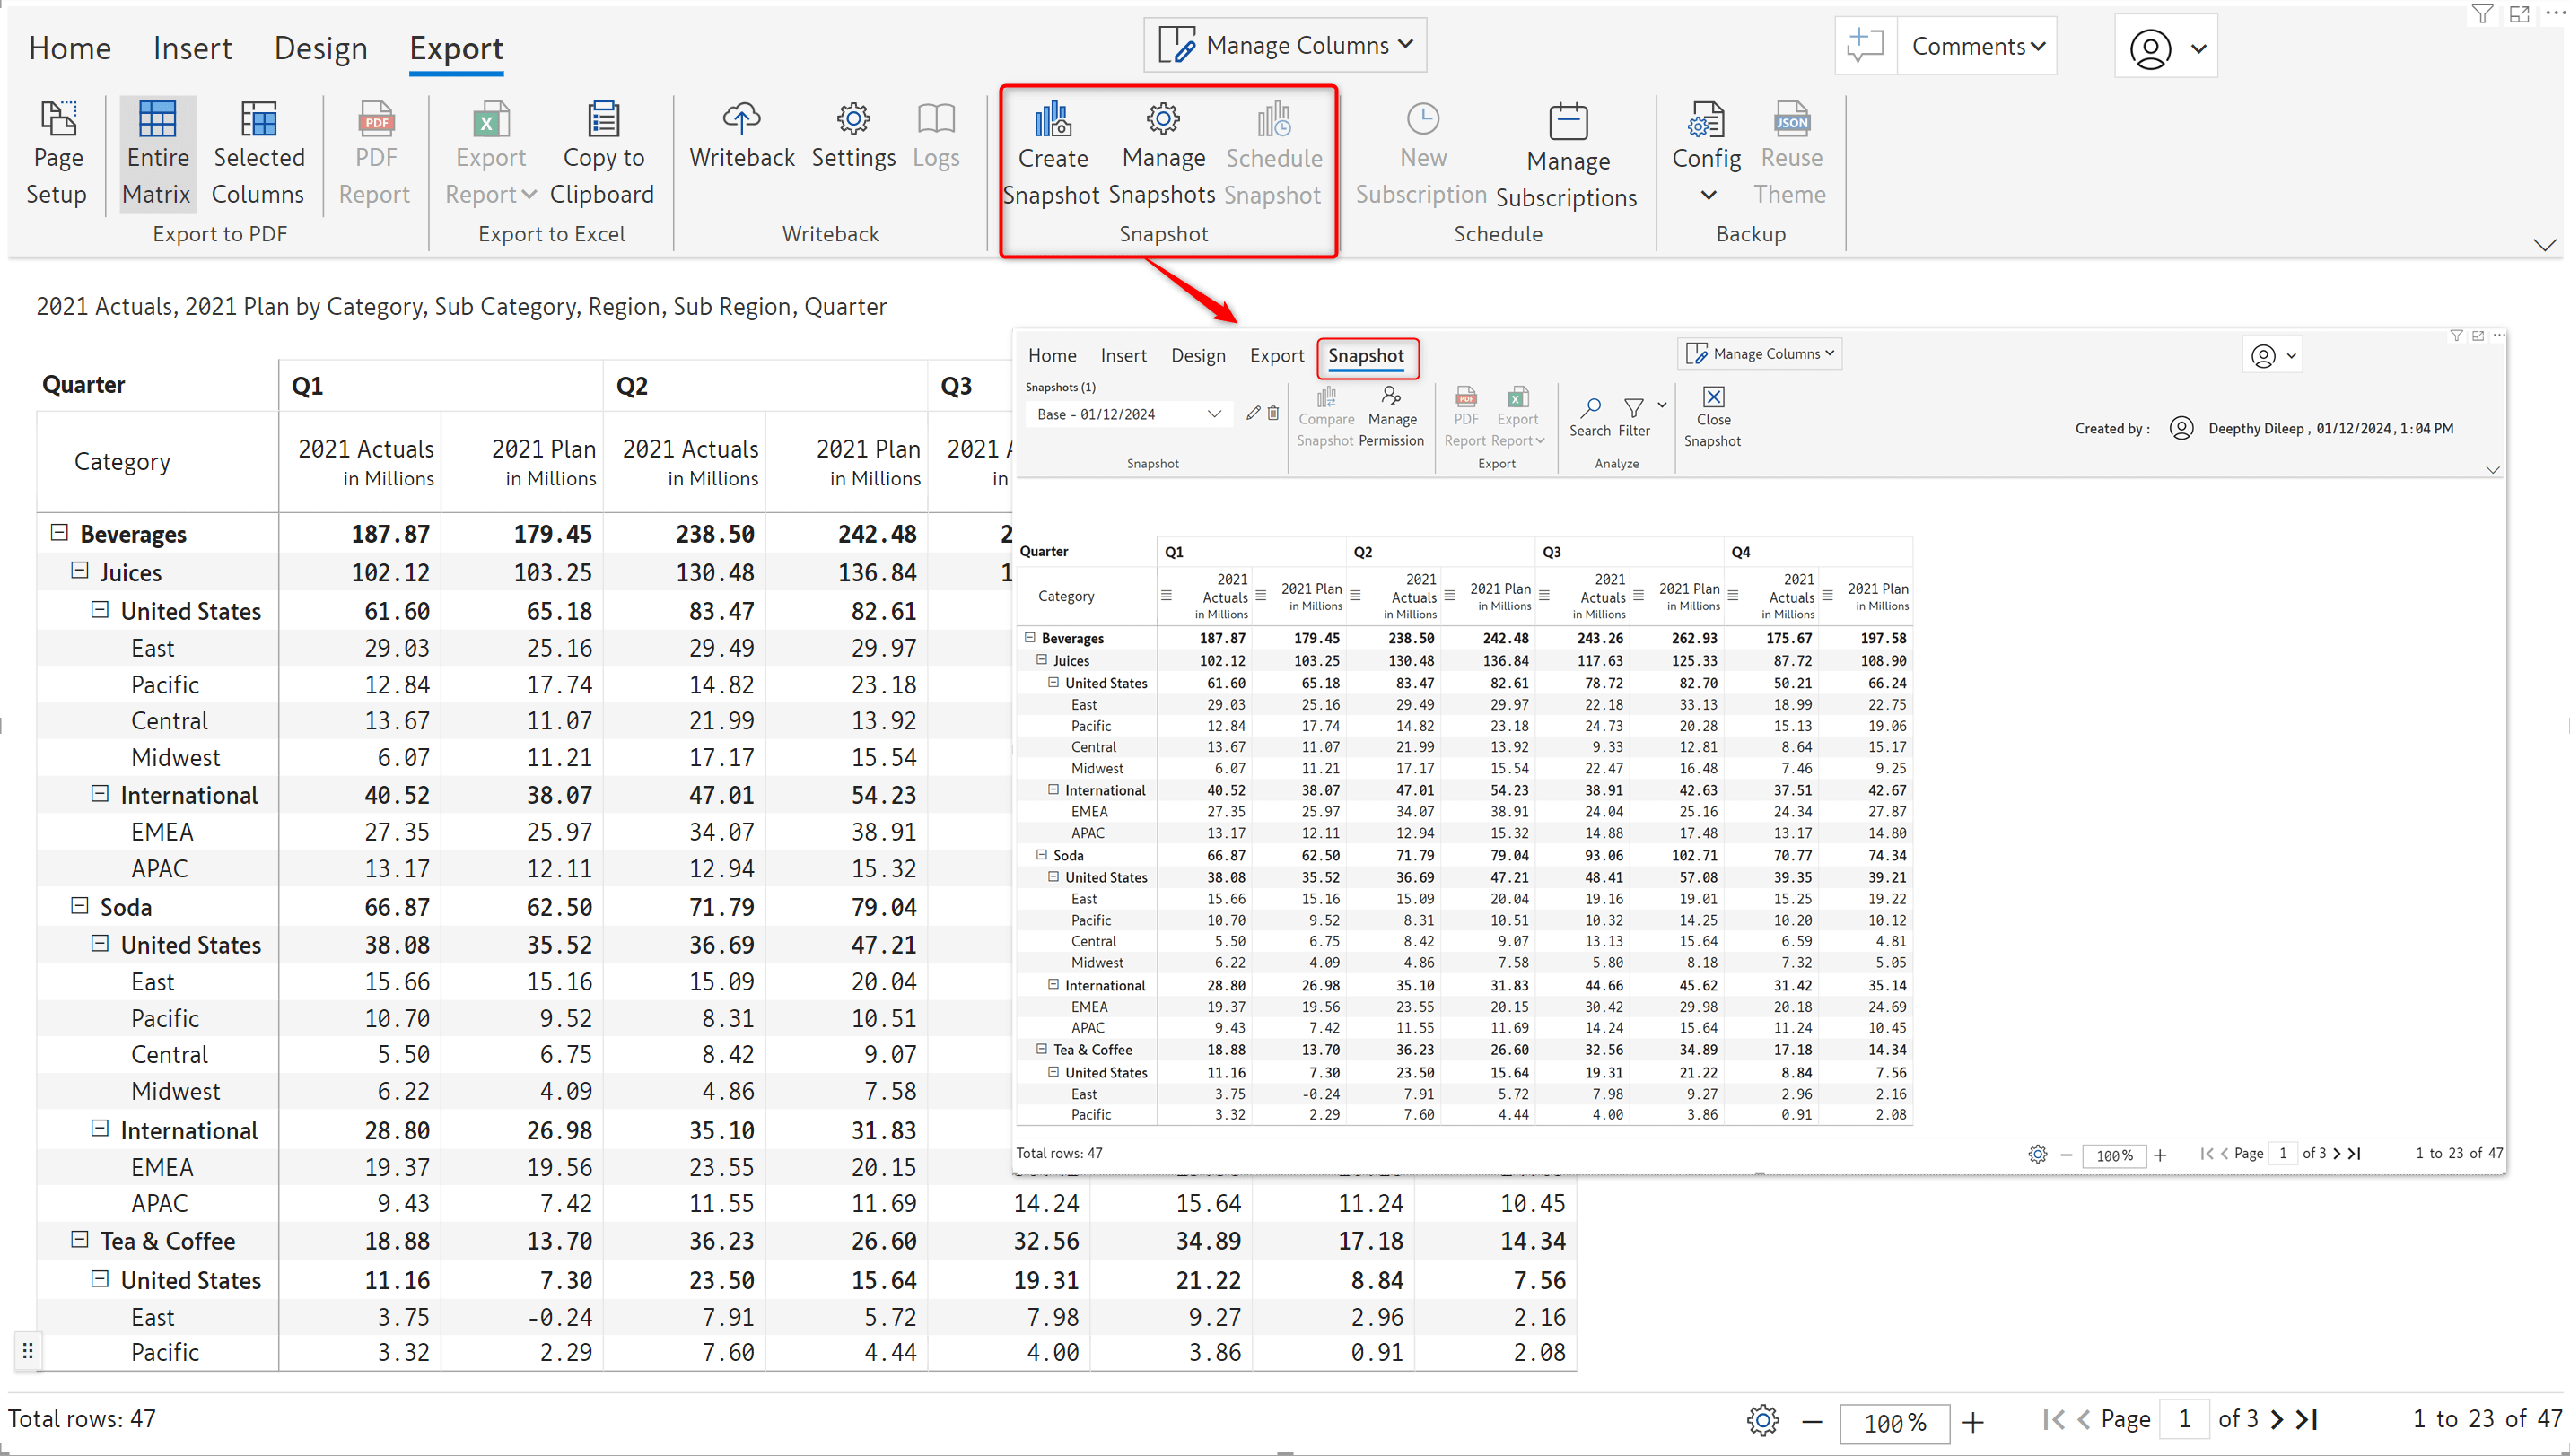
Inforiver enables you to freeze the data at month-end accounting/financial closes for future comparisons that are not impacted by source data changes and dataset refreshes.
Learn more about creating, managing, and scheduling snapshots.
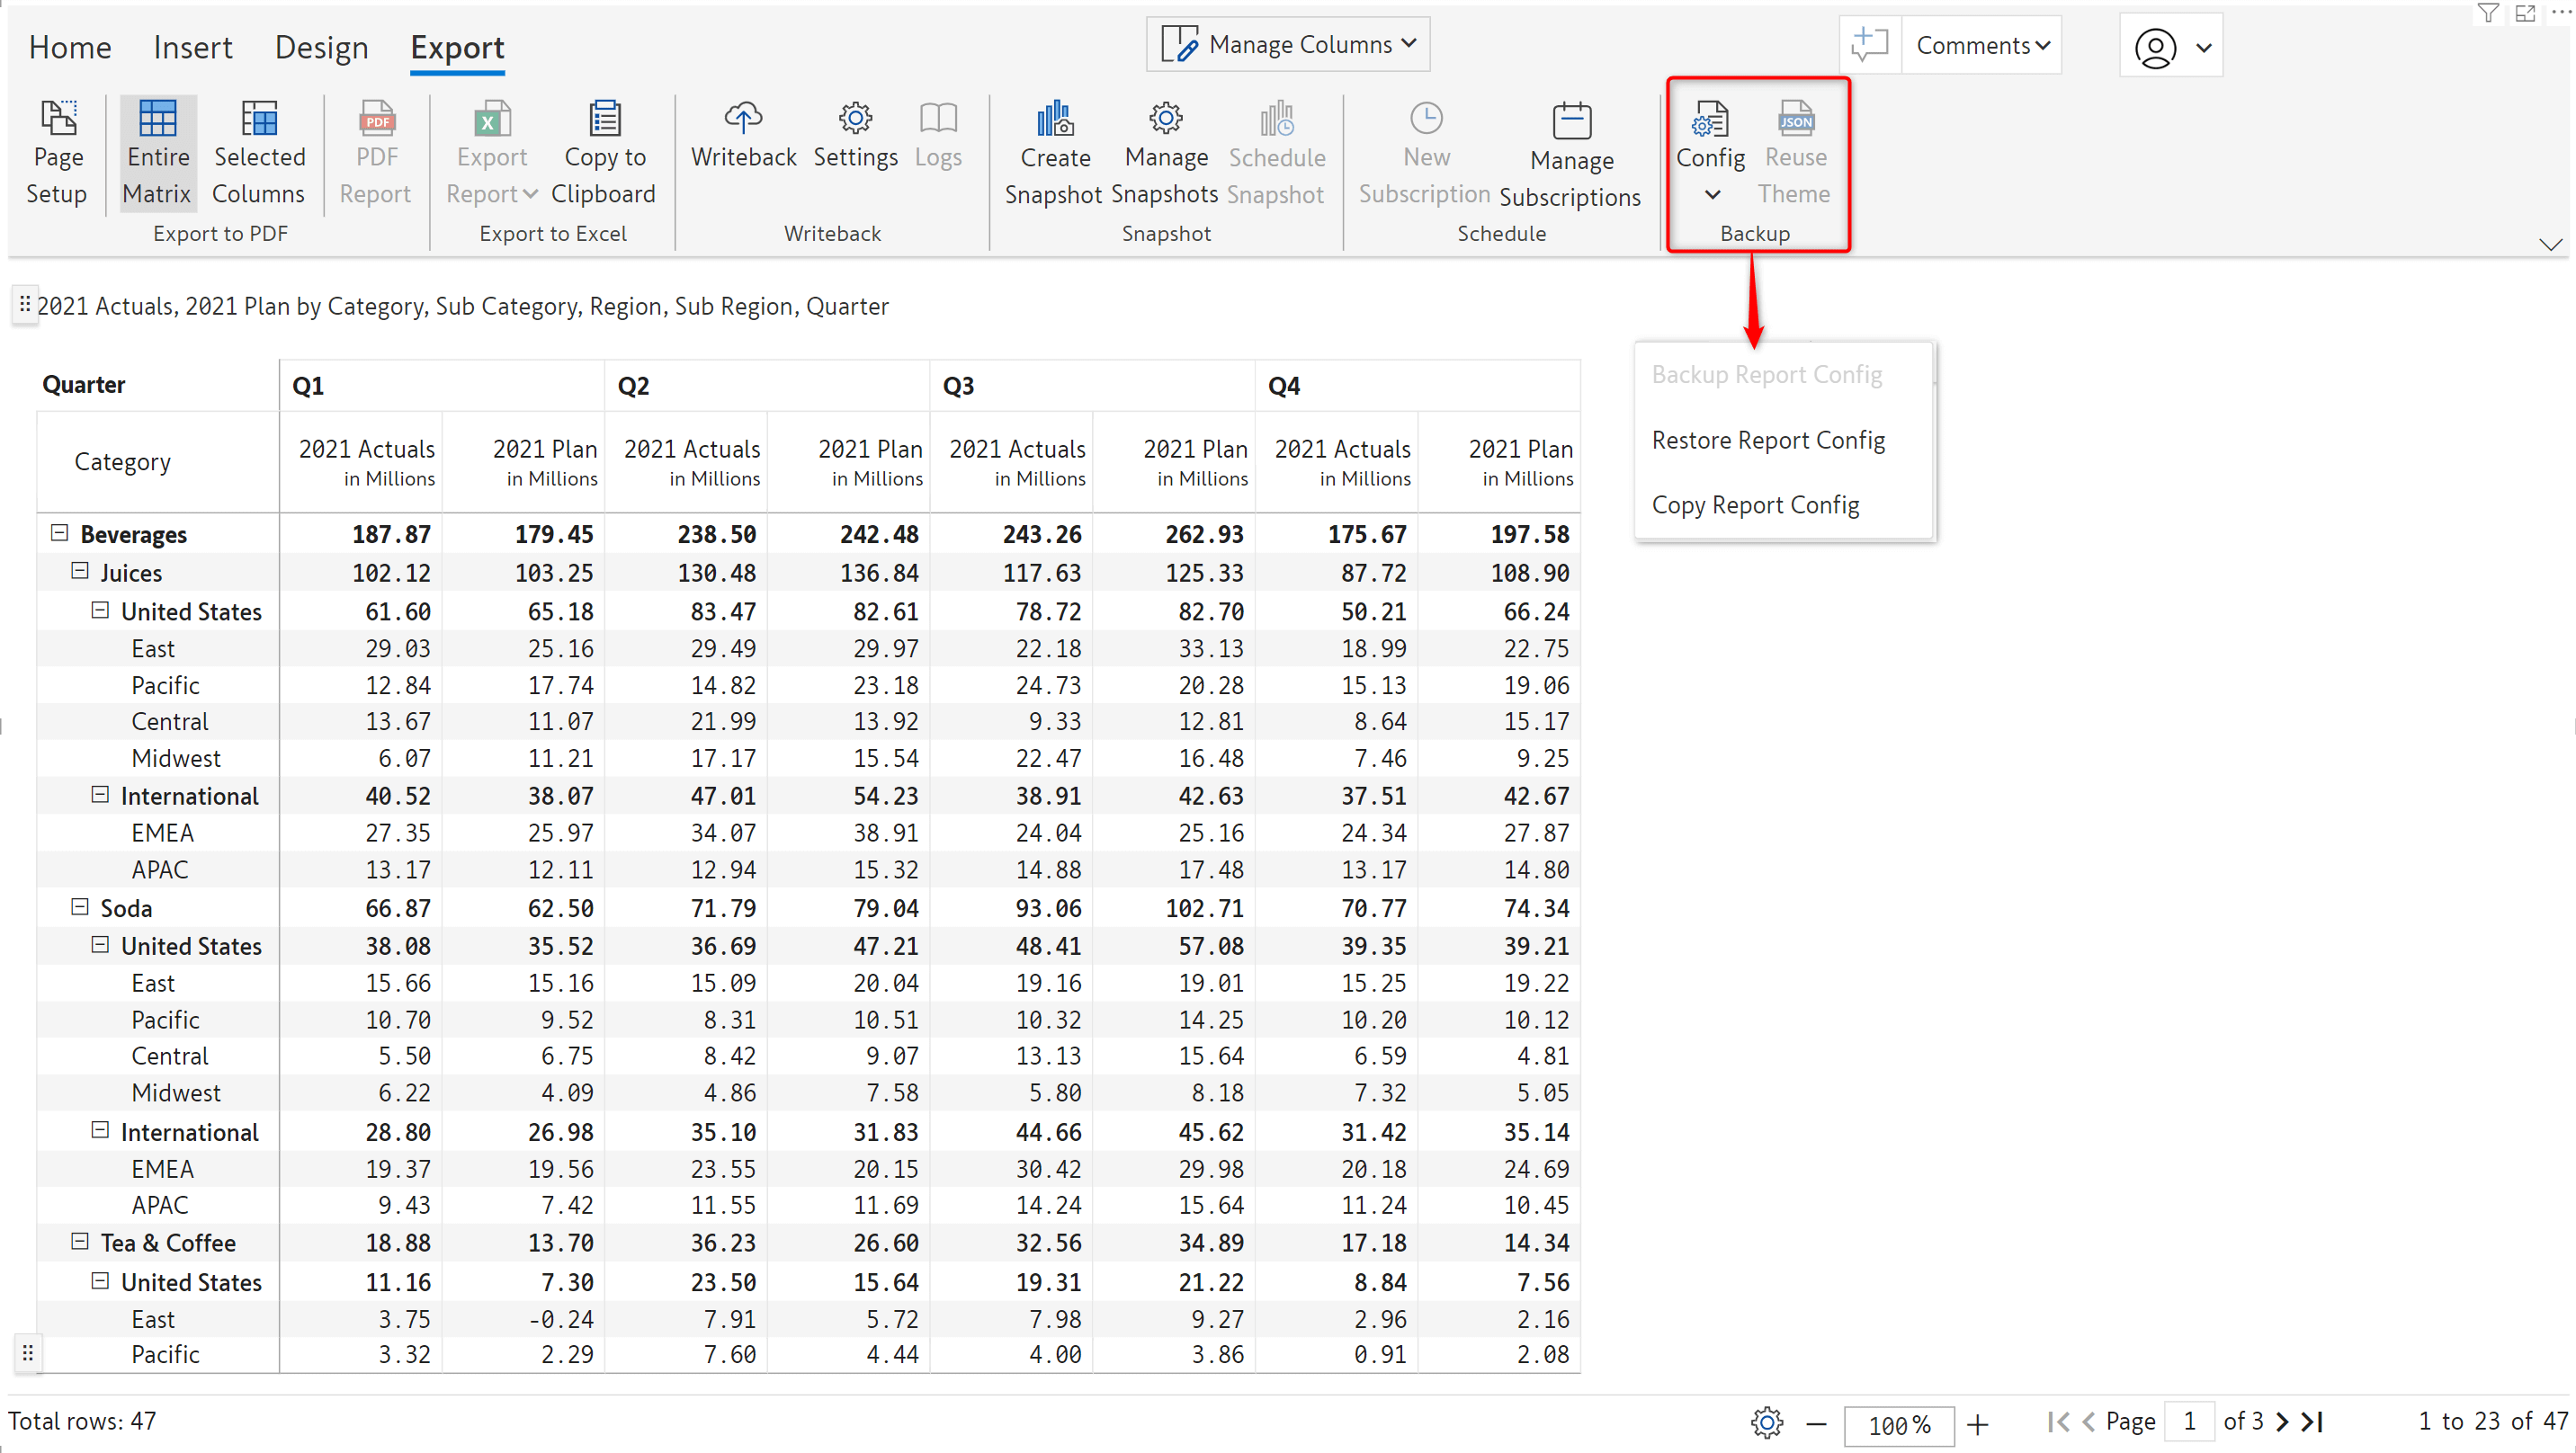
Inforiver allows you to import/export the visual configuration as a JSON file. The JSON file can be saved to your local system and shared with other users as well.
Learn more about backup and restore in Inforiver.
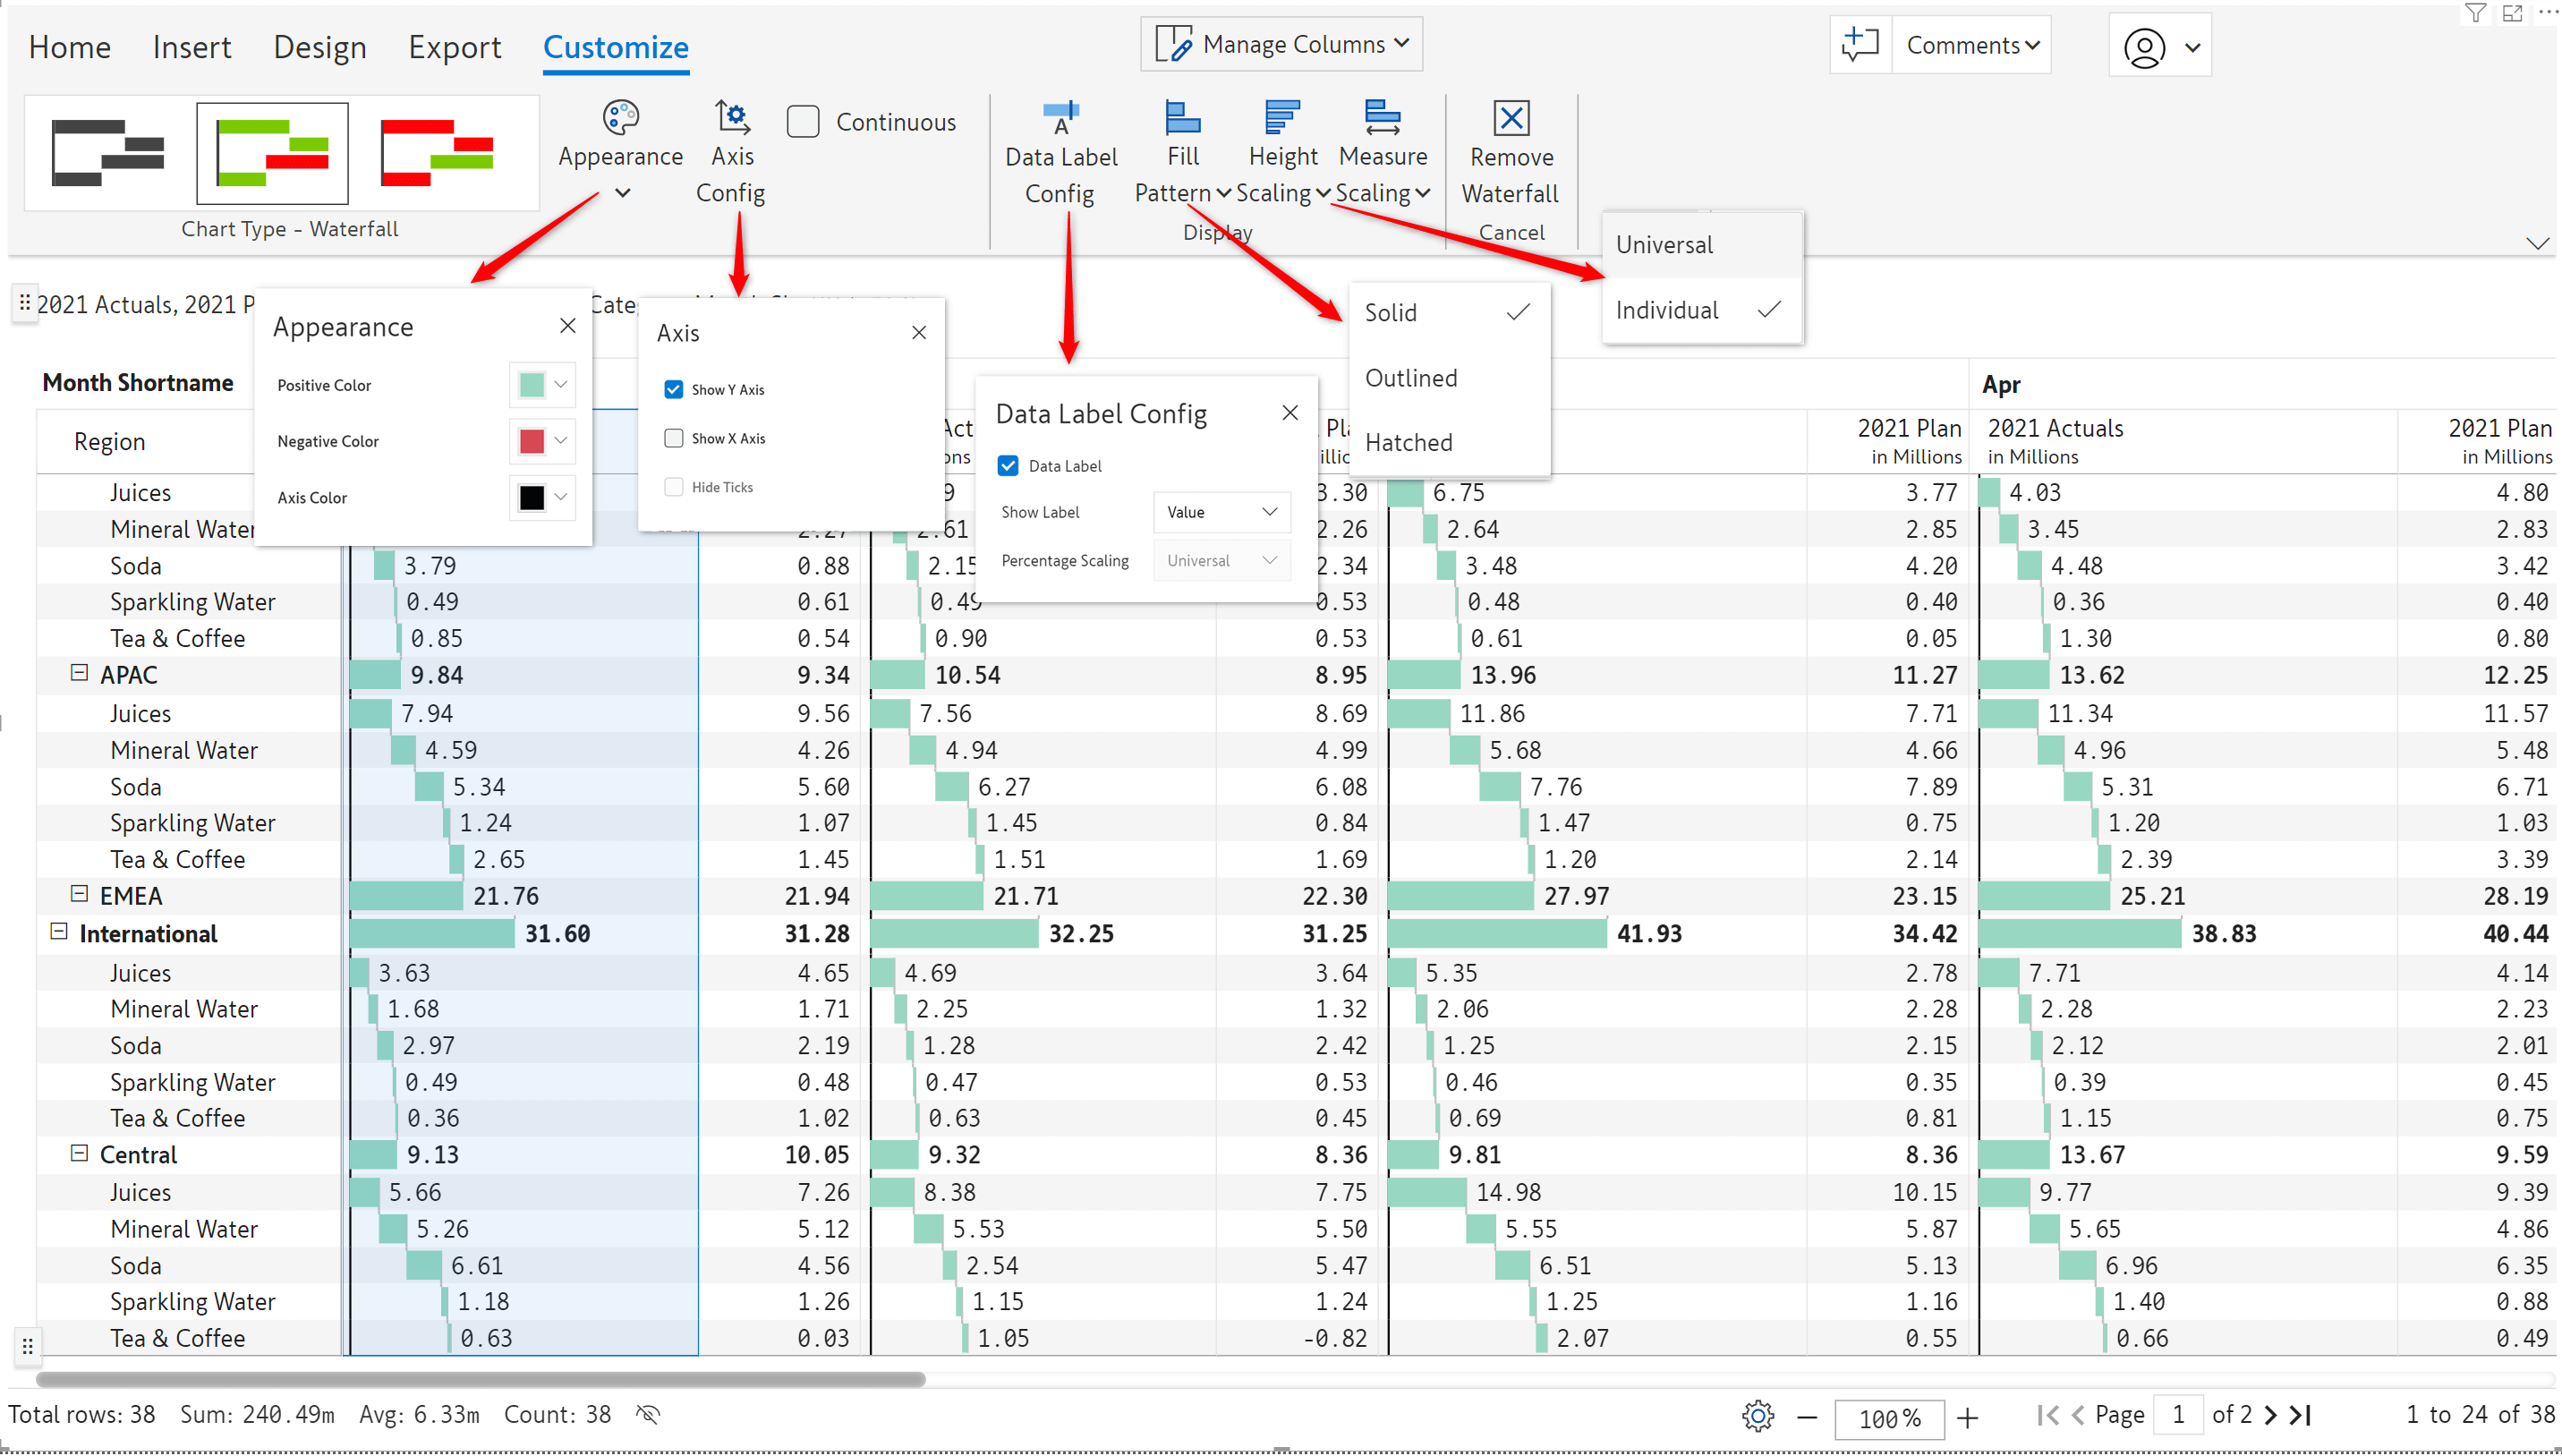
This tab is activated only when you embed charts in your reports. You can use the options in this tab to customize chart elements such as setting the color scheme, fill pattern and scaling. The customization options vary based on the chart type.
Learn more about customizing embedded charts.
This tab is activated only while customizing the header or footer. You can use different elements like charts, text, images and KPI – with individual customizations for each type. You can select from a range of layouts, set the horizontal and vertical alignment, and select the data to be used in the header.
Learn more about header and footer customizations.
Inforiver offers an extensive selection of customizations and analysis features for every element of your reports. Register for a free trial to explore Inforiver’s powerful capabilities.

Inforiver helps enterprises consolidate planning, reporting & analytics on a single platform (Power BI). The no-code, self-service award-winning platform has been recognized as the industry’s best and is adopted by many Fortune 100 firms.
Inforiver is a product of Lumel, the #1 Power BI AppSource Partner. The firm serves over 3,000 customers worldwide through its portfolio of products offered under the brands Inforiver, EDITable, ValQ, and xViz.