Upcoming webinar on 'Inforiver Charts : The fastest way to deliver stories in Power BI', Aug 29th , Monday, 10.30 AM CST. Register Now
Upcoming webinar on 'Inforiver Charts : The fastest way to deliver stories in Power BI', Aug 29th , Monday, 10.30 AM CST. Register Now
Welcome to the Inforiver Premium 2.5 release update. We are thrilled to announce several new features and key enhancements to filter/slicer context aware comments, data input, forecasting, aggregation, row management - most anticipated by our Inforiver community!
Key enhancements in this 2.5 release are listed below. Each section in this document corresponds to the section in the Inforiver Matrix toolbar which has new features or enhancements. Feel free to jump to the section that interests you the most!
You can now use custom icons to easily highlight patterns or outliers in your data! You can upload icons as files or URLs when applying conditional formatting. A background color can also be applied to these icons now which enhances conditional formatting even further.
2.1. Expand to level
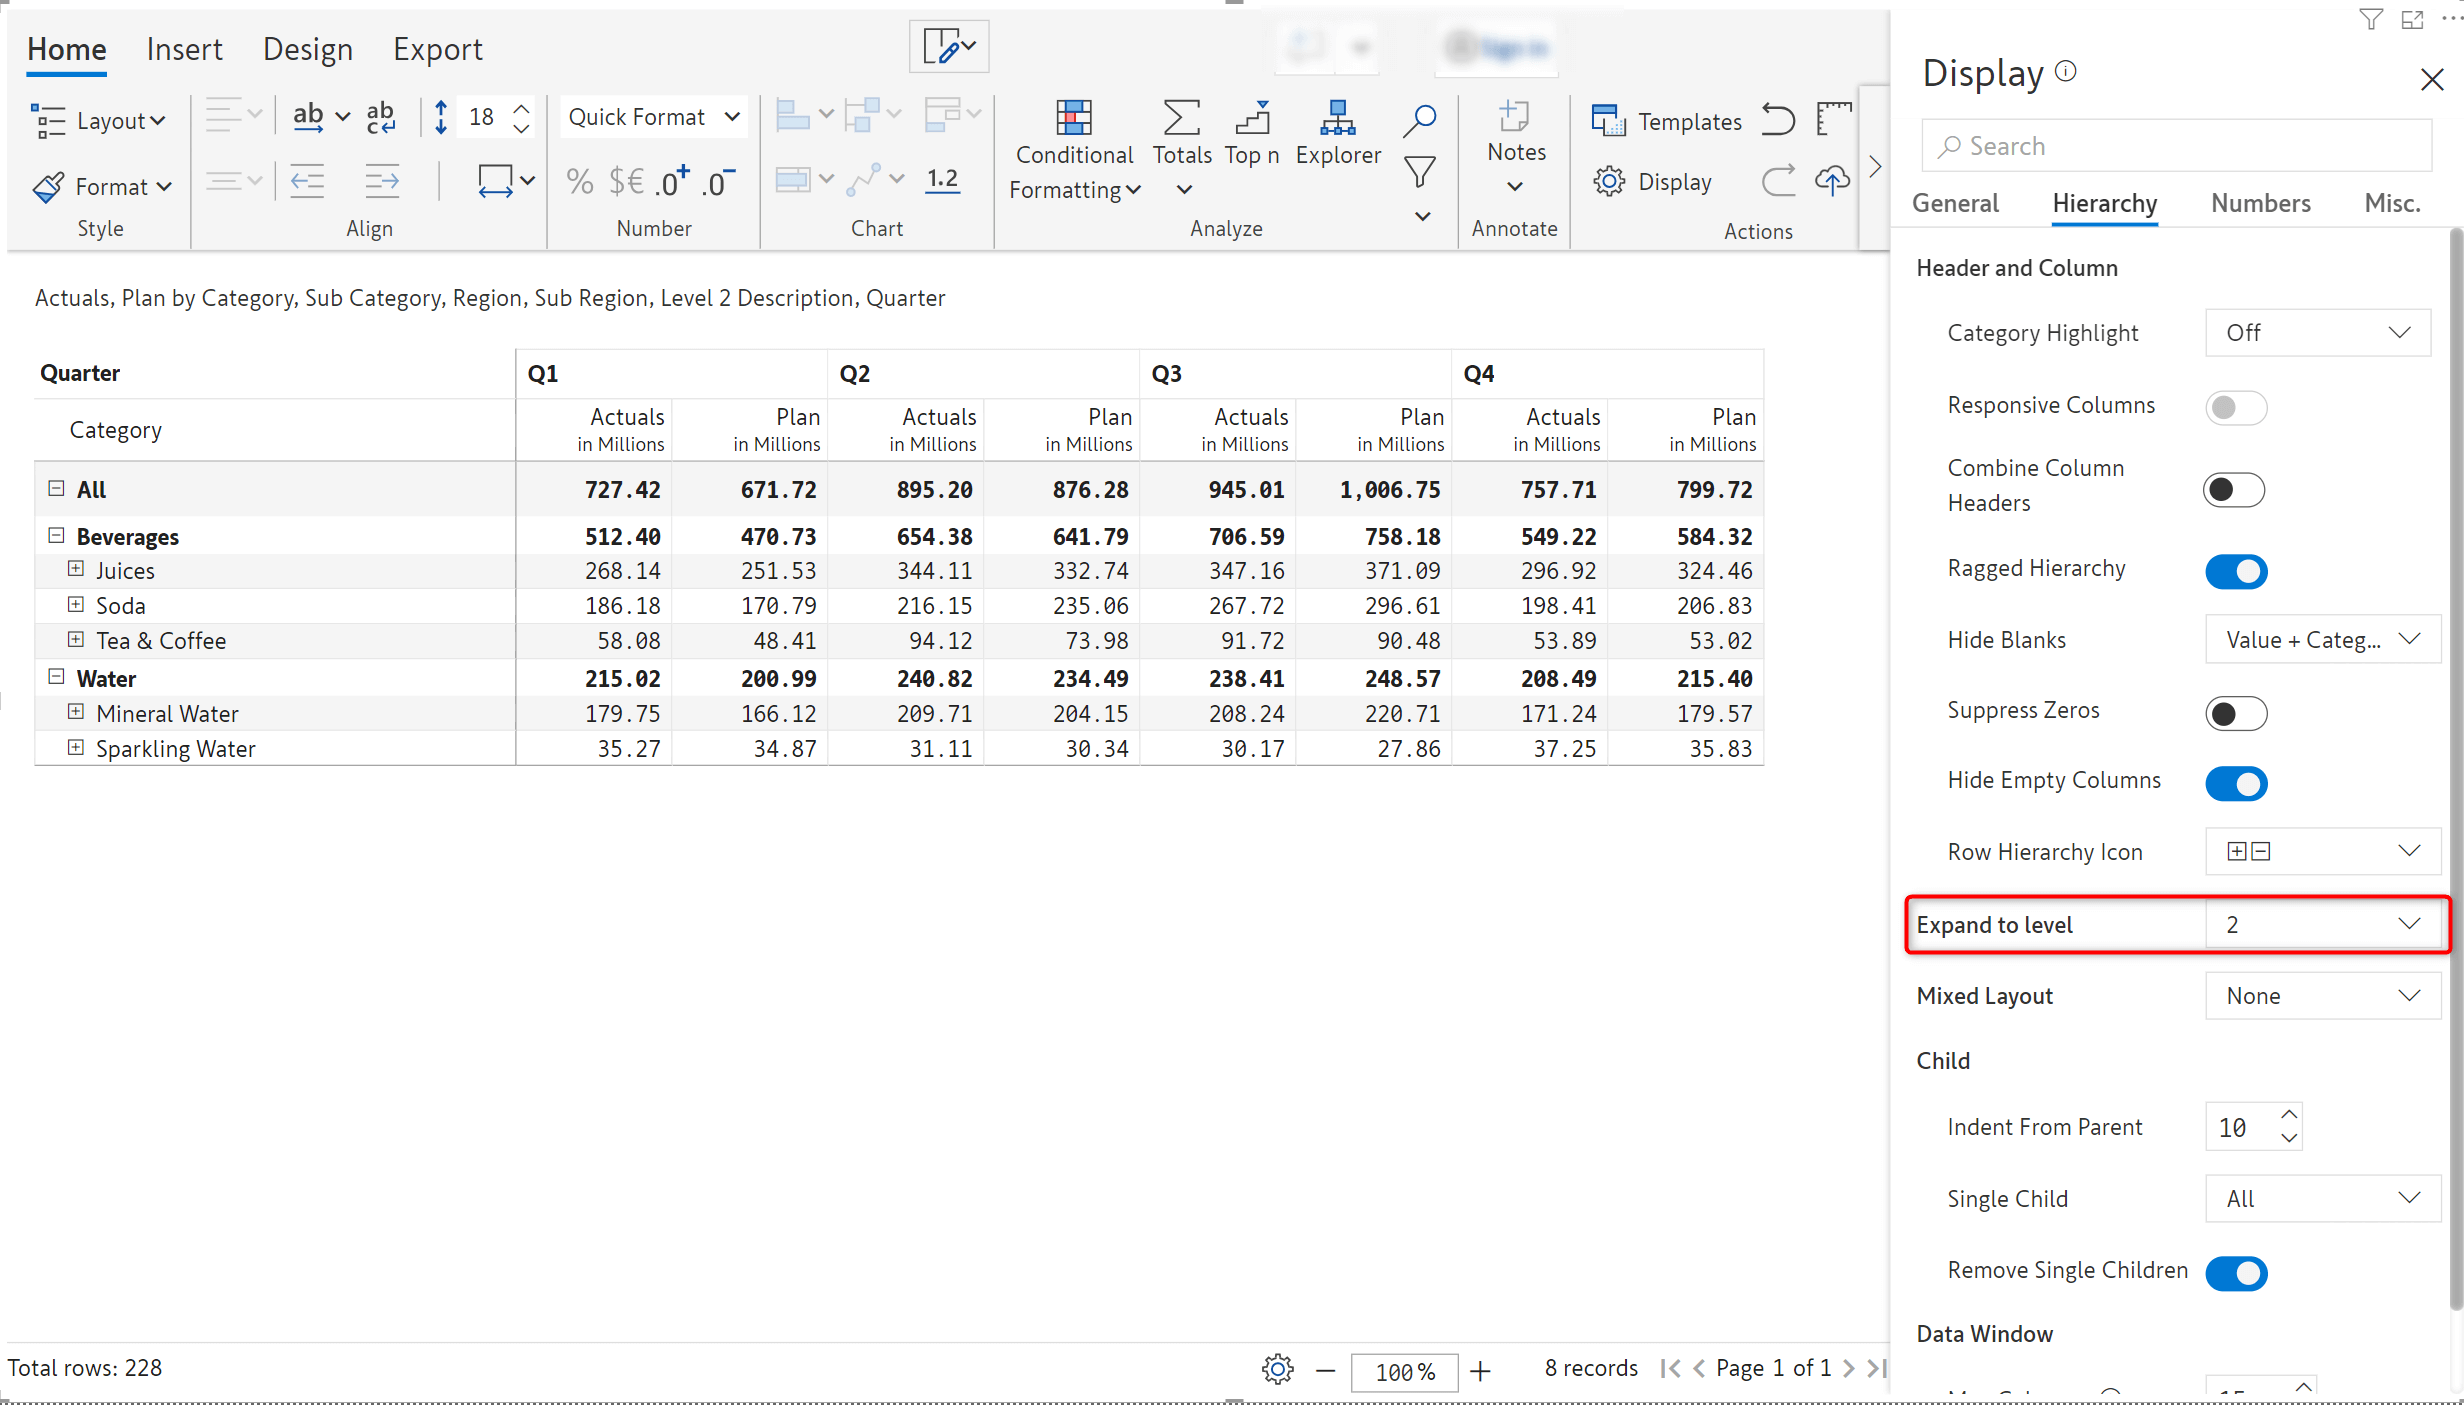
If your dataset contains hierarchies with multiple levels, you can choose the default expand to the hierarchy to a specific level at initial load. This setting will be retained even after applying a filter/slicer. This feature will now enhance the overall user experience. The initial report’s expand/collapse will be more compact when the overall dataset has multiple levels of hierarchies (more than 4 or 5).
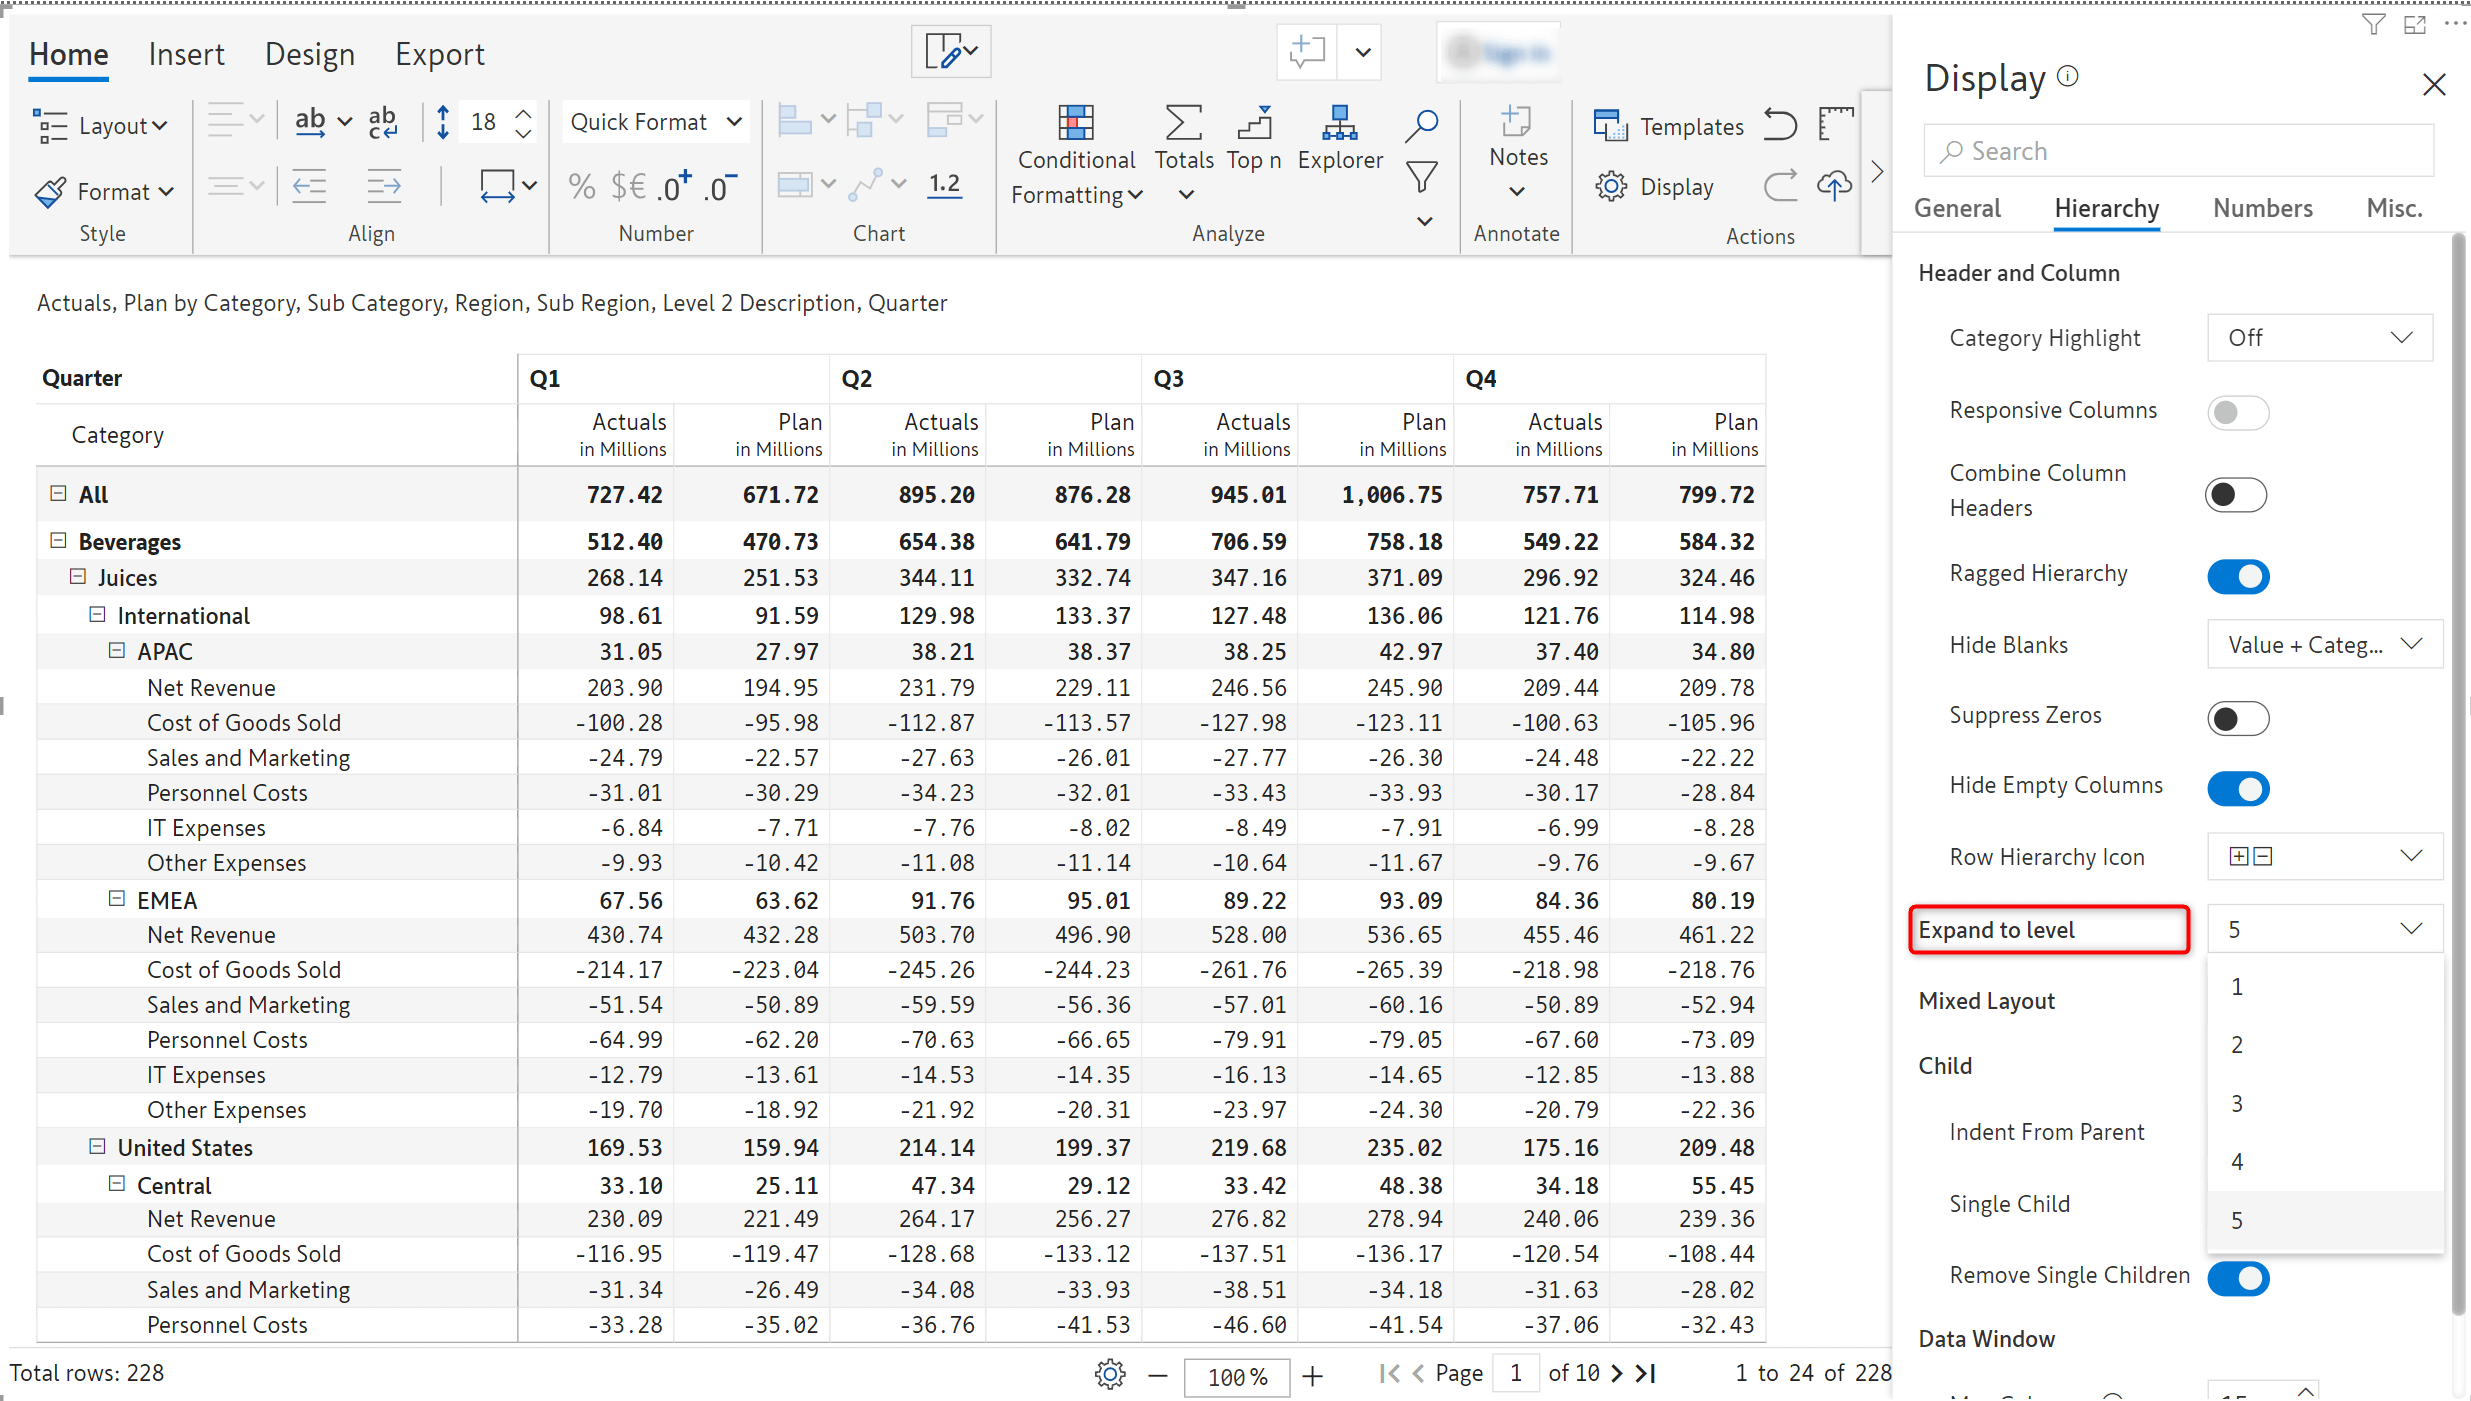
On setting the Expand to level configuration to 2, the hierarchy is expanded for up to two levels by default.
2.2. Prefix and suffix
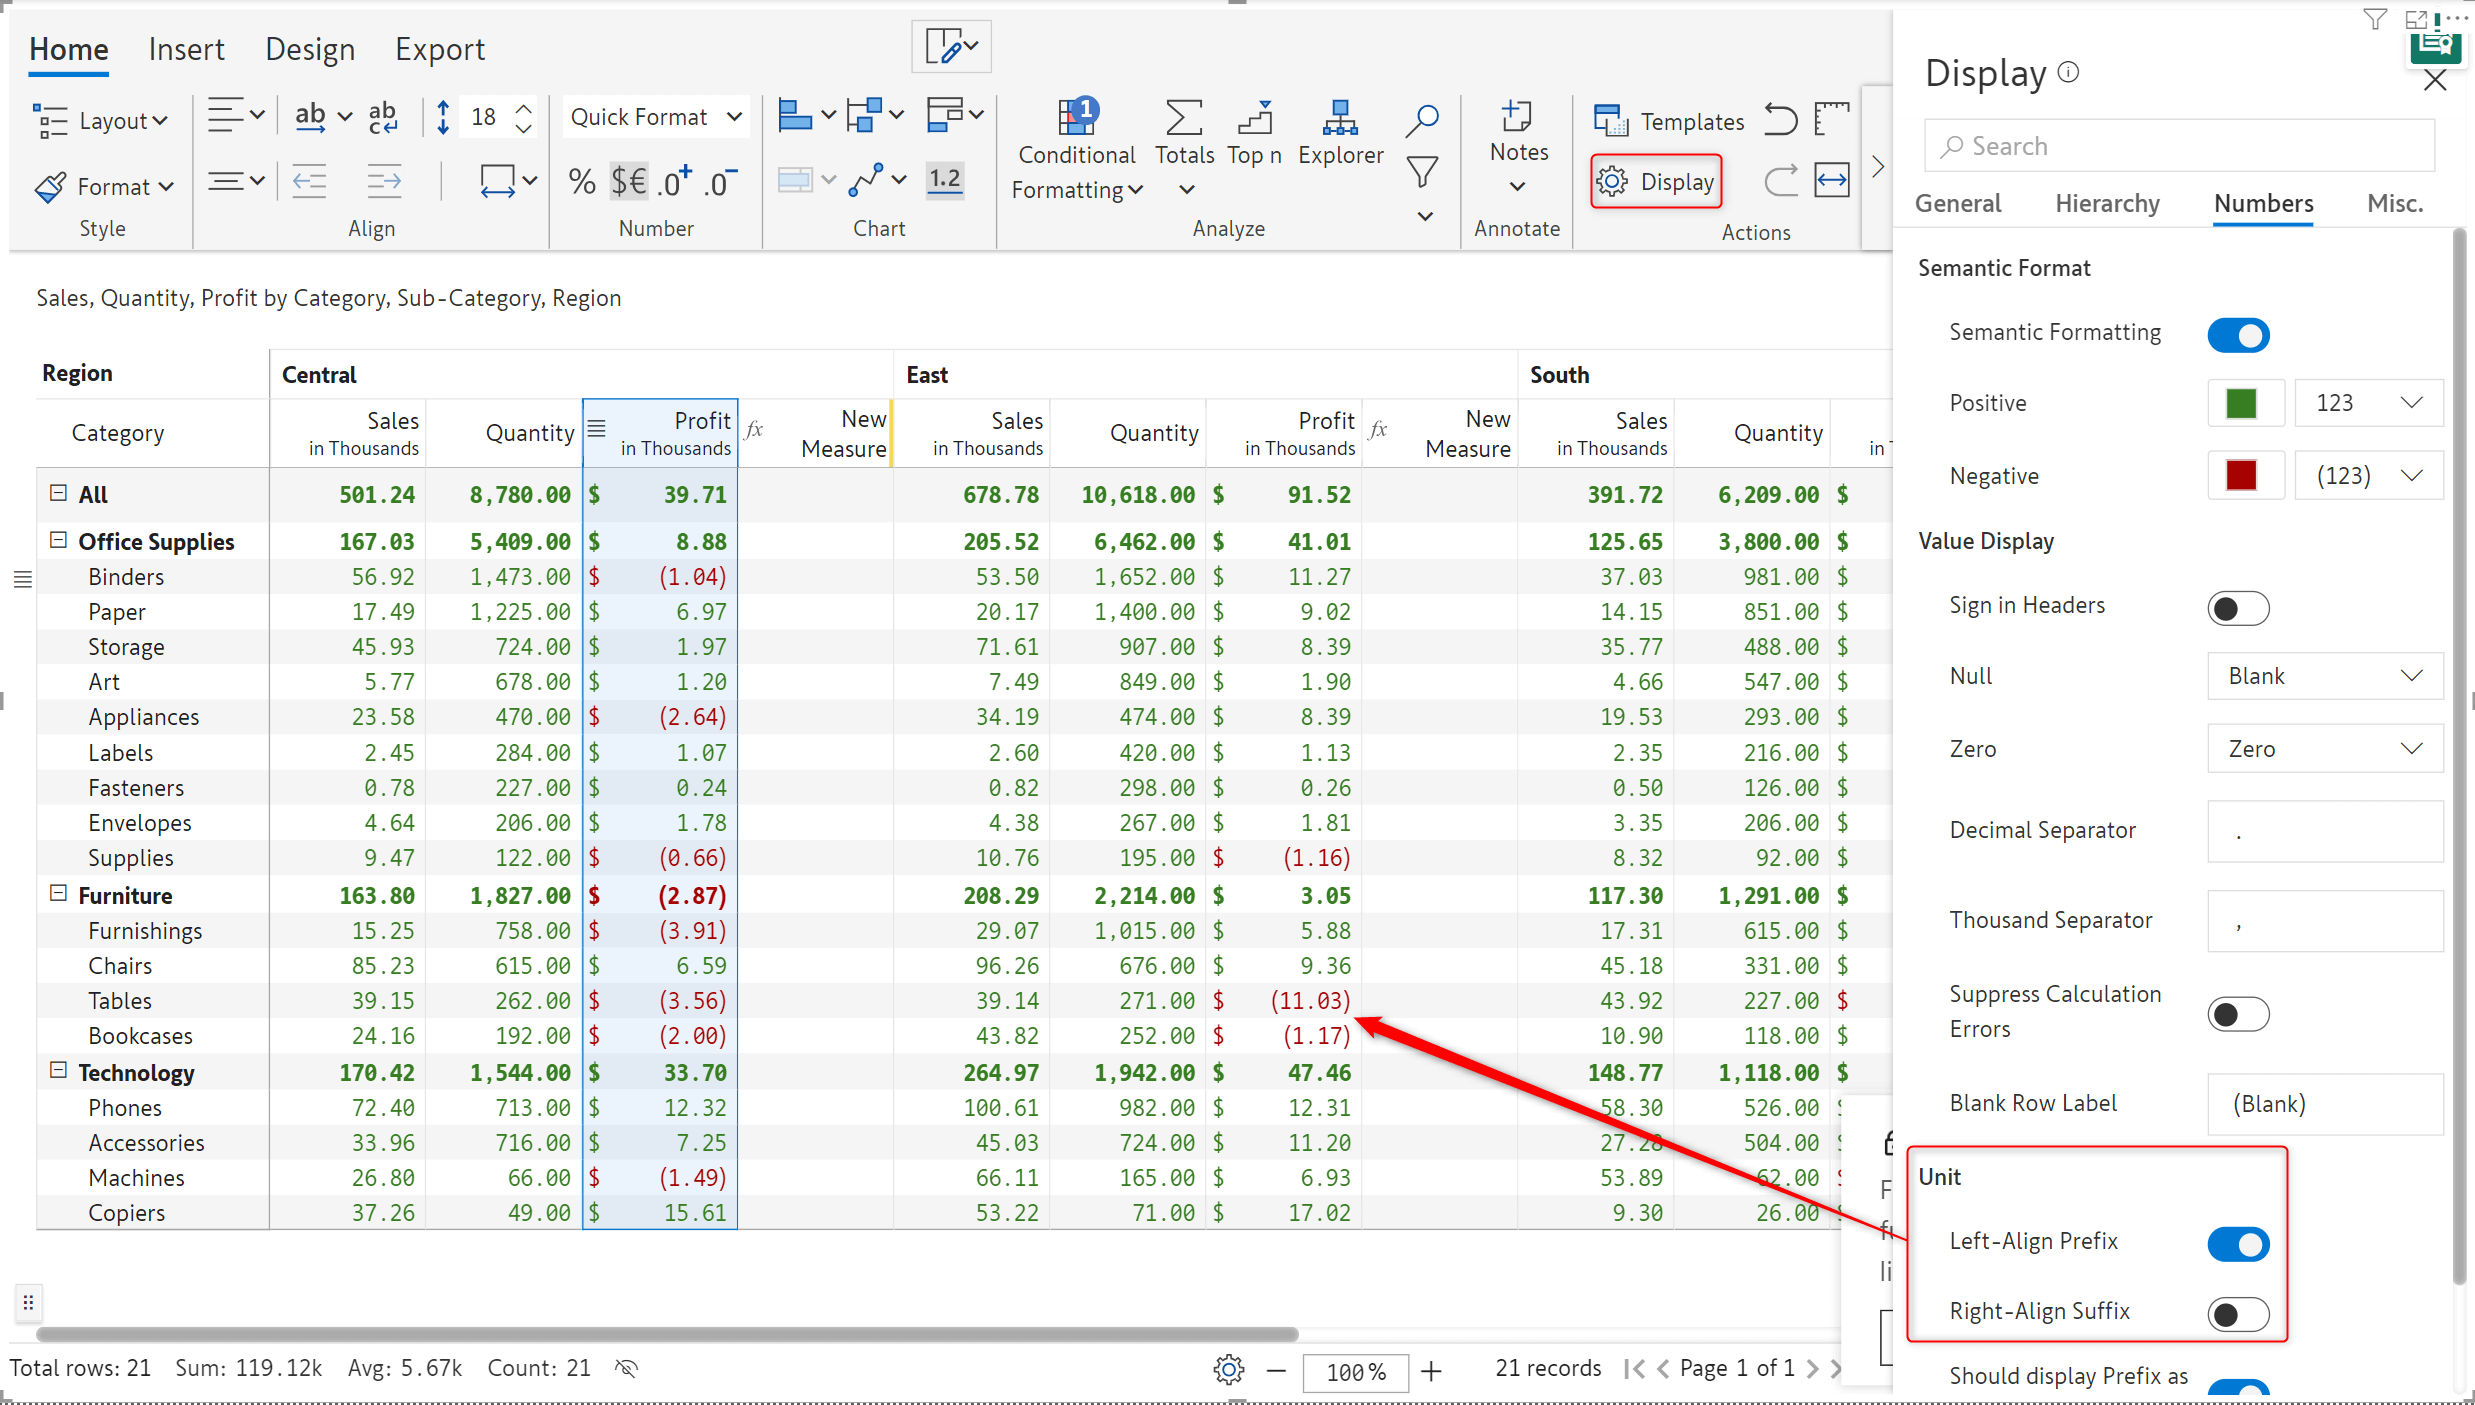
If your reports use semantic formatting, a new option has been added to display the suffix and prefix for negative measures, outside the parentheses.
In the example below, the ‘$’ symbol is displayed outside the parentheses as the Left-Align Prefix option is enabled. This provides additional formatting flexibility when building financial reports and statements within Power BI.
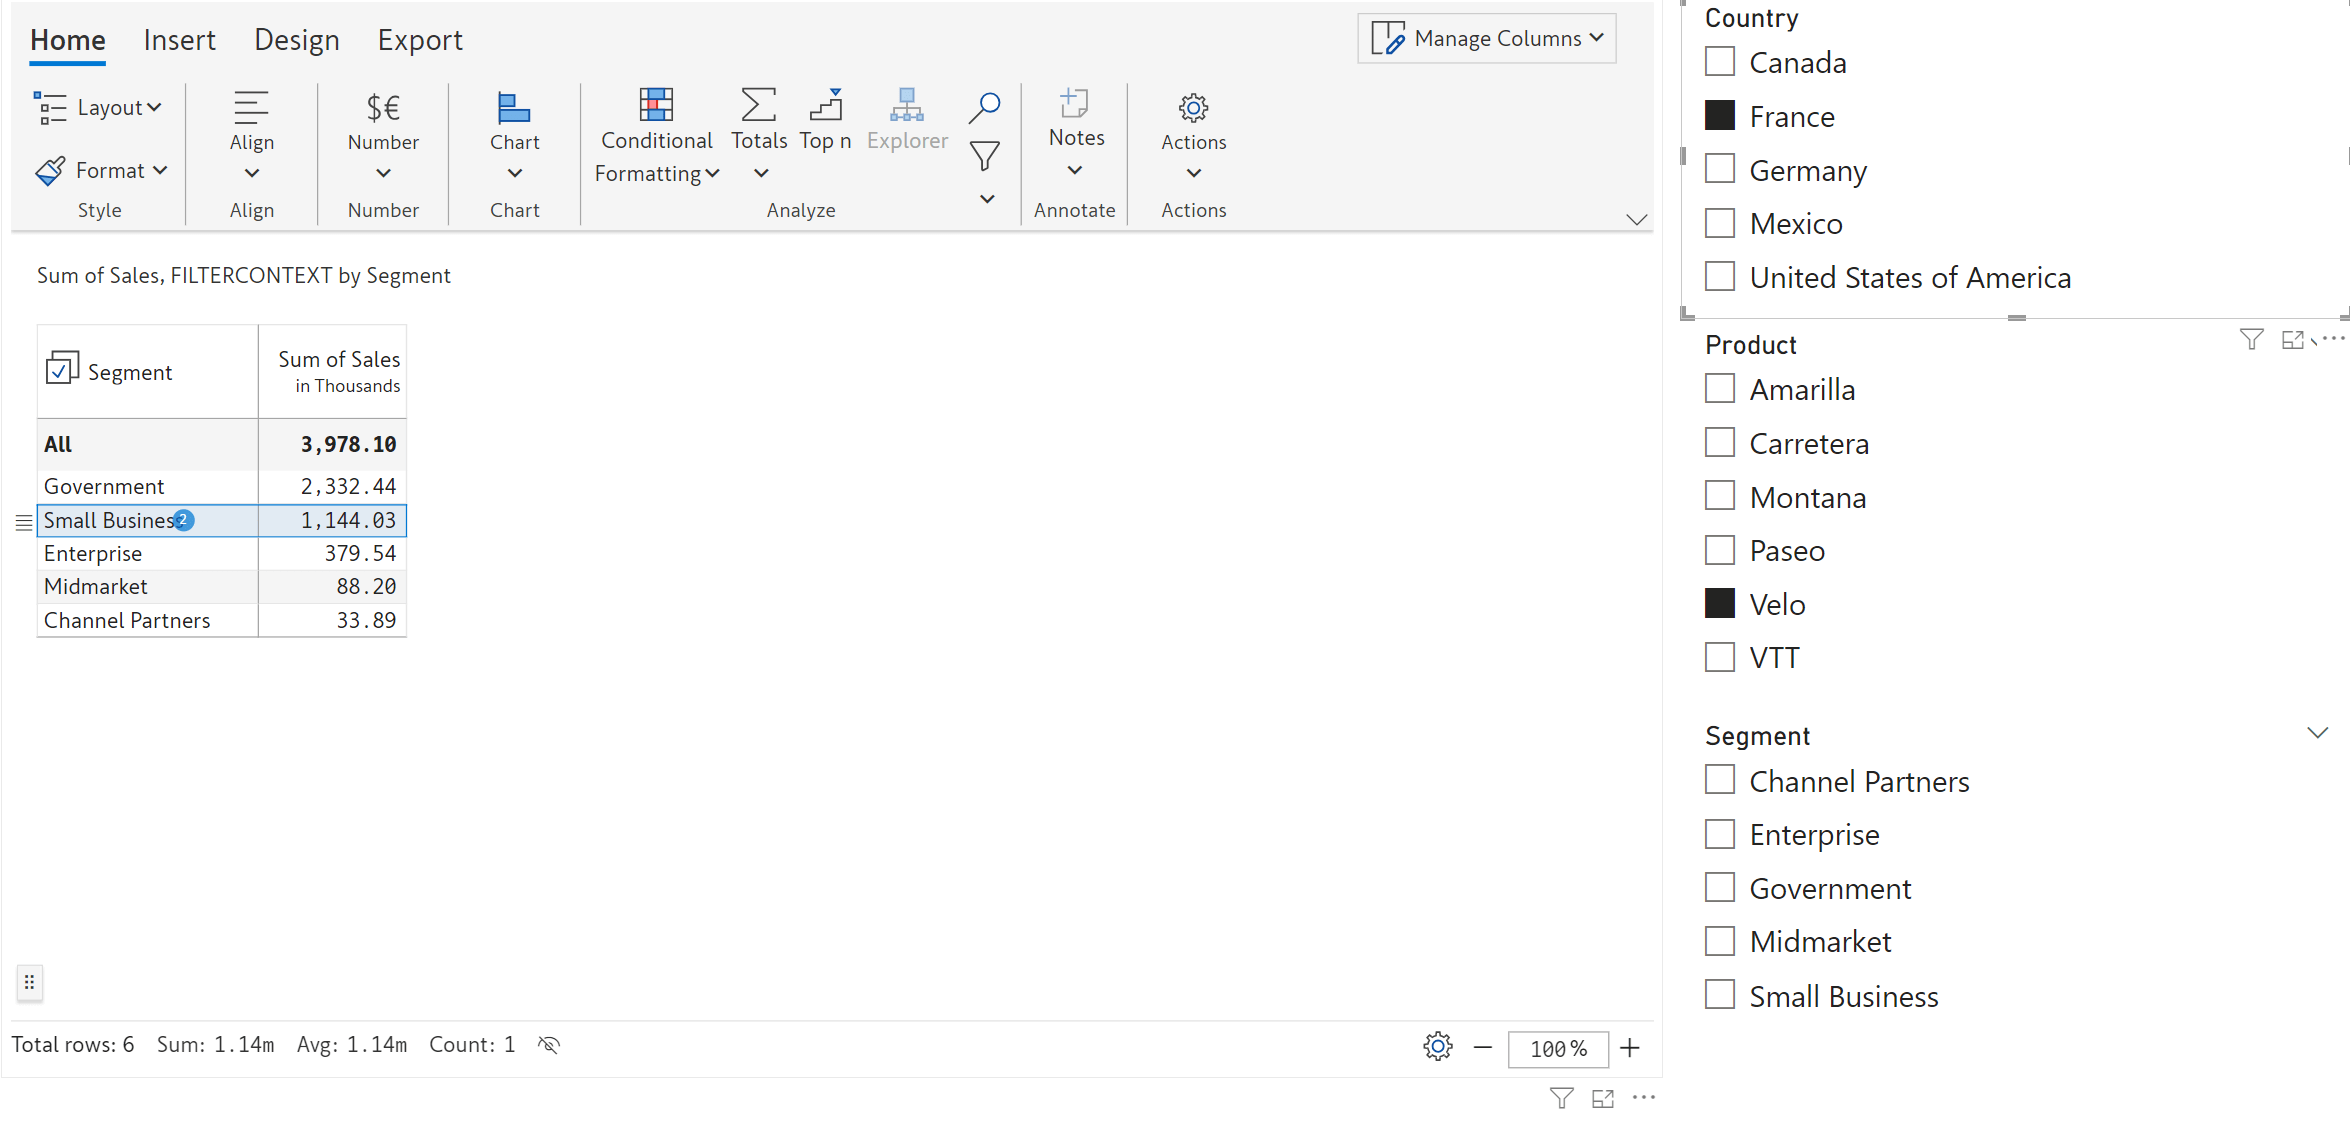
2.3. Filter/Slicer Context to make your notes and comments dynamic
Inforiver notes are now responsive to context changes using filters/slicers! Learn more about Inforiver’s filter context feature.
To use this feature, navigate to the Miscellaneous tab in Display settings and click on the Configure link against ‘Filter Context Measure’.
It is a straightforward no-code approach – input the category and table name required for the filter; create a new Measure using the DAX code that is auto-generated by Inforiver.
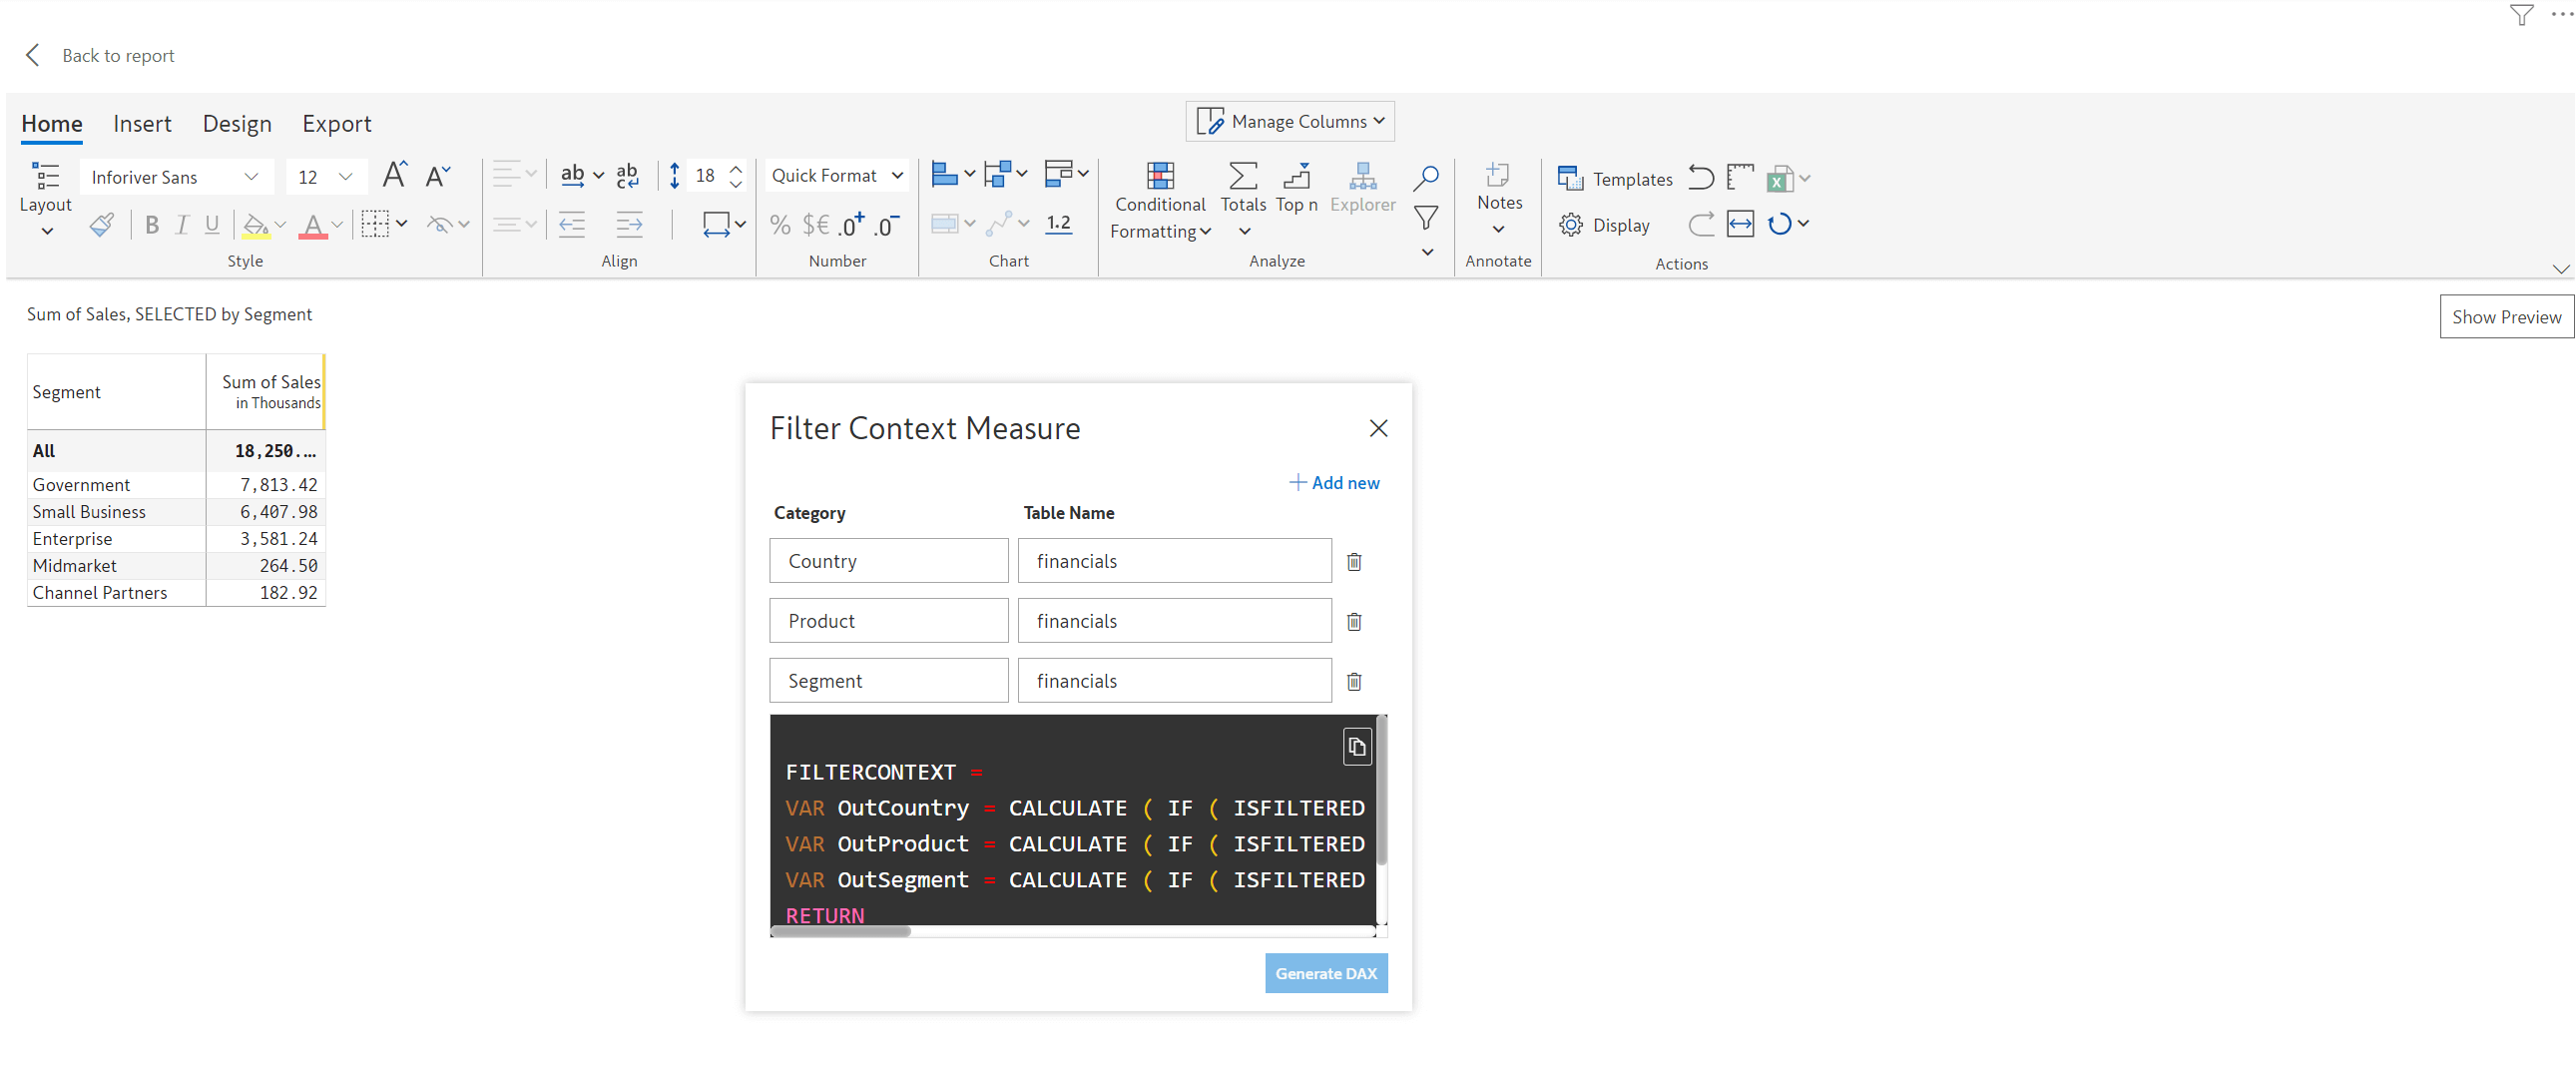
Once the new measure is added as a visual parameter, you will be able to select the category from the filter context dropdown.
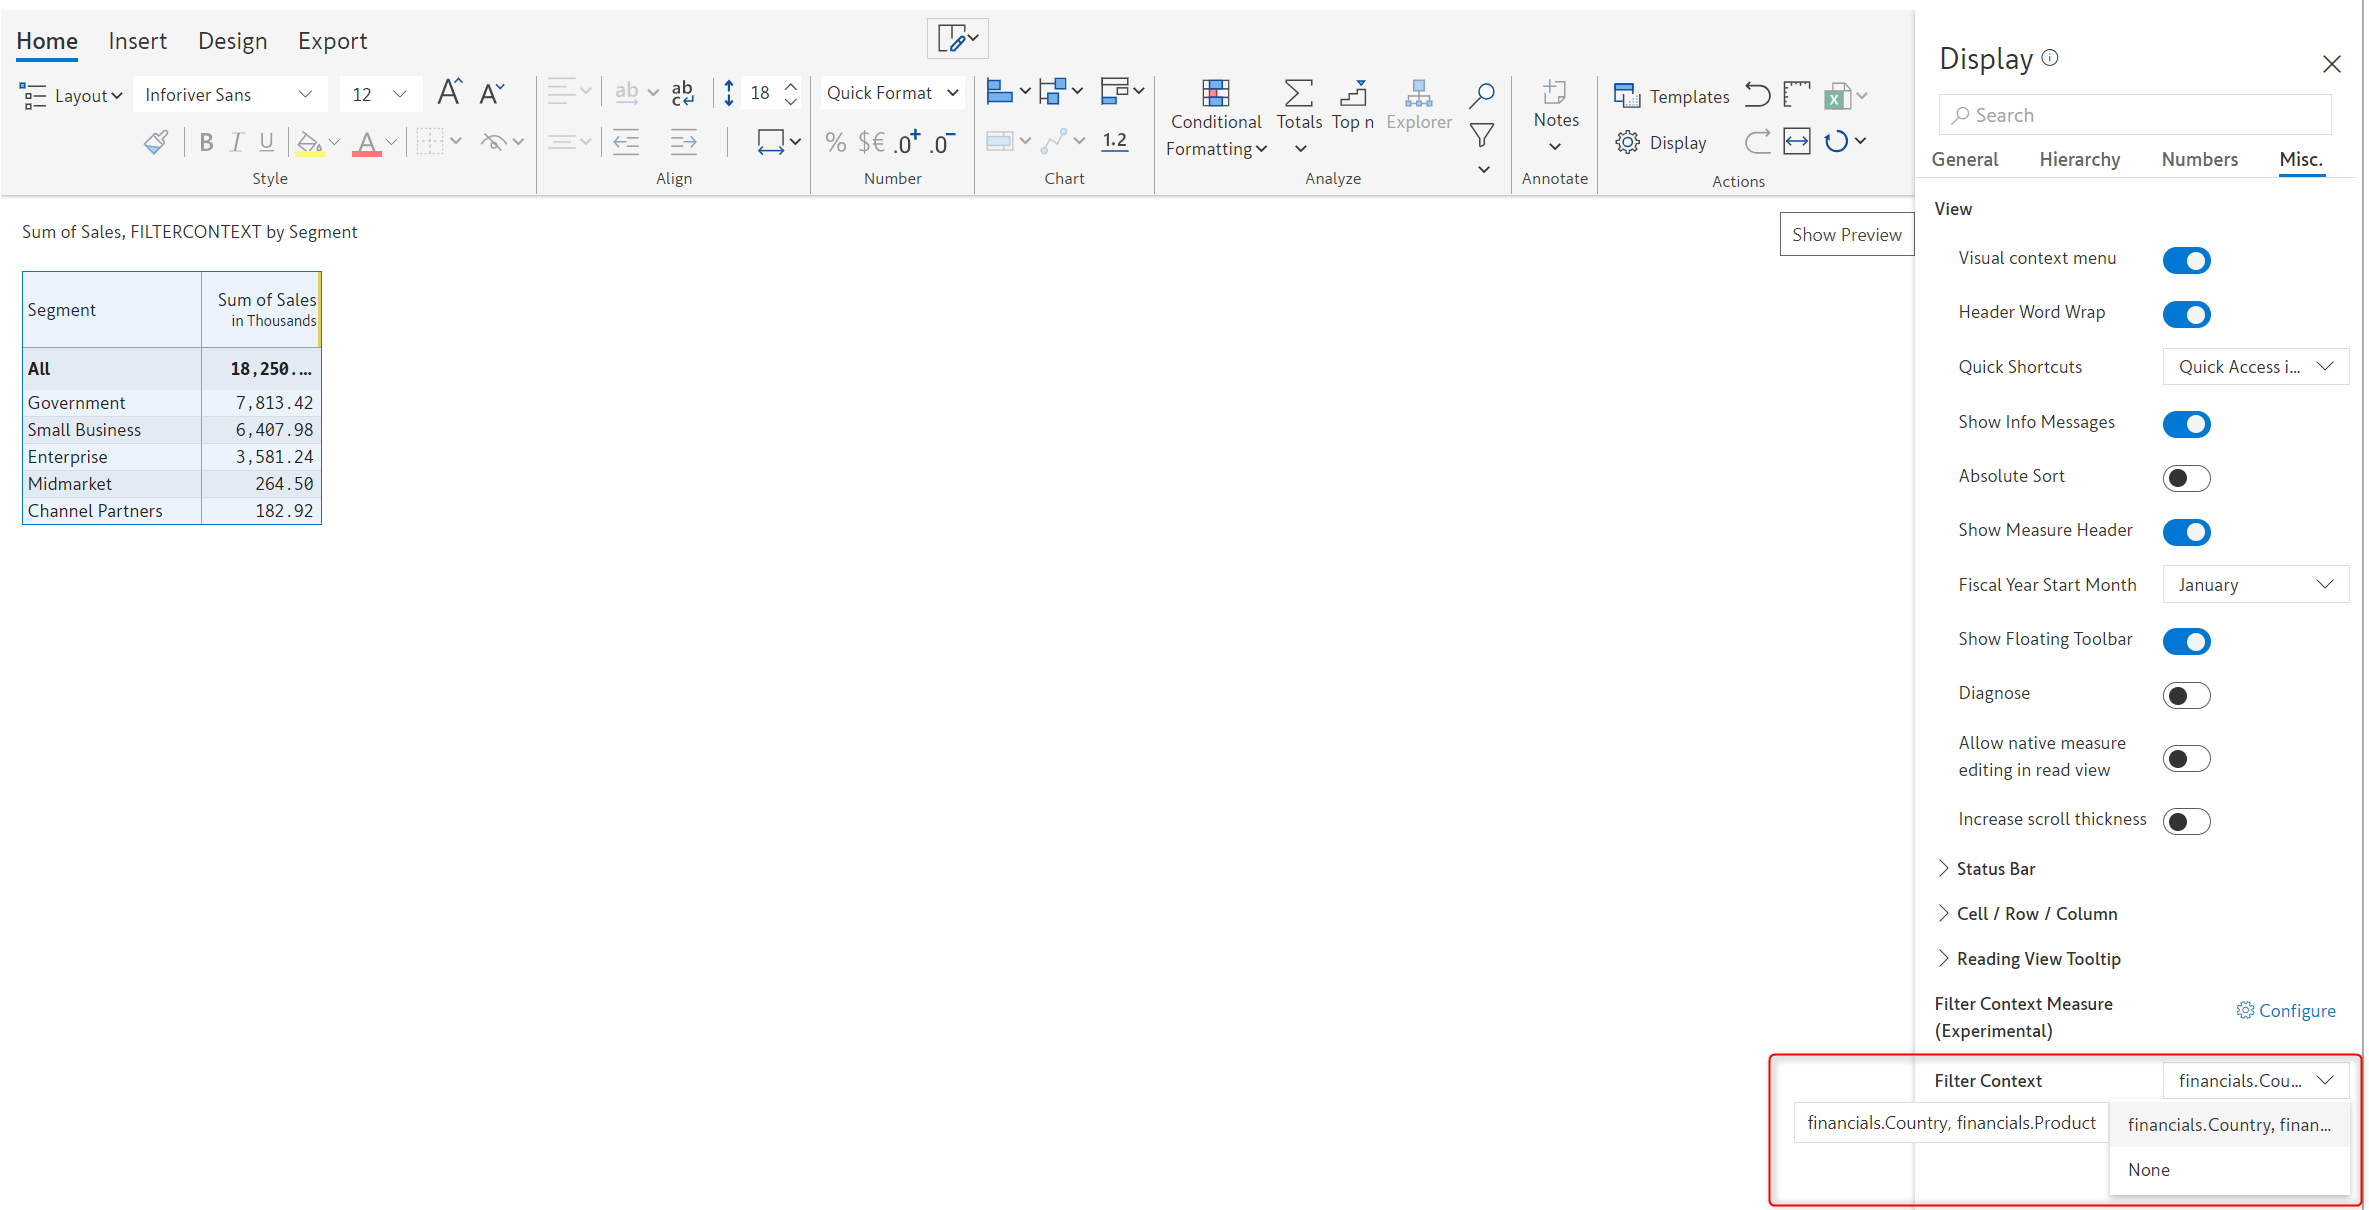
After completing the initial setup - the notes added will get updated dynamically based on the filter selection.
This feature is released as a Beta with this 2.5 release so that customers can evaluate and provide feedback on improving the Generated DAX to cover any edge cases that might exist, as this is a new approach for handling filter/slicer context for the entire Power BI ecosystem.
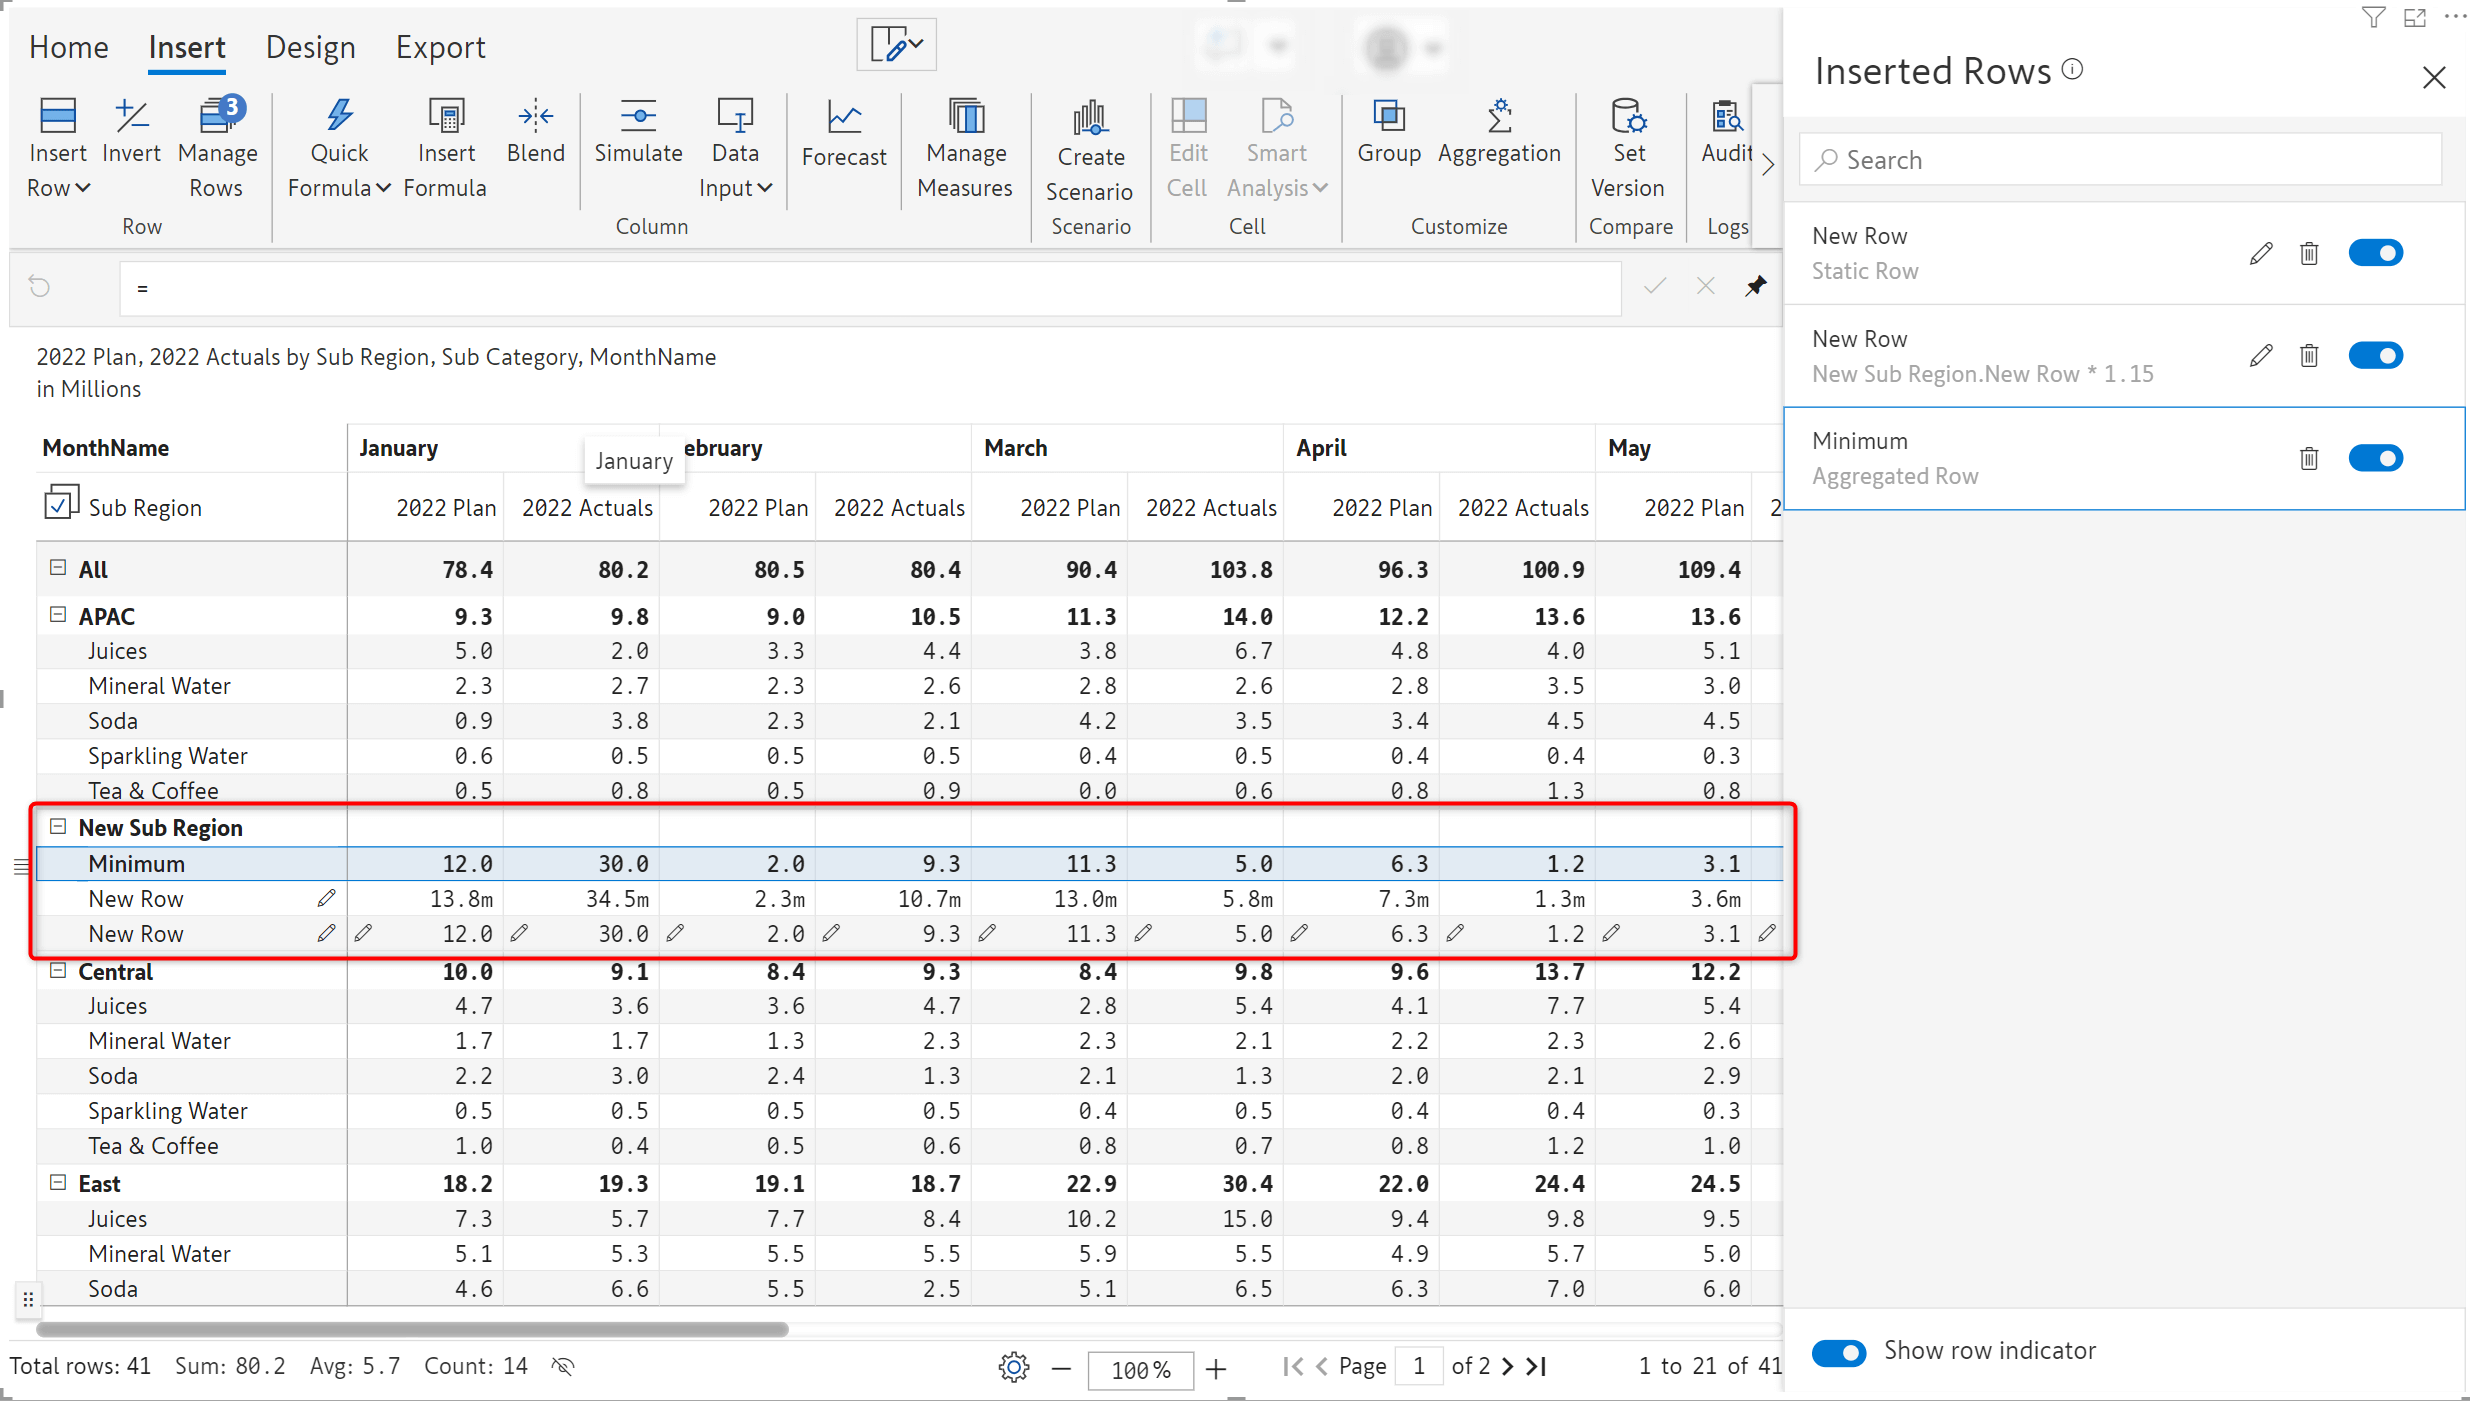
3.1. Custom row hierarchy
Inforiver 2.5. is bundled with additional features to manage your hierarchical data. You can use the Row Hierarchy option to seamlessly add user-defined levels in your hierarchy e.g., if there is a new product variant that is not available in the dataset or a new employee whose details need to be inserted in the management hierarchy of the organization.
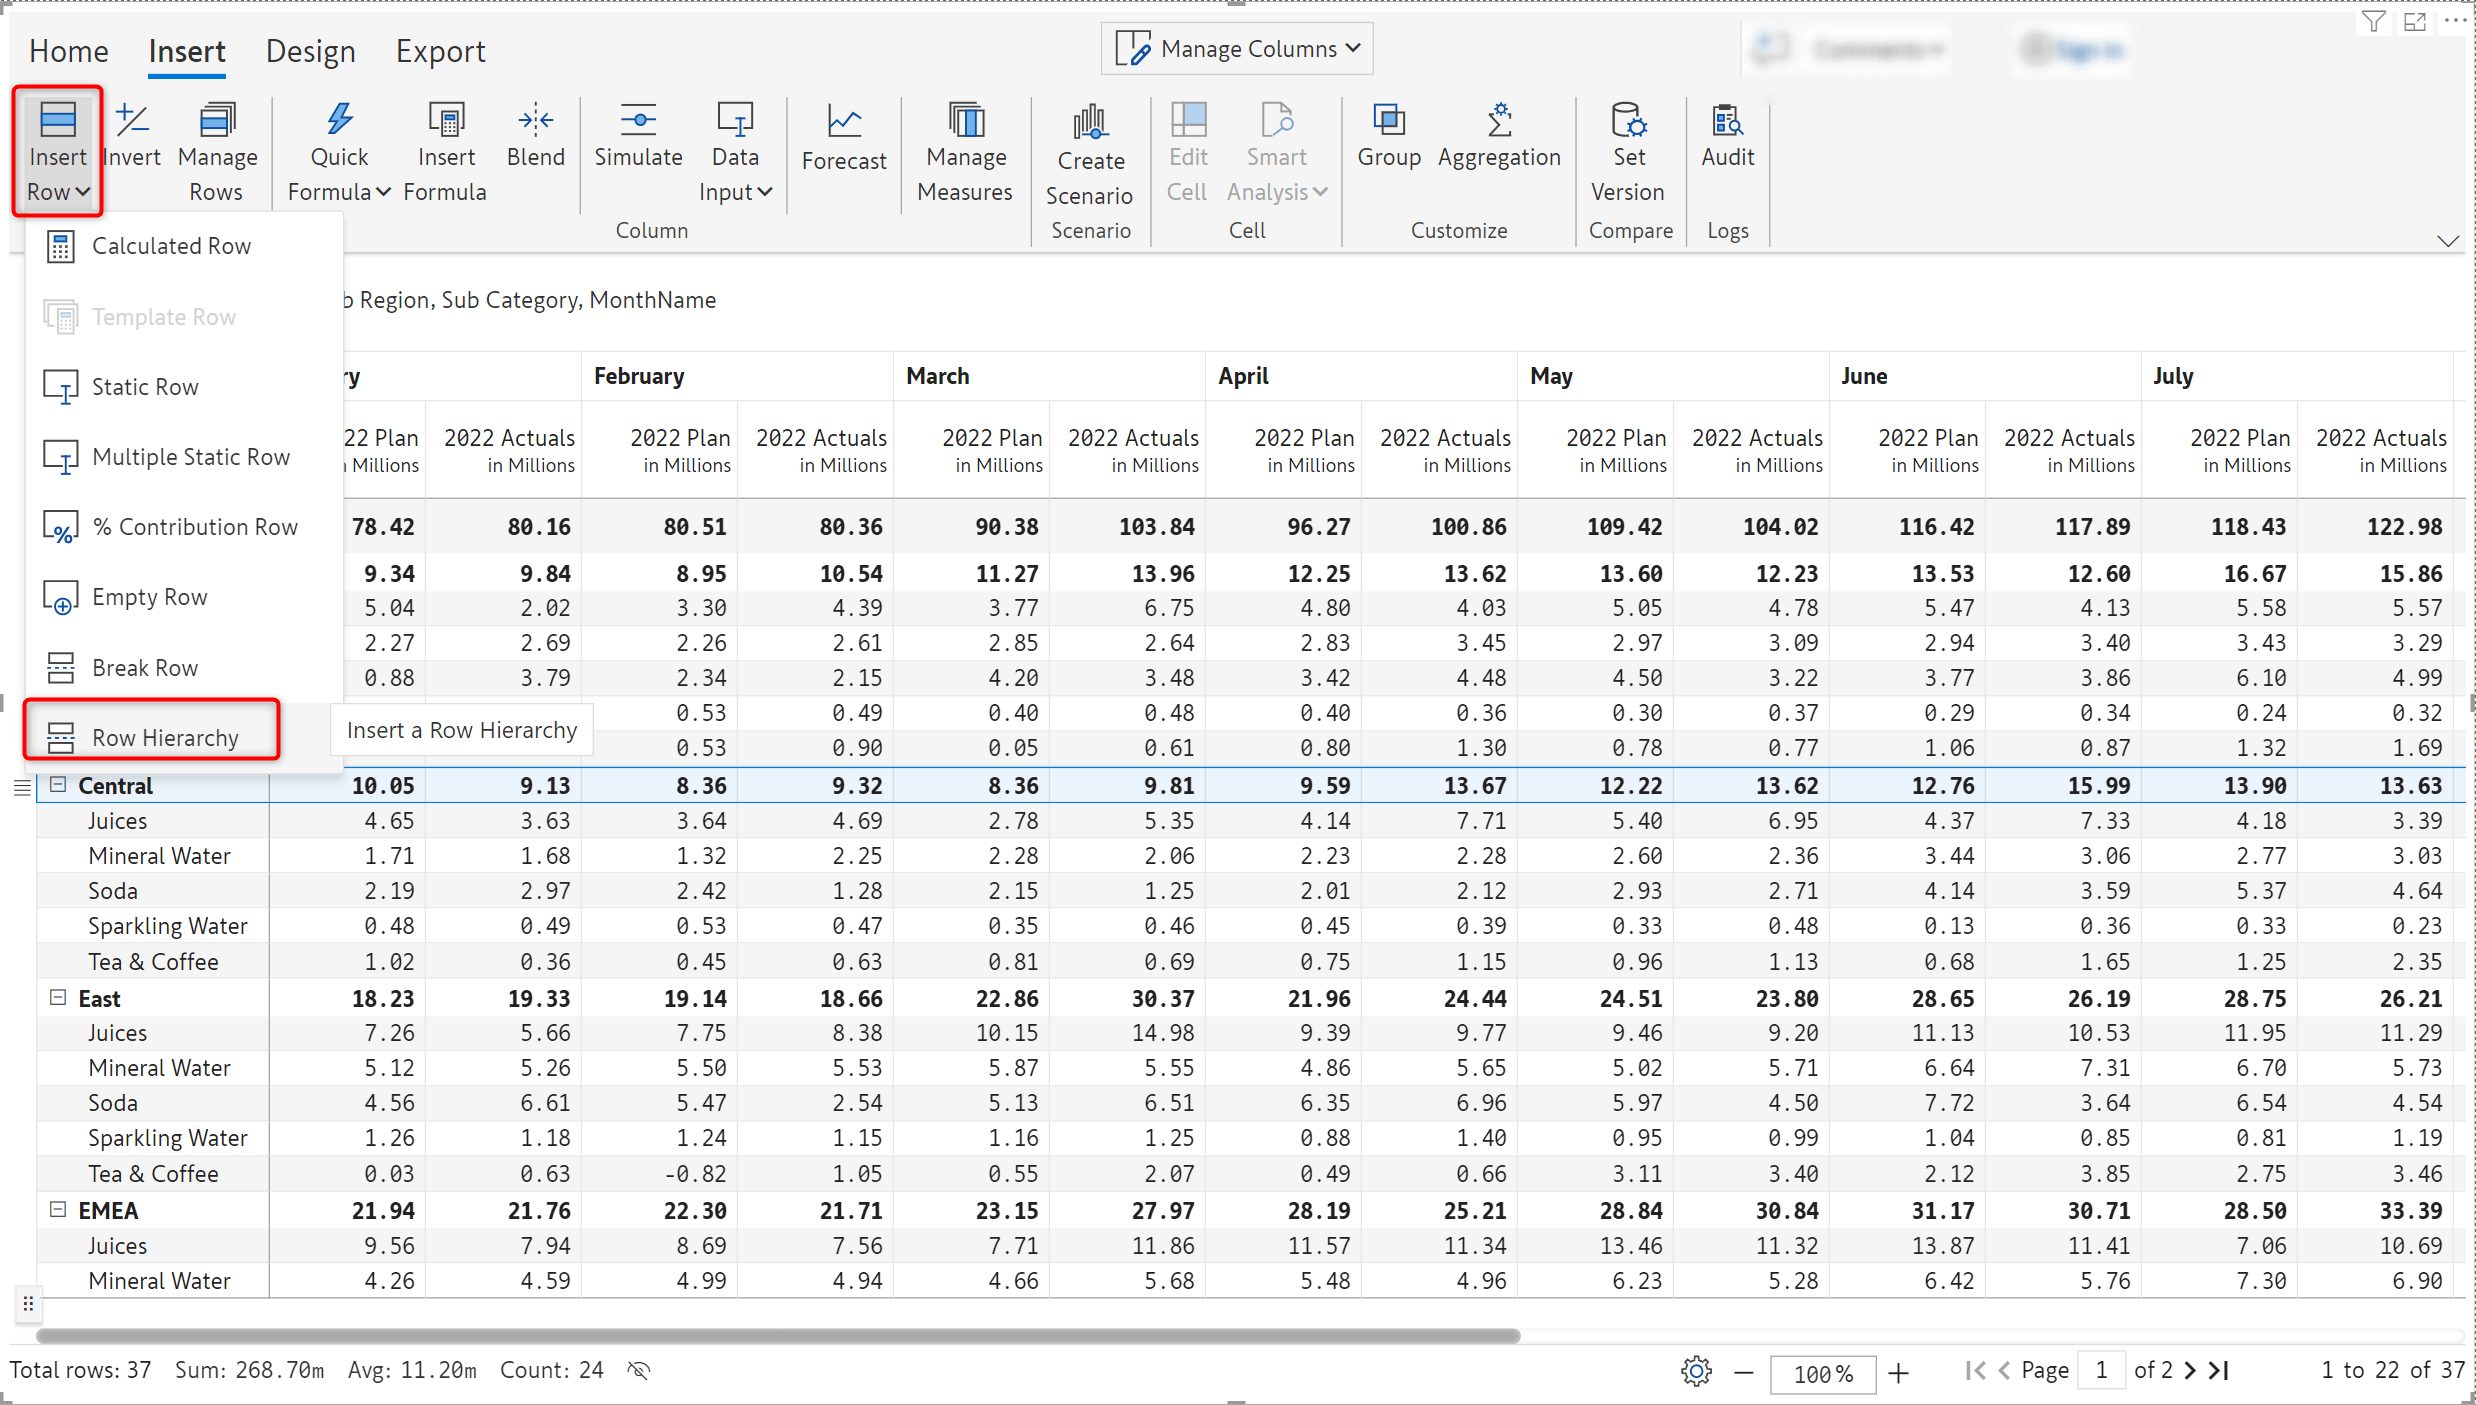
Hierarchy levels that are created using this option can contain static rows, calculated rows, aggregated rows etc as demonstrated in the example below.
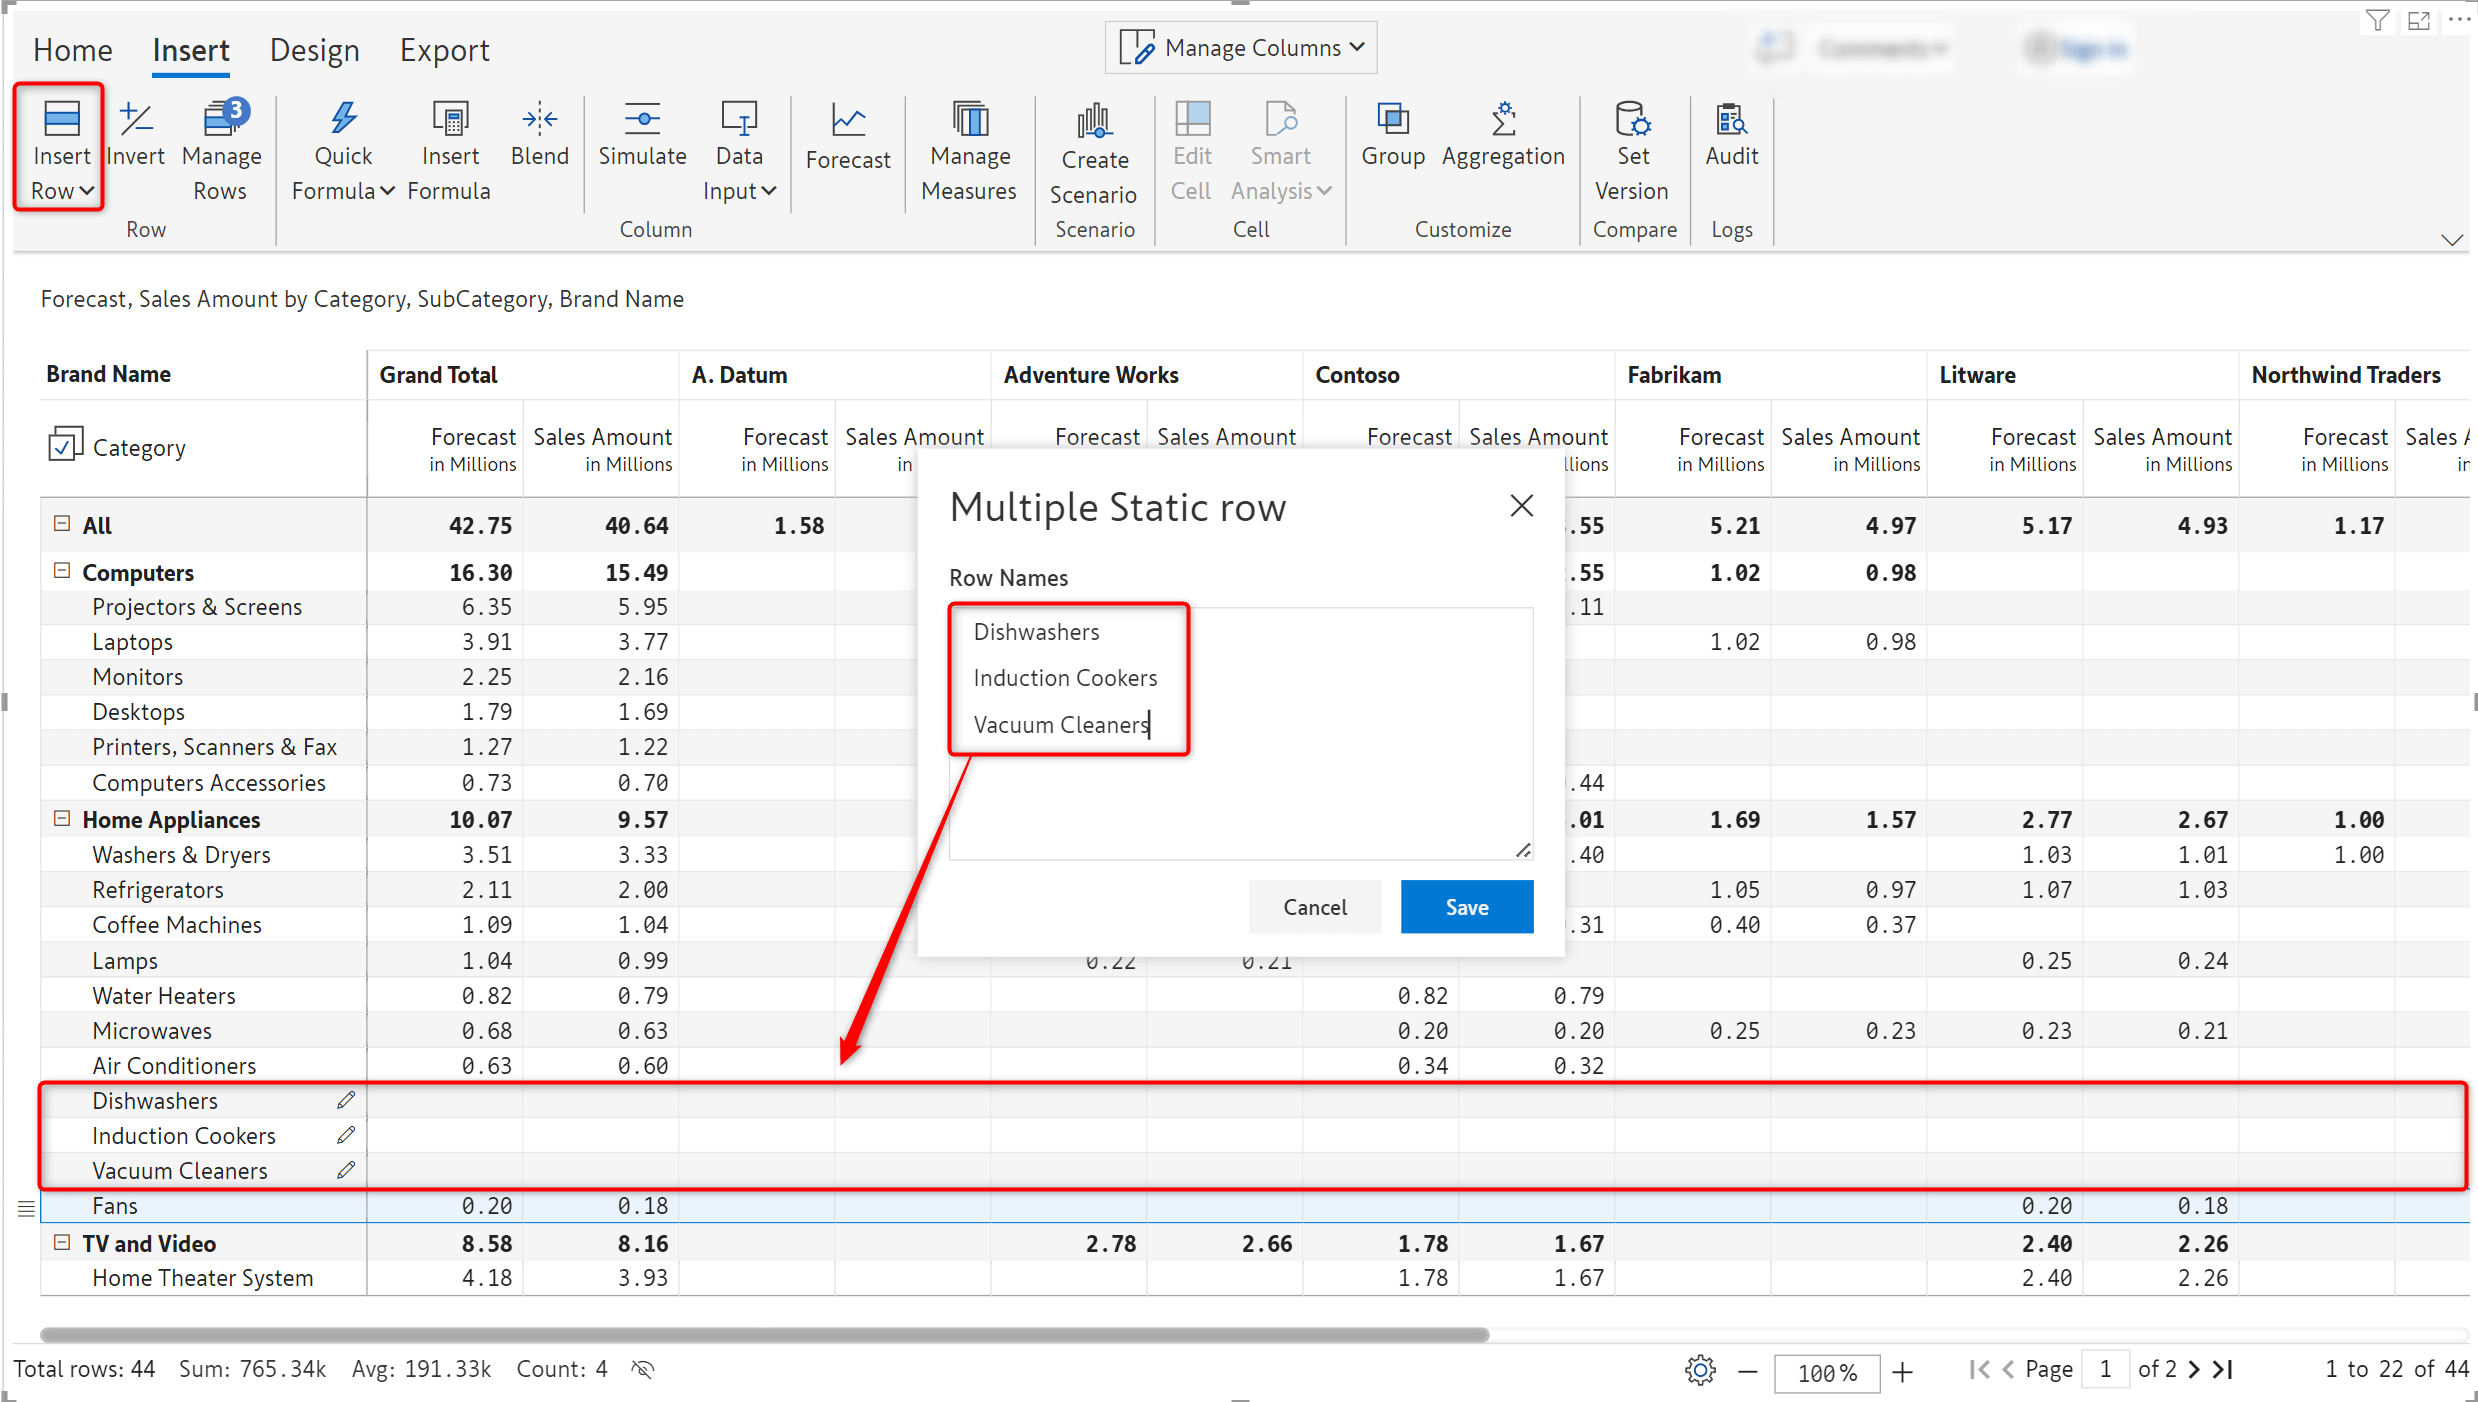
3.2. Static rows bulk insert
You can leverage the Multiple Static Row option to bulk insert multiple categorical rows in a single stroke with copy and paste to enable easy data input in those rows
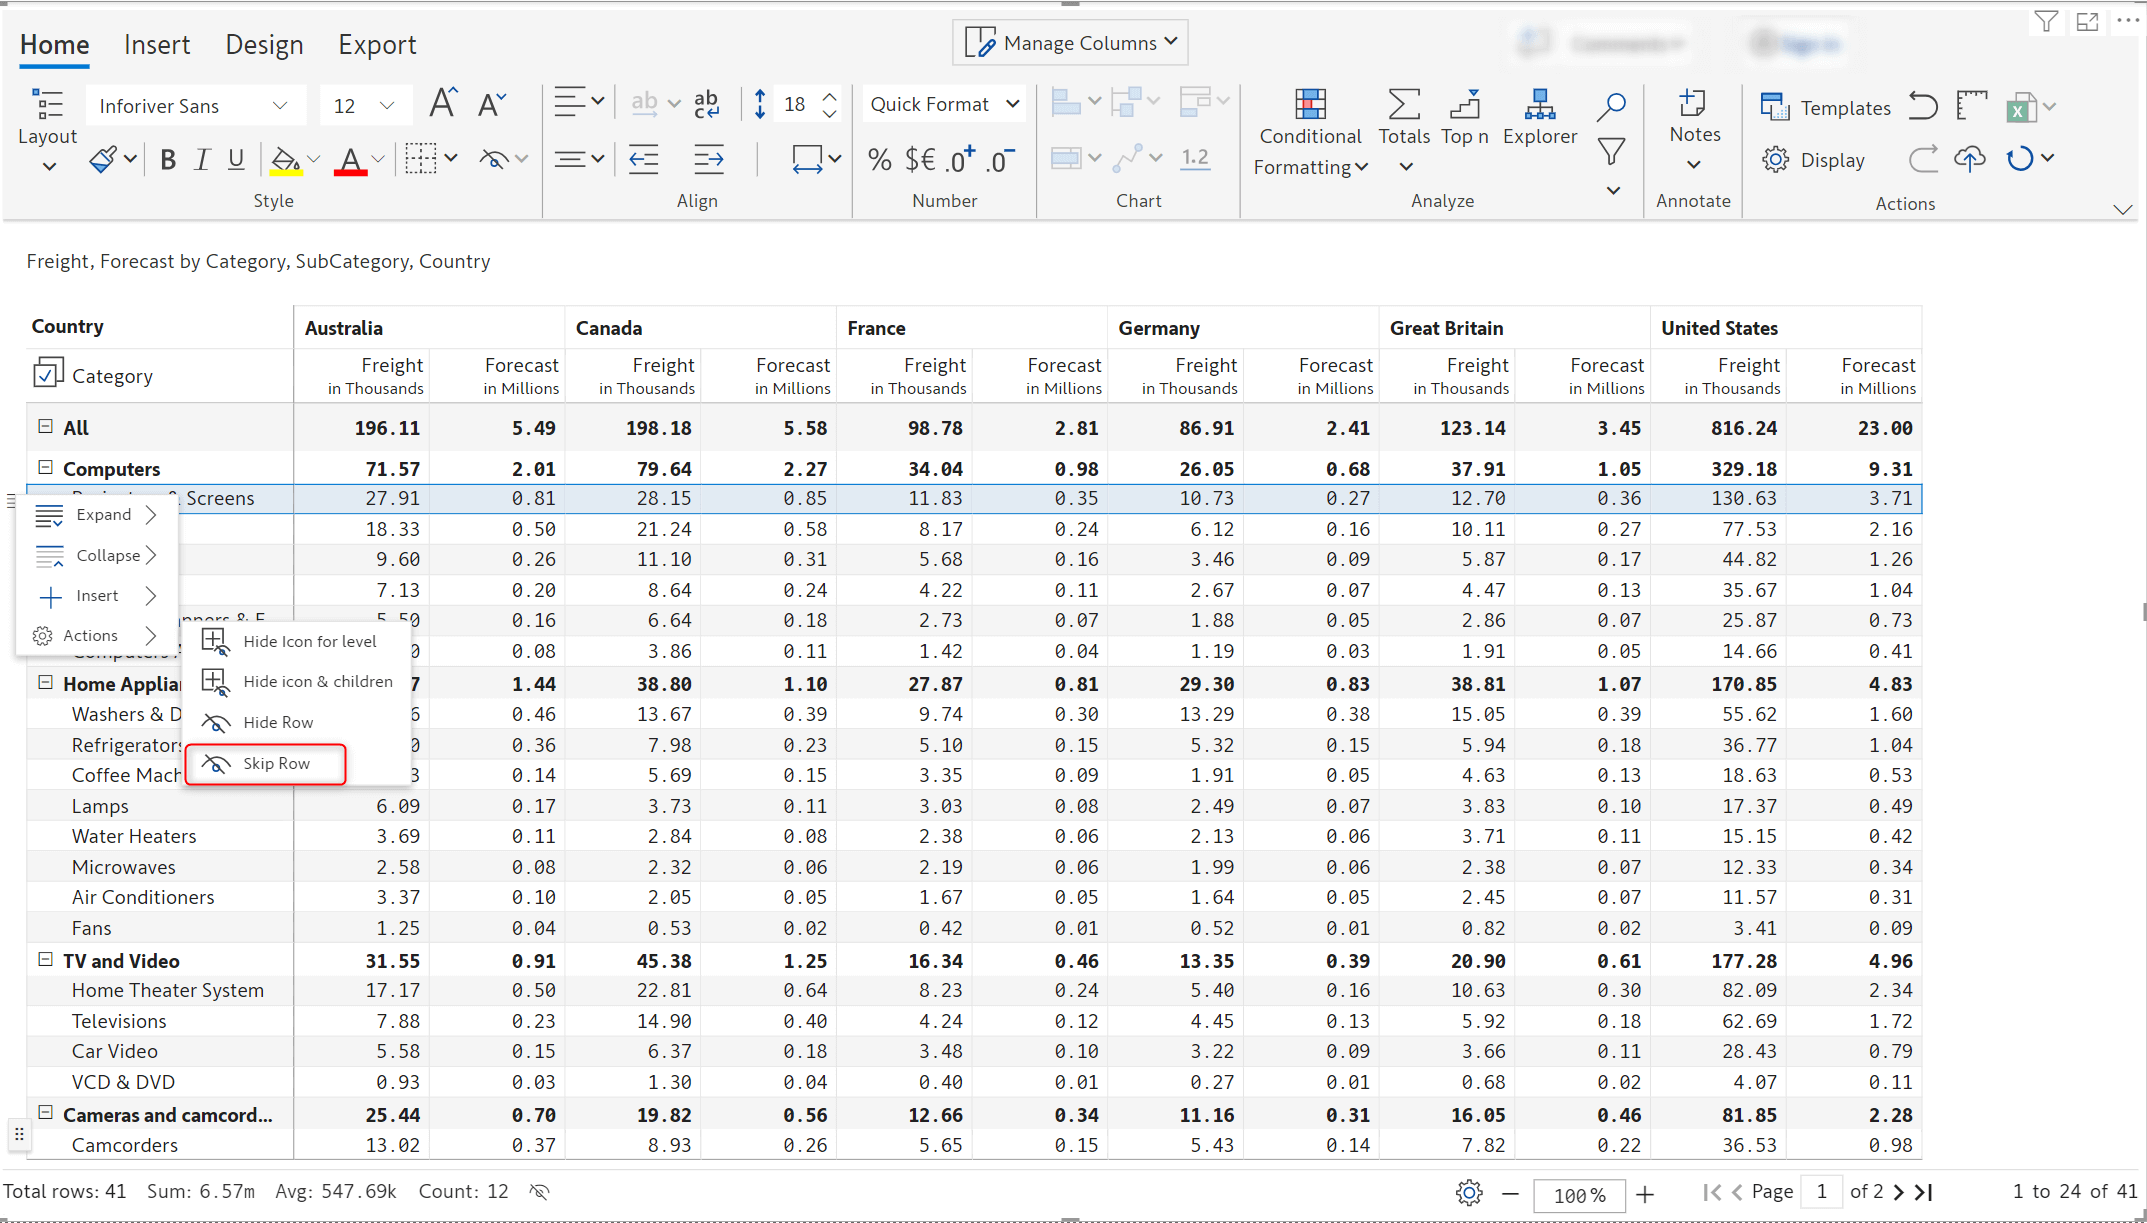
3.3. Skip row
The Skip row option has been added to the row gripper in 2.5. – this feature effectively performs a soft delete. The row is hidden in the report and removed from all calculations as well. You can choose to expose specific parts of the underlying data to the users, this feature can be used to remove selected rows from the report and from aggregations as well.
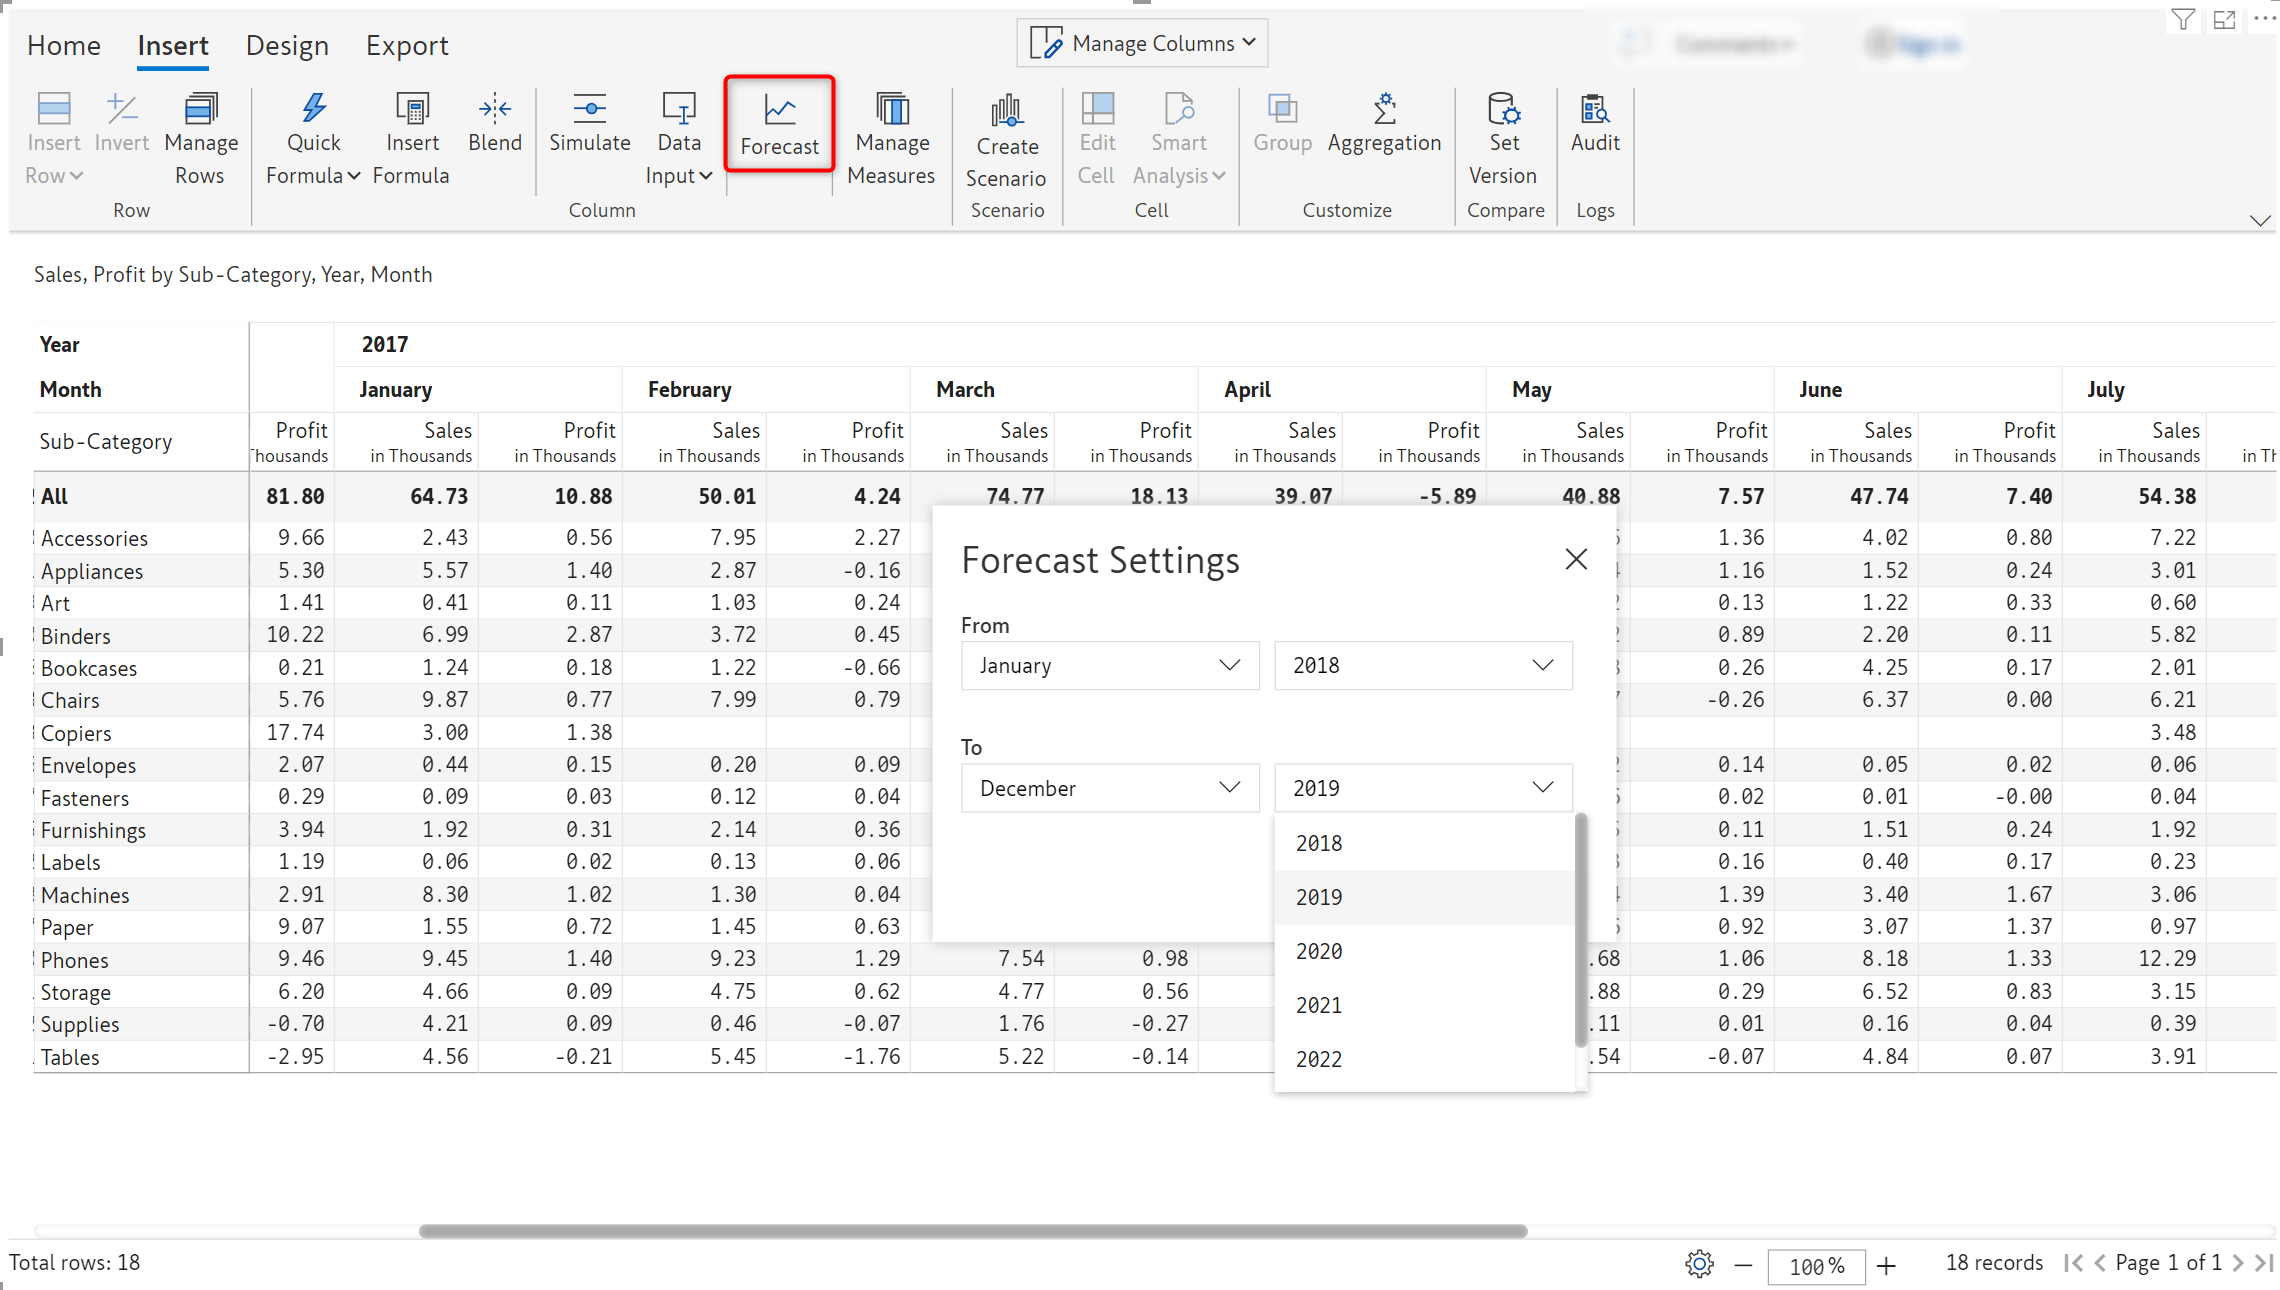
4.1. Data driven forecasts
With Inforiver 2.5, the forecast period will be driven by the time frame available in the dataset, rather than current year and month. Inforiver’s powerful forecast feature can be used to easily create rolling forecasts. Learn more about creating rolling forecasts.
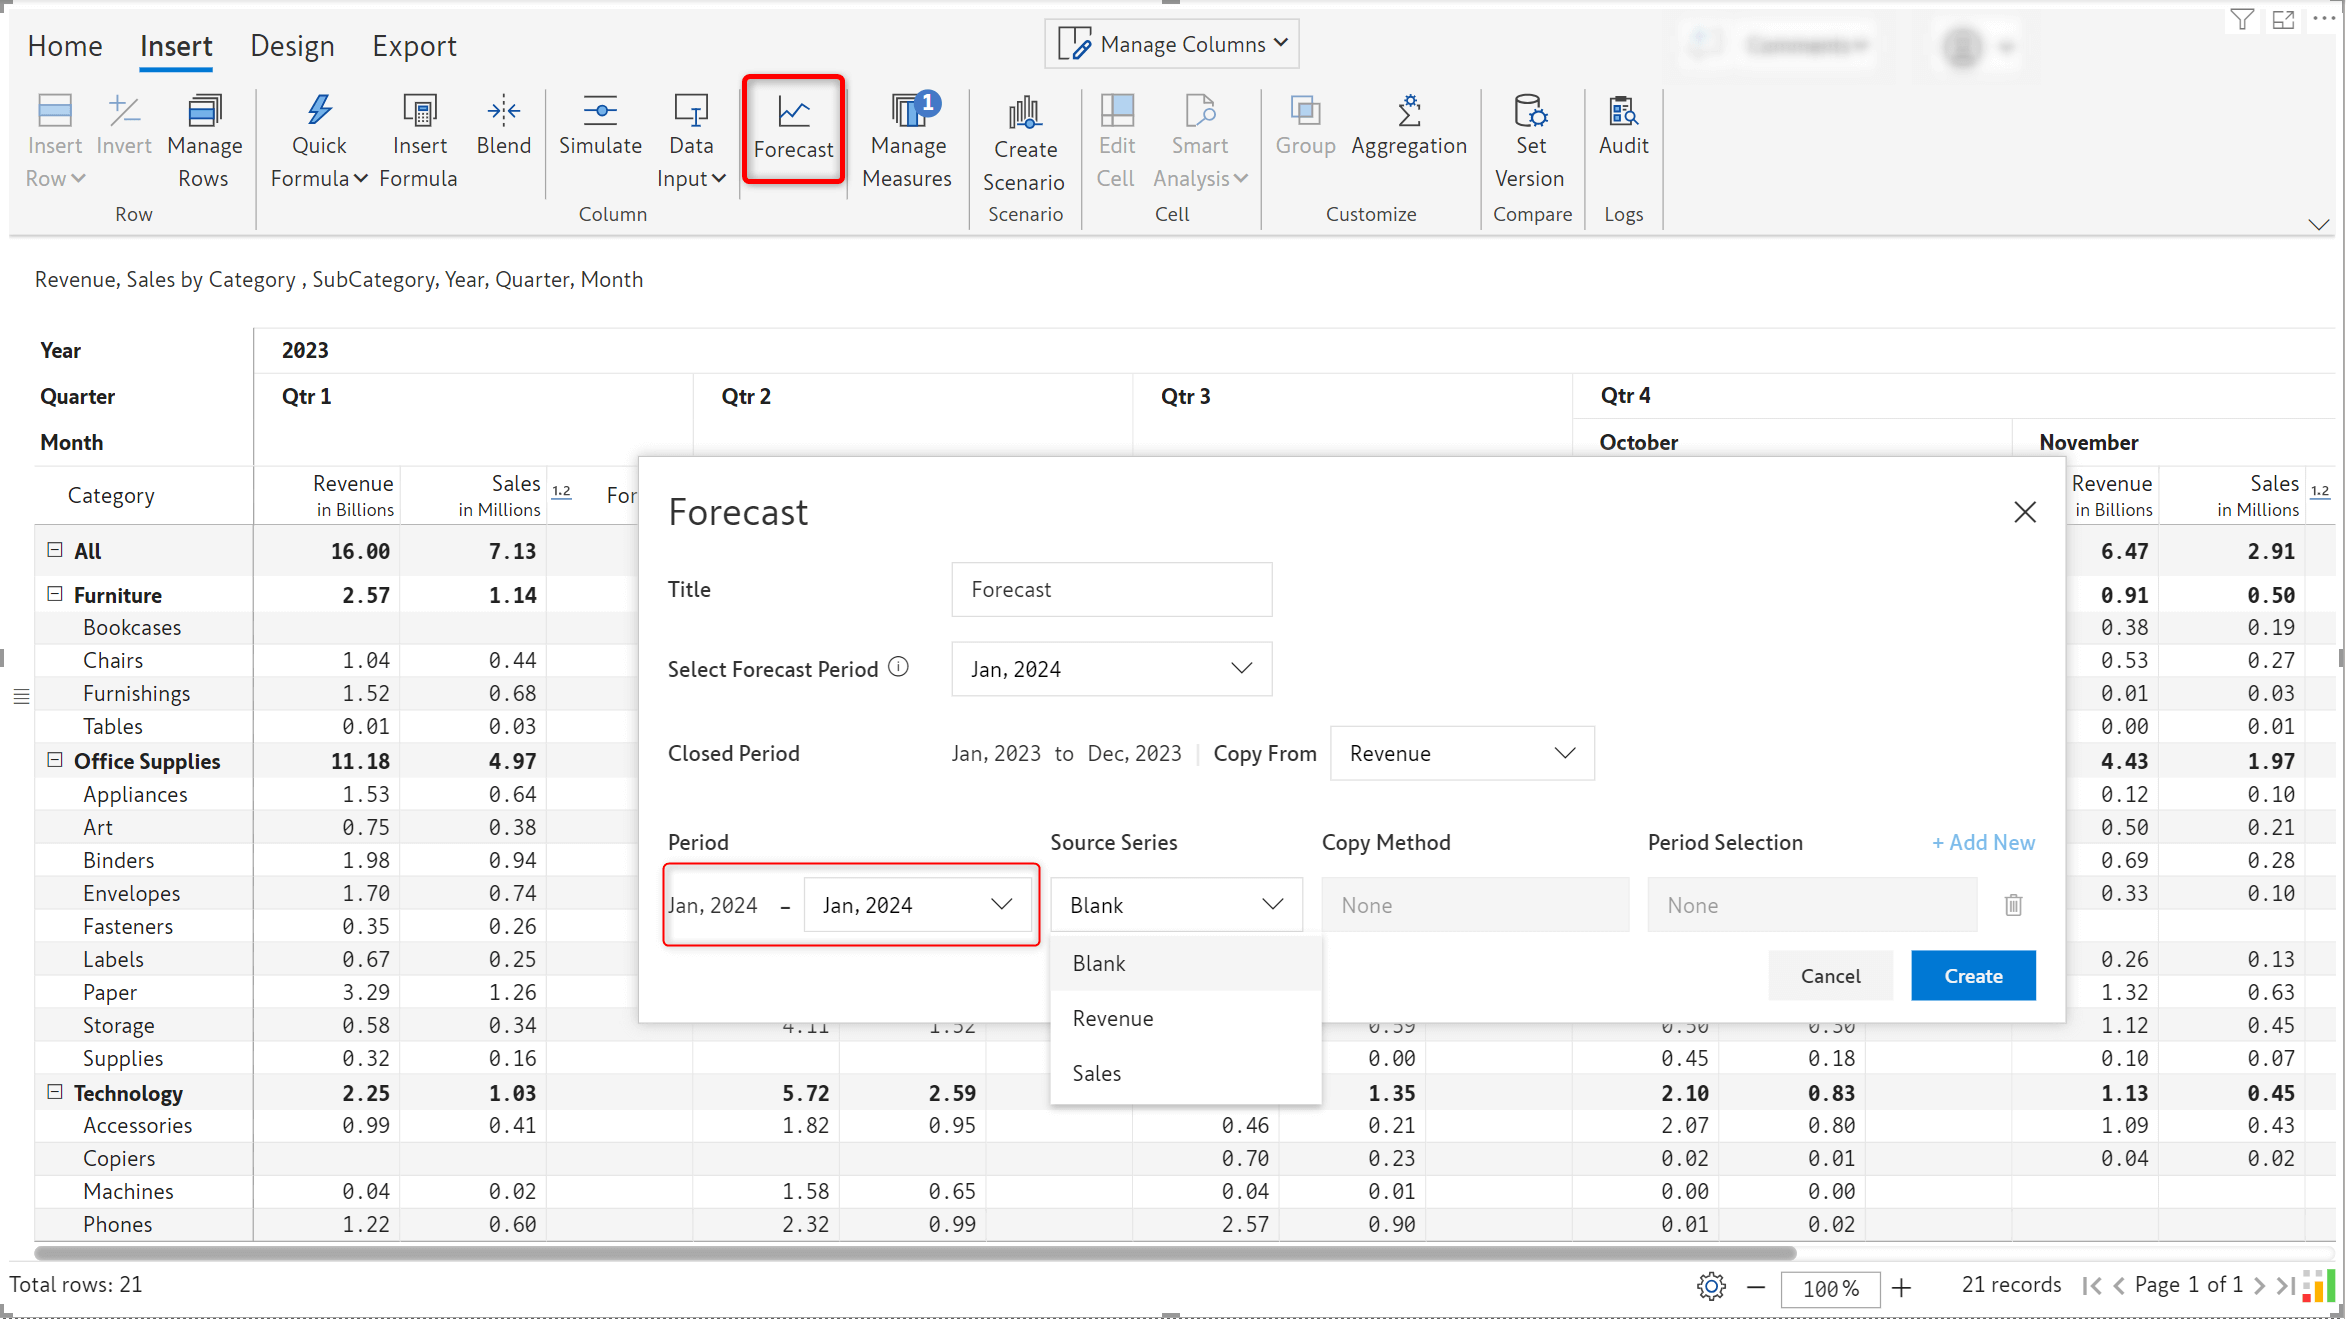
4.2. Month-wise forecasts
Inforiver 2.5 offers the capability to generate month-wise forecasts as well i.e., forecast for one month at a time rather than for extended periods. In situations where the data is unpredictable and influenced by external factors, this option can be used for more accurate, short-term forecasts.
4.3. Aggregation for forecast grand total
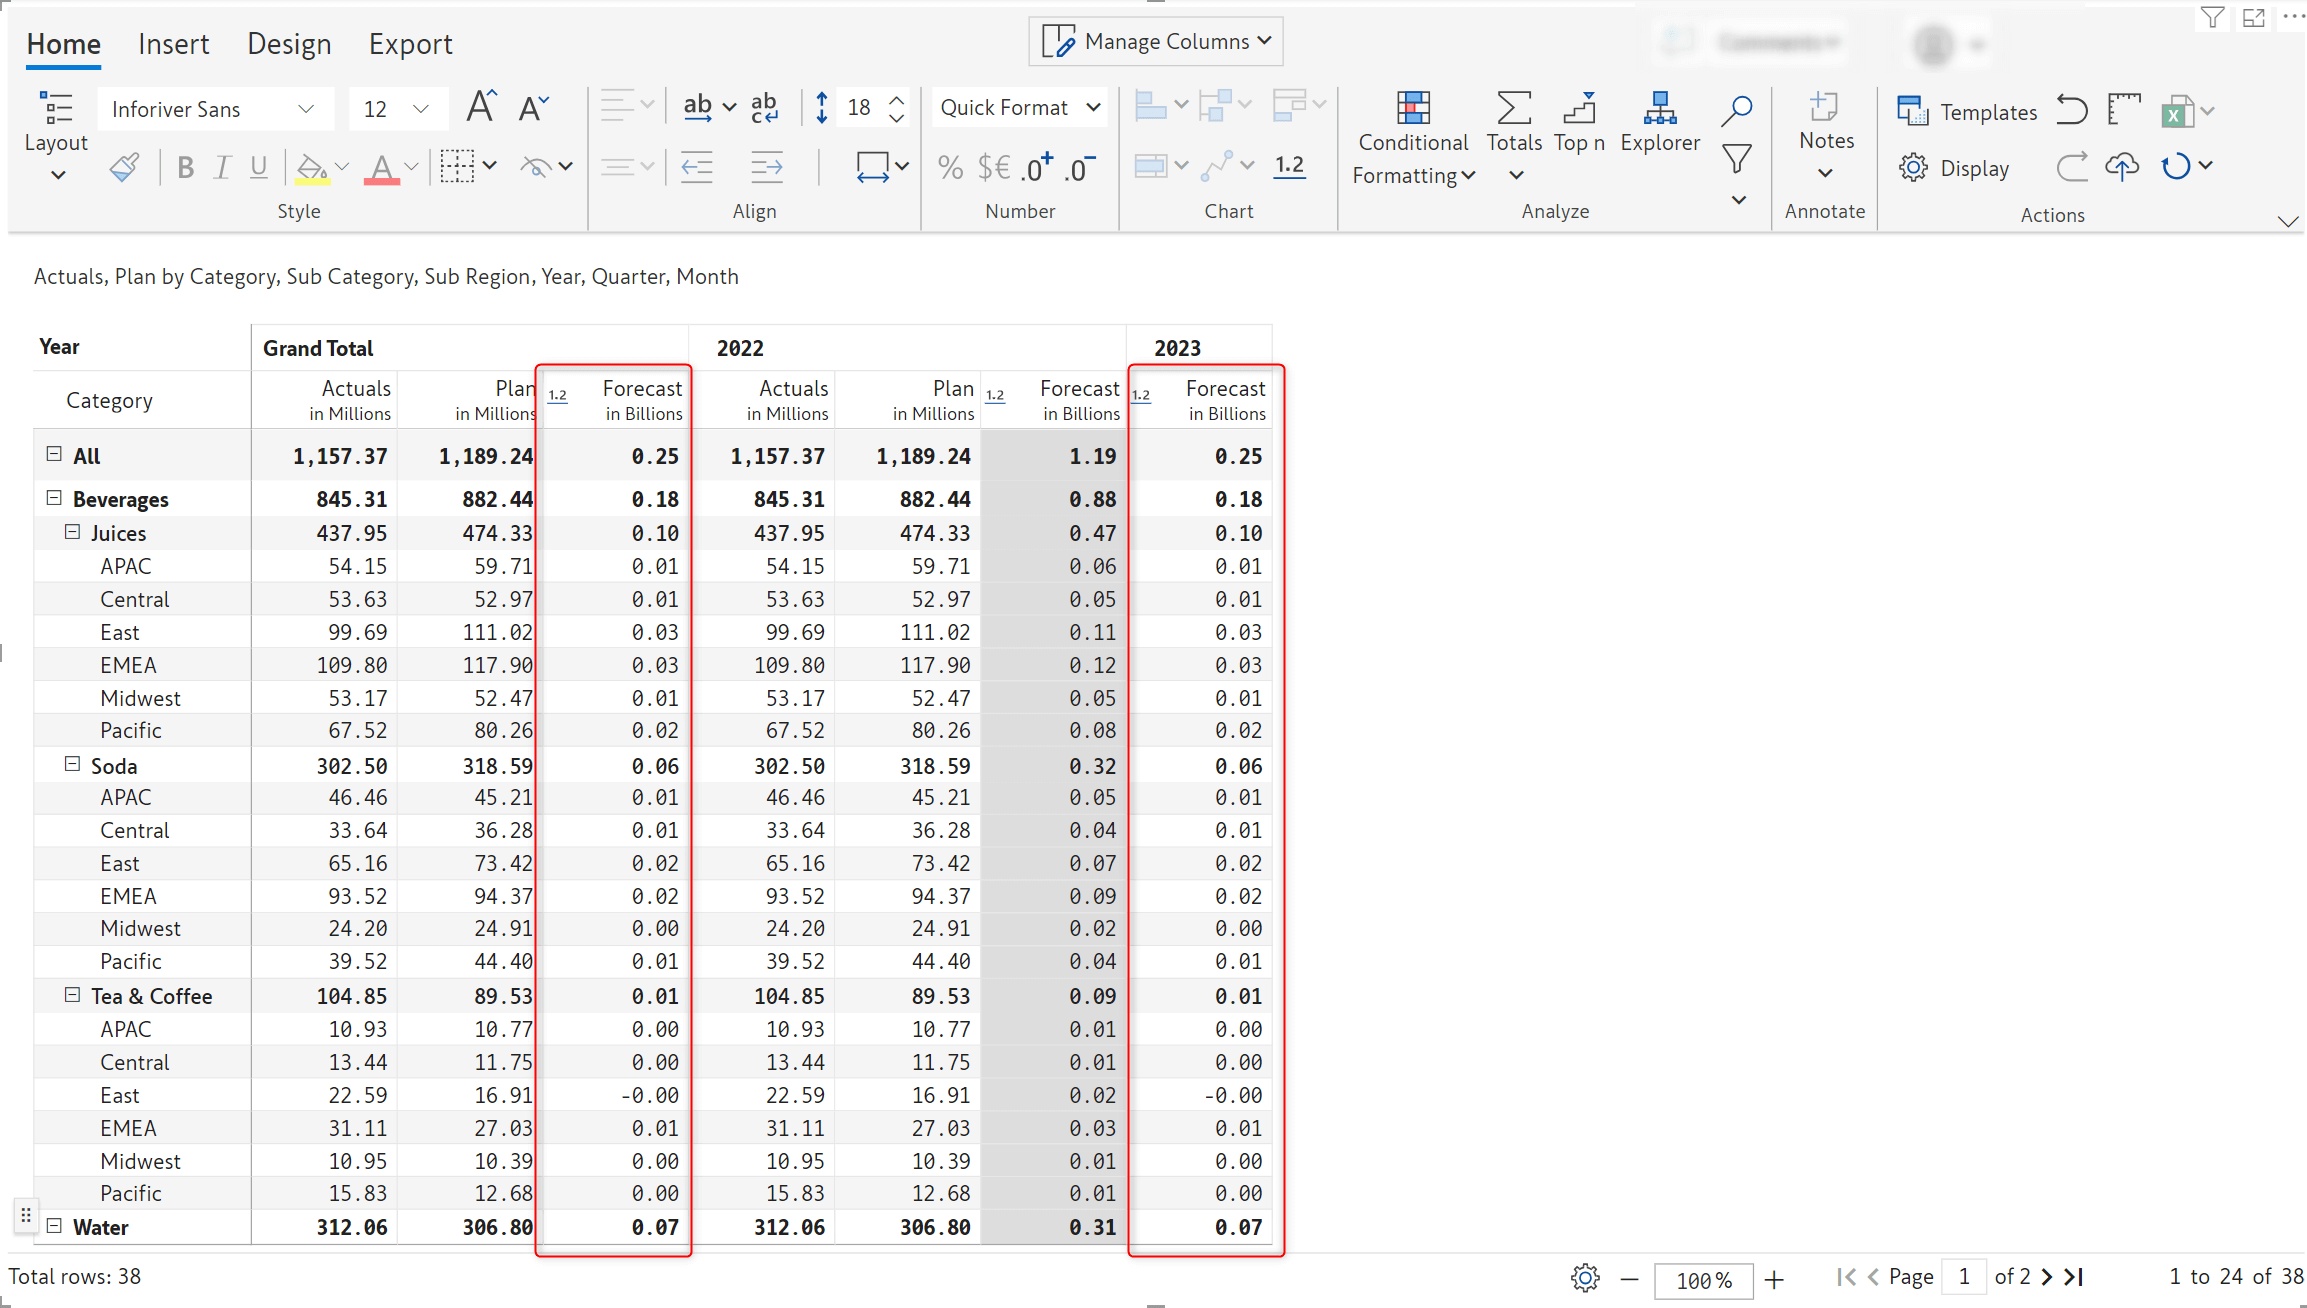
Inforiver offers you the flexibility to determine the grand total aggregation for the forecast measure. The forecast grand total can be set to include:
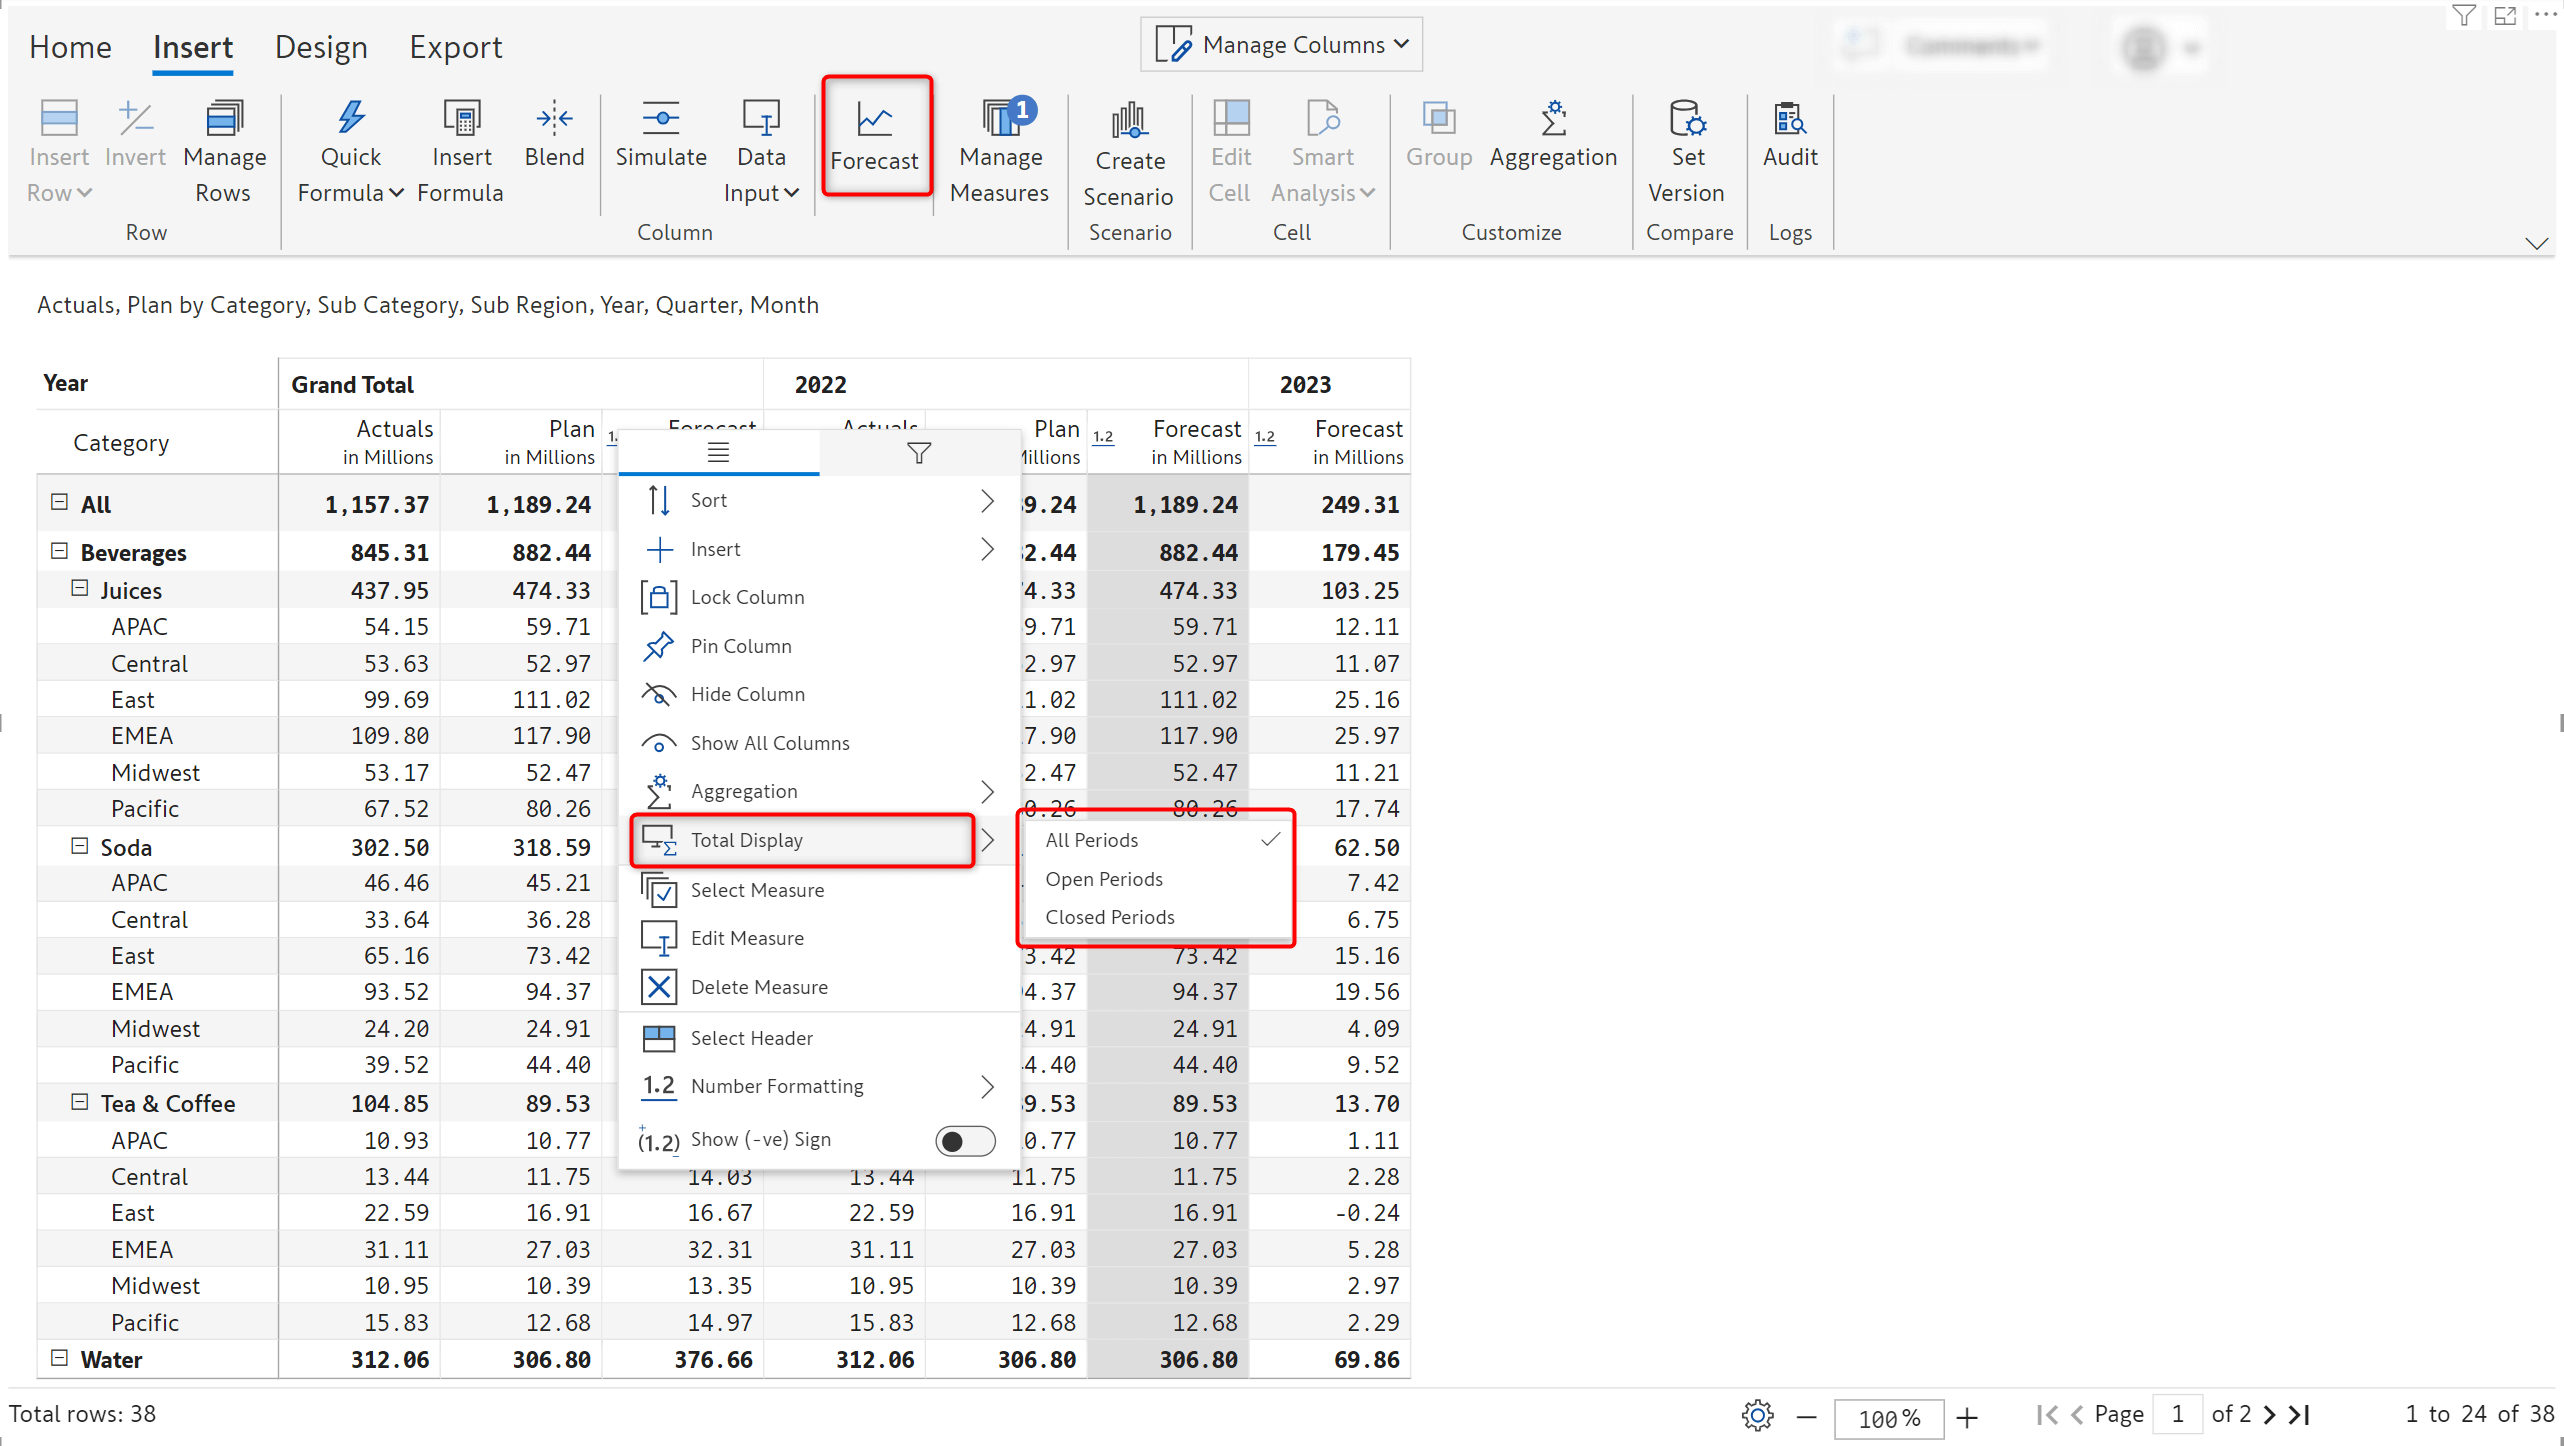
In the image below, the Forecast grand total is derived from the aggregated forecasts for open periods. By updating the grand total forecast values, you can smoothly assign and distribute forecasts for open periods in one shot.
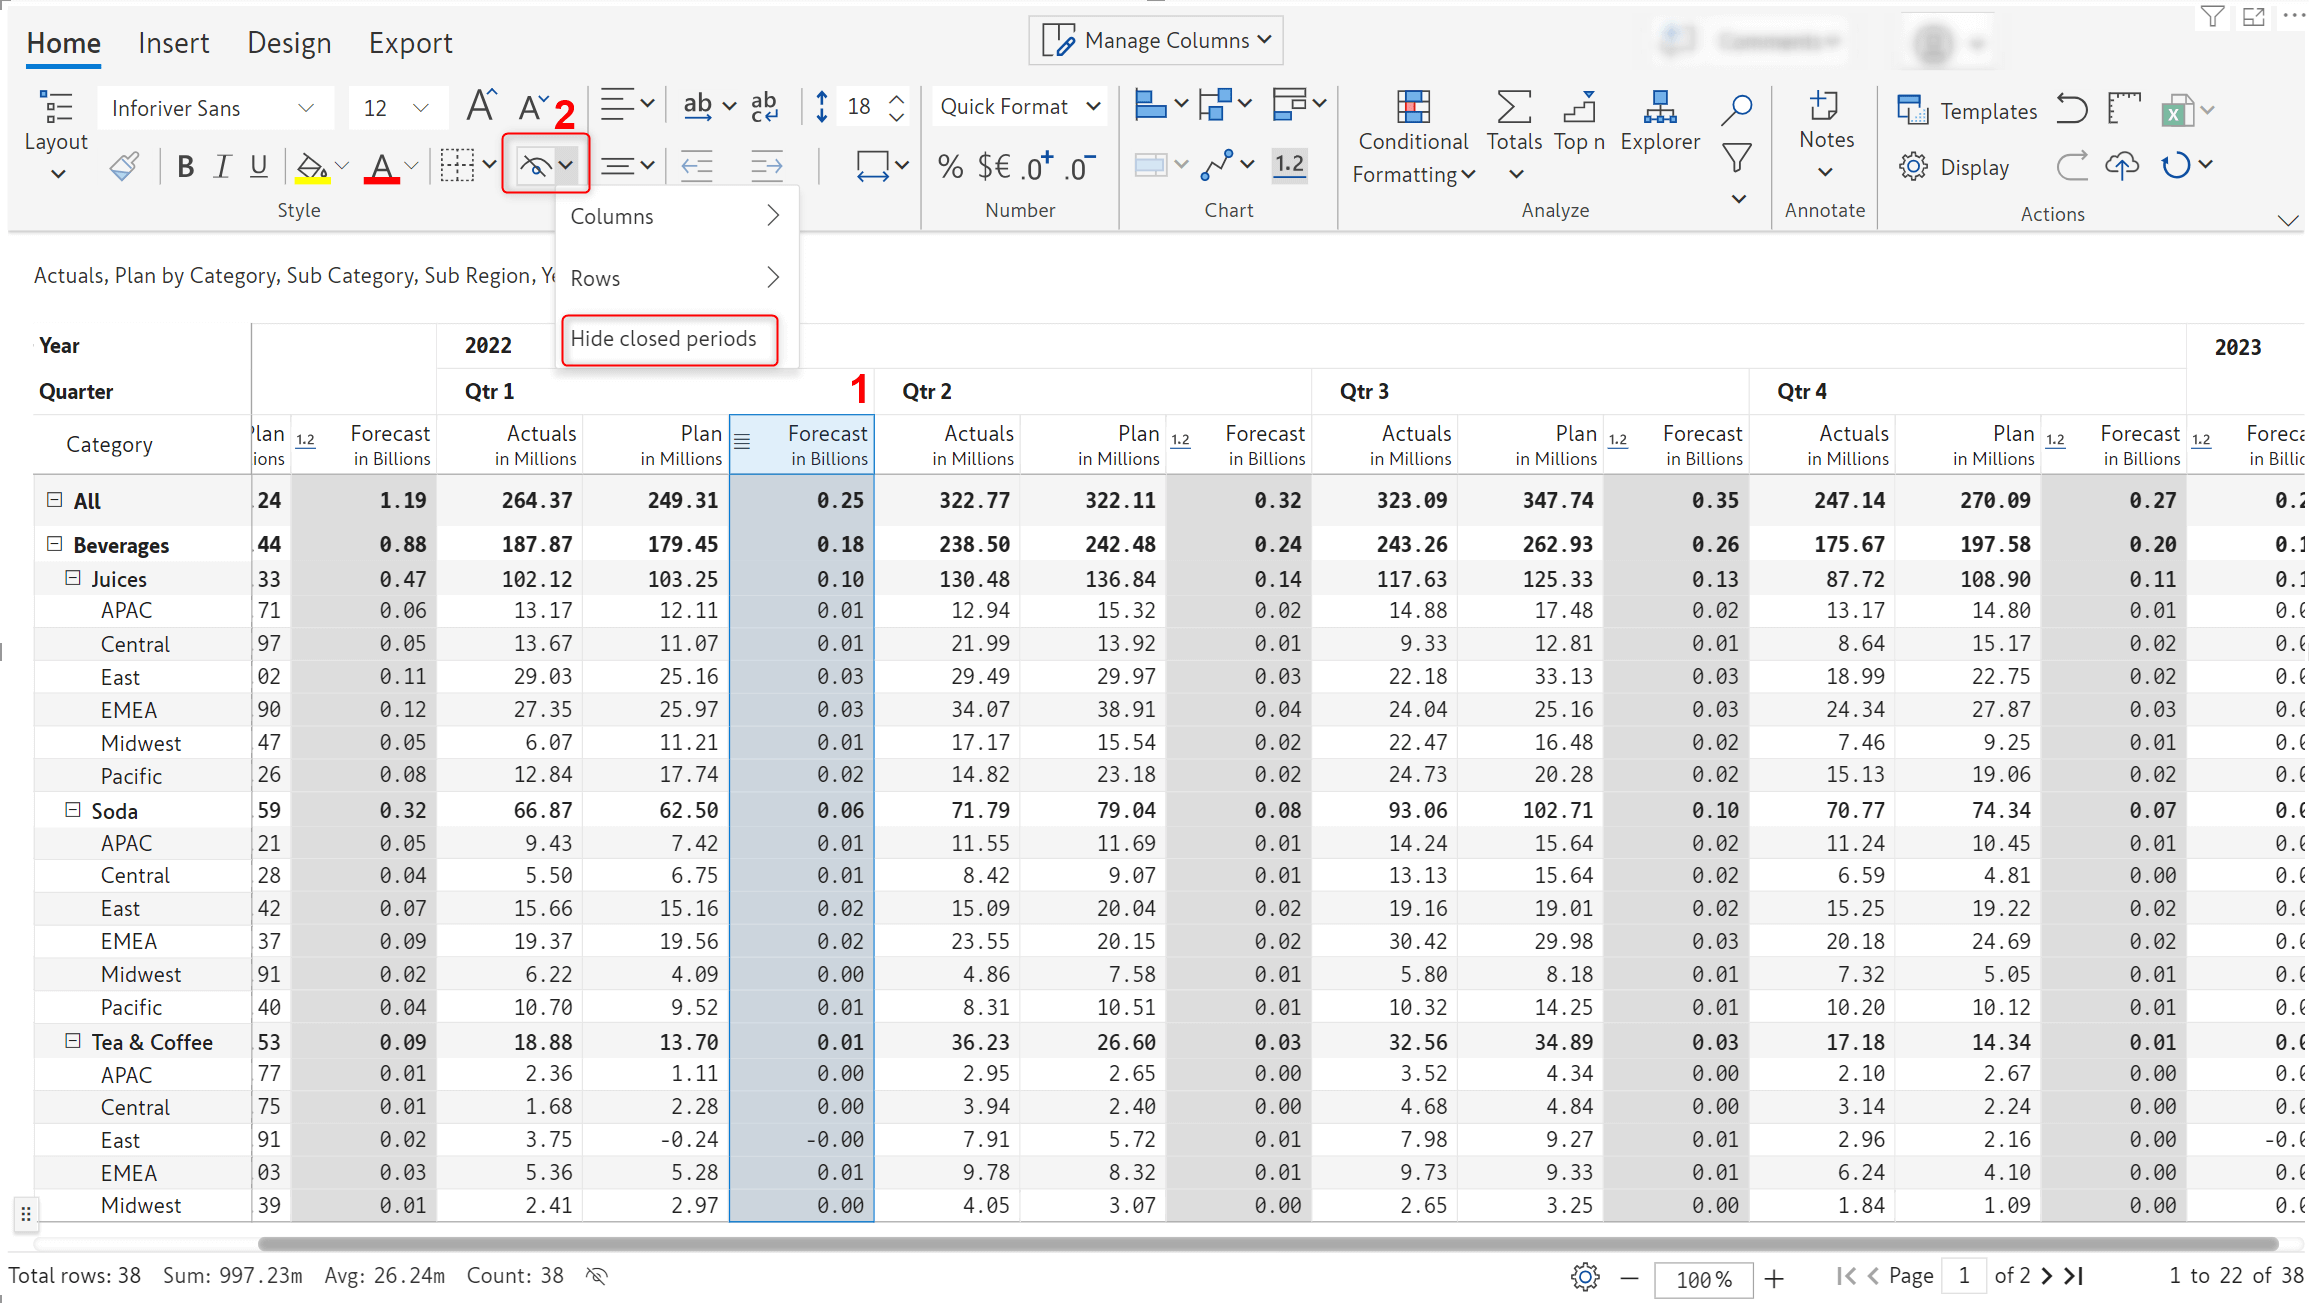
4.4. Show or hide forecasts for closed periods.
You can effortlessly mask the forecast for closed periods if they are not required in reports.
4.5. Data validations for text input fields
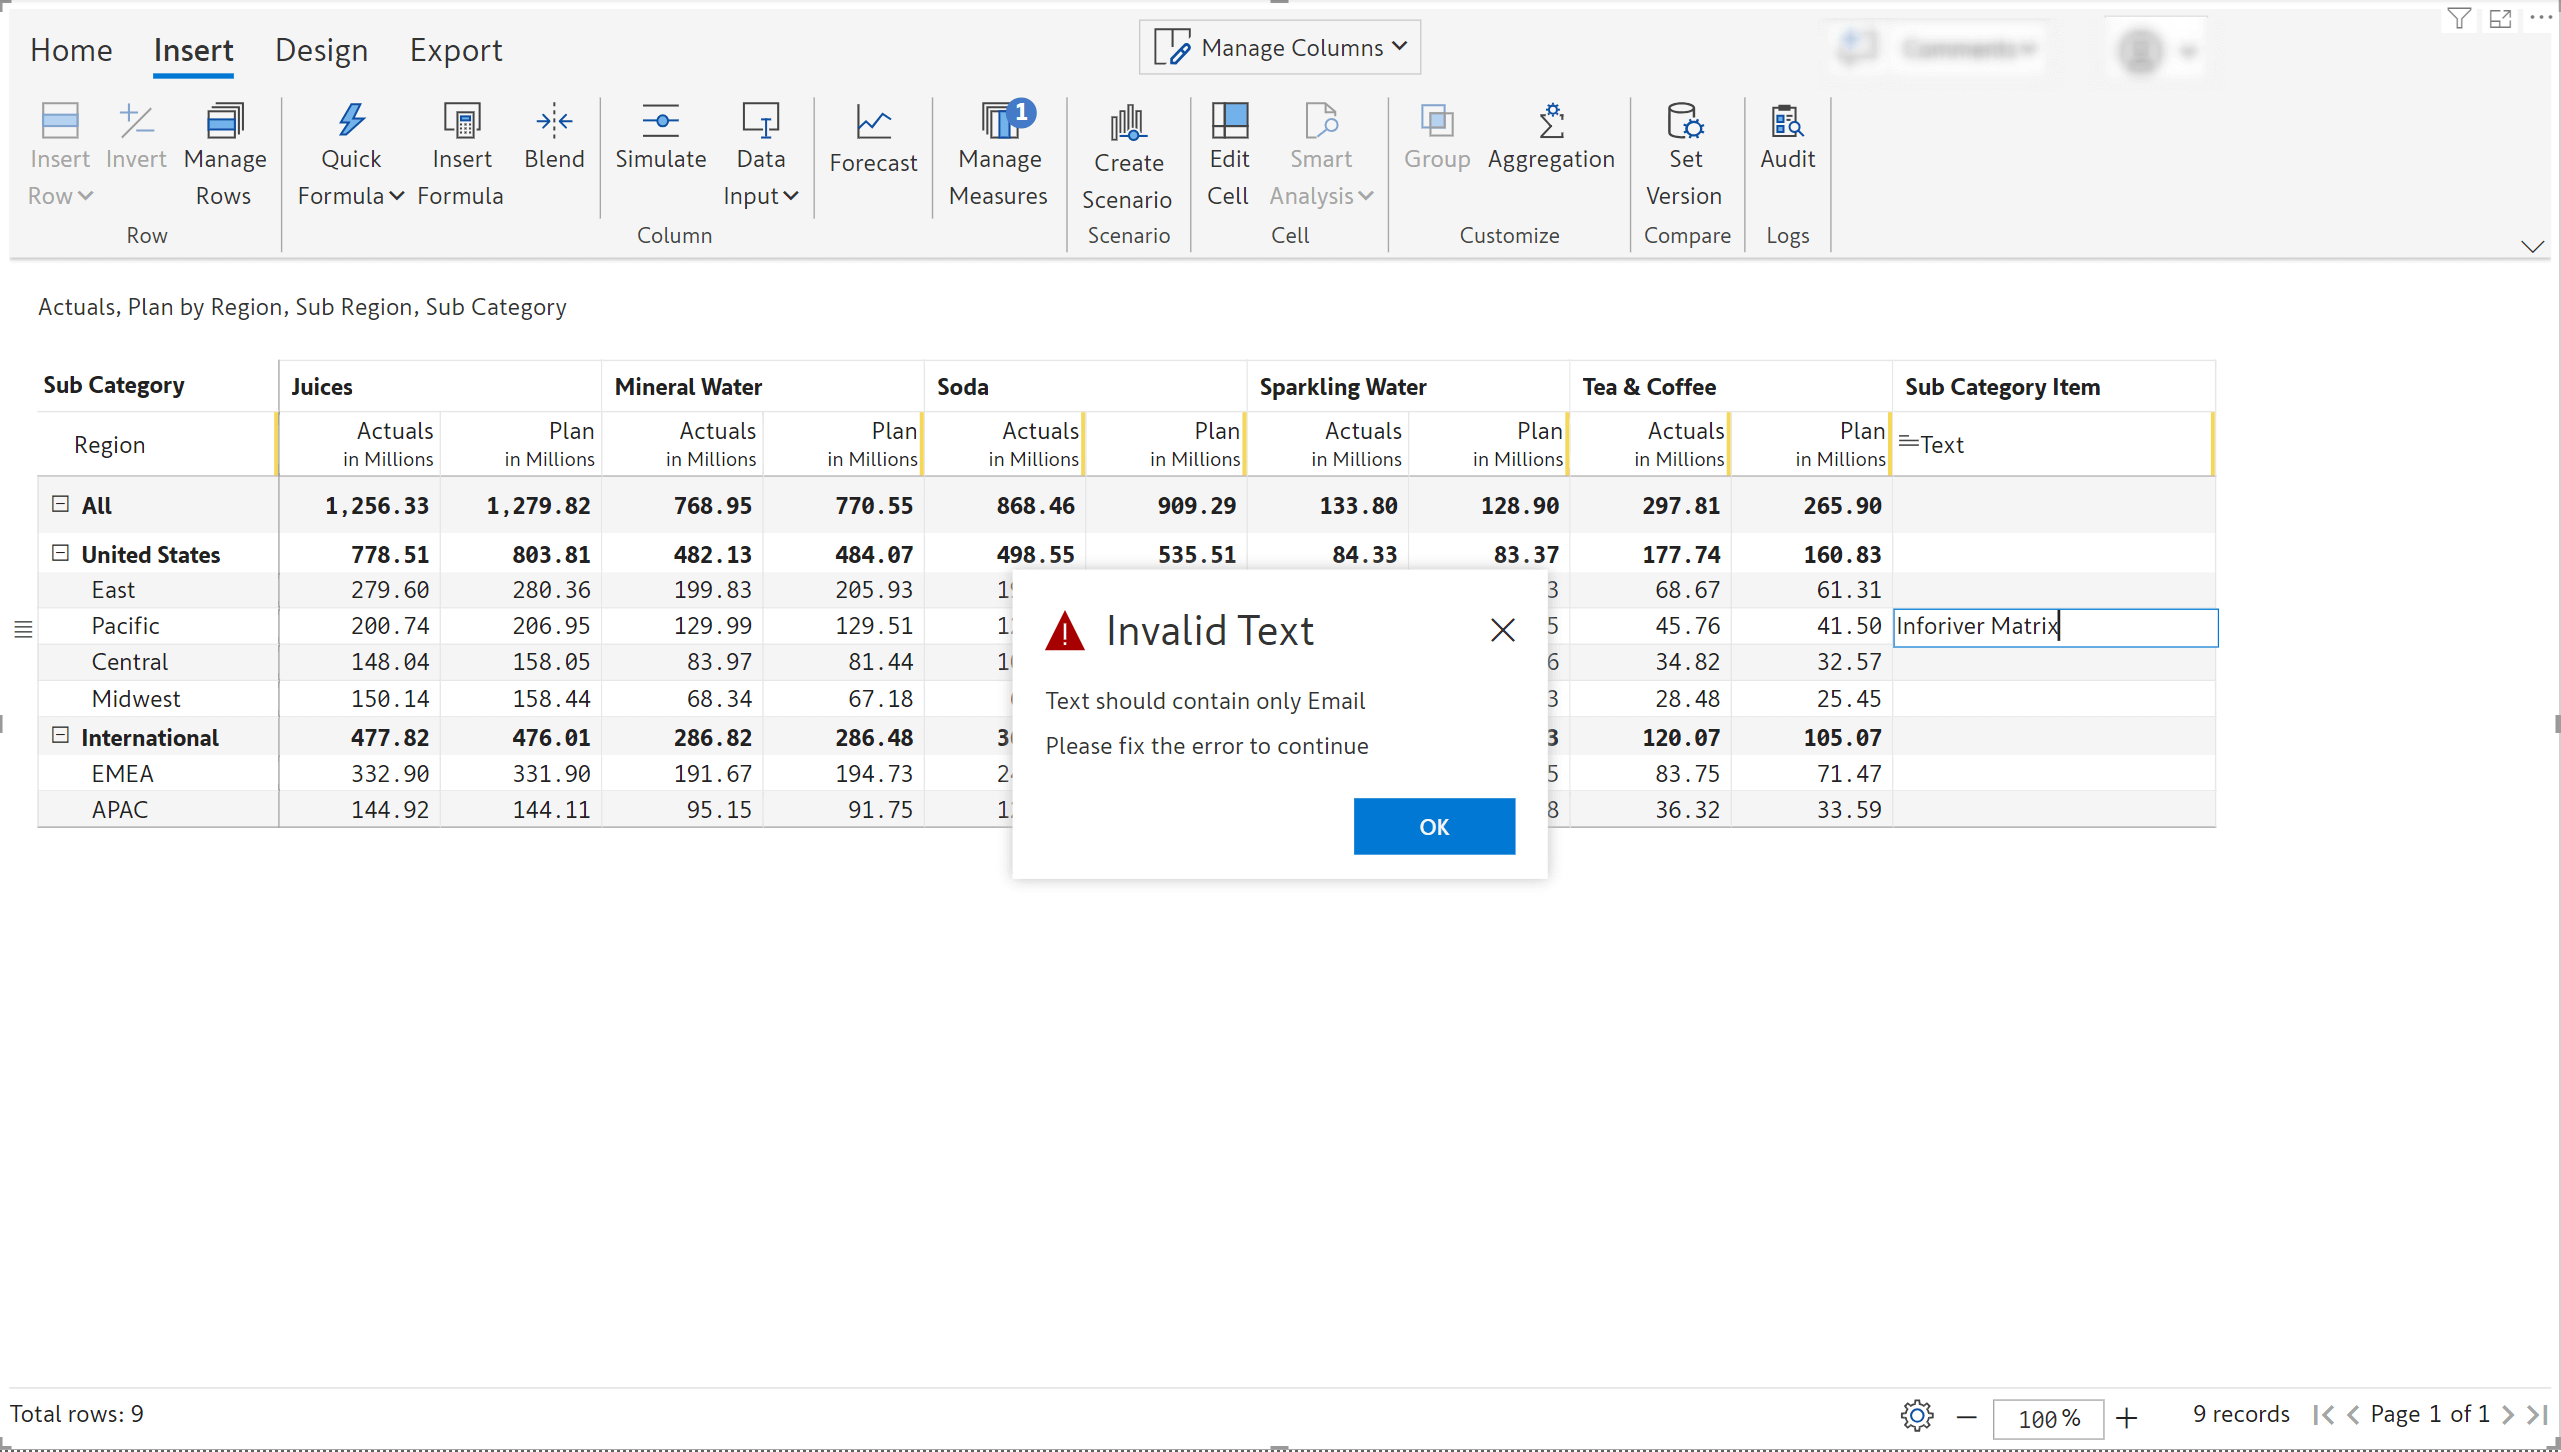
Maintaining data quality has never been easier - text data input fields are now more robust with built-in data validations. You can perform data type checks for numeric or text data, validate emails and URLs, you can even use regular expressions to verify input data.
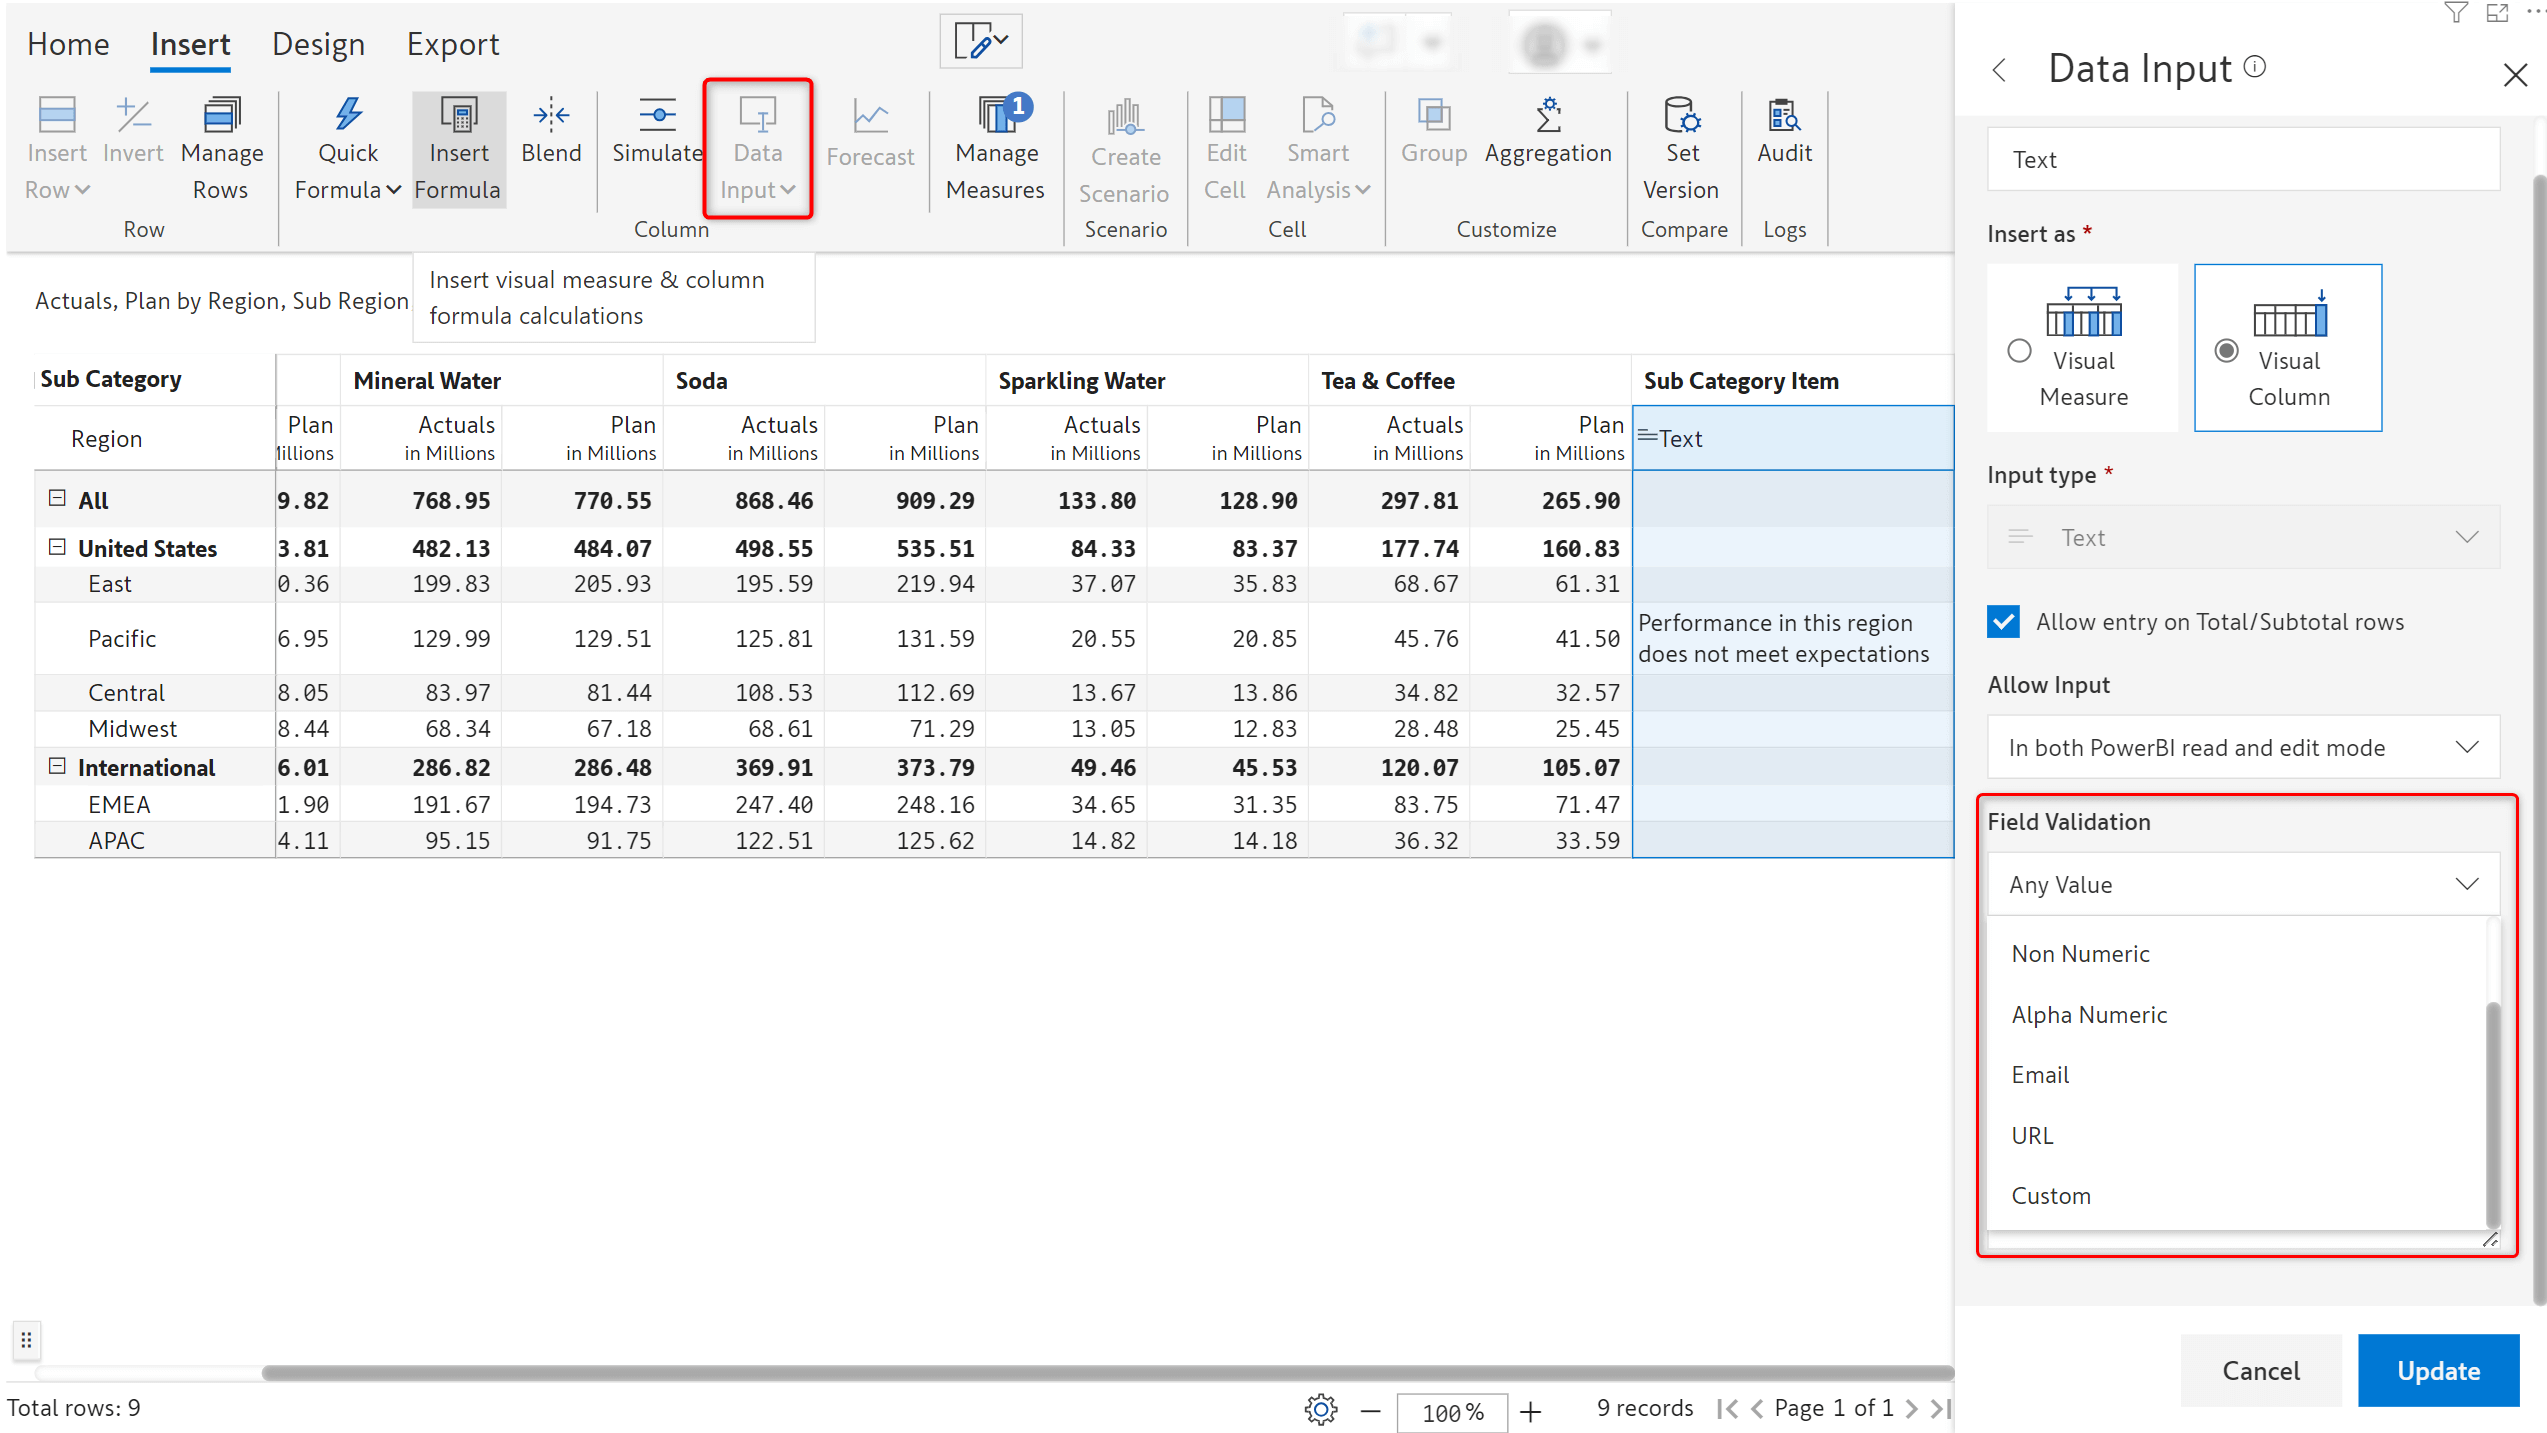
If the data entered does not conform to the validation rule, Inforiver will generate error notifications based on the validation.
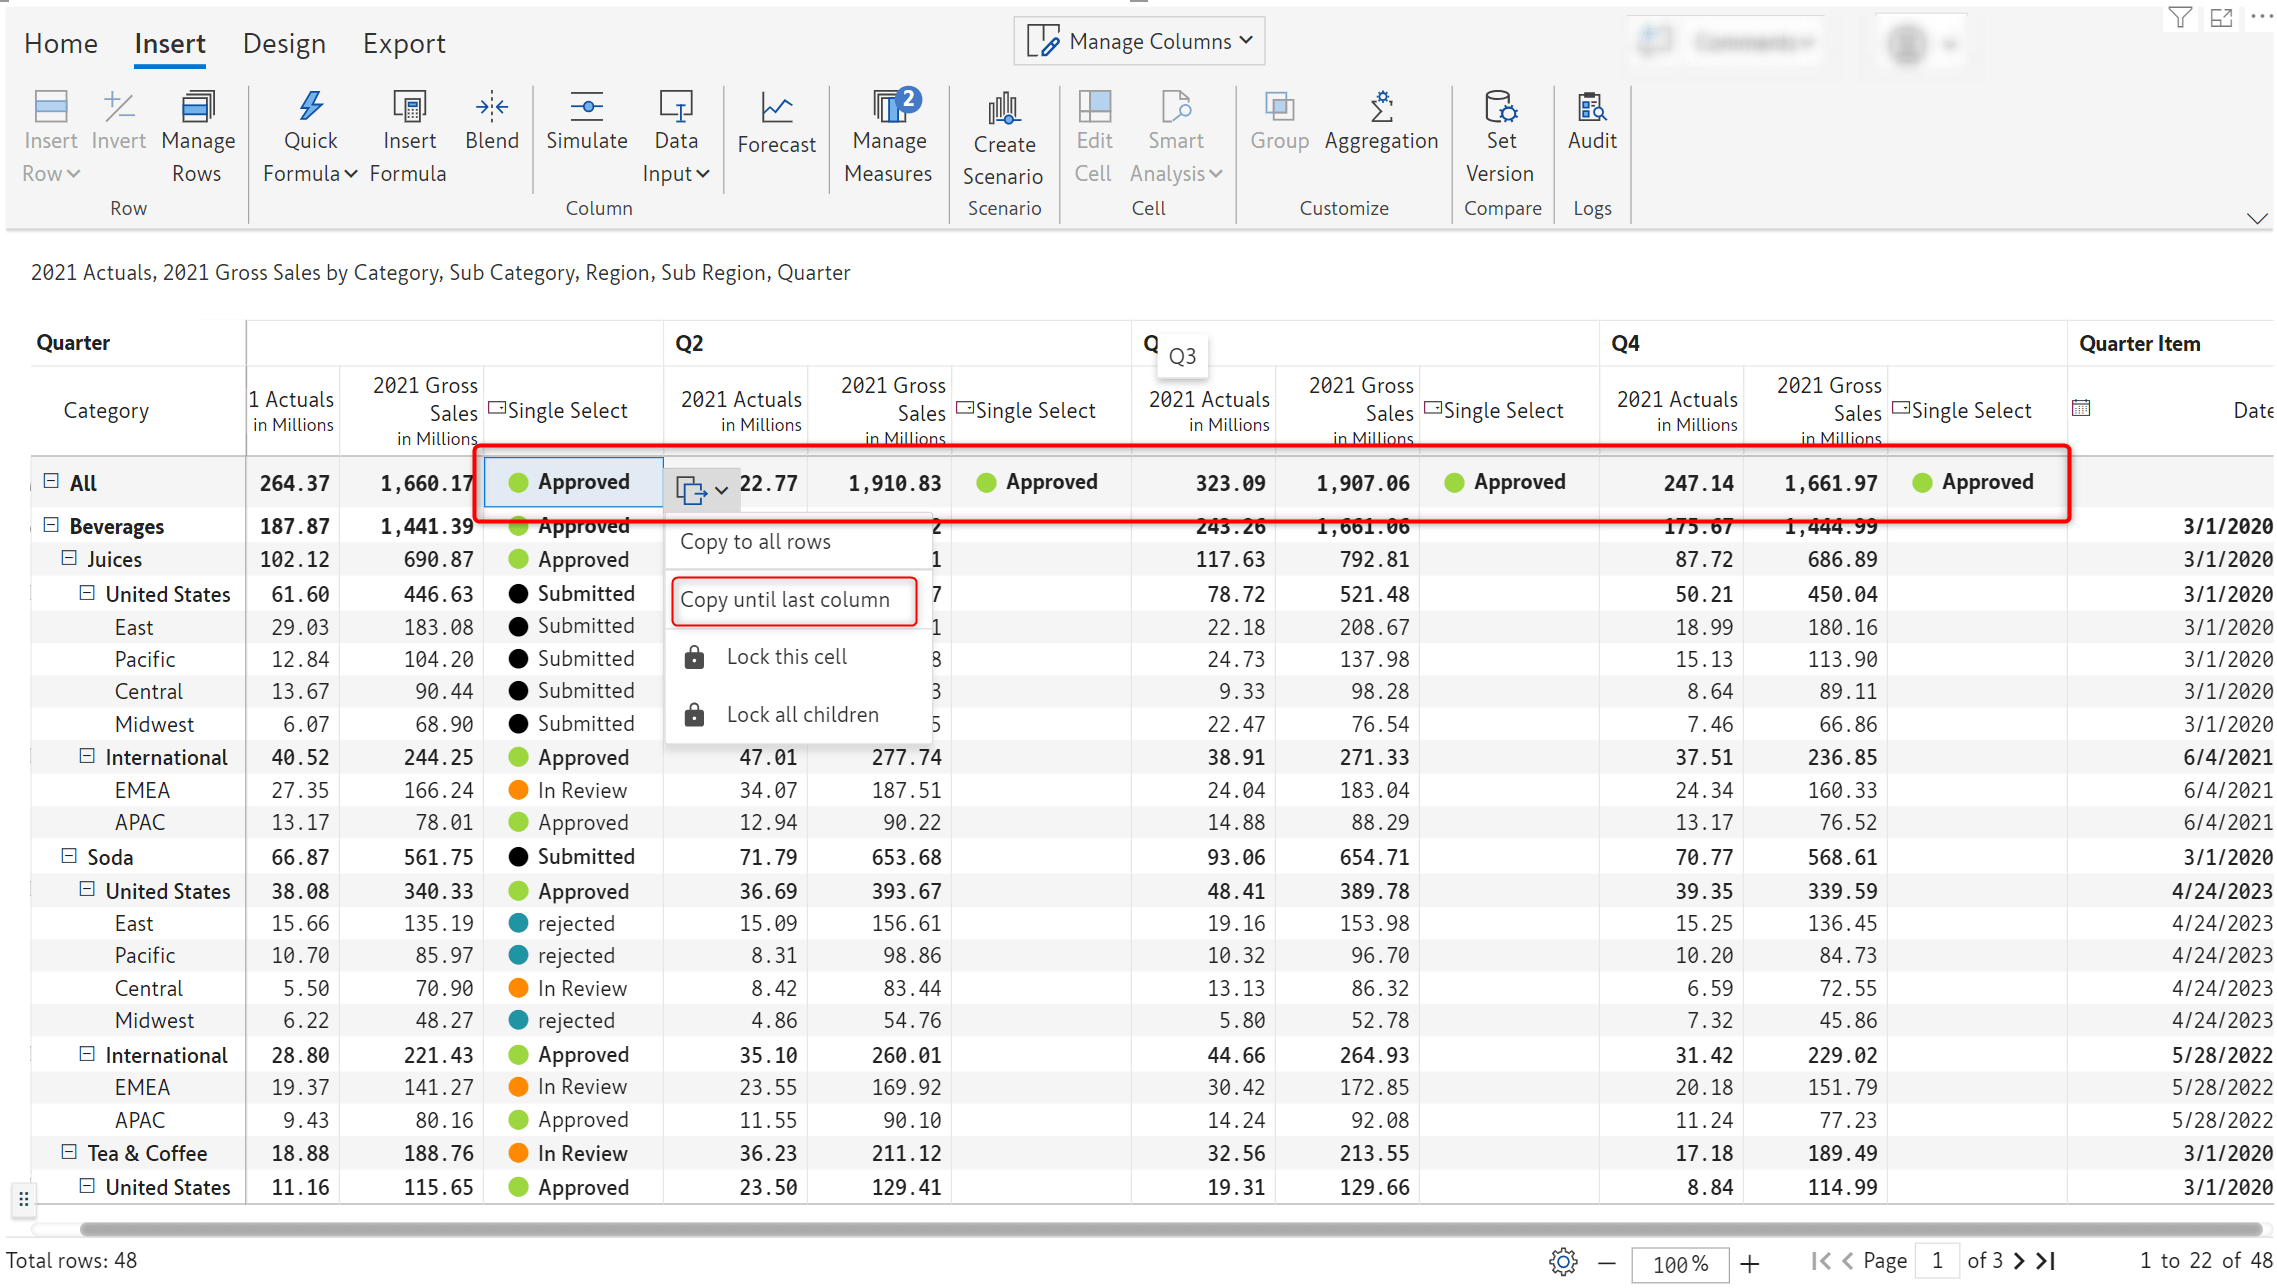
4.6. Replicating non-numeric data types
The handy ‘Copy to all rows’ options can be used to replicate non-numeric data input values. Values can quickly be auto filled across a given level in a hierarchy or across the entire dataset.
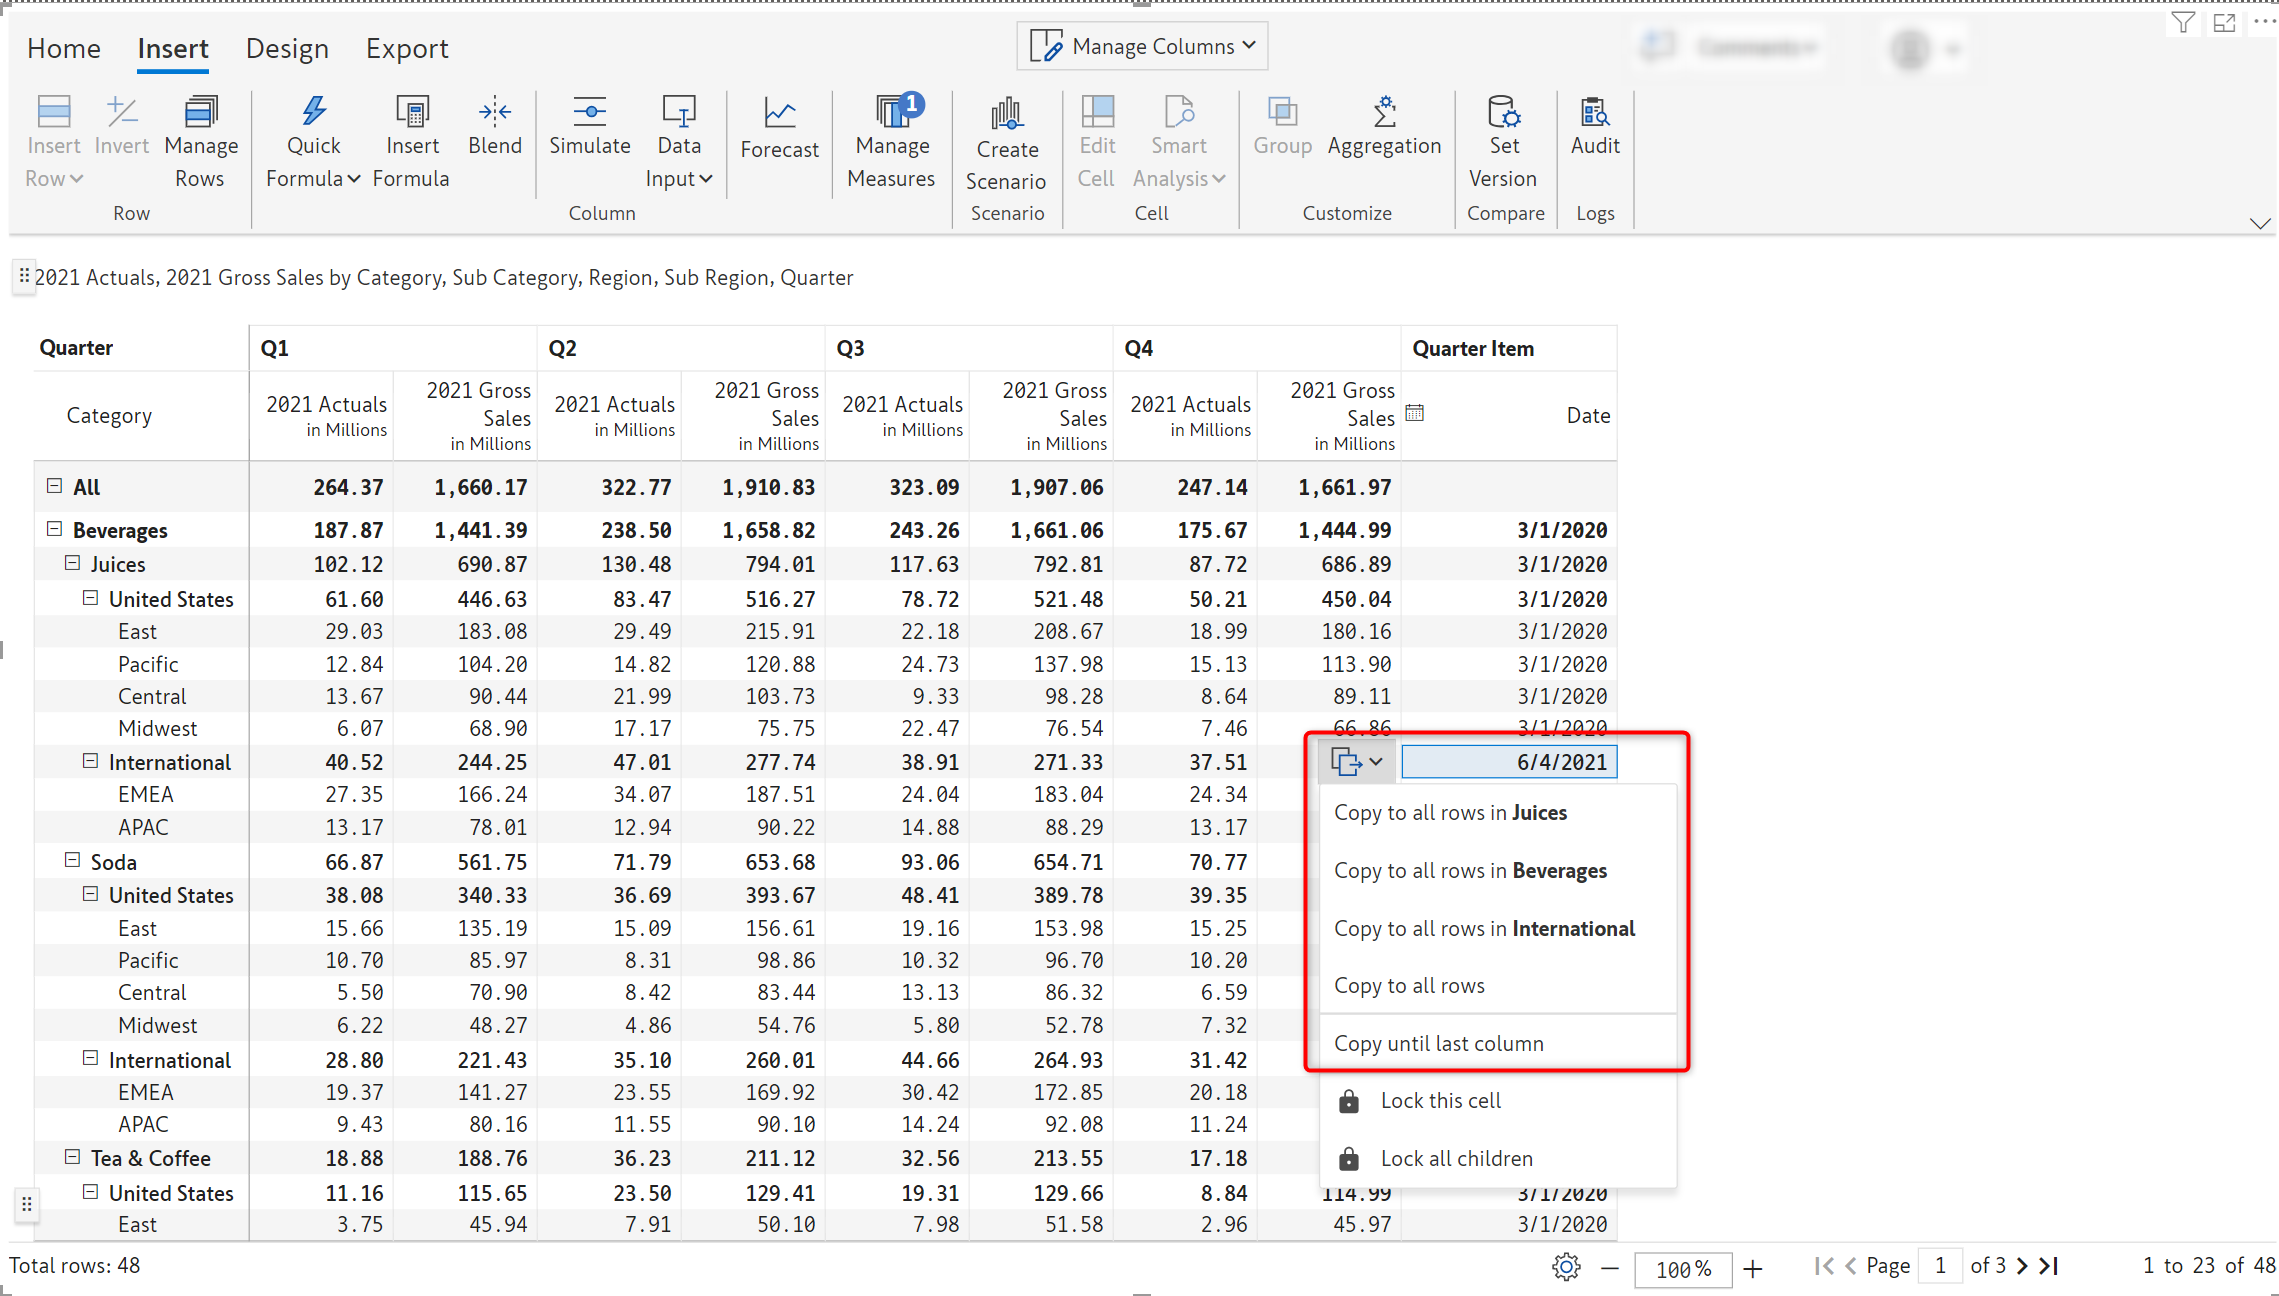
The ‘Copy until last column’ will replicate the values across all the columns for a particular row.
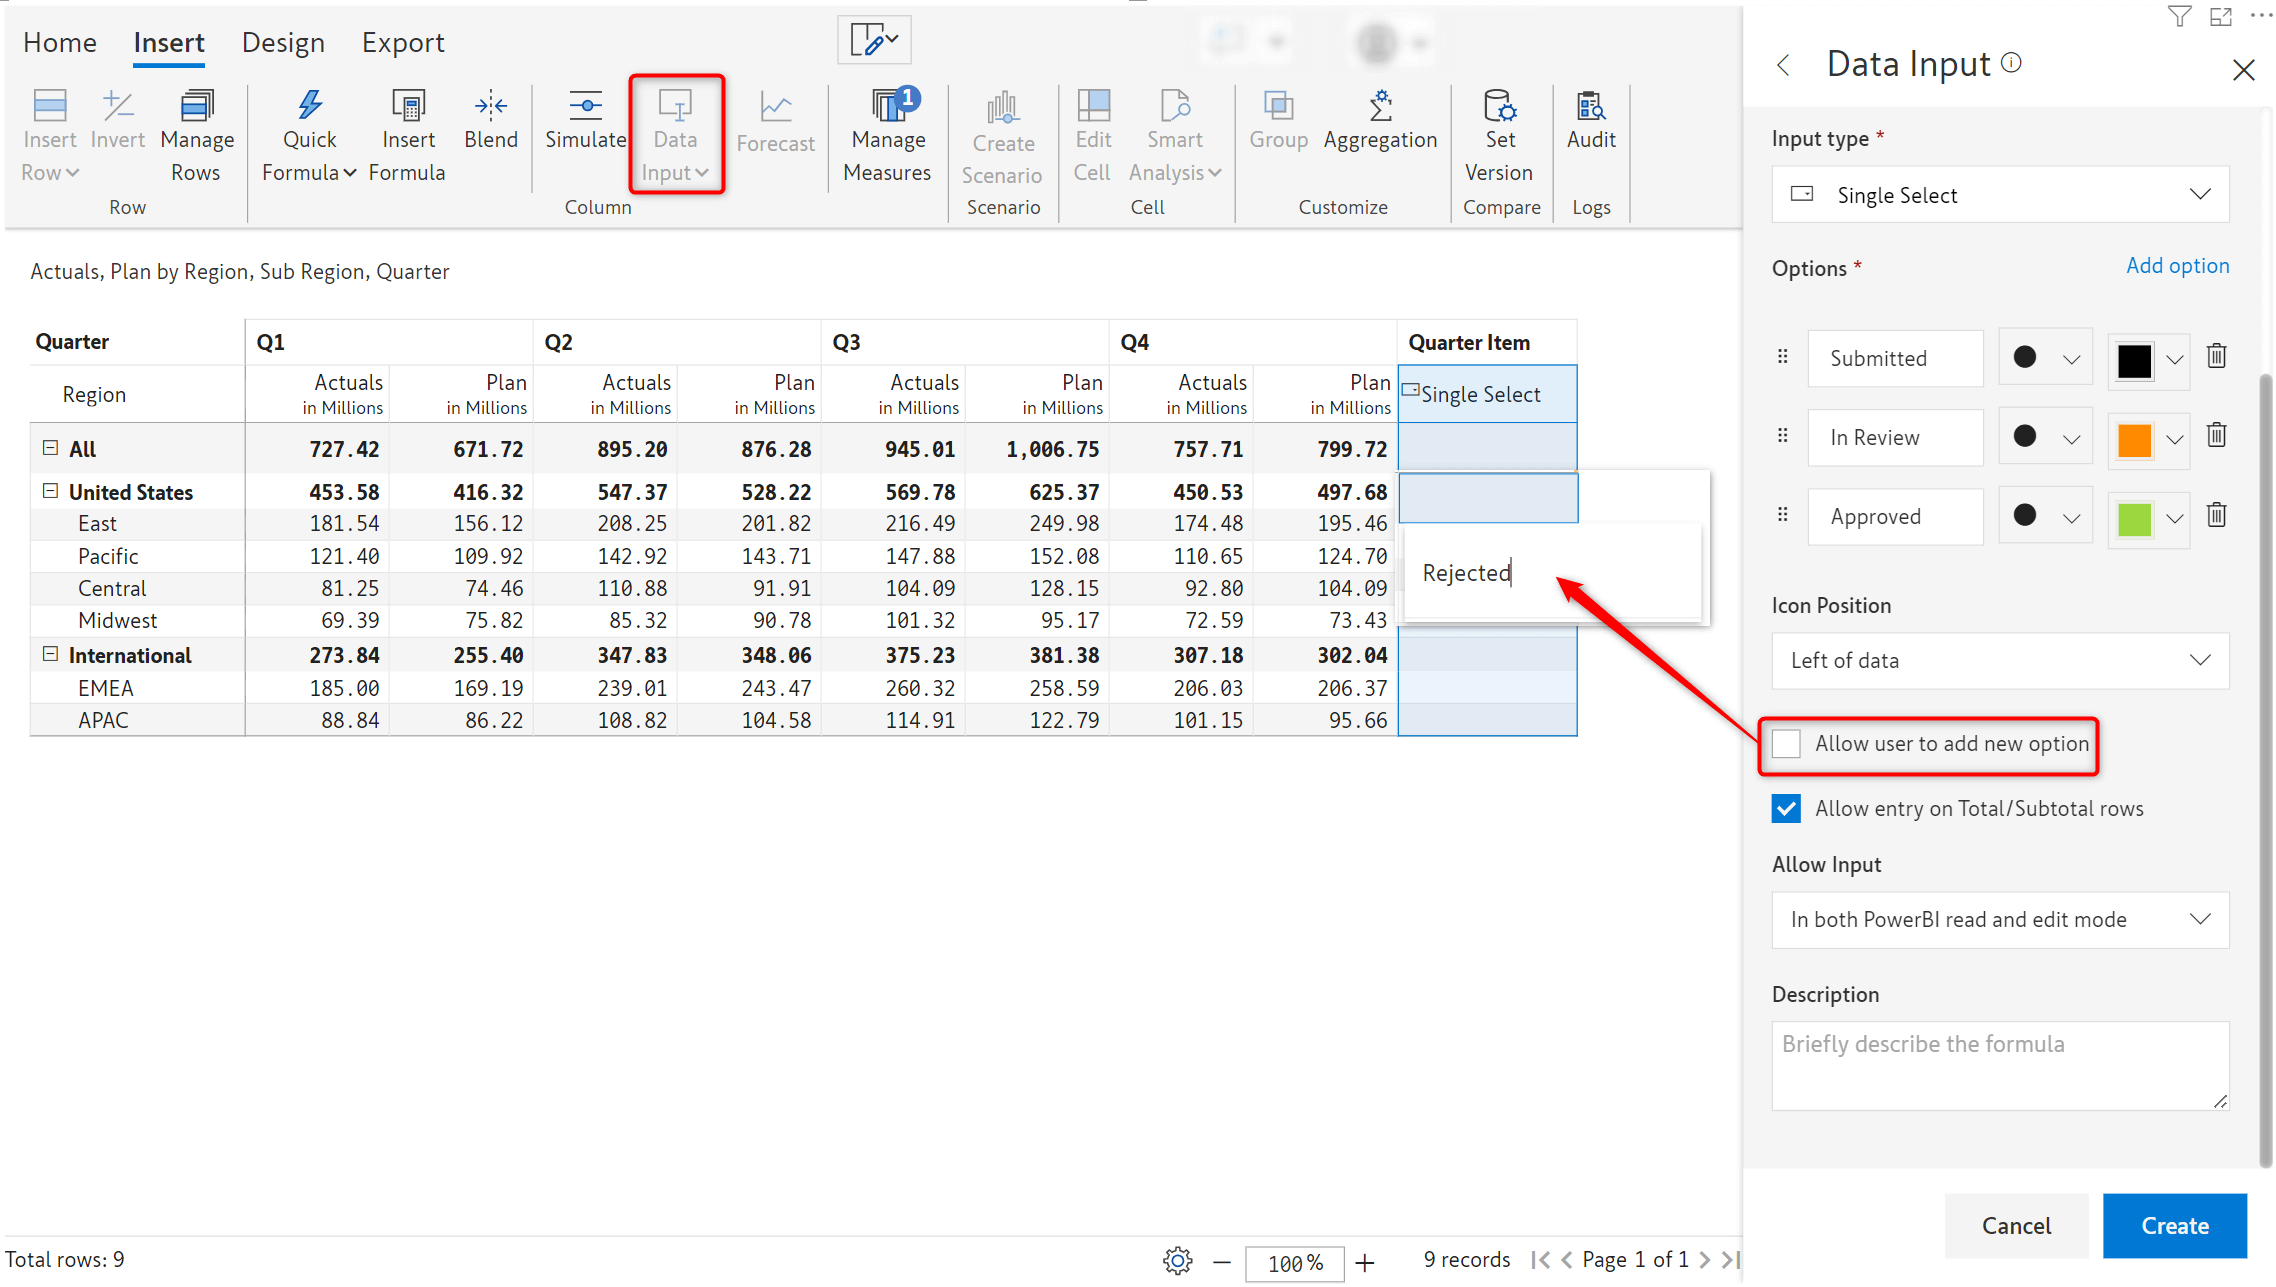
4.7. Control over inserting dynamic items
For single and multi-select data input fields, you can restrict users from adding new list of values which are not available in the original list. You can now Uncheck the ‘Allow user to add new option’ if you opt to maintain a static list.
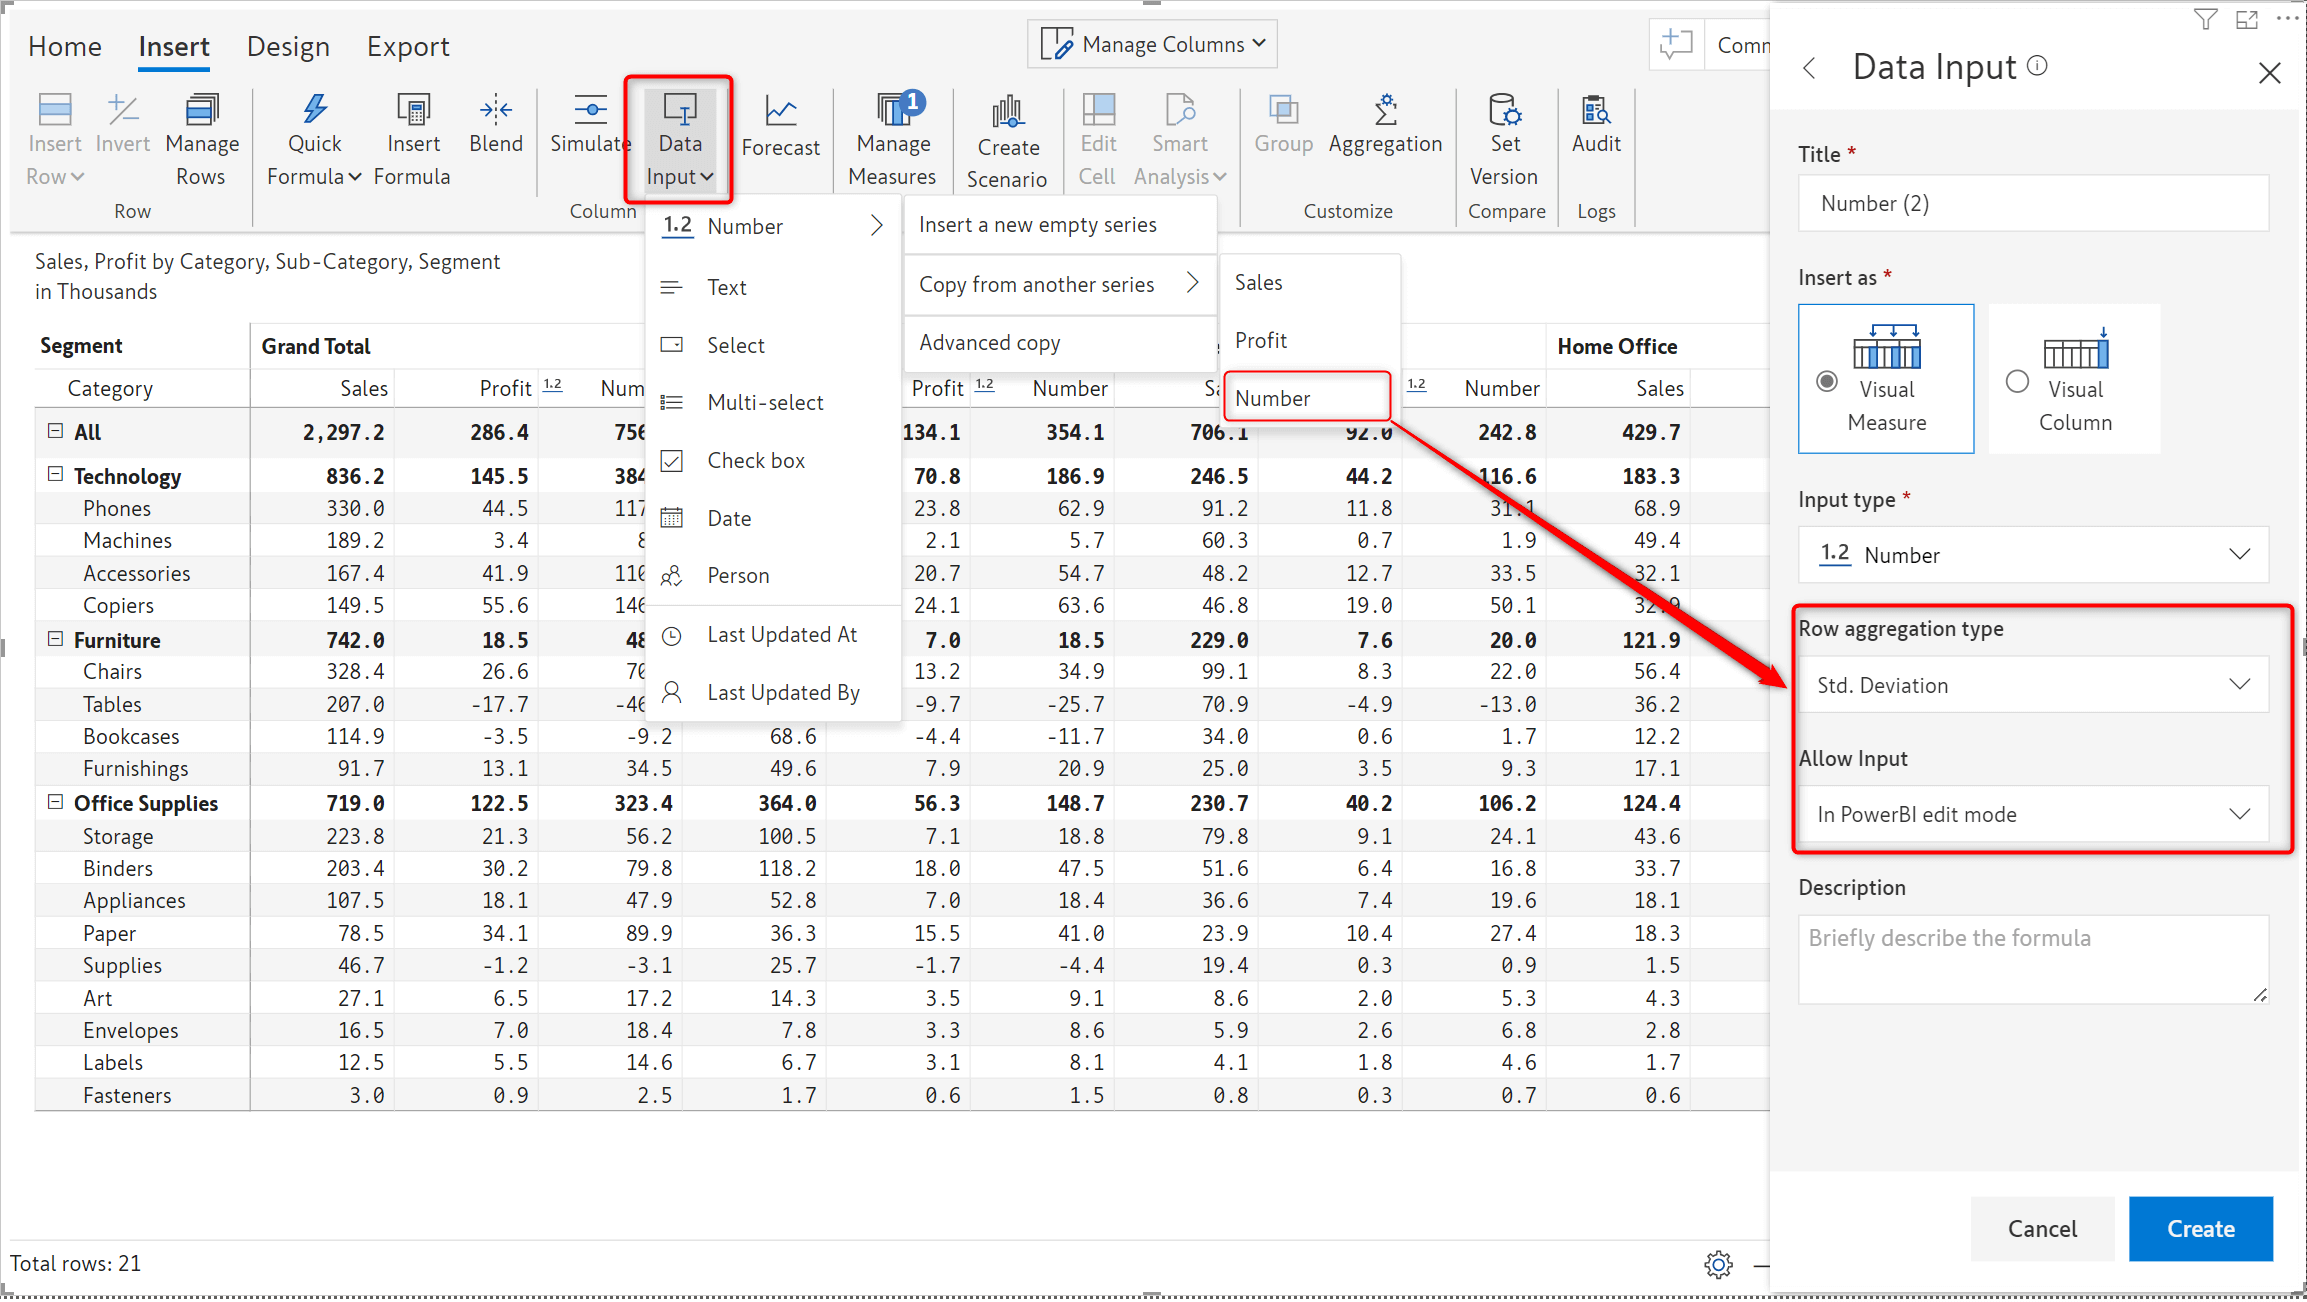
4.8. Clone numeric data input fields
You can now easily clone and reuse numeric data input fields. Attributes such as Row aggregation type, Allow Input, Minimum and Maximum are also propagated along with the values when the new measure/column is created.
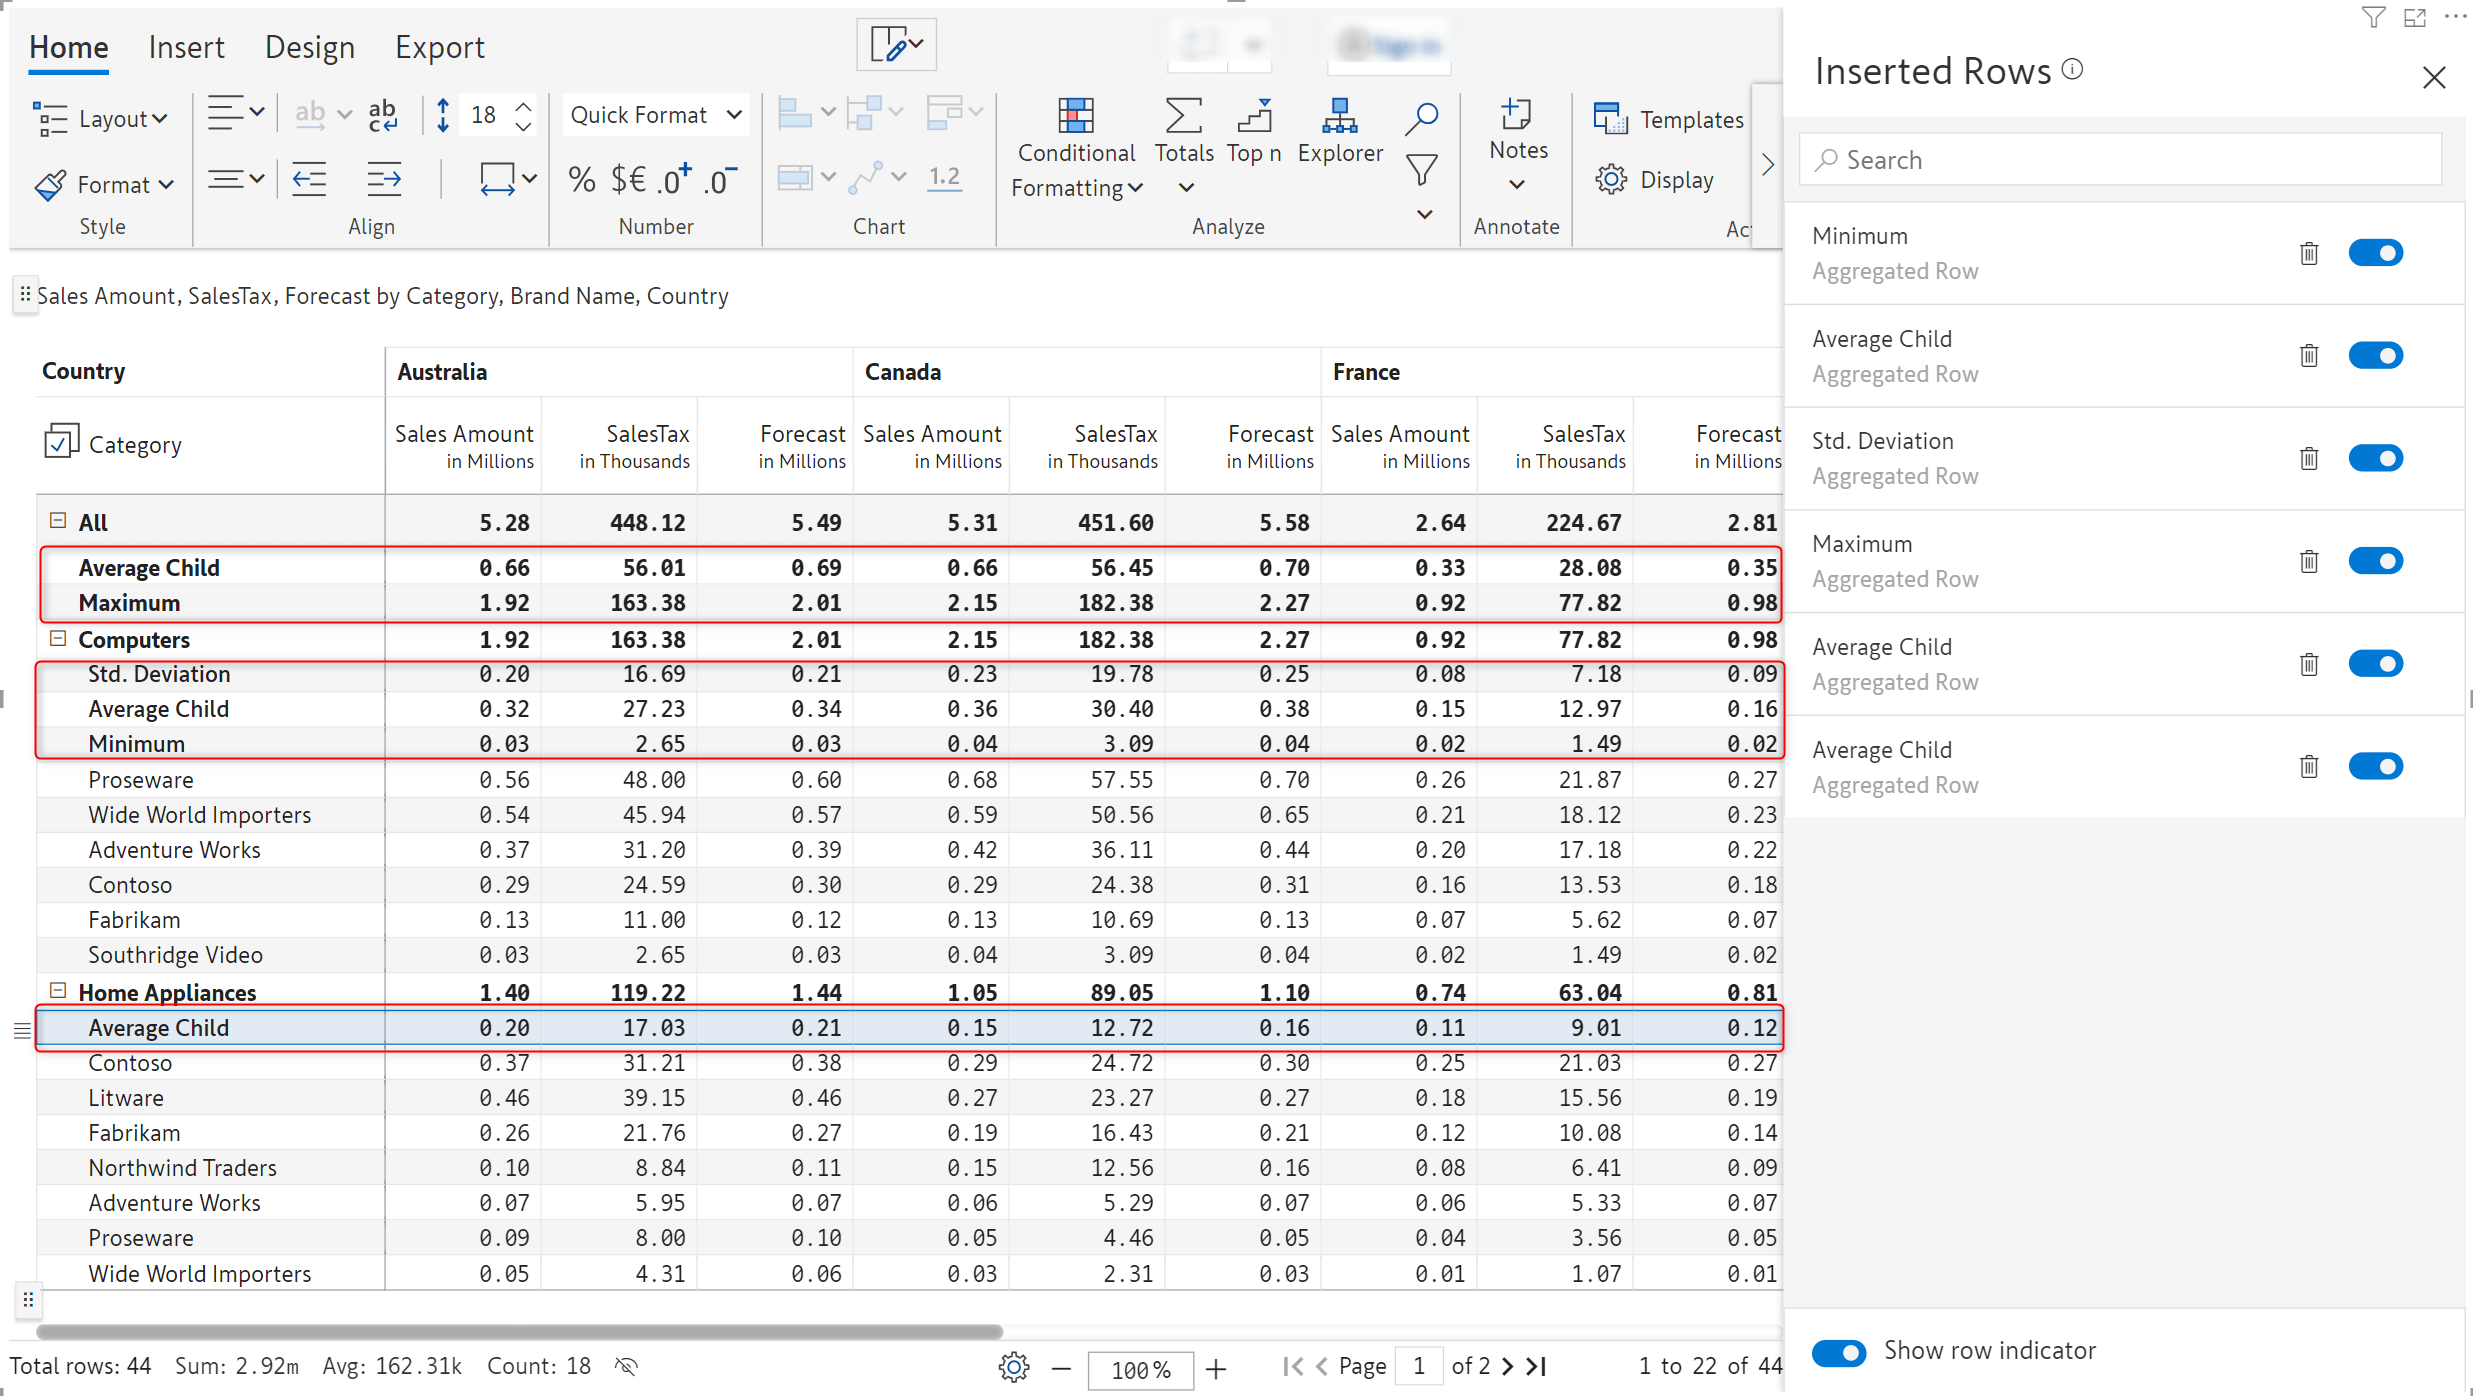
5.1. Multiple Aggregation Rows
Add more perspective to your data using Inforiver’s single click aggregation - in addition to the default aggregation, Inforiver allows you to add multiple totals/sub-total rows with different aggregation types. Aggregated rows can be inserted at any level of the hierarchy.
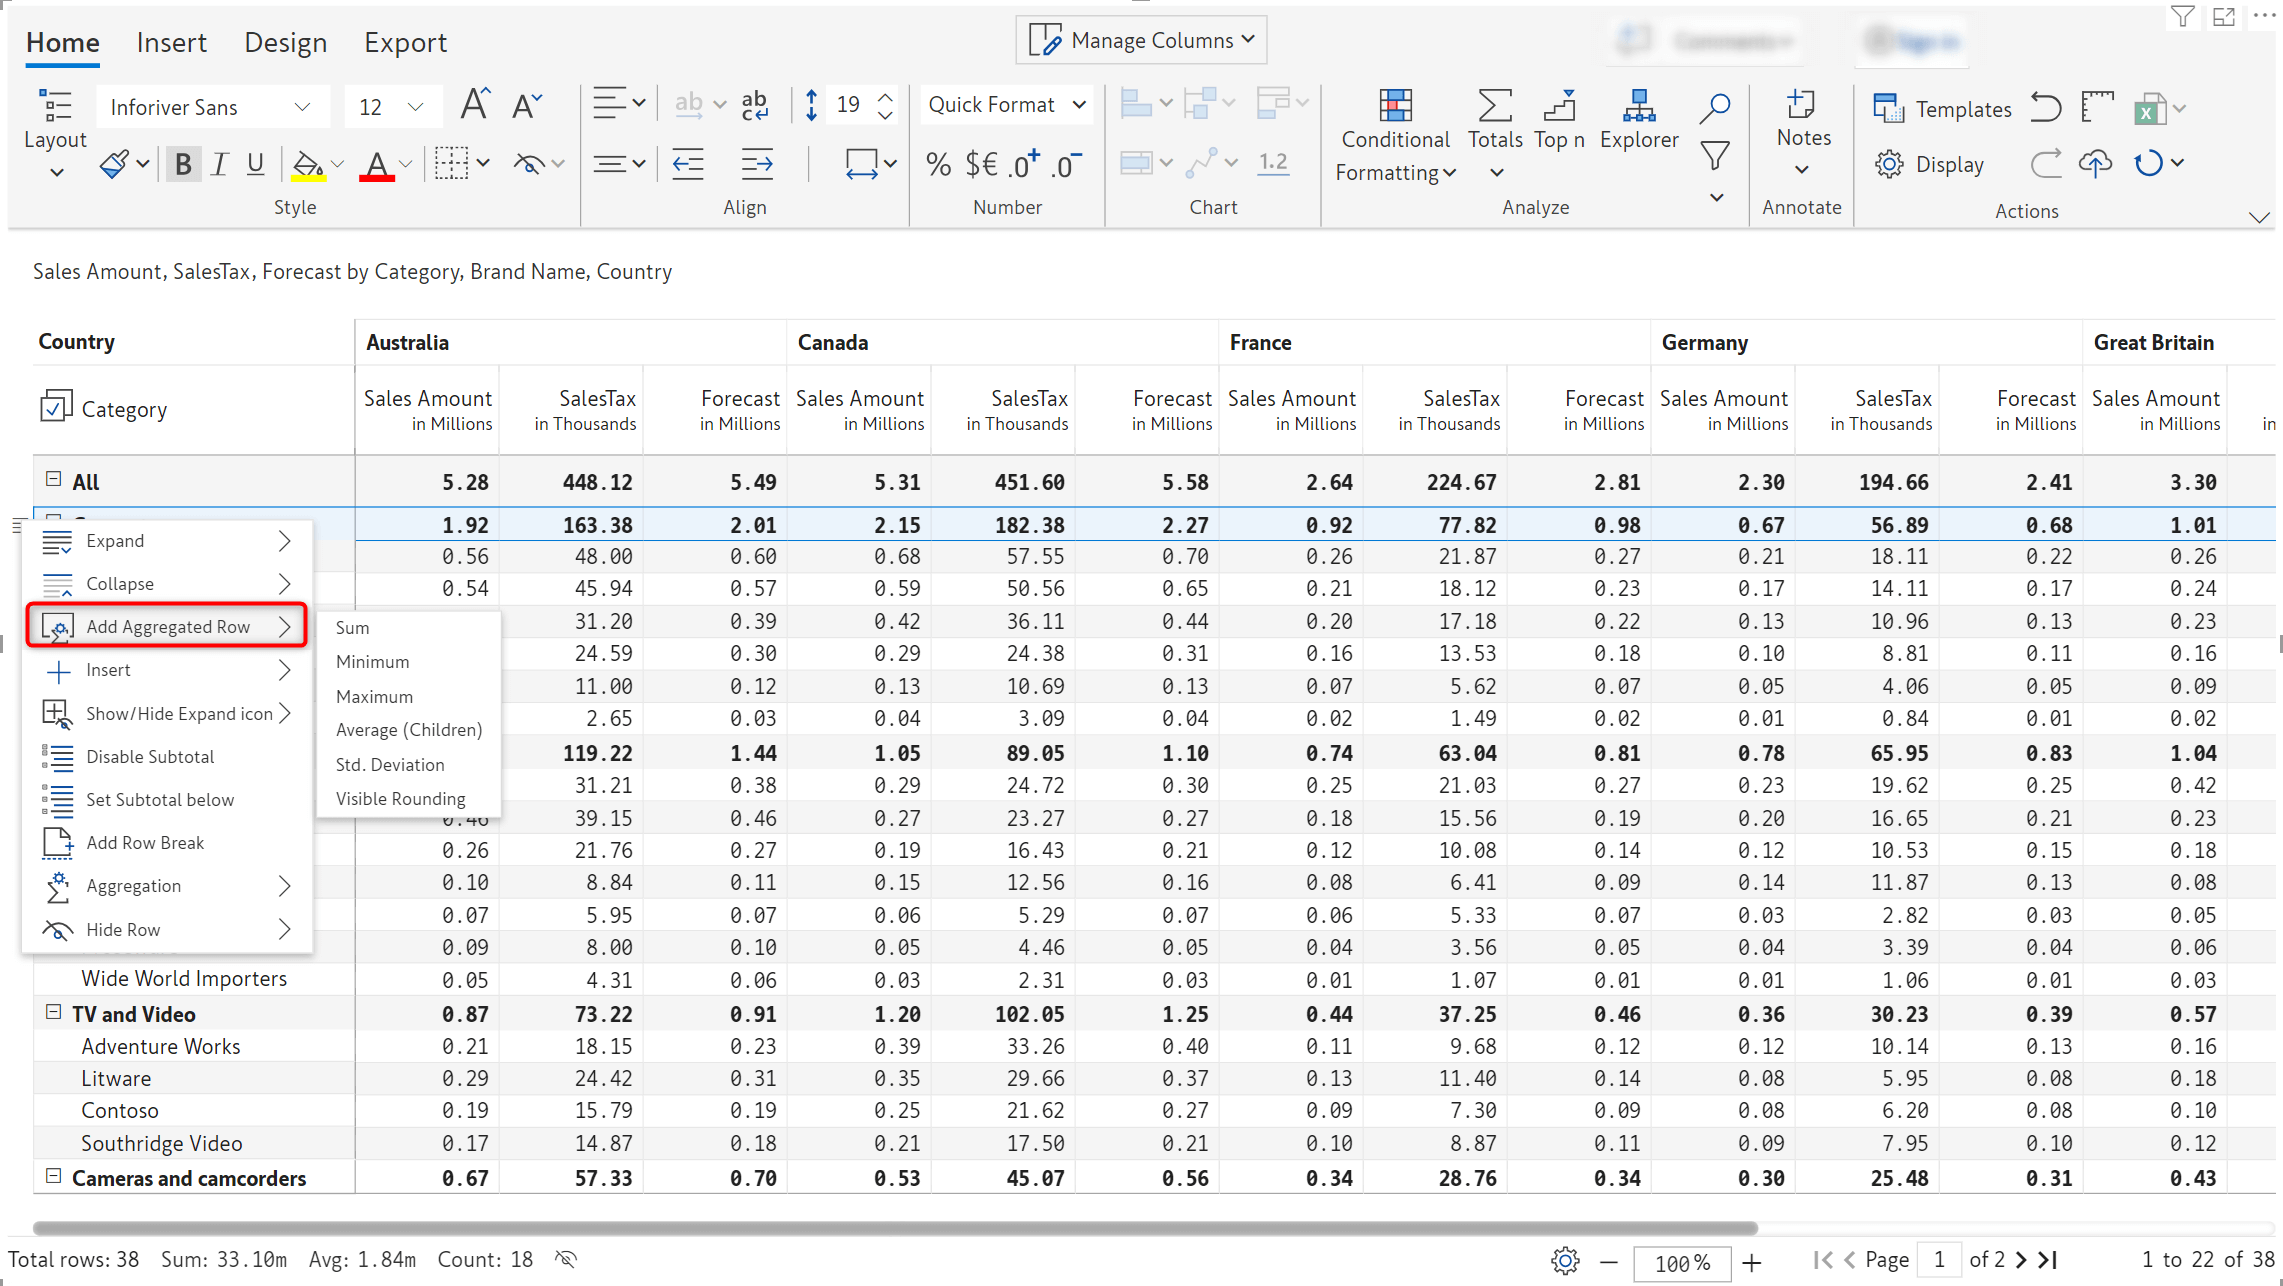
The new single click aggregation feature has been used to add Minimum, Standard Deviation and Average rows to the report, in addition to the default aggregation.
We'd love to hear your ideas for Inforiver – be it a cool new feature or an improvement on existing features. Visit the Inforiver Community to share your ideas, vote on other submissions, and interact with other users.

Inforiver helps enterprises consolidate planning, reporting & analytics on a single platform (Power BI). The no-code, self-service award-winning platform has been recognized as the industry’s best and is adopted by many Fortune 100 firms.
Inforiver is a product of Lumel, the #1 Power BI AppSource Partner. The firm serves over 3,000 customers worldwide through its portfolio of products offered under the brands Inforiver, EDITable, ValQ, and xViz.