Upcoming webinar on 'Inforiver Charts : The fastest way to deliver stories in Power BI', Aug 29th , Monday, 10.30 AM CST. Register Now
Upcoming webinar on 'Inforiver Charts : The fastest way to deliver stories in Power BI', Aug 29th , Monday, 10.30 AM CST. Register Now
Welcome to the Inforiver Premium 2.3 release update. We are thrilled to announce several new features and key enhancements to forecasting, formulas & functions, headers and UI/UX - most anticipated by our Inforiver community!
Key enhancements in this 2.3 release are listed below. Feel free to jump to any specific section!
The entire forecast interface has been substantially enriched and is powered by integrated time intelligence and time extension attributes so that customers can leverage Inforiver for Rolling forecasts.
1.1 Time Intelligence
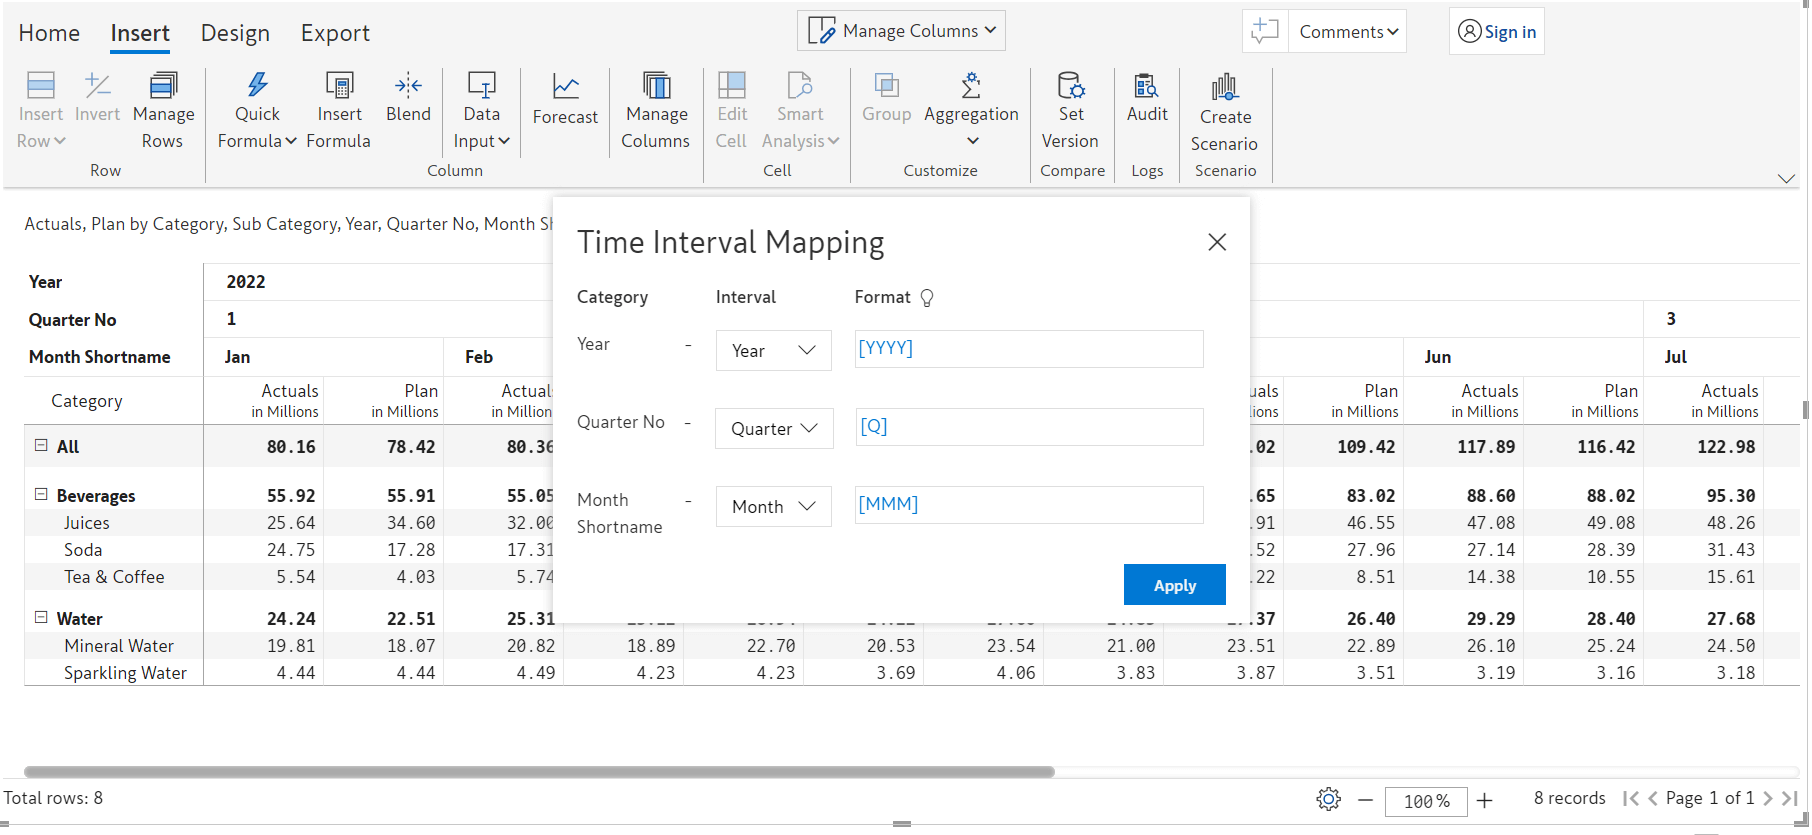
Time intelligence has been incorporated to automatically detect date formats even when source data is not in Power BI date format. In the image below, Inforiver identifies the formats when the quarter is denoted in numbers and months are denoted as short names.
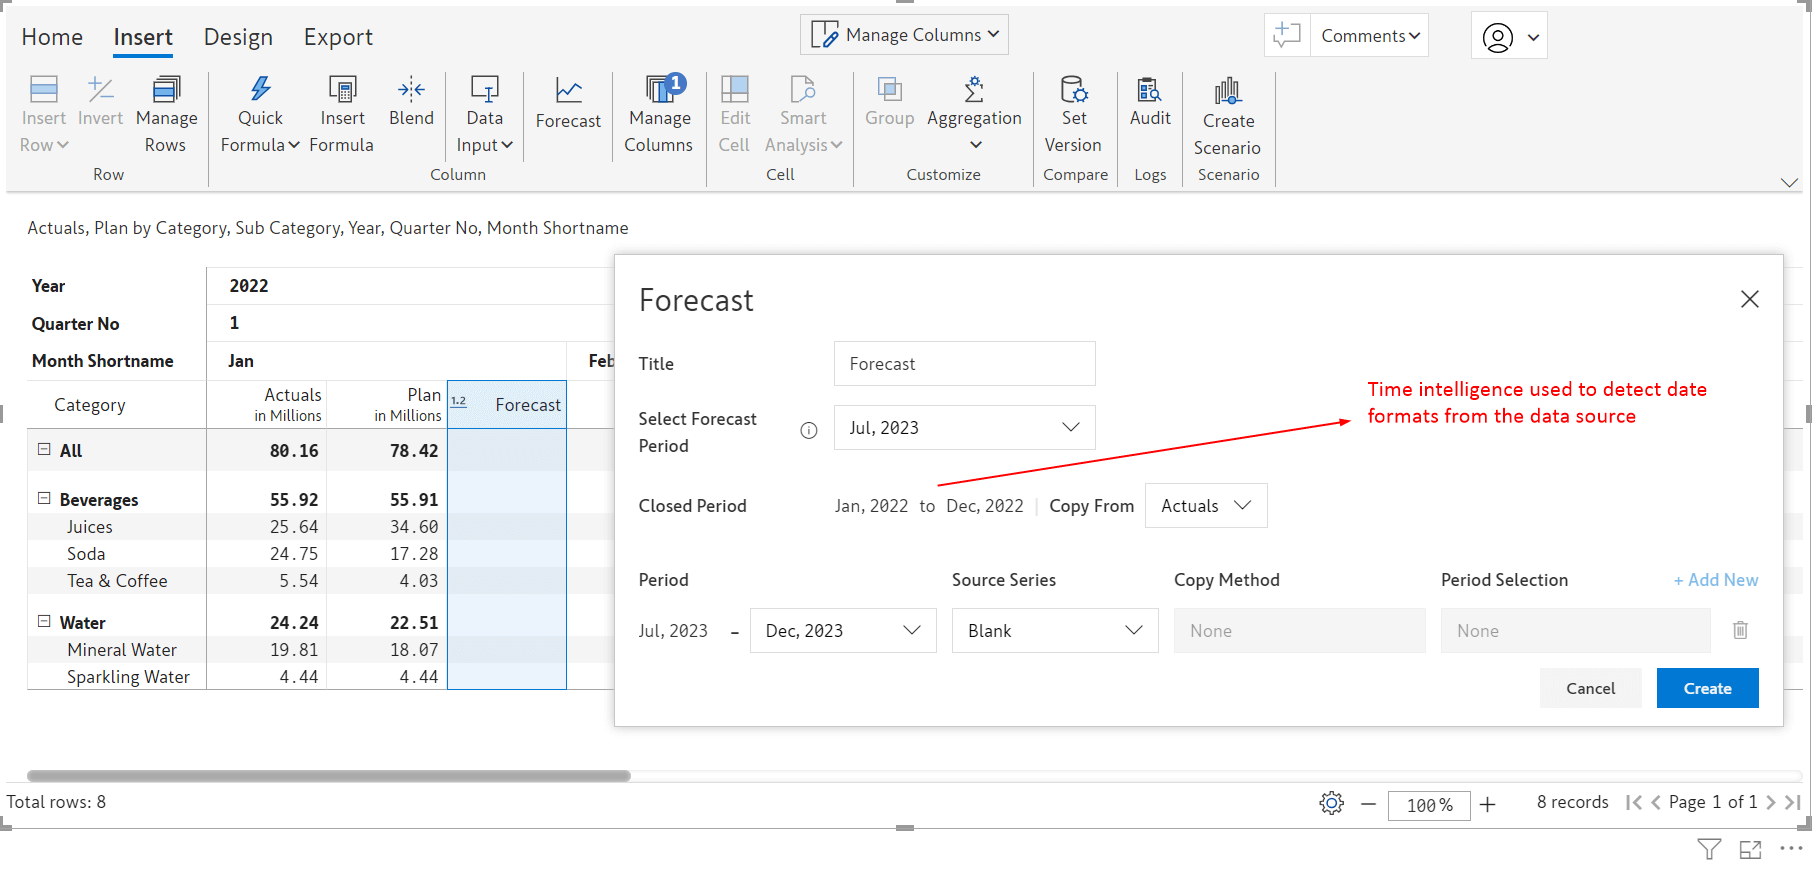
You can override the time intelligence formats as well if required.
1.2 Time Extension
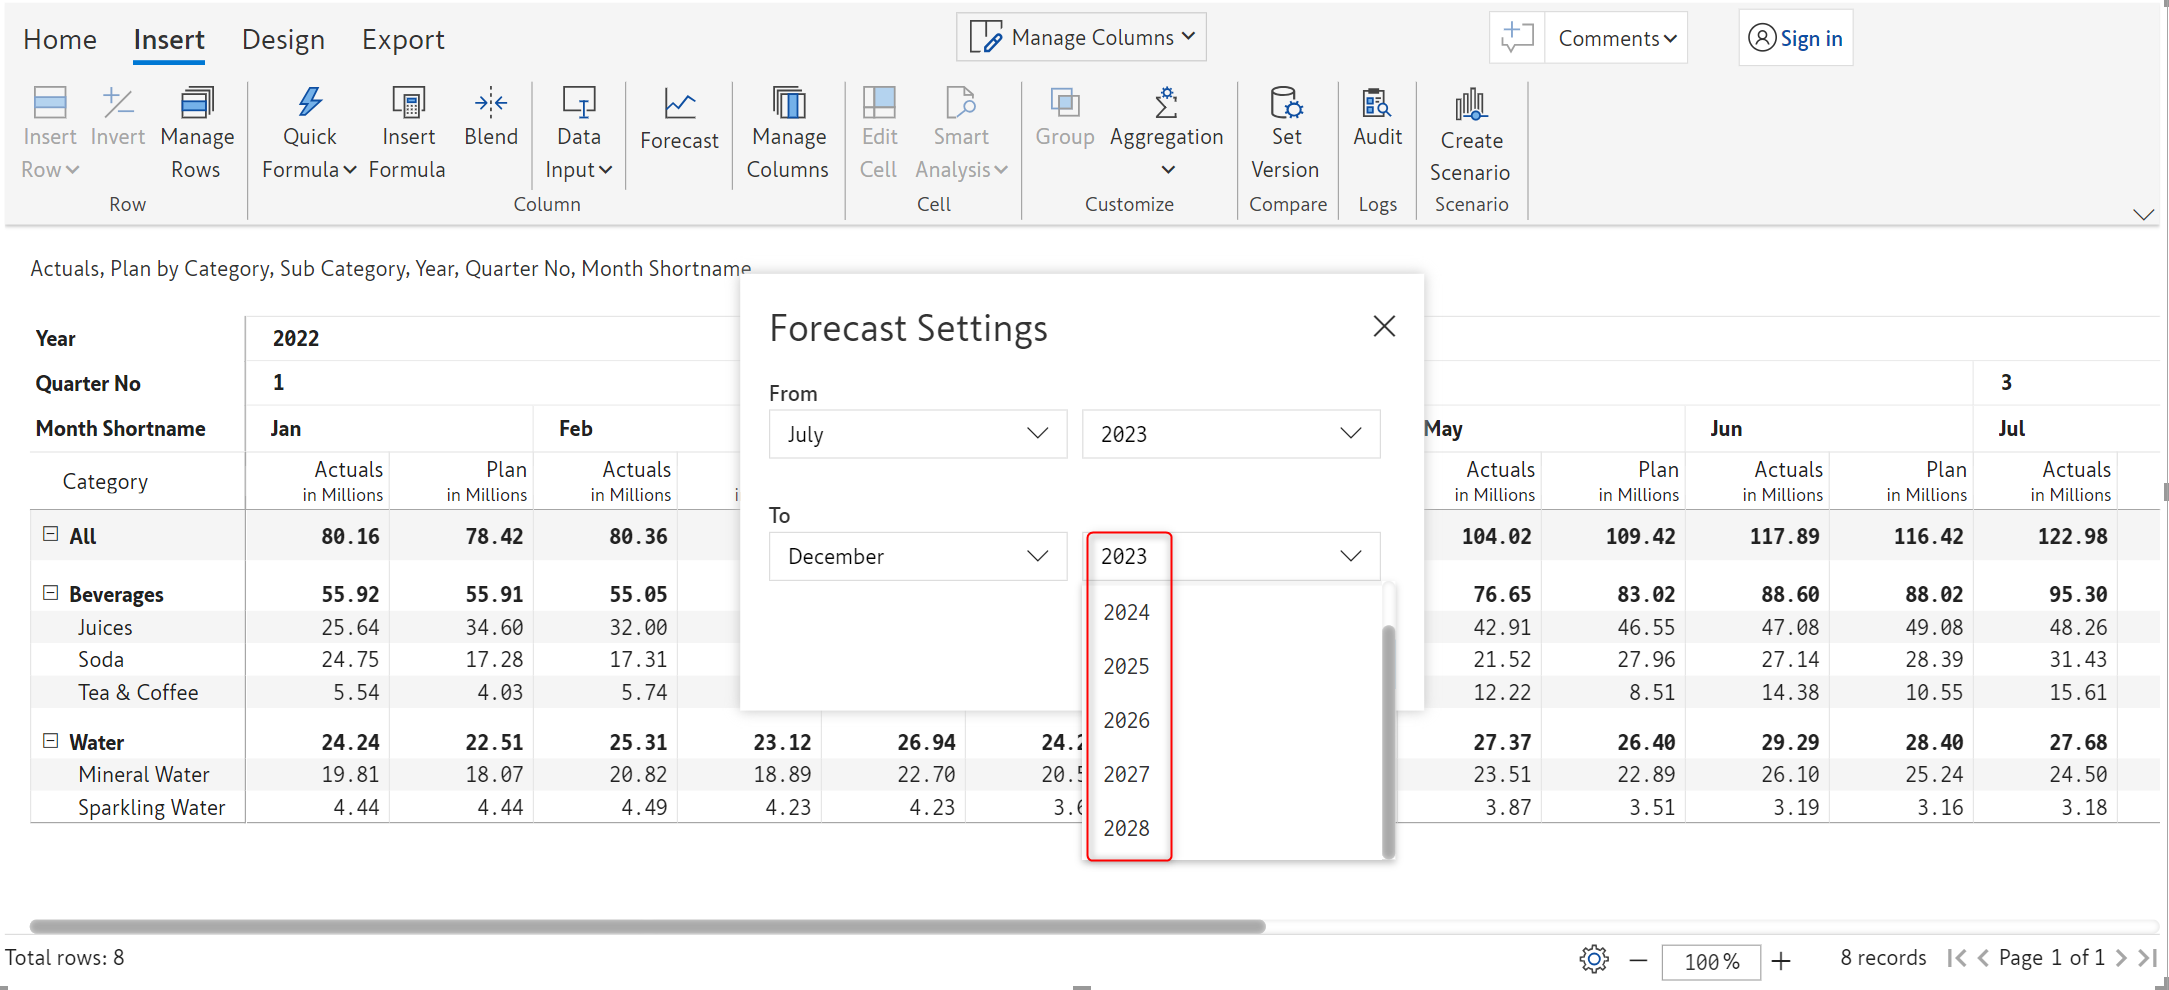
Inforiver 2.3 allows you to generate a forecast for a future period of up to 5 years even if those time dimension values are not coming from actual dataset values.
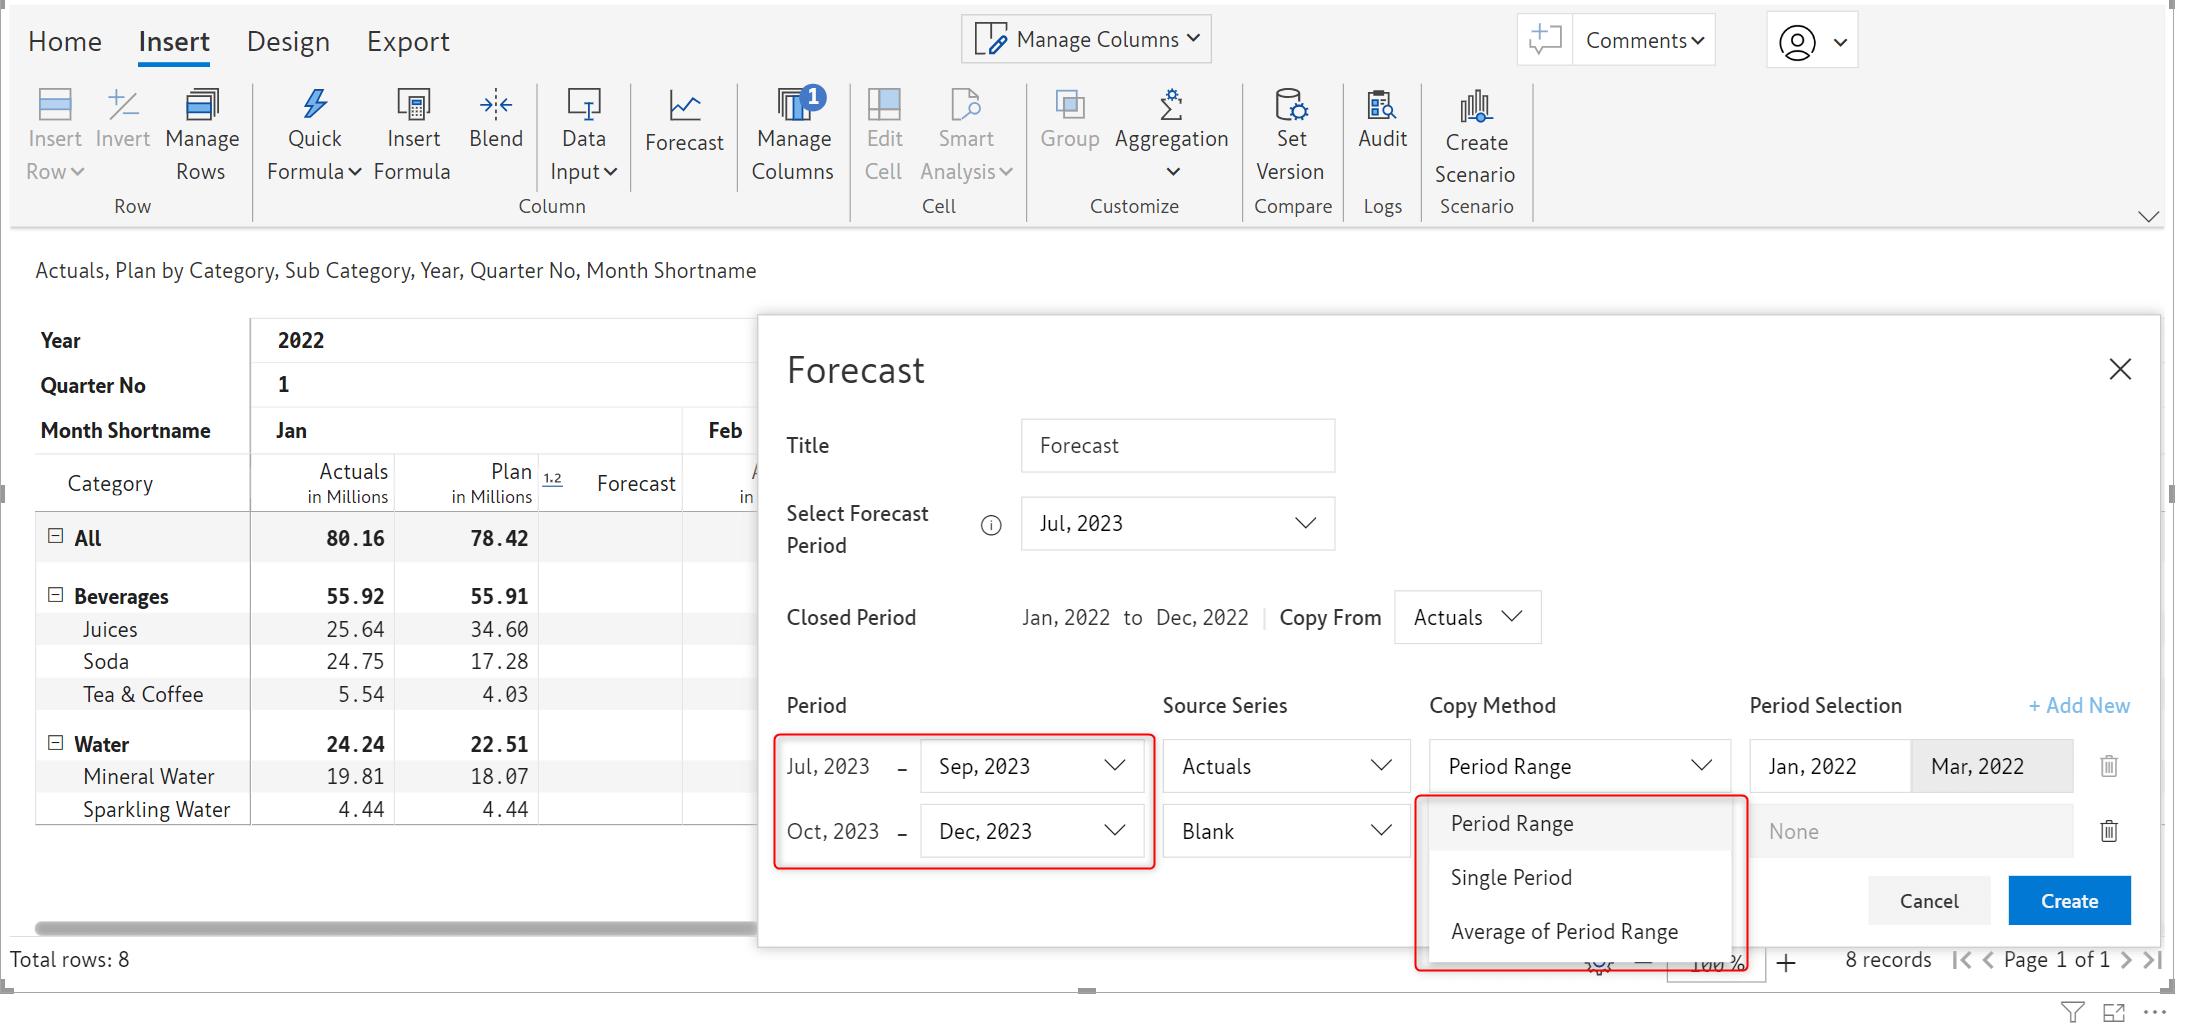
The options available for initializing a forecast have been augmented to provide greater flexibility. You can split the forecast period and use methods like period range, average of period range to initialize the forecast.
The forecast revamp is part of Inforiver Enterprise as well as Inforiver Premium, however additional features like writeback that complement forecasting are only available in Inforiver Enterprise.
2.1 Custom total and subtotal aggregation
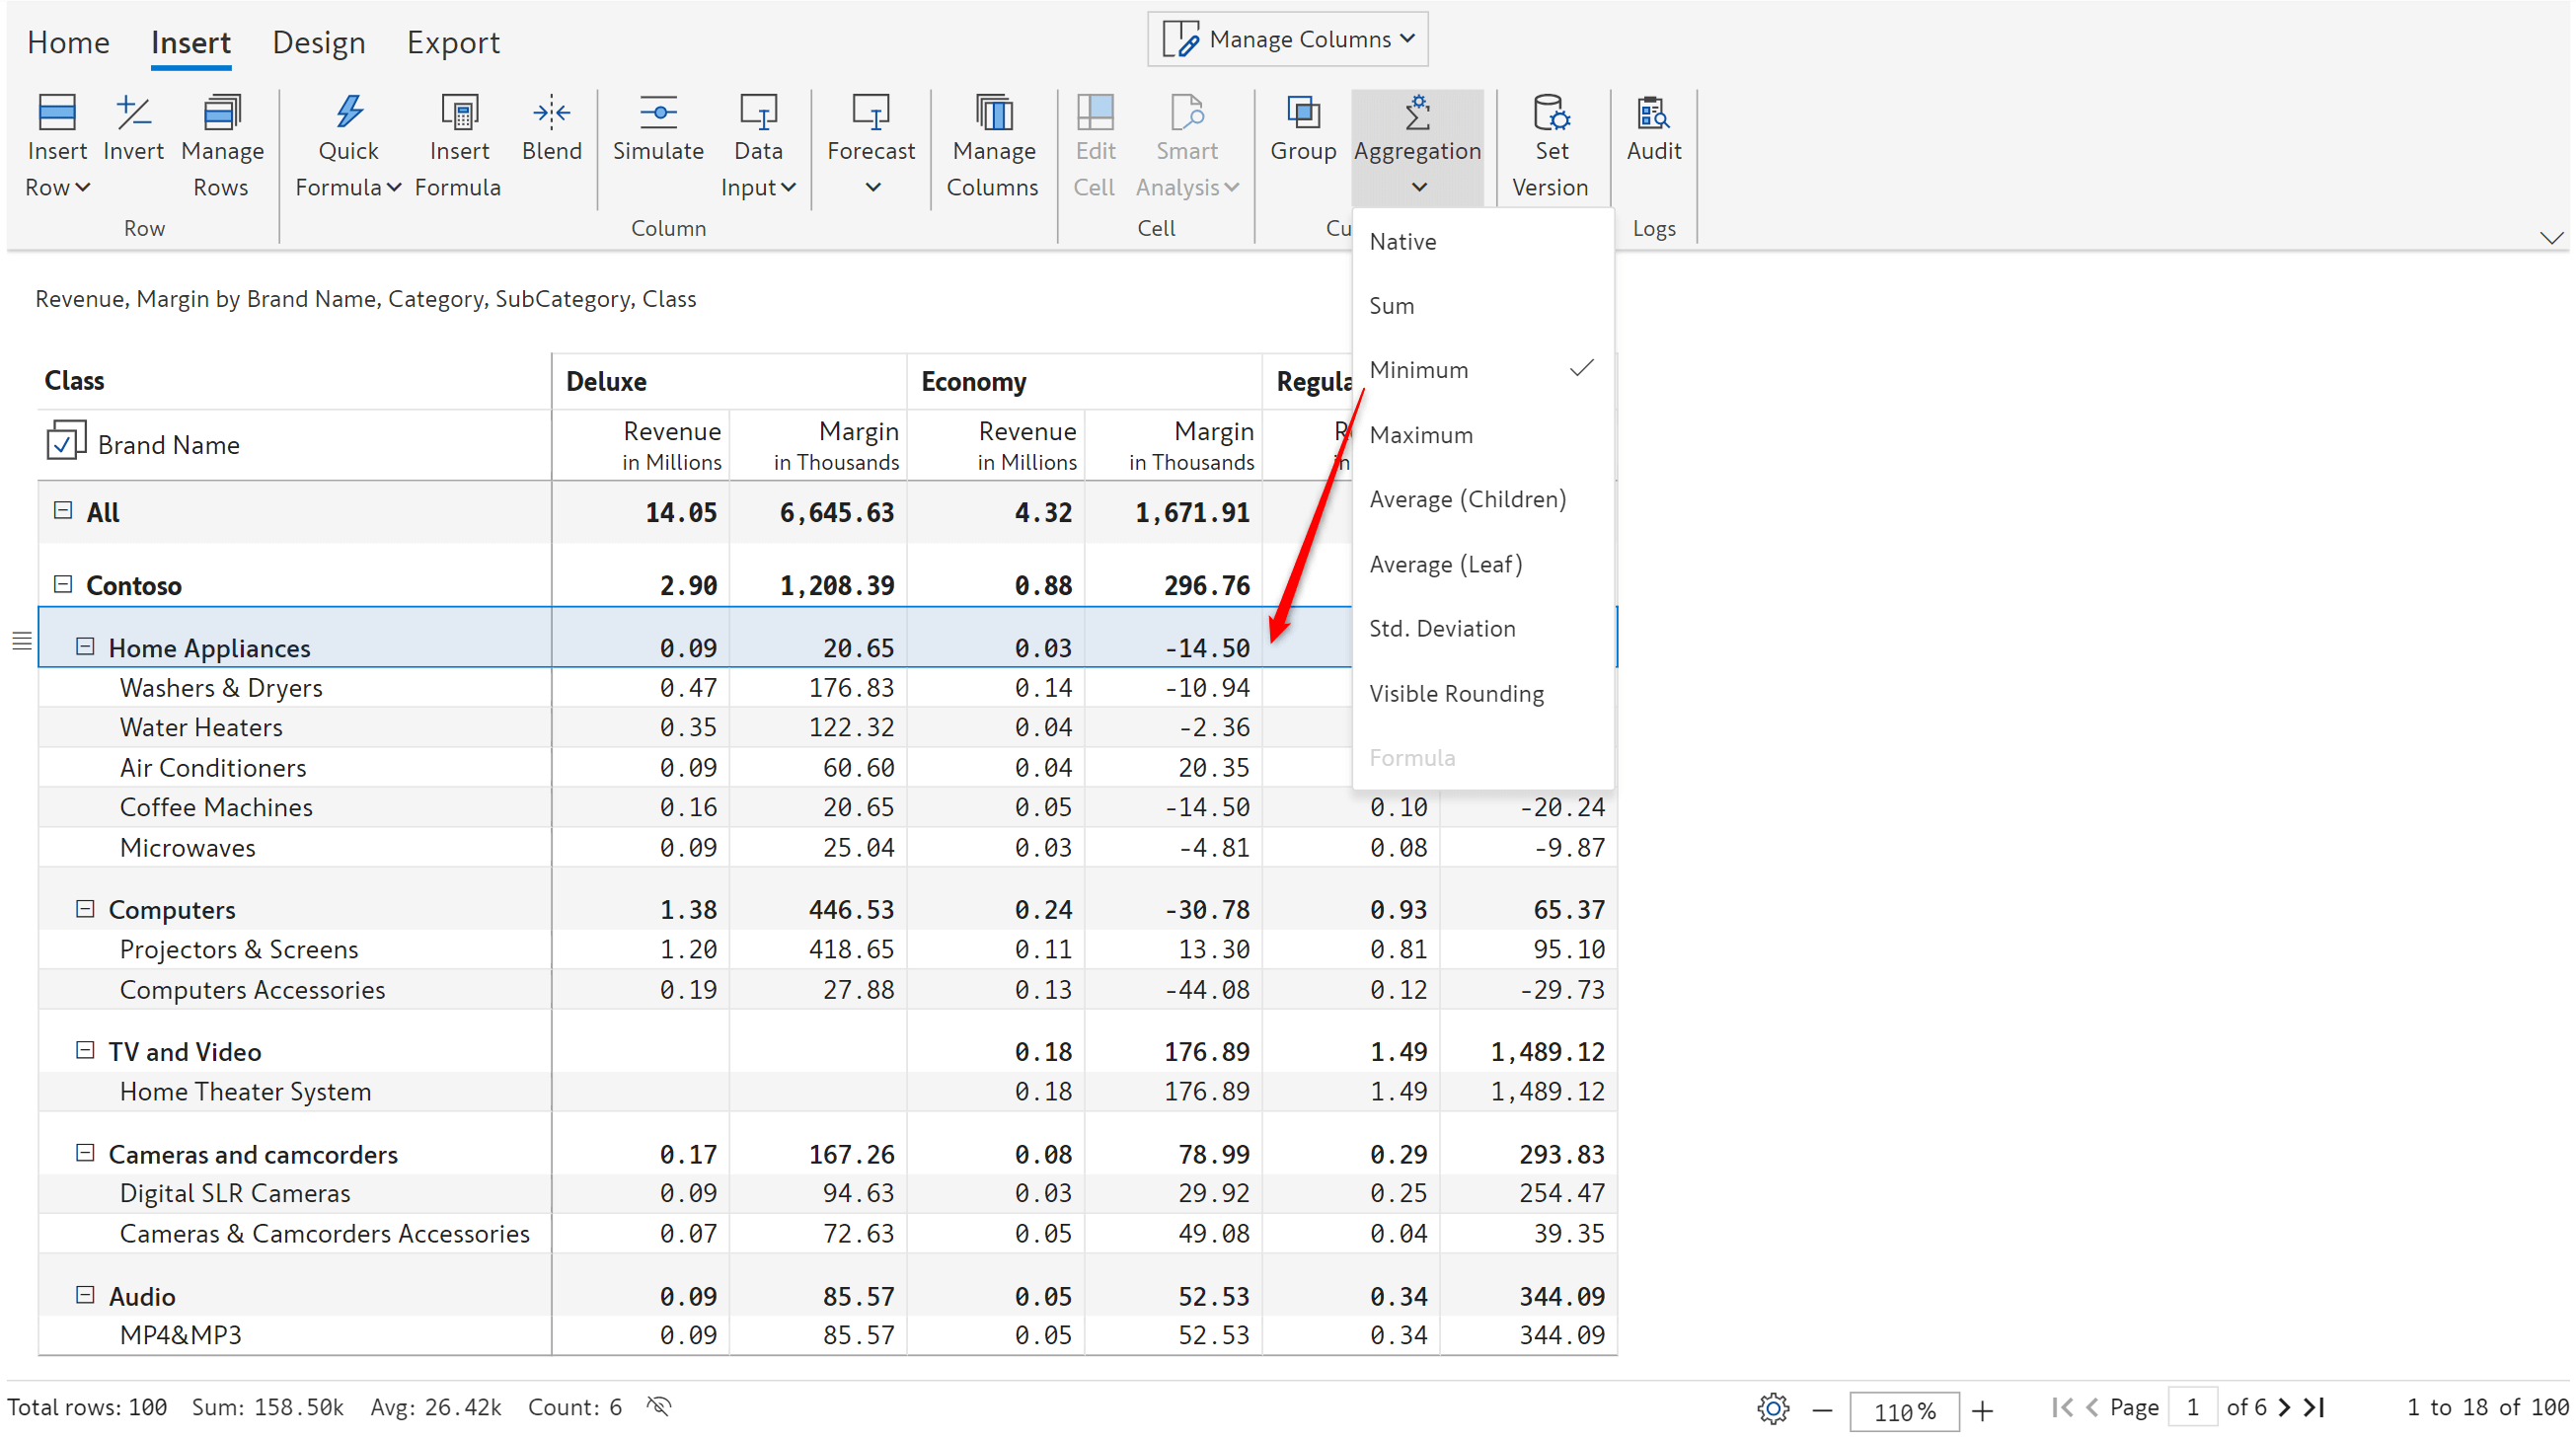
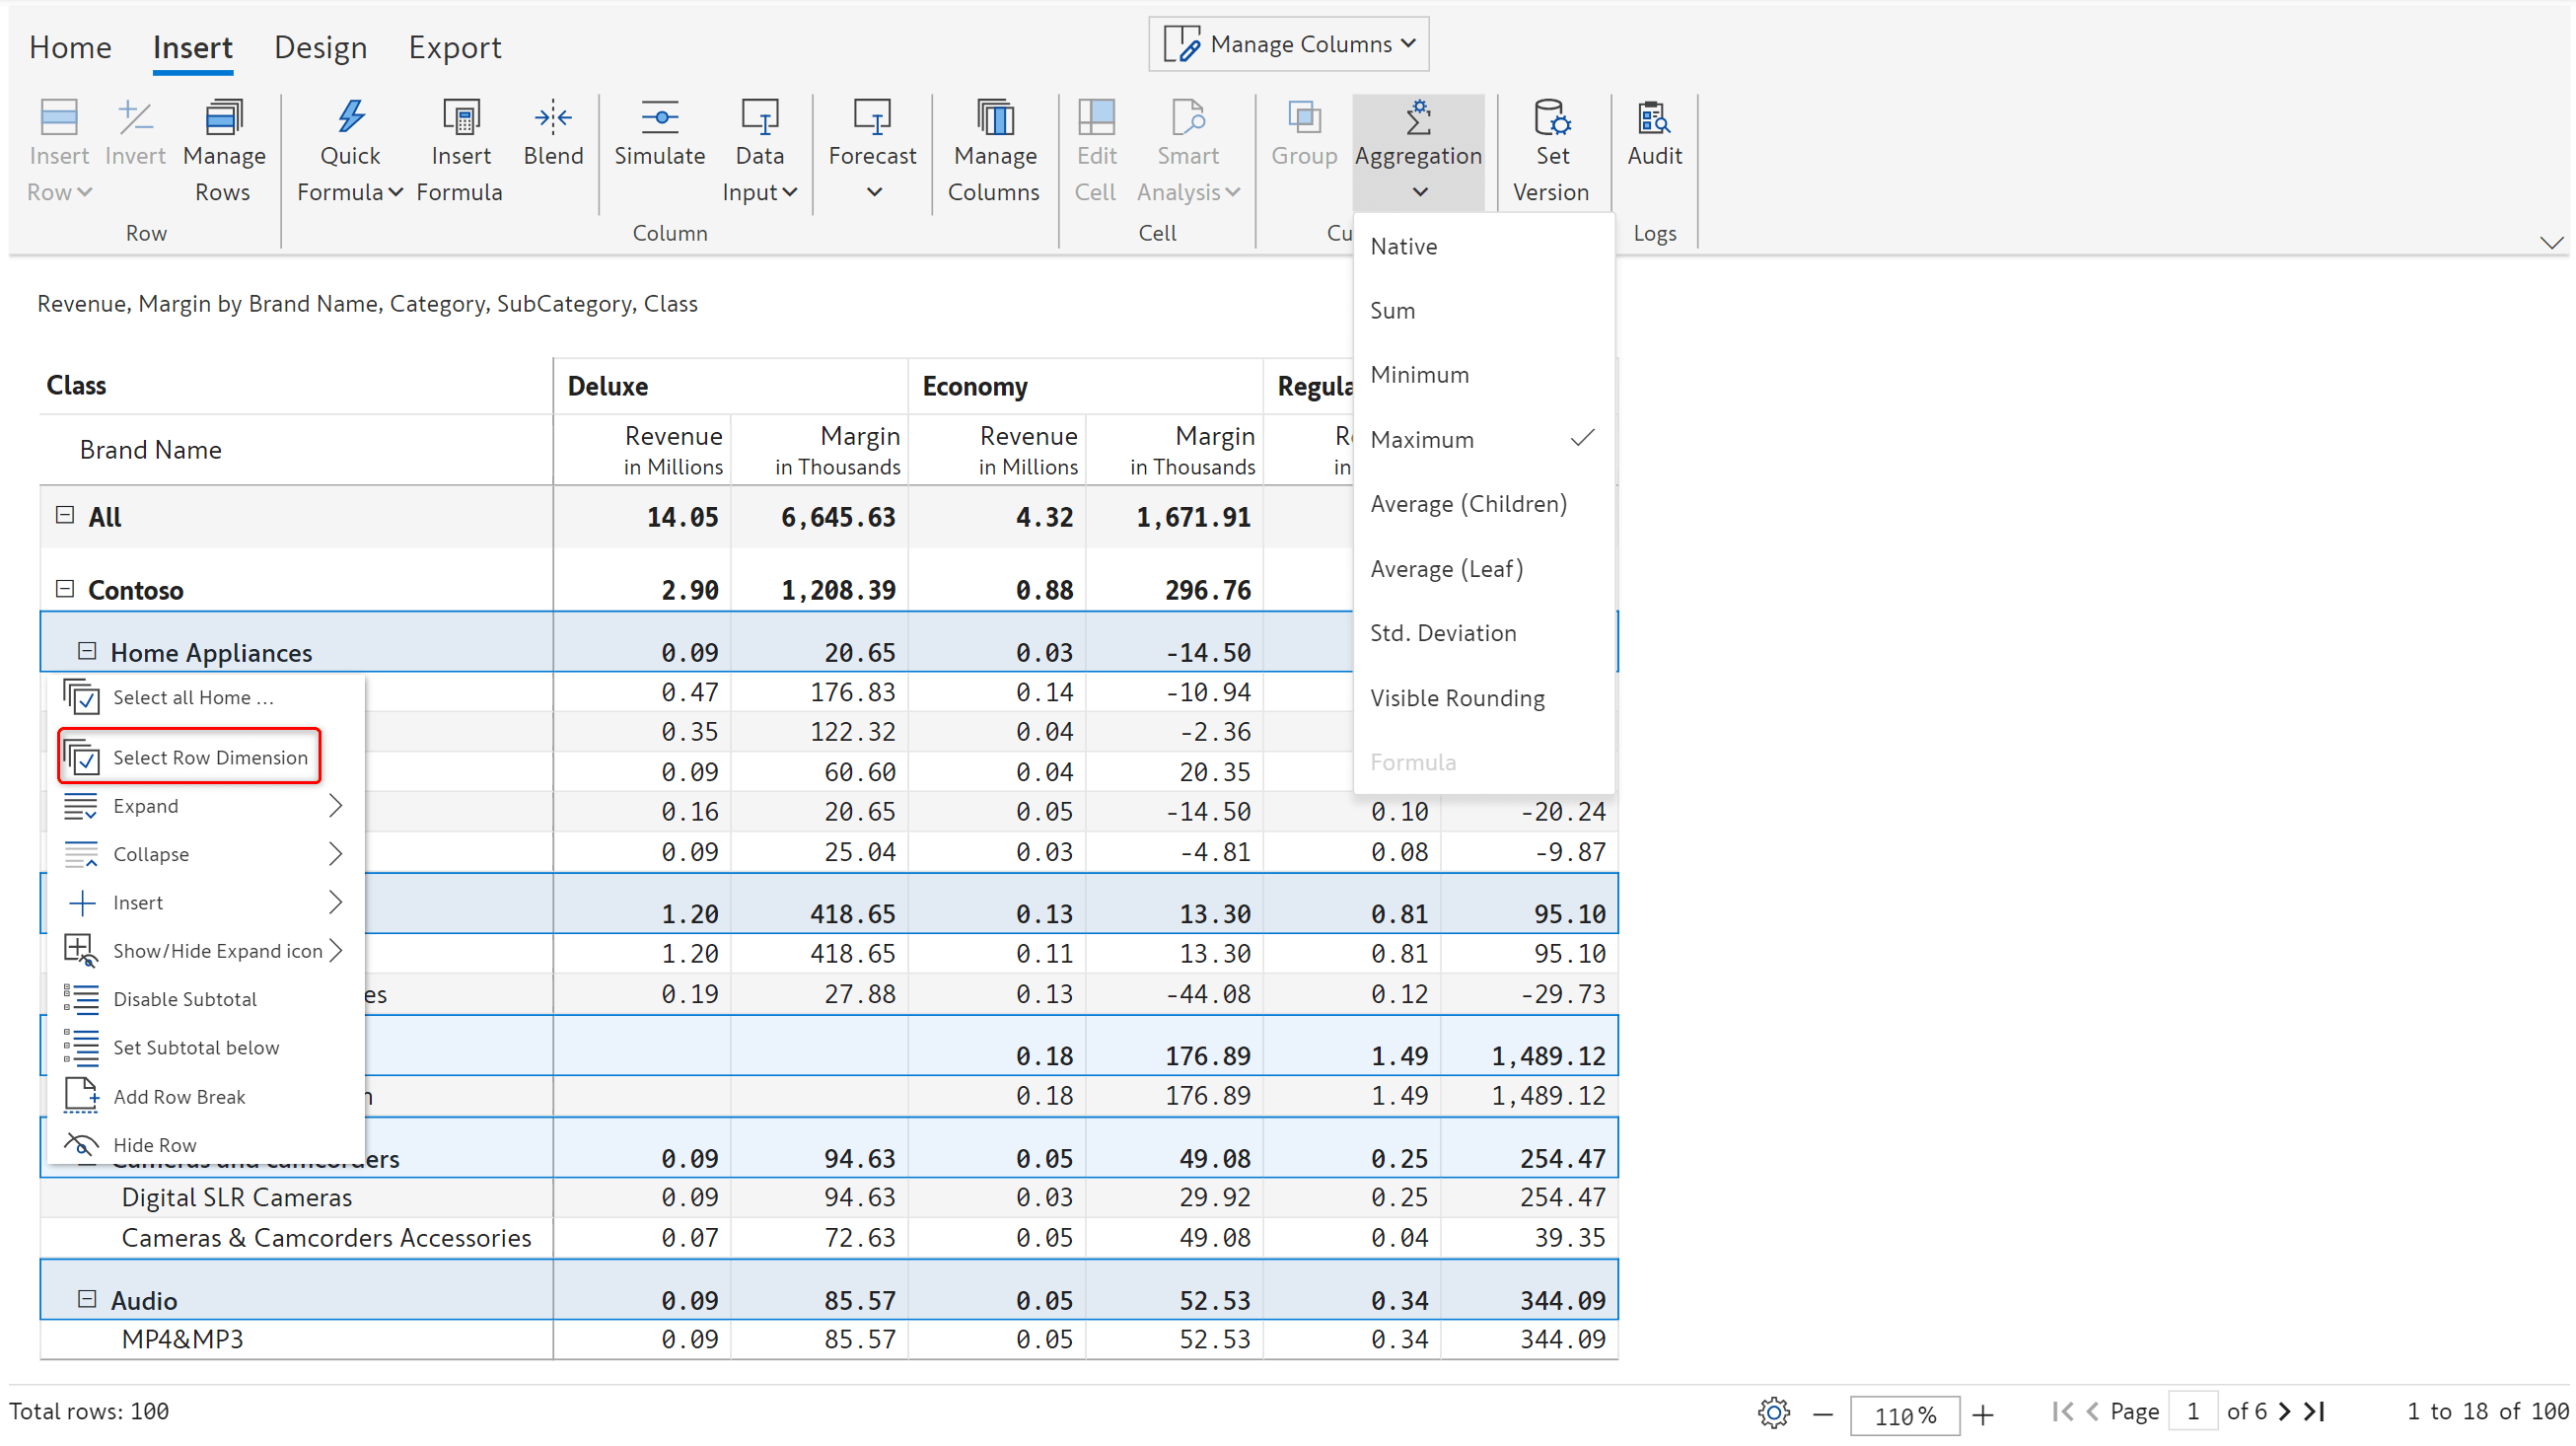
Row aggregation has been significantly enhanced to support aggregation for a selected branch of the hierarchy, for an entire hierarchy level and different aggregation methods for different levels simultaneously. On selecting a parent row, the aggregation option is enabled in the toolbar, and you can apply any of the available methods. On applying minimum aggregation for Home Appliances, you can see that native aggregation is retained for Computers & Cameras and camcorders.
To apply an aggregation type to a level of hierarchy, select a row, choose ‘Select row dimension’ from the row gripper and then select the aggregation type from the dropdown.
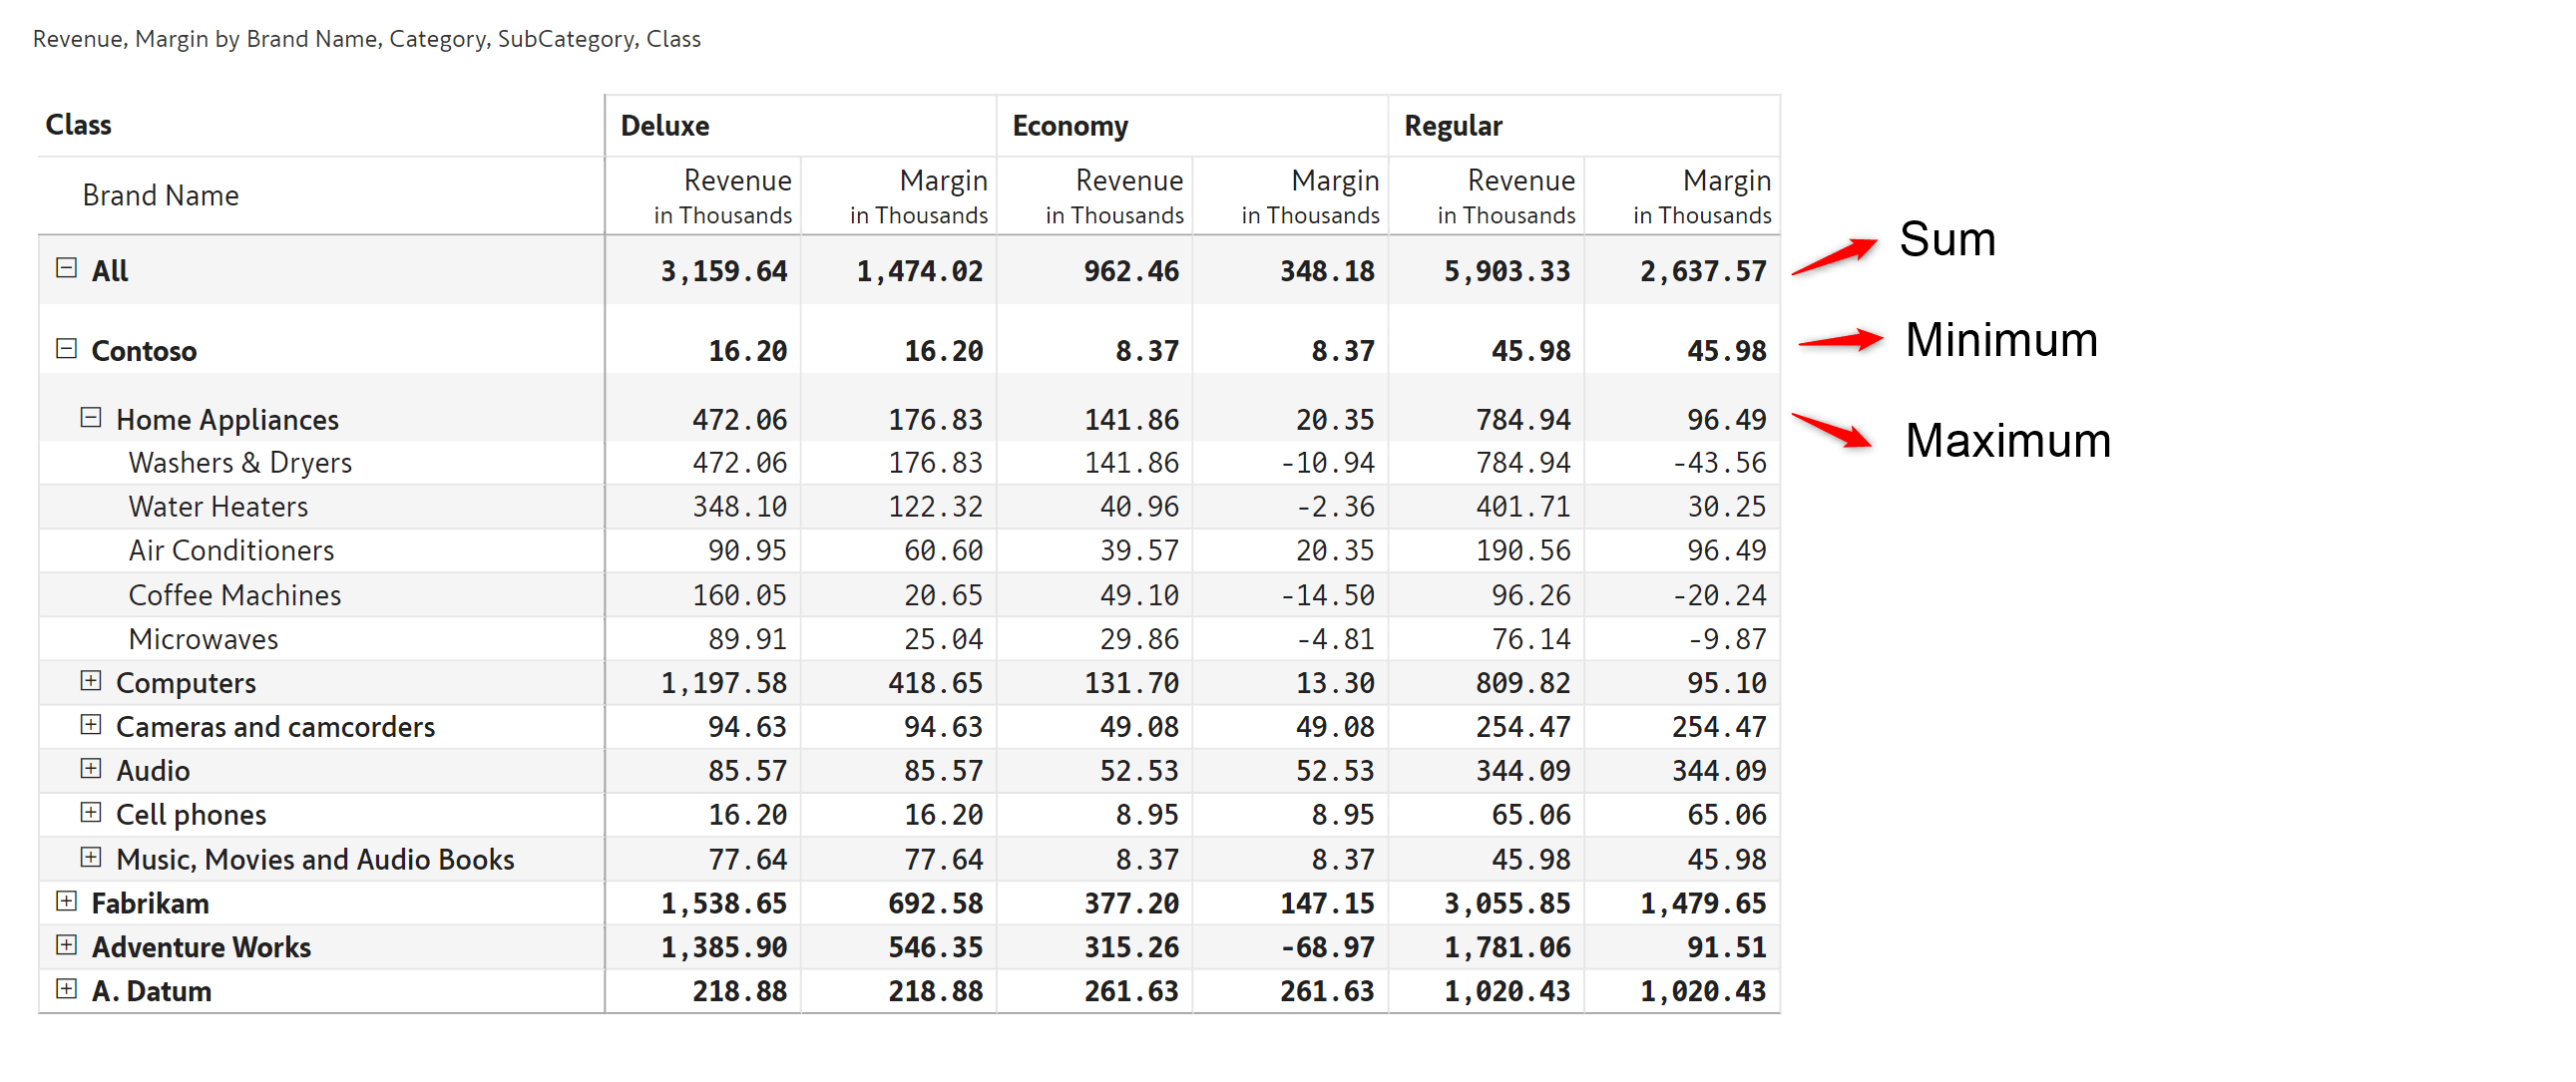
With the version 2.3 release, you can apply different aggregation methods for different levels of the hierarchy as shown in the below image.
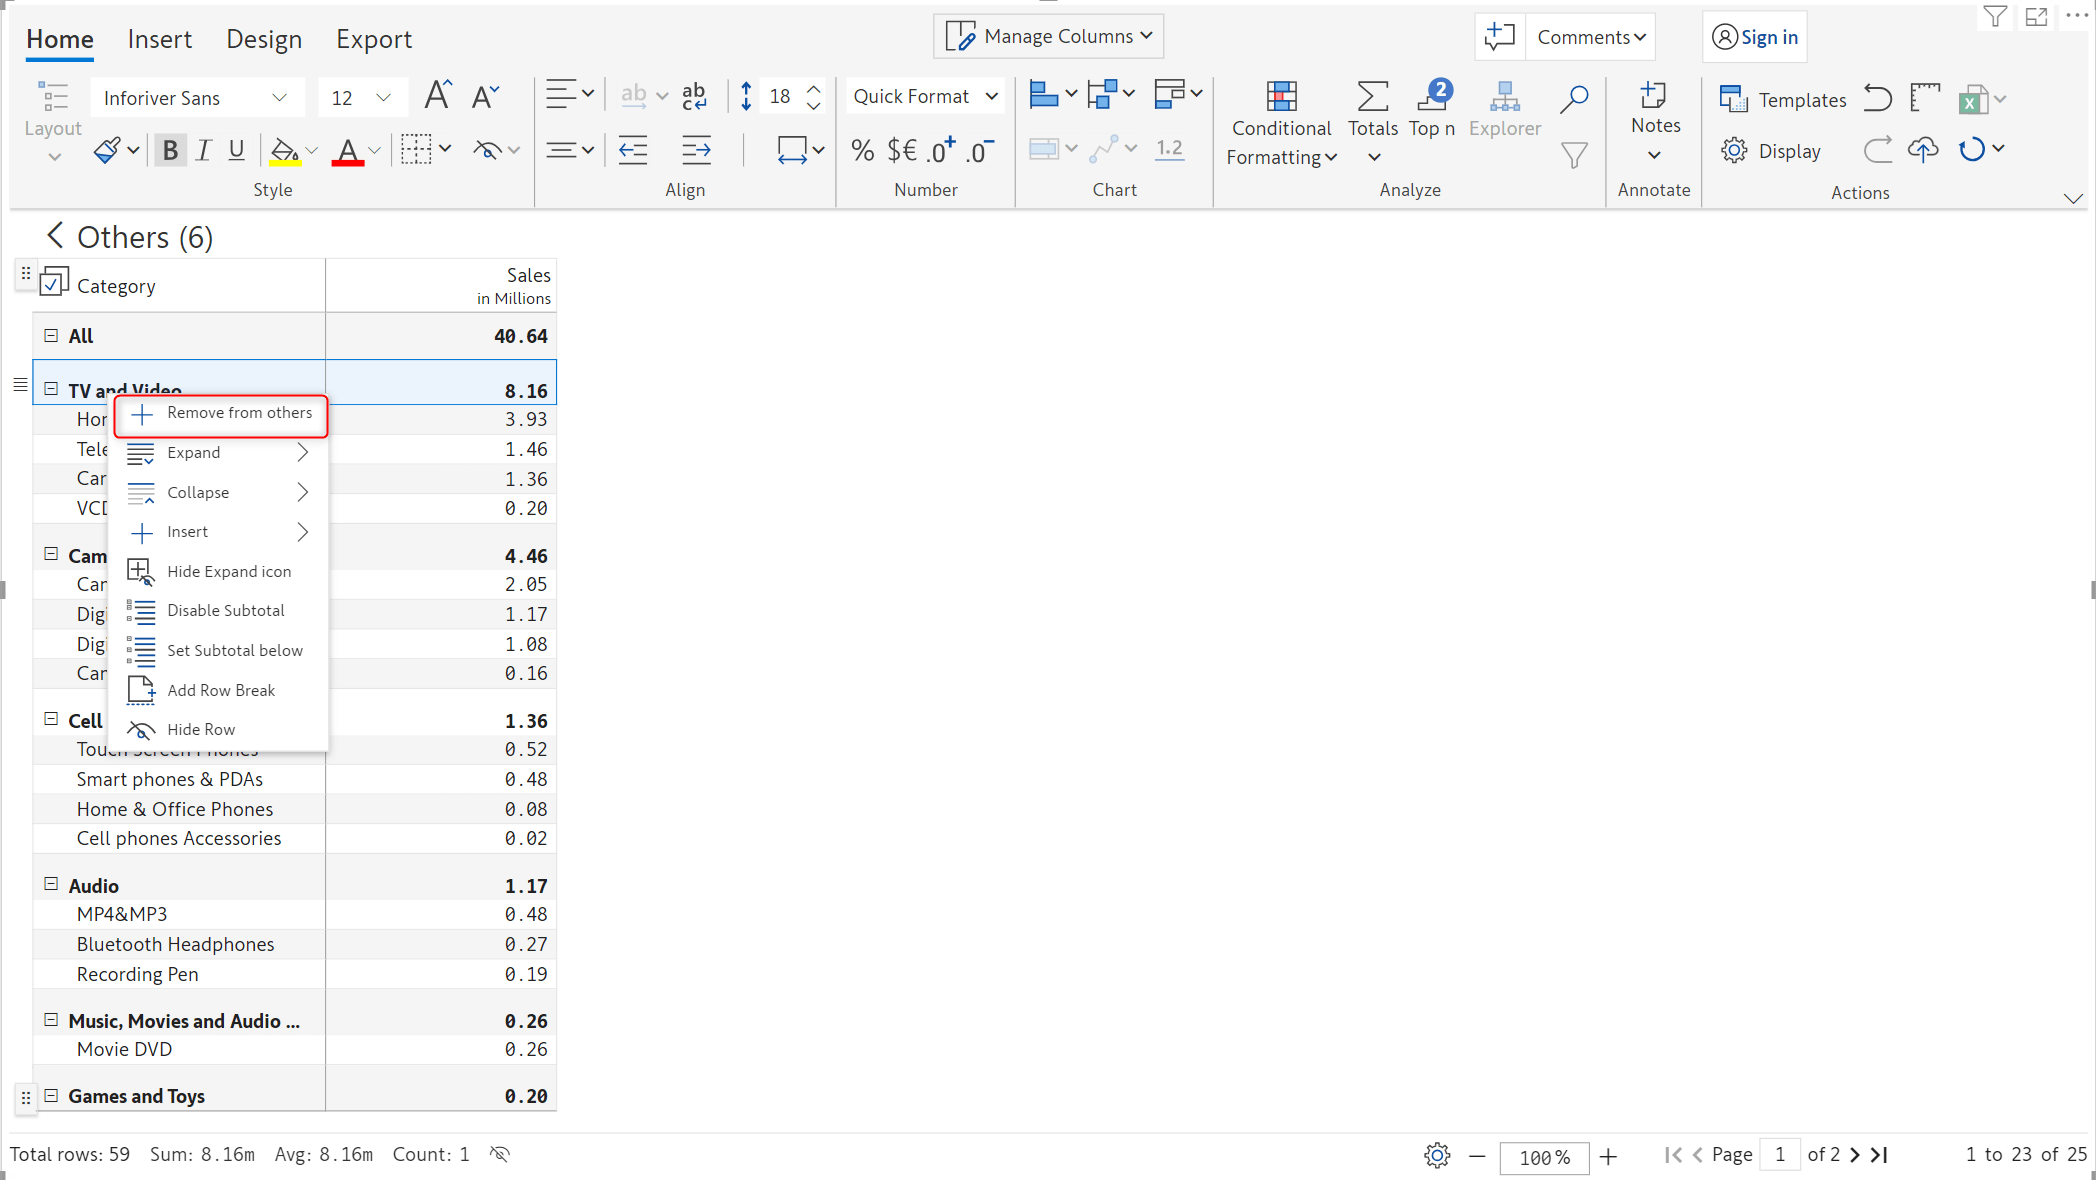
Categories that are part of ‘Others’ when top/bottom rules are applied can be removed from the others group by clicking on the row and selecting ‘Remove from others’ from the gripper.
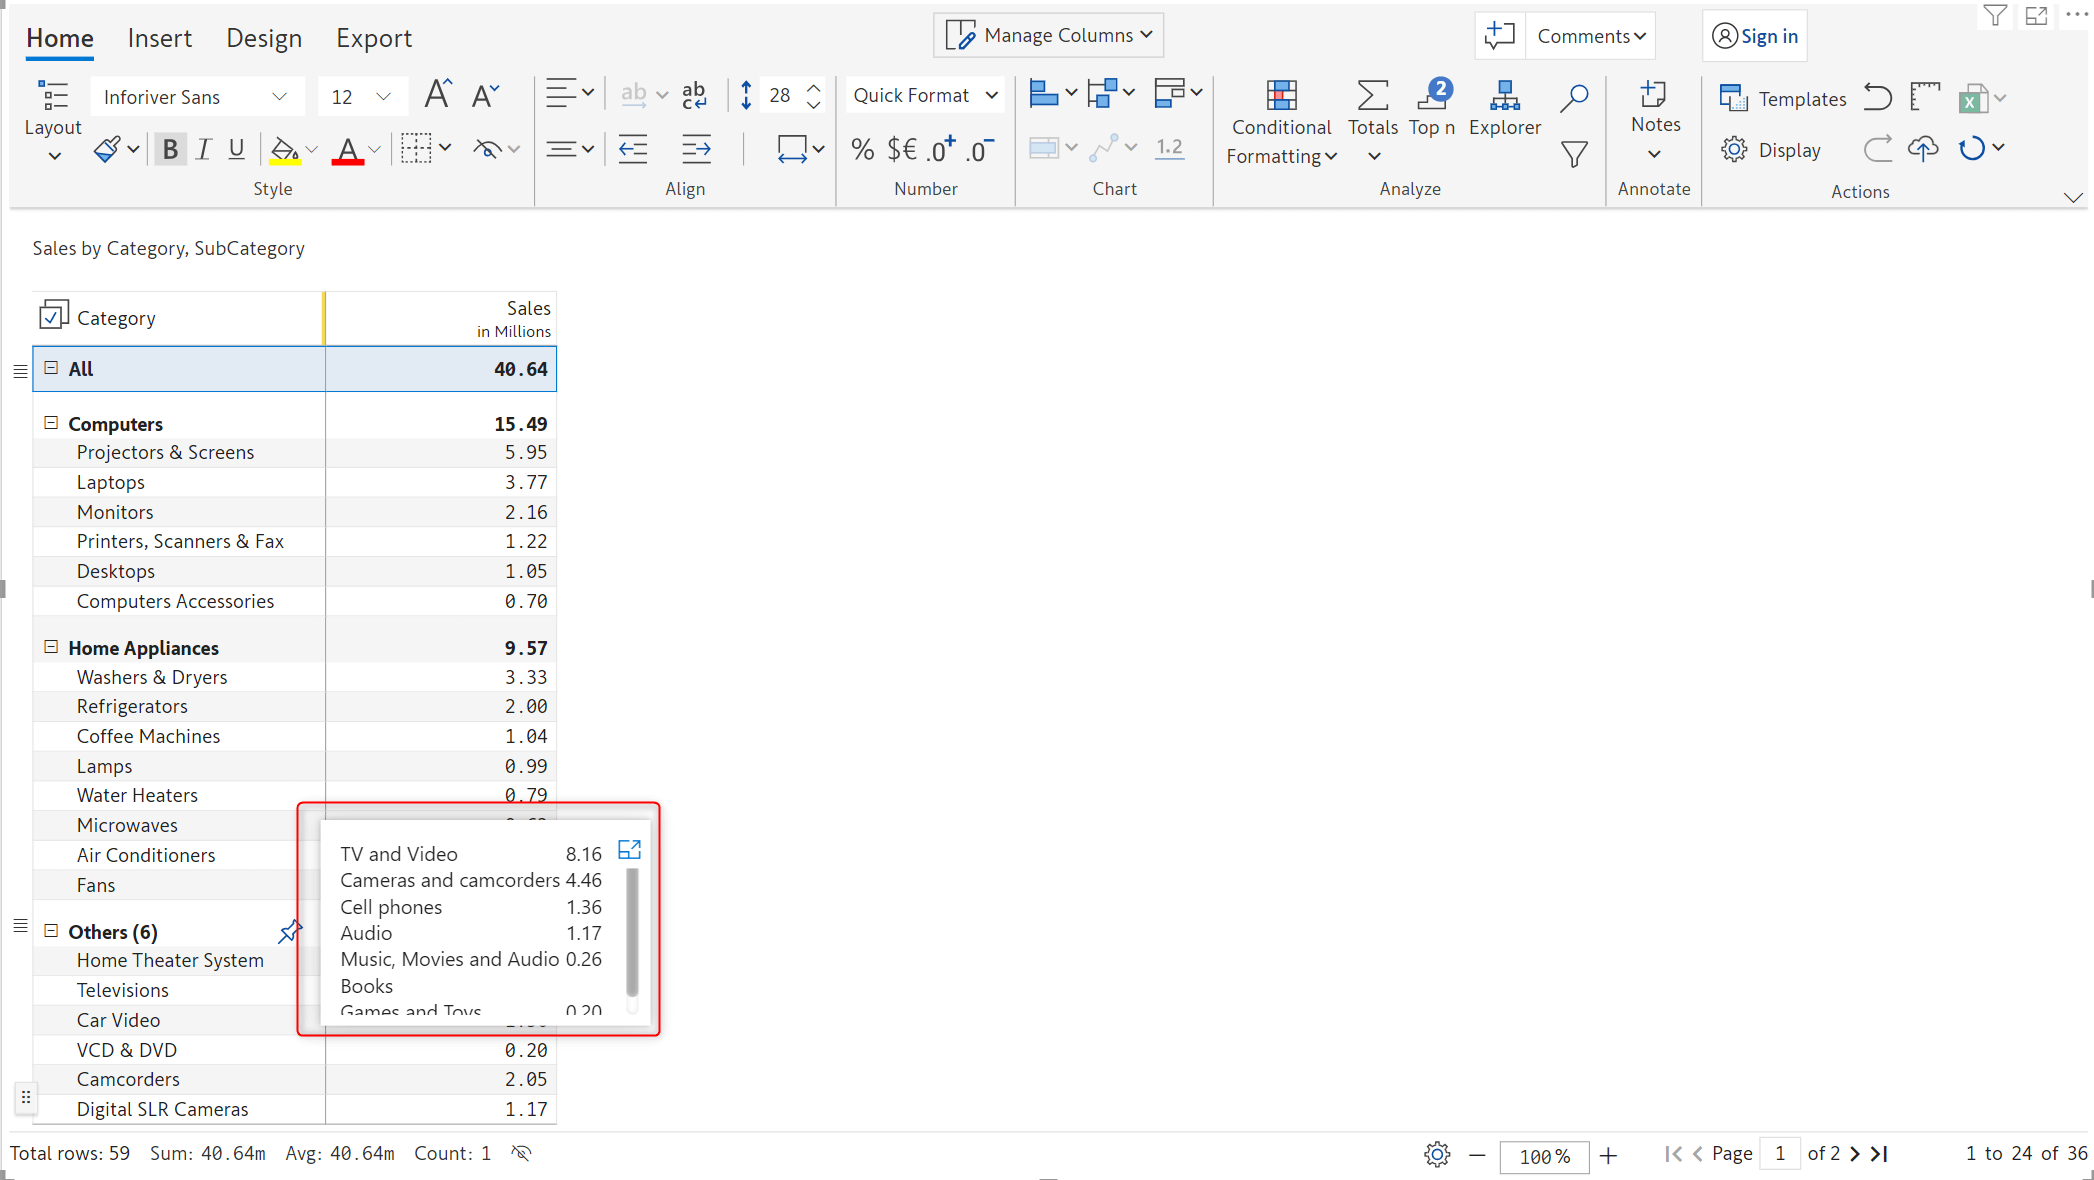
The categories in ‘Others’ can be previewed along with the measure values on hover as shown below.
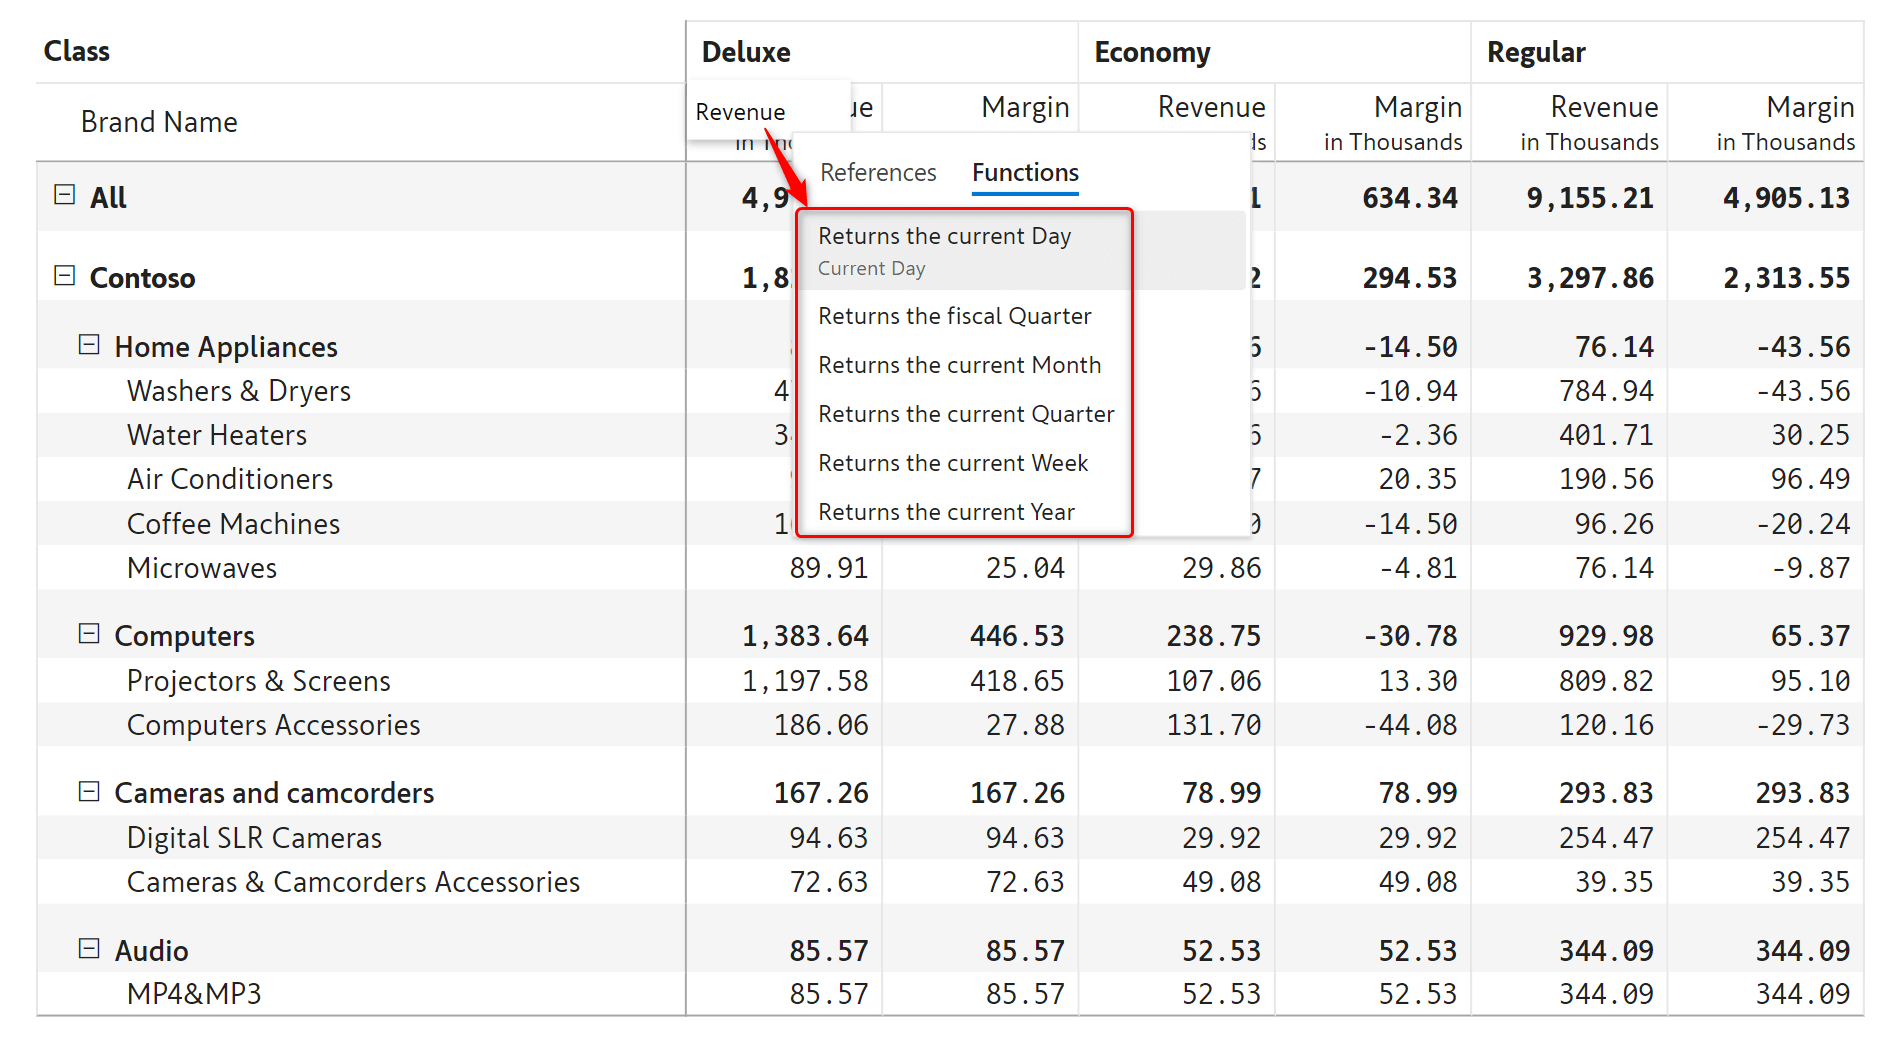
There are two ways to create dynamic measure headers. The first option is to use predefined functions such as current day, current month etc. as shown in the below image. To enable the function list, double-click on the measure and click on Ctrl and Space.
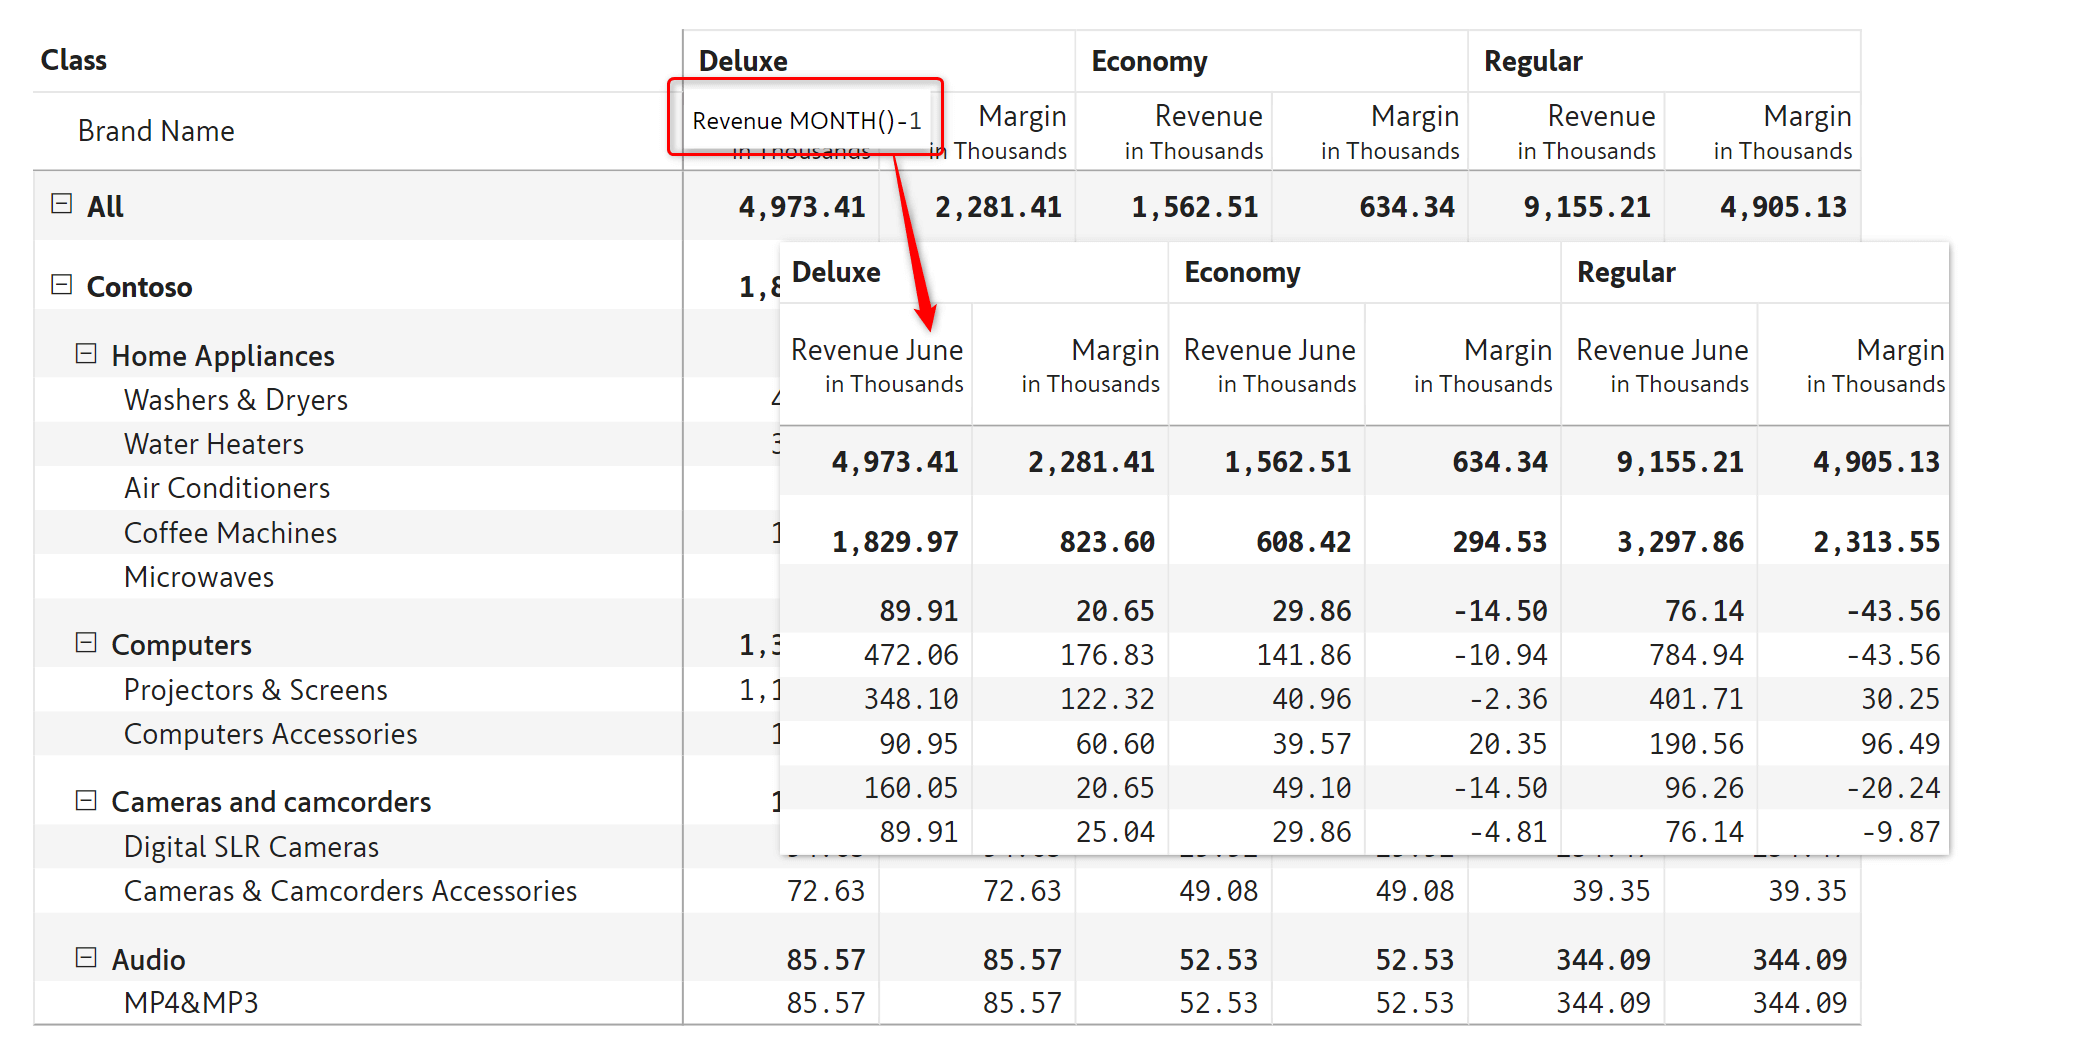
Simple operations such as + and – can be used to reference future or past periods. In this example, the current month is July and MONTH()-1 returns June.
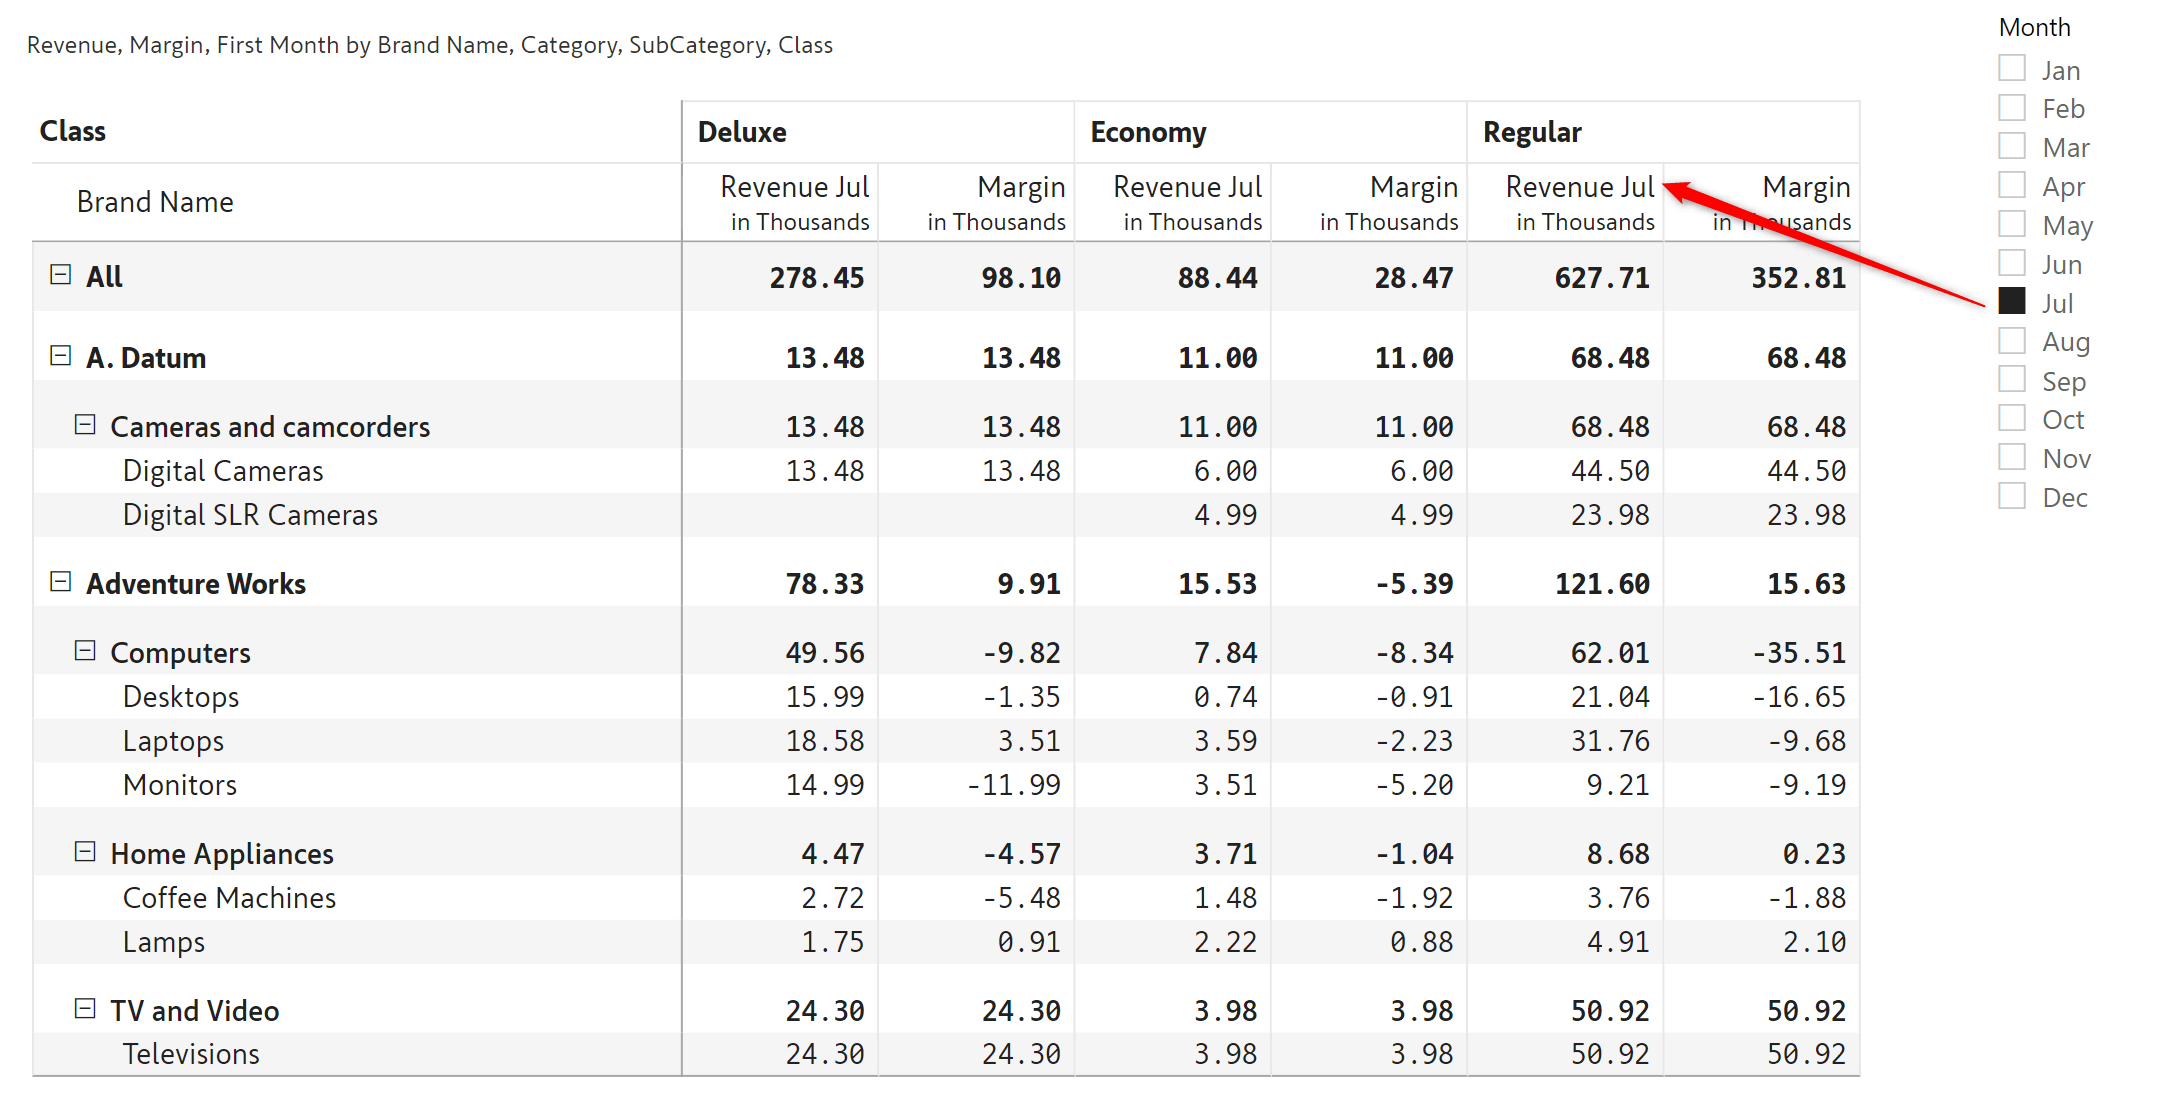
The other option is to name the header based on a slicer selection. Based on the month selected in the slicer, the suffix needs to be added for the Revenue measure.
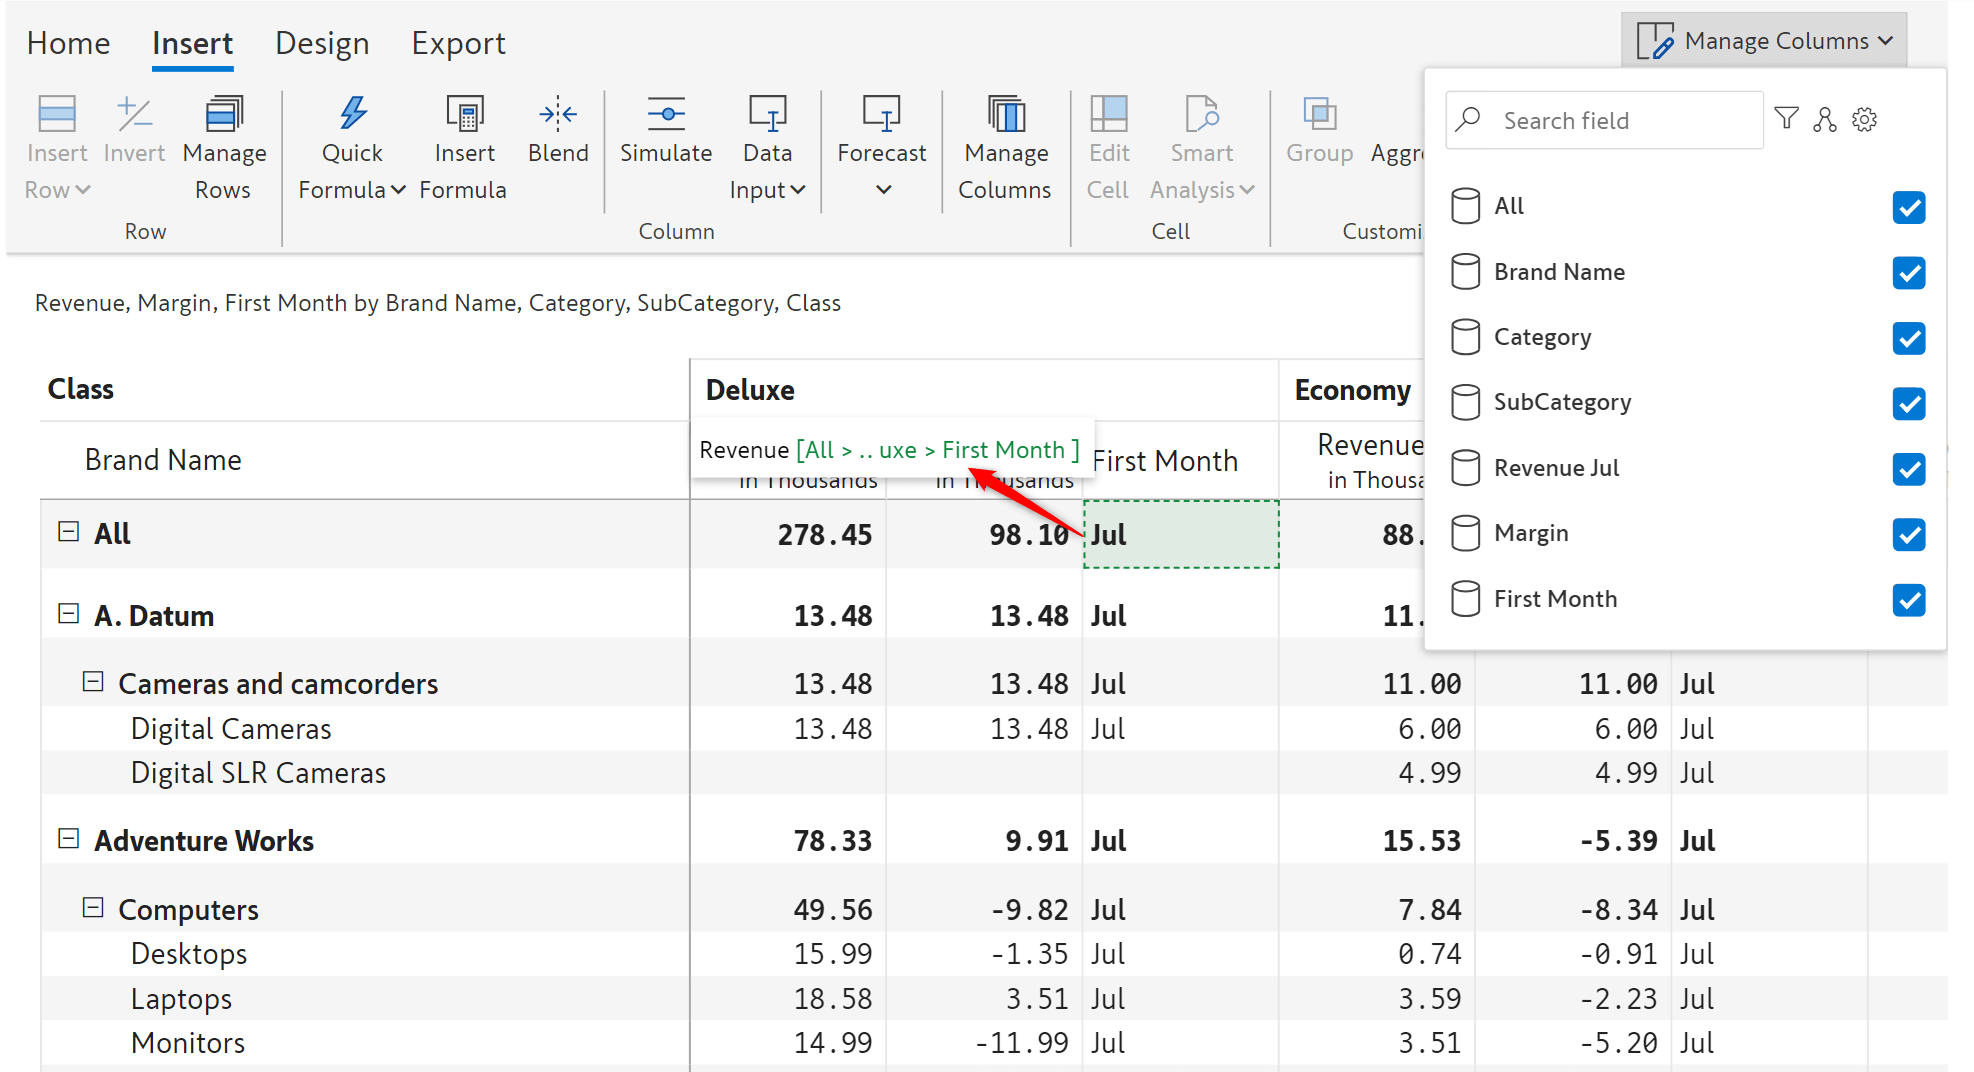
To achieve this, add the month field in the ‘Others’ field of the visual. Double click on the measure header and refer to the month from the month column. Hide the month column from manage columns.
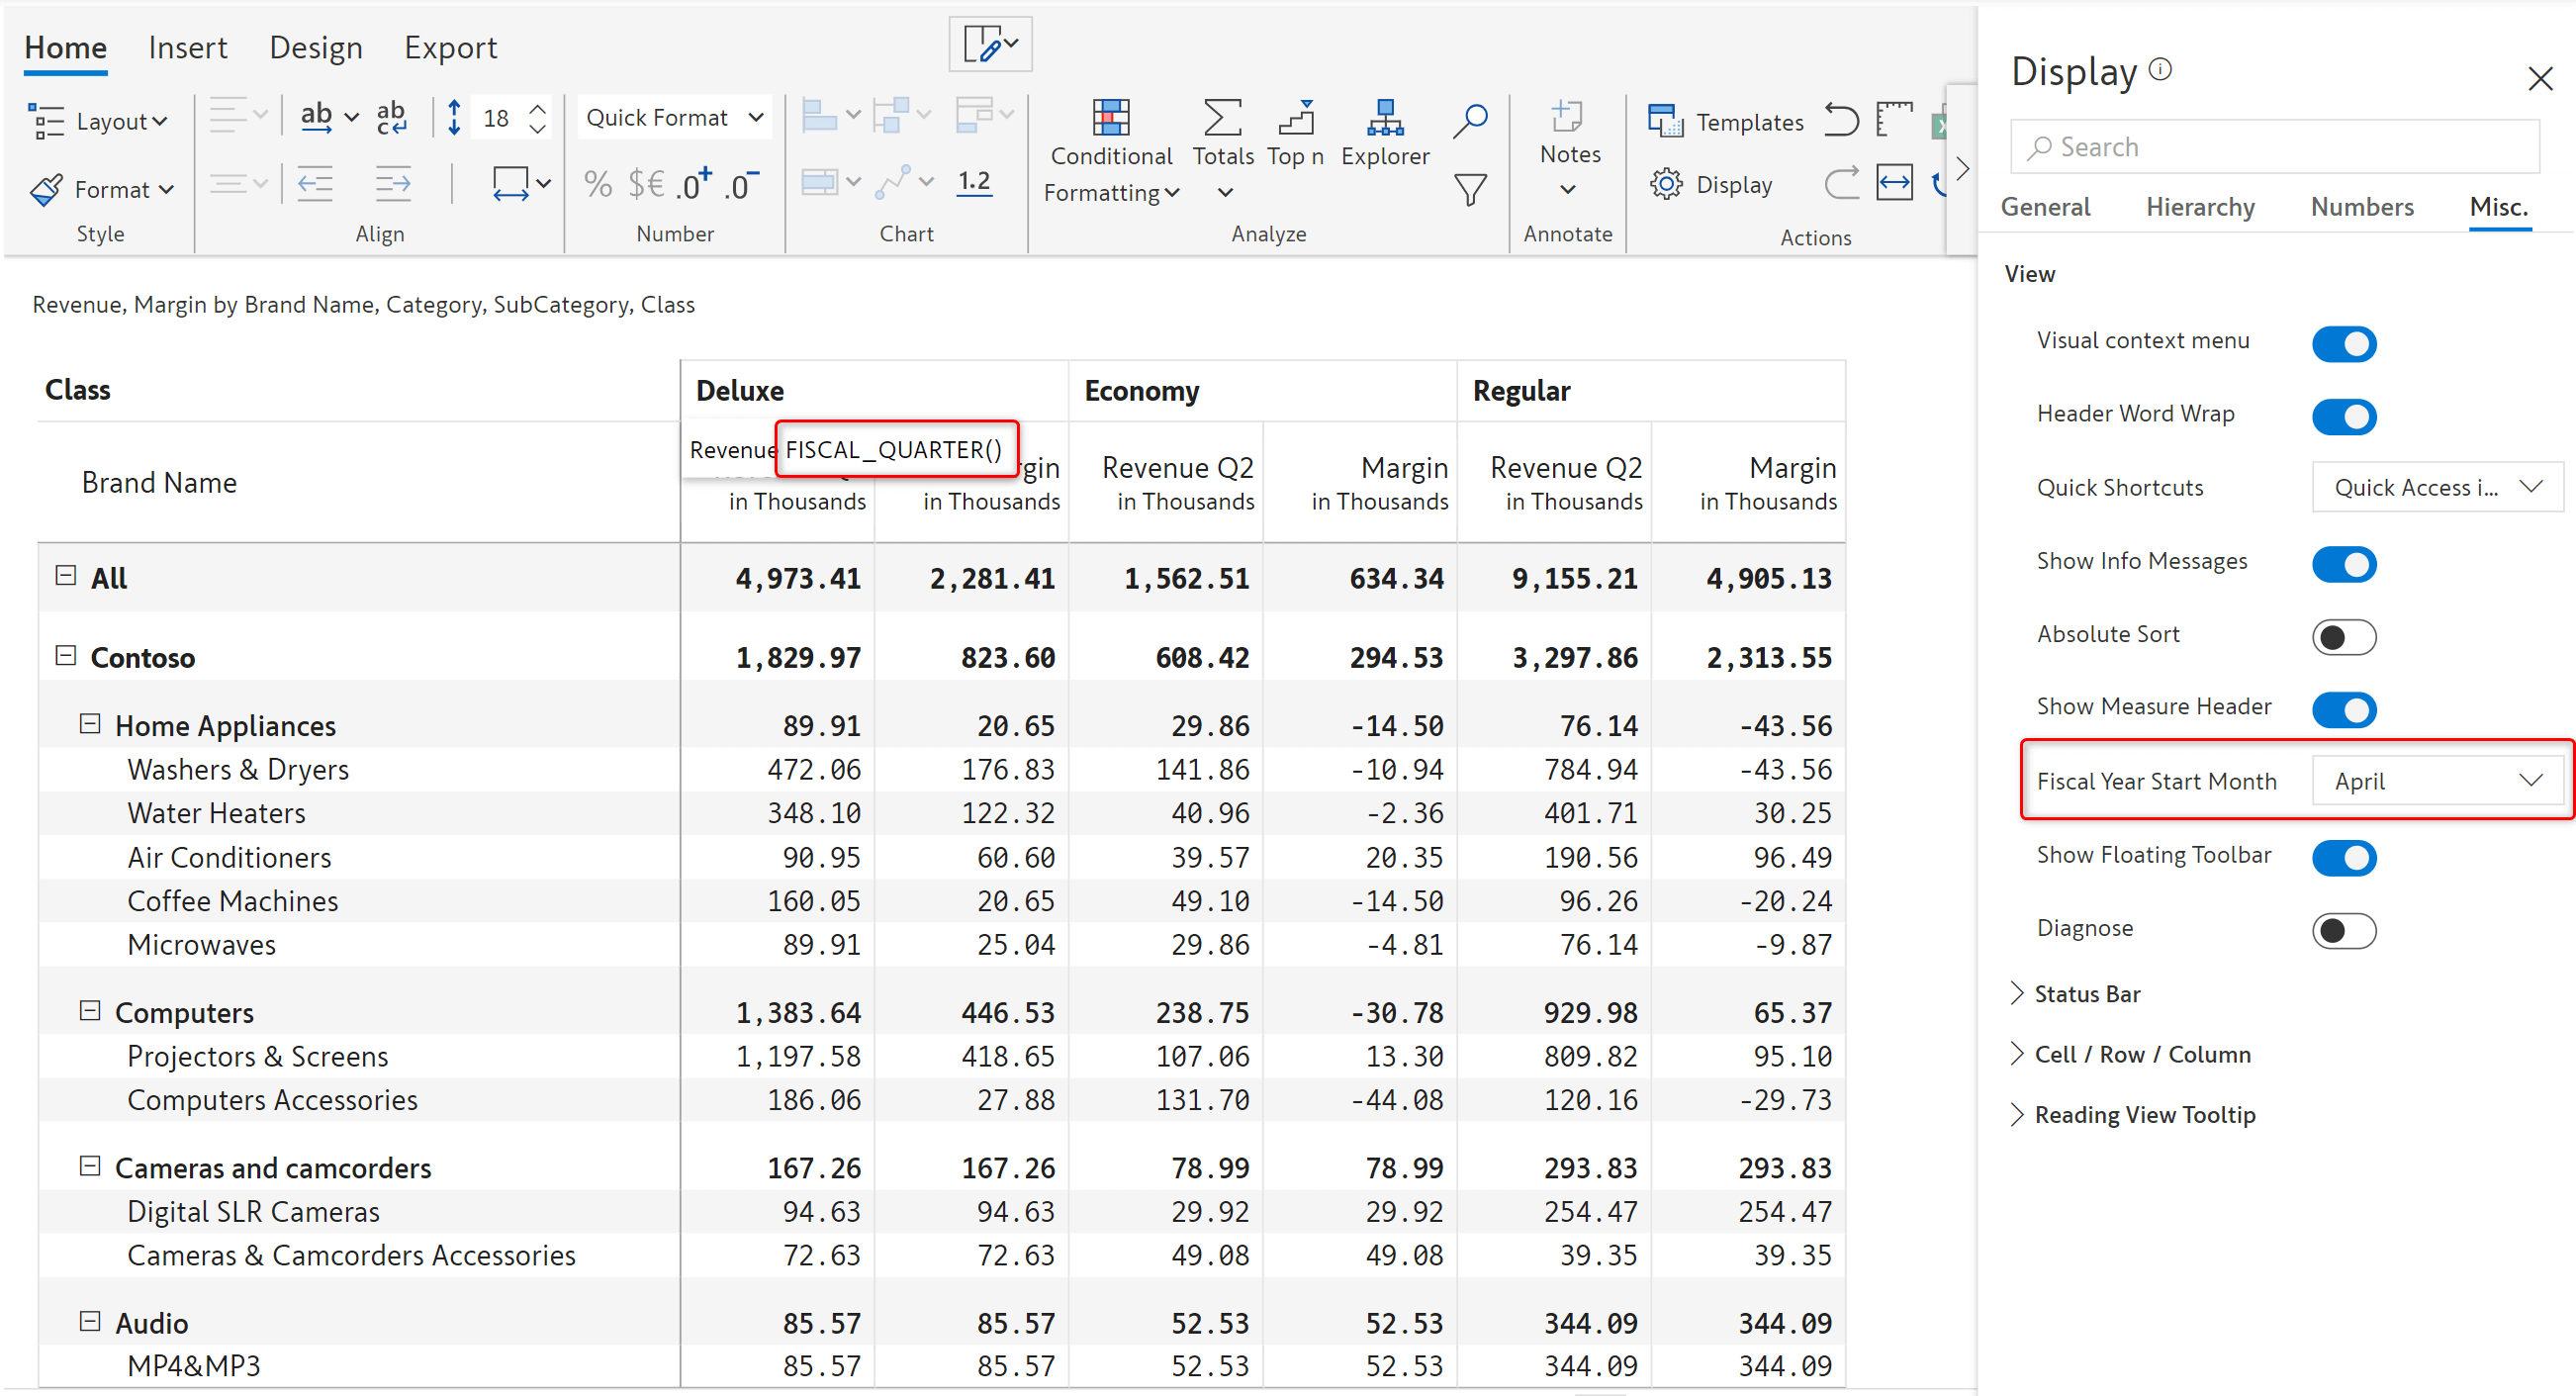
The accounting period can be defined using the ‘Fiscal year start month’ option in Display settings
-> Misc. FISCAL_QUARTER() in the measure header returns the quarter based on the defined start month.
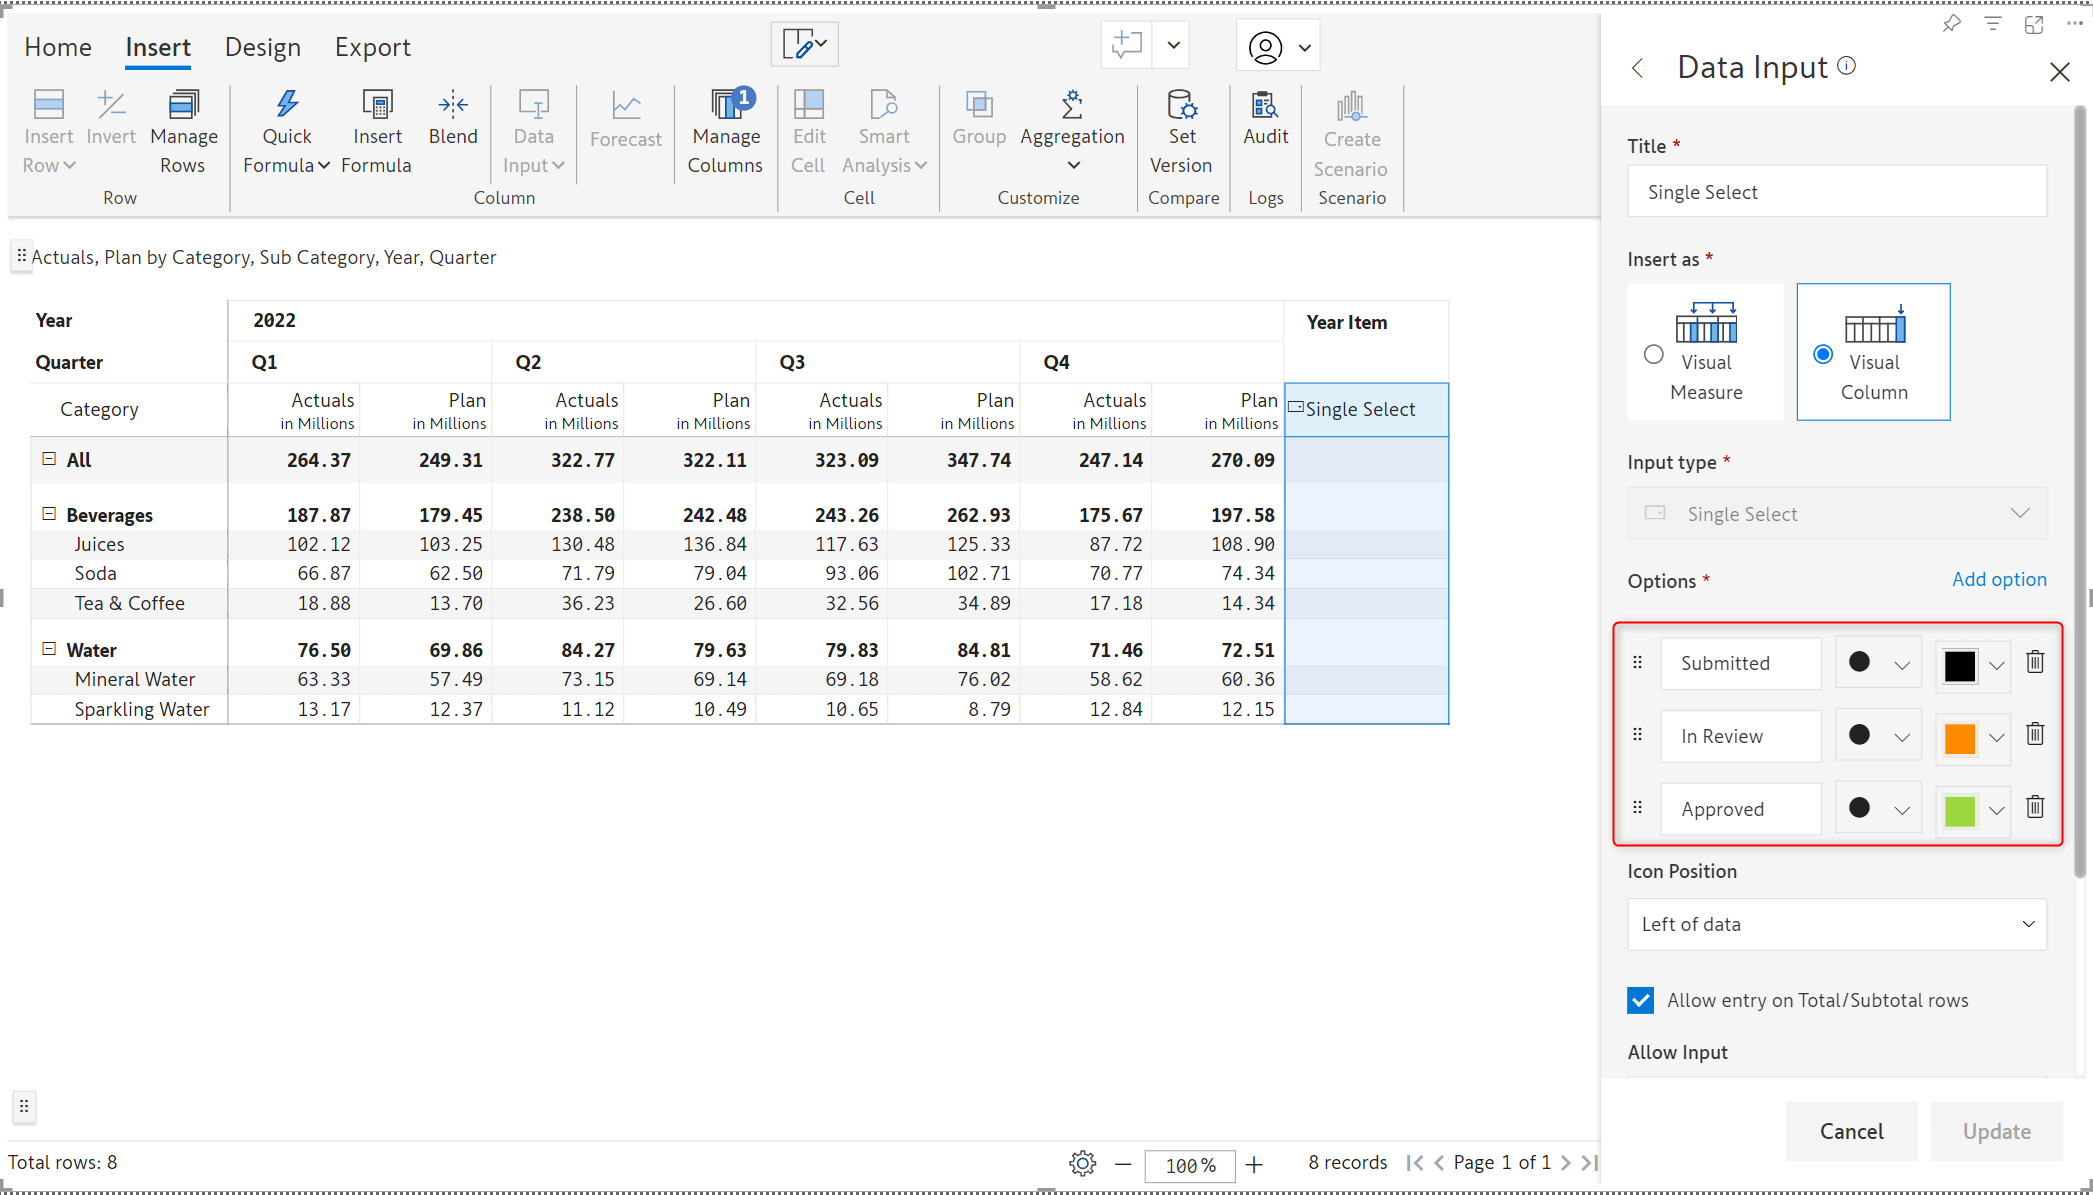
In case of single and multi-select columns, if a particular item is not available in the presets or data source, you can create a new option while configuring a list of values. In the example below, the available values are ‘Submitted’, ‘In Review’ and ‘Approved’.
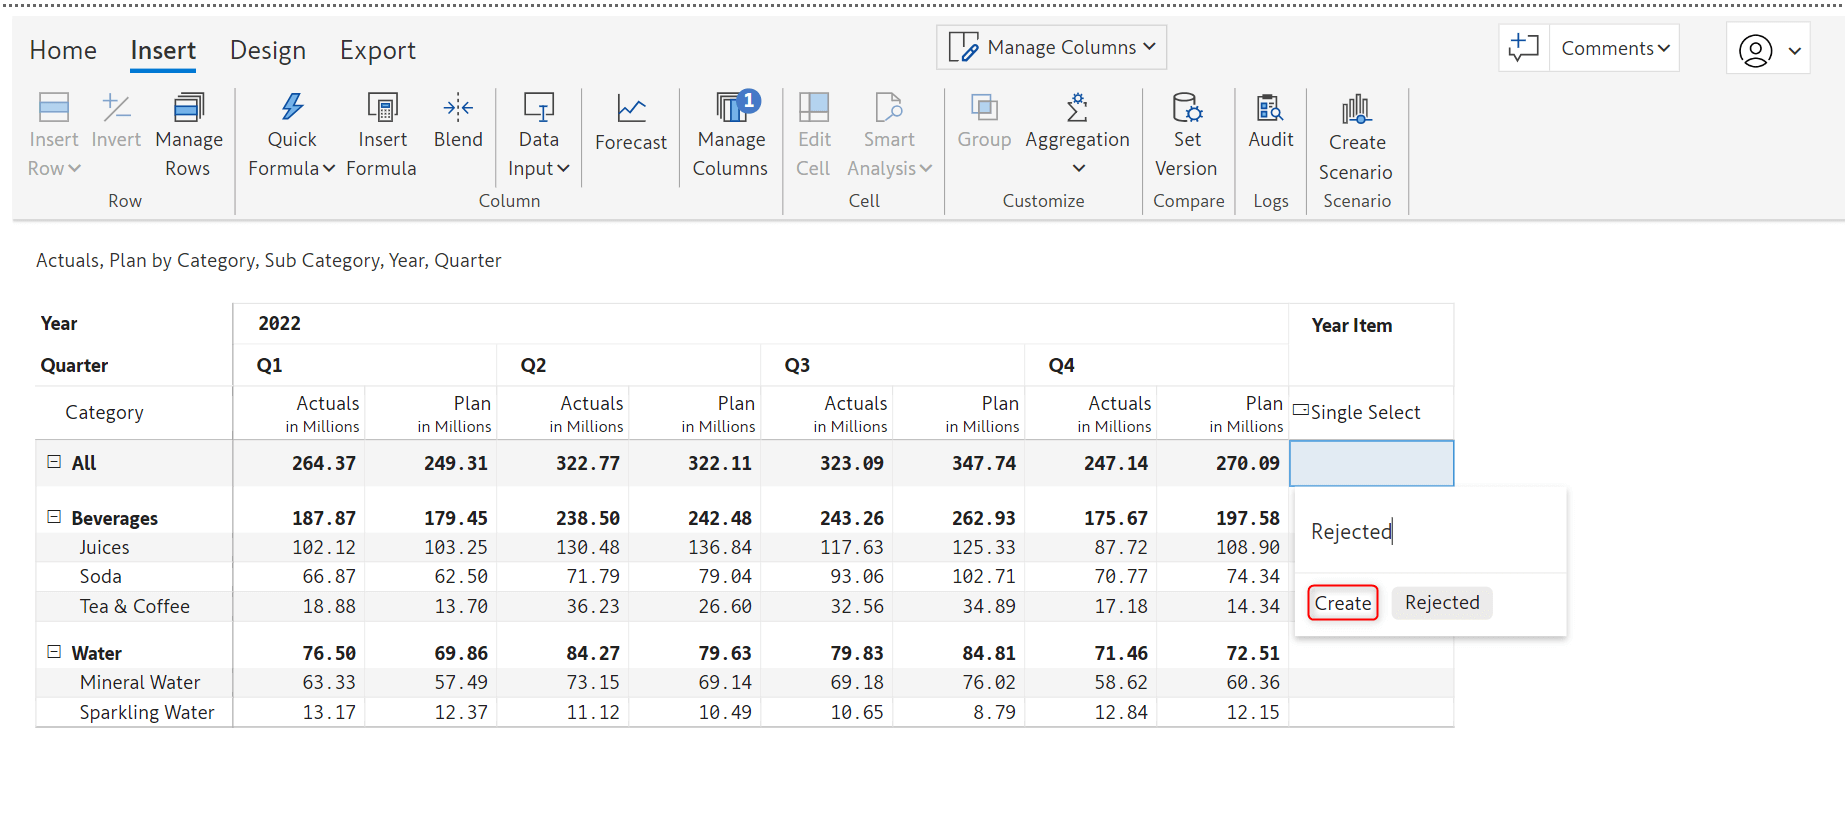
To add a new value of ‘Rejected’, type the new value in the search bar and click on the ‘Create’ button.
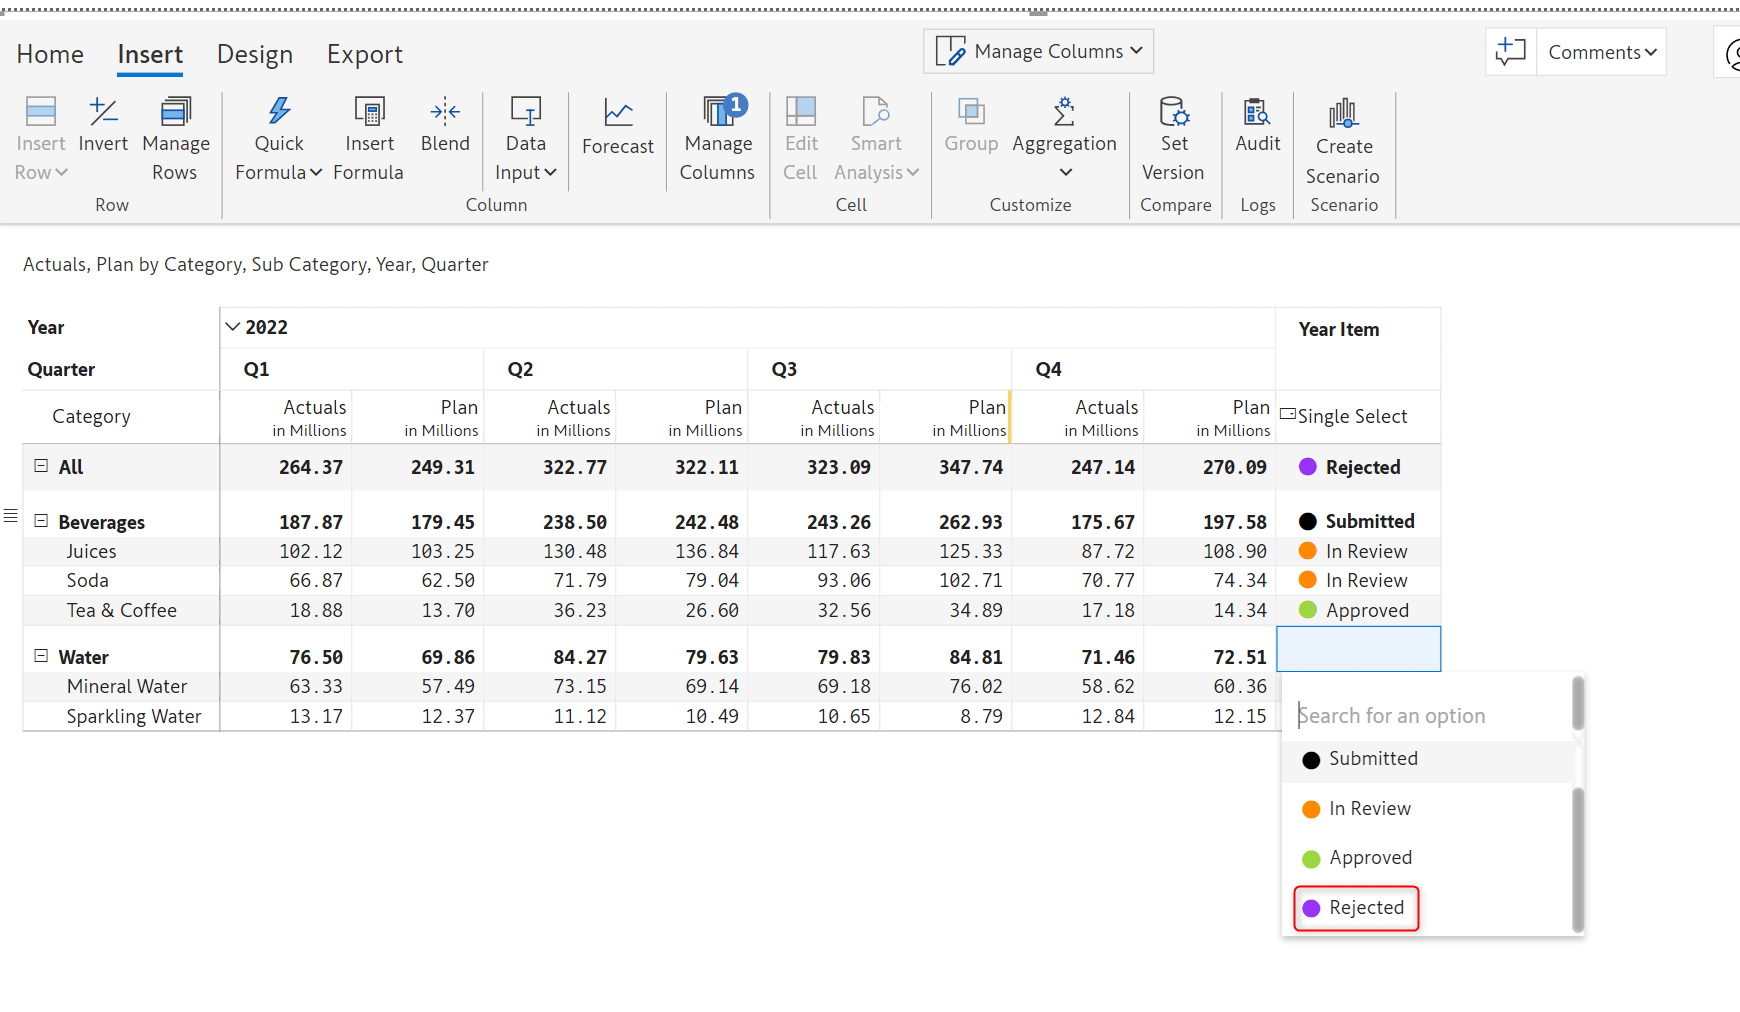
The new value gets added to the list.
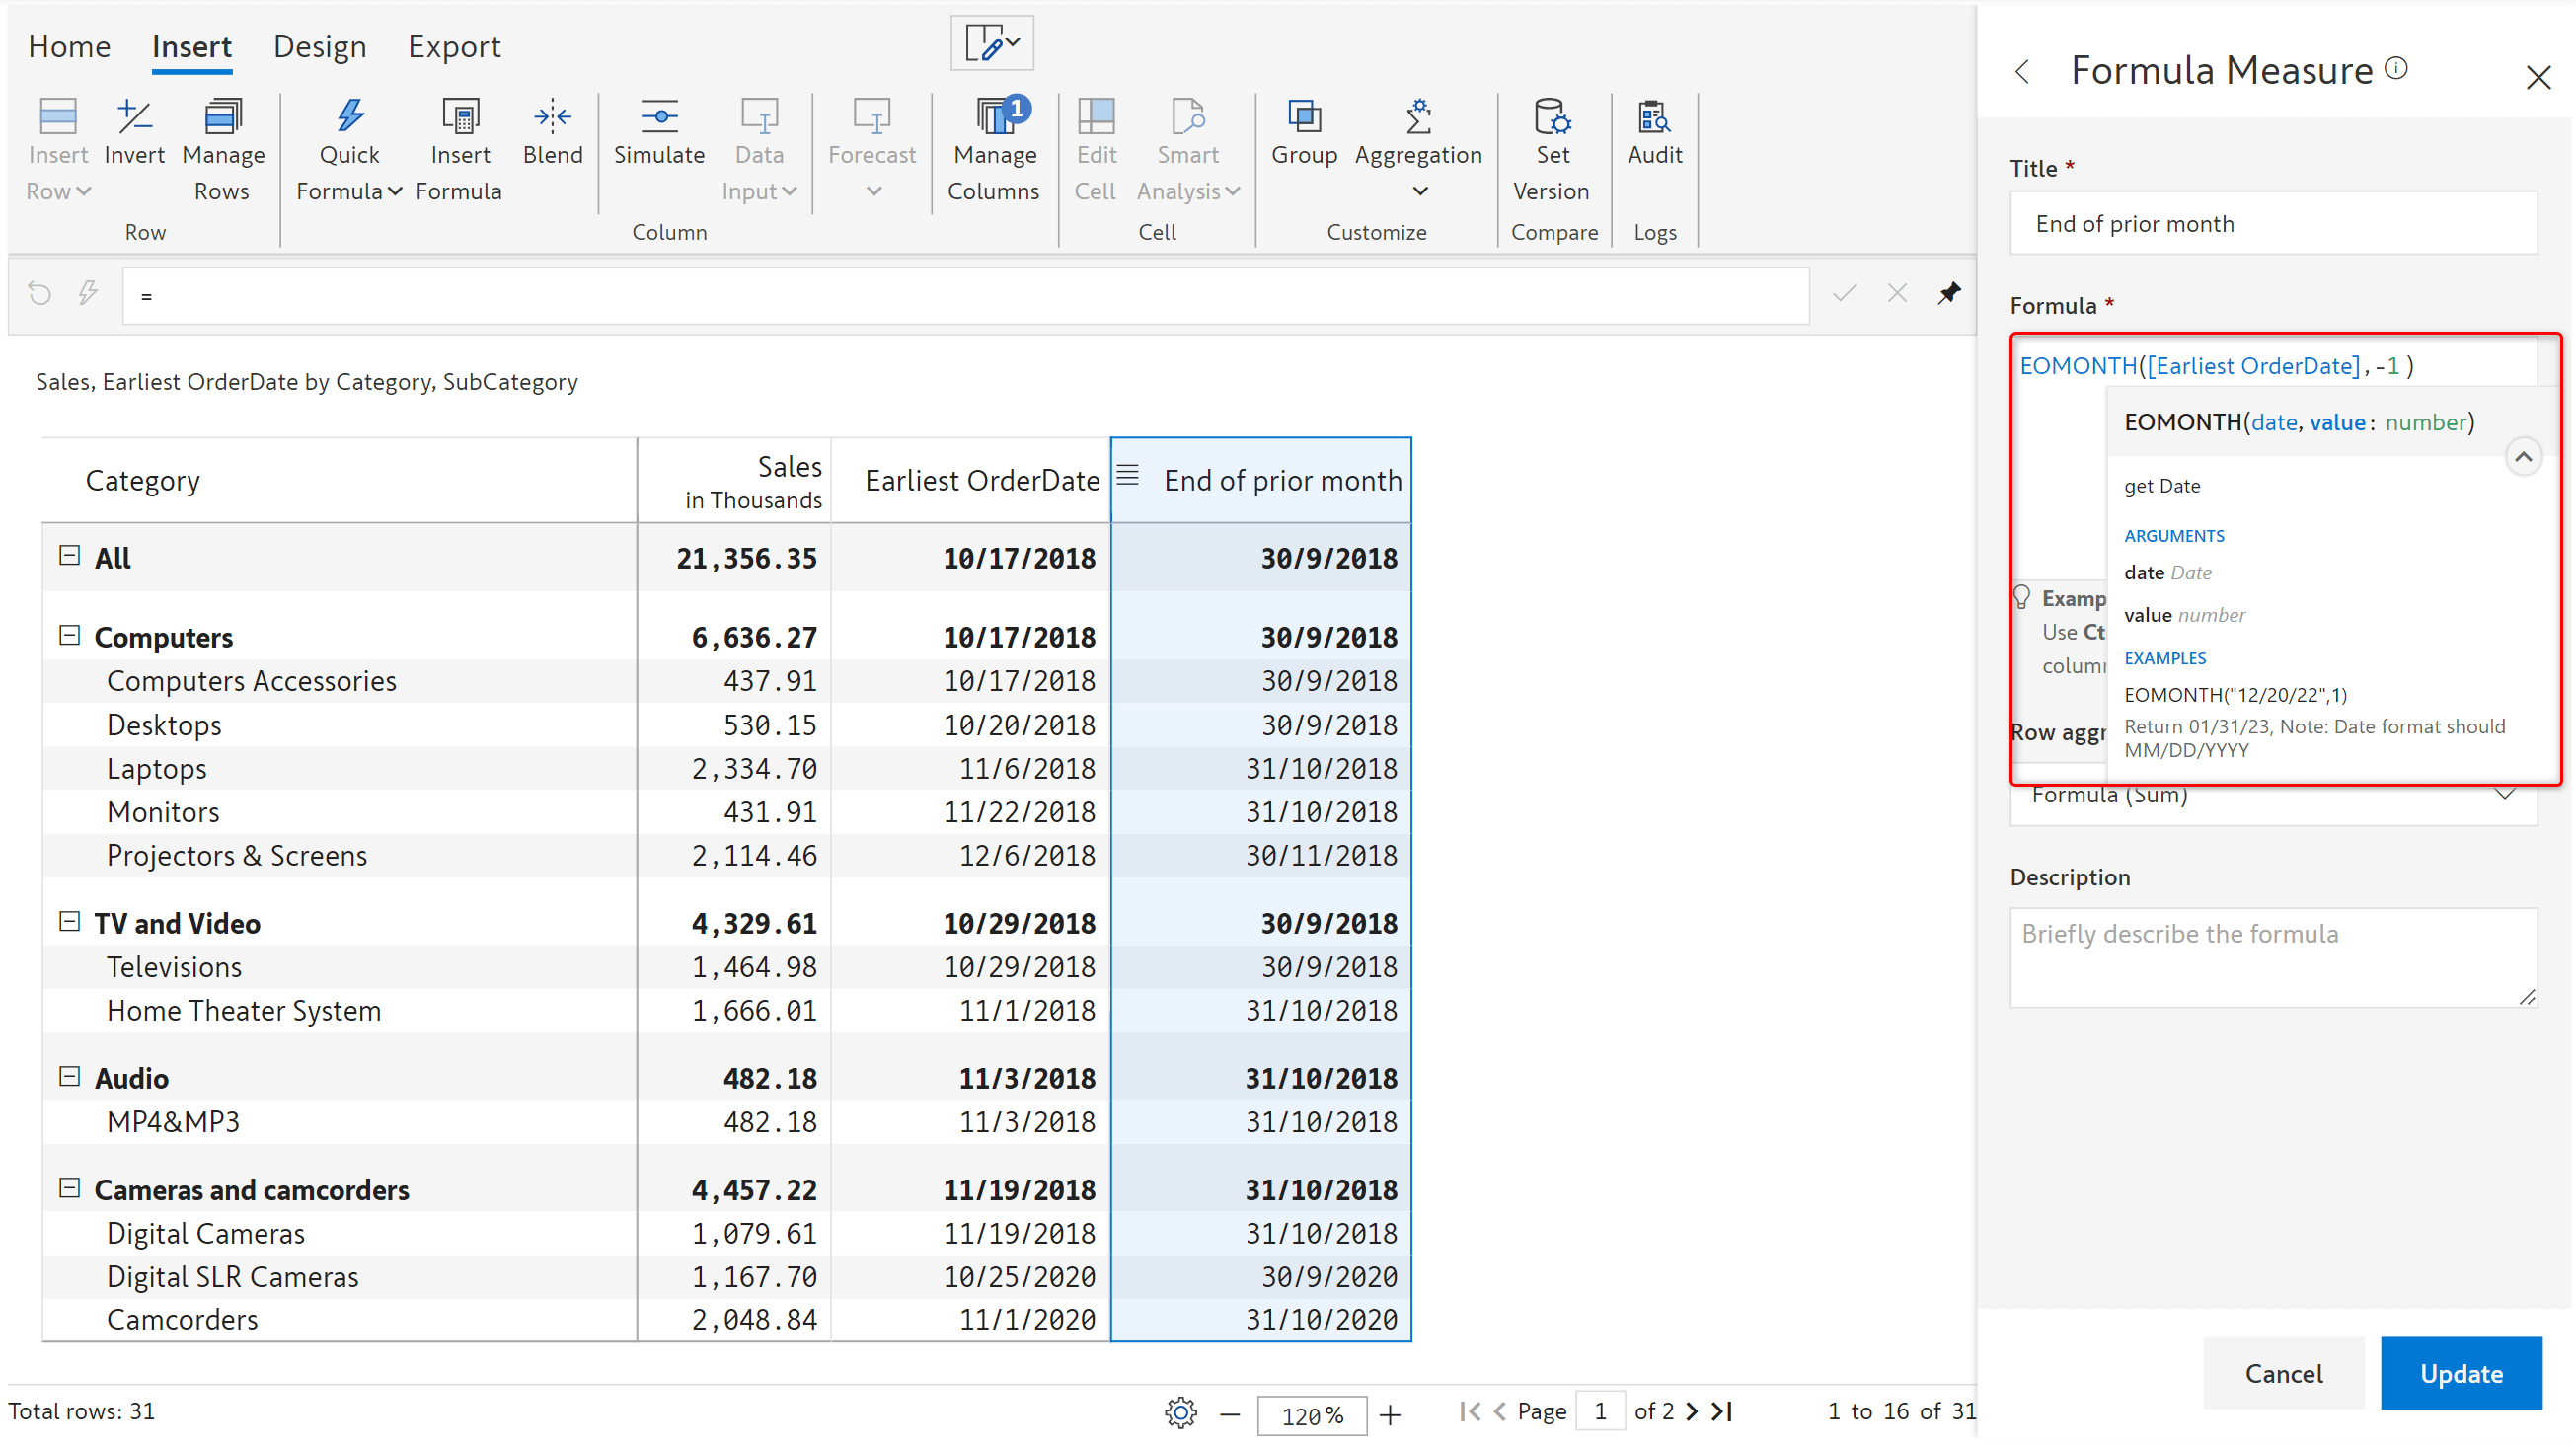
6.1 EOMONTH
EOMONTH returns the last day of the month that is the specified number of months before or after the defined date.
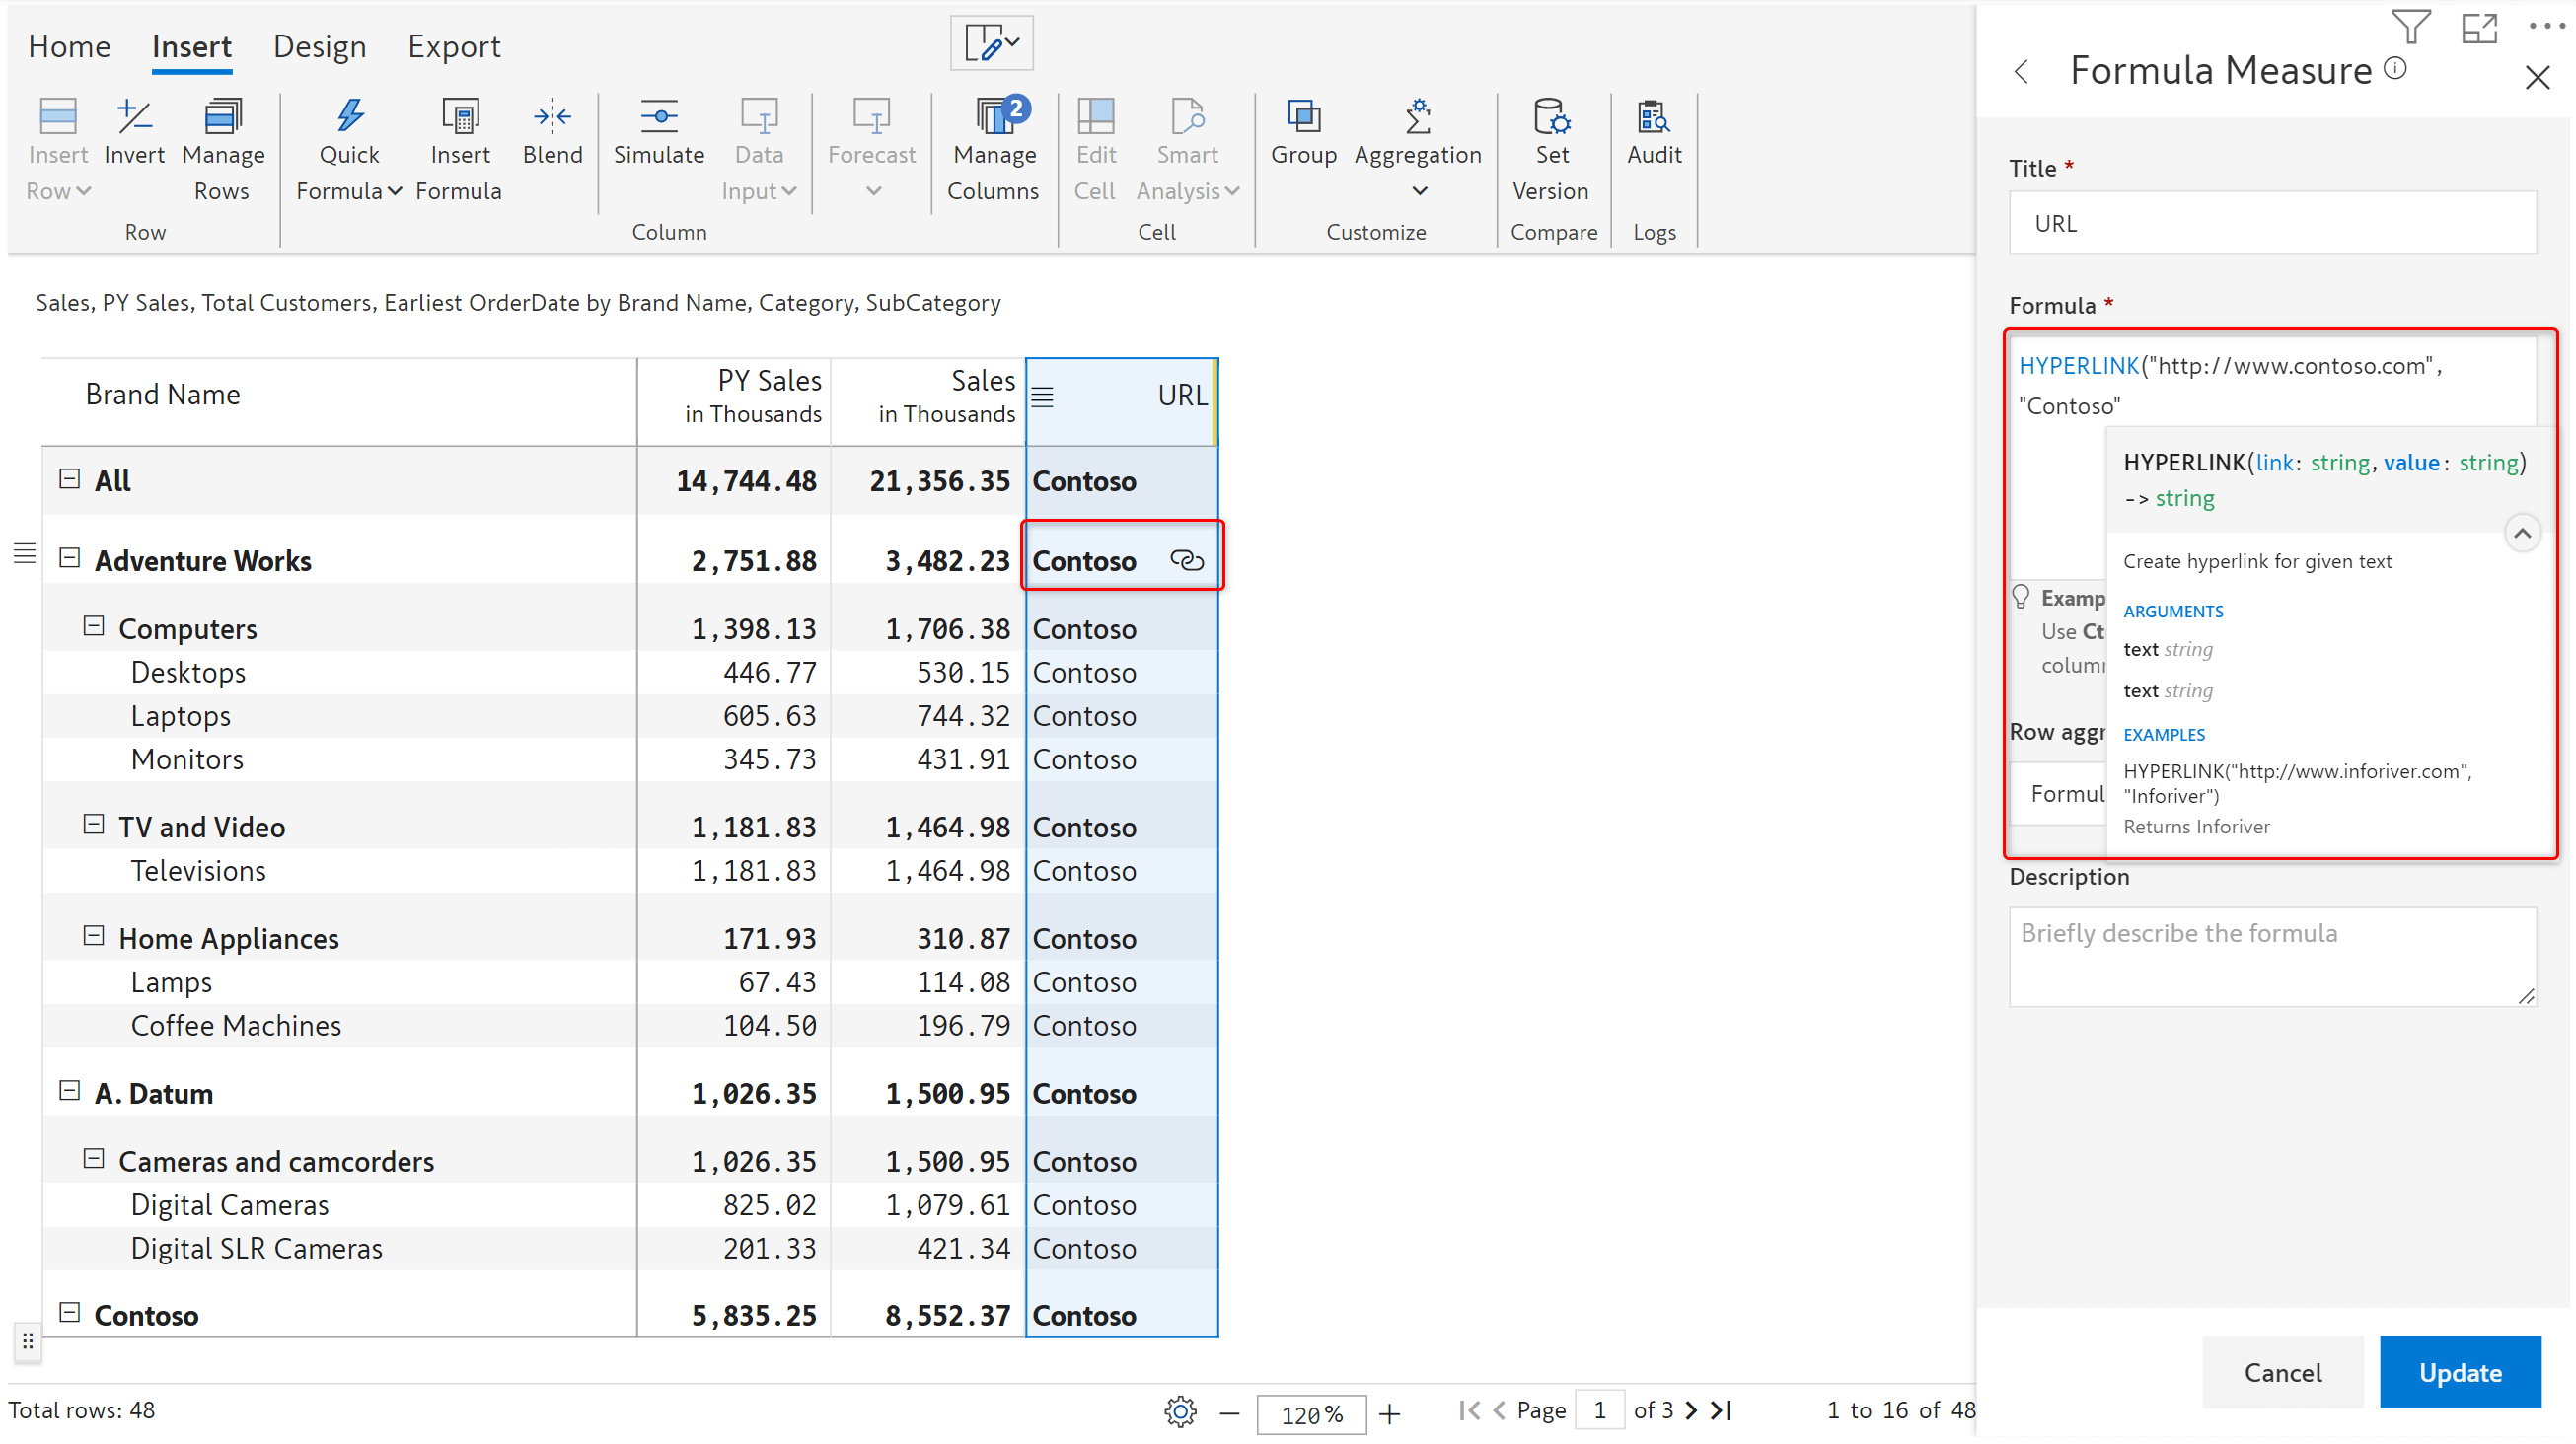
6.2. Hyperlink
A new function called hyperlink has been introduced which takes a URL and description as arguments and returns hyperlinked text.
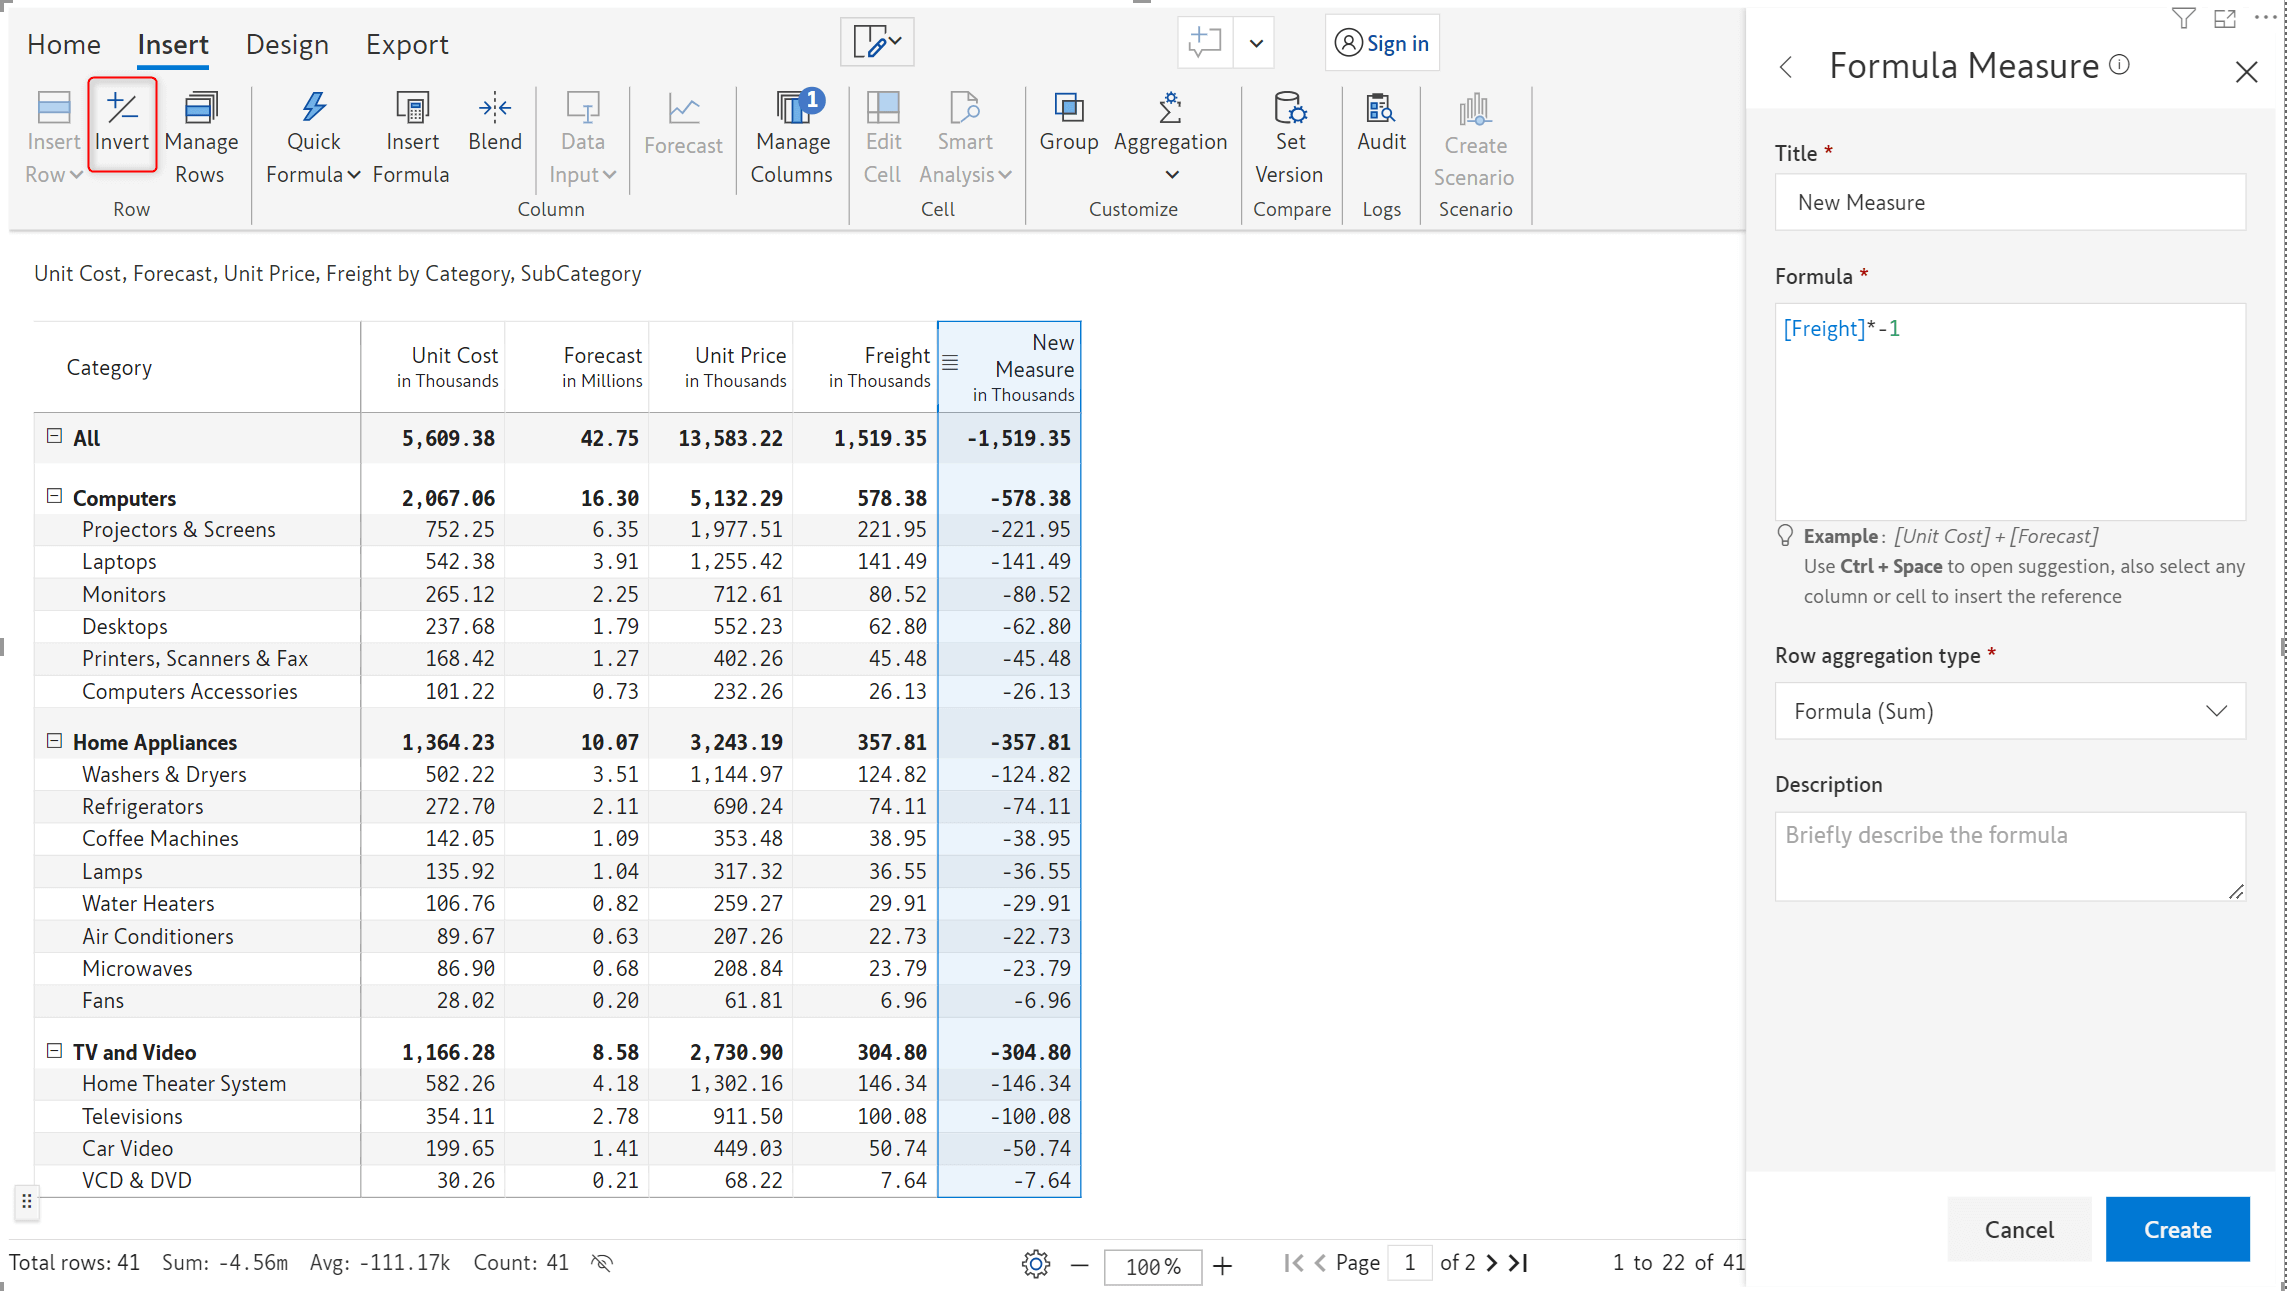
6.3. Invert measure
With version 2.3, you can invert columns/measures in a single-click. This eliminates the need to insert calculated columns/measures manually when the data source doesn’t contain a sign measure.
You can now add a layer of abstraction to the report by choosing whether to display the child nodes under a hierarchy.
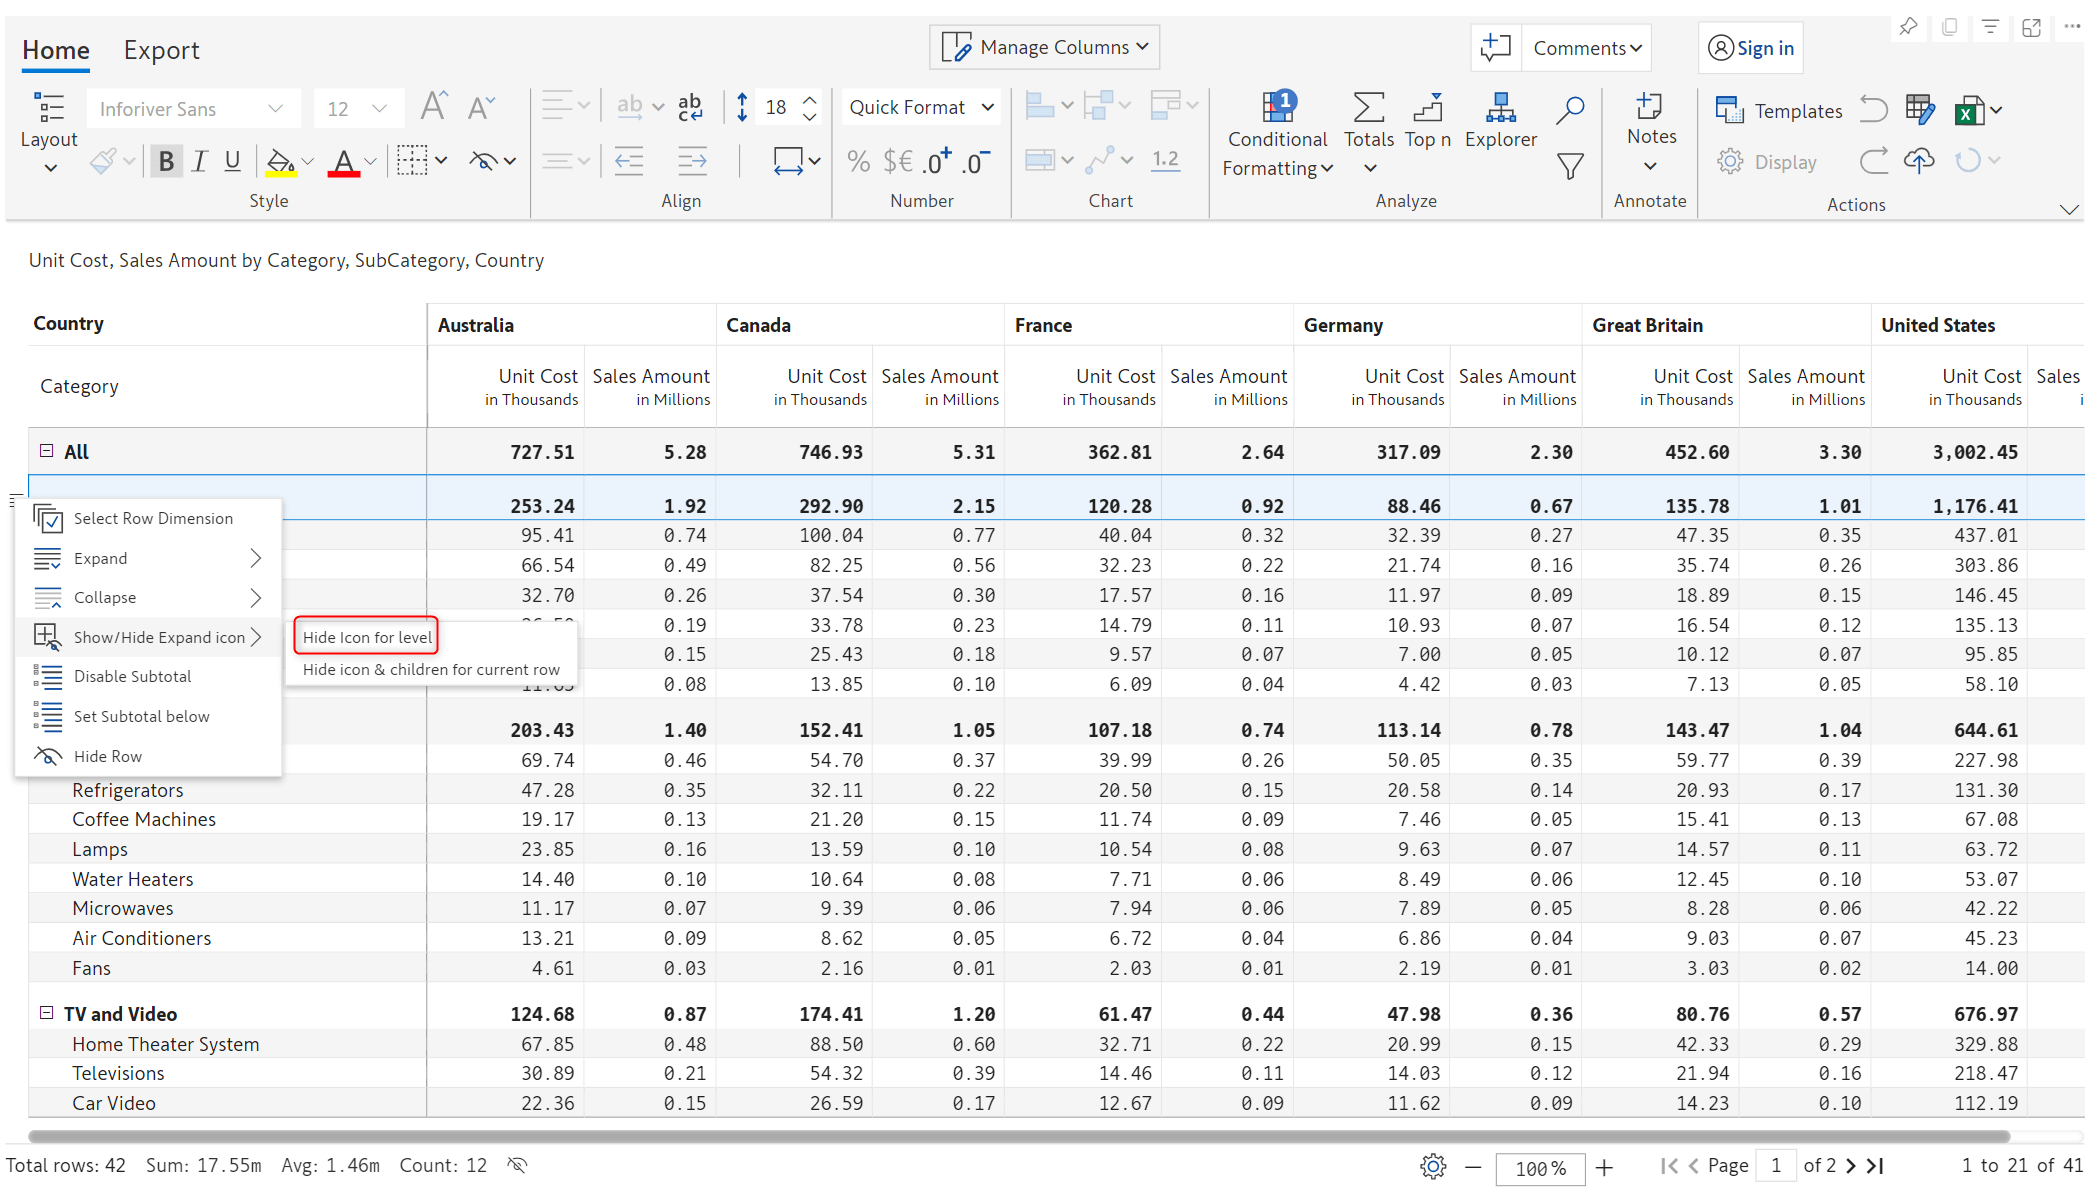
Selecting the ‘Hide icon for level’ option will keep the hierarchy in expanded state, the collapse icon will be hidden.
Choosing the ‘Hide icon & children for current row’ option will hide all the children contributing to that parent node. All the child nodes under ‘Computers’ have been hidden in the example below.
8.1. Table layout - Sorting data
Absolute sort can now be applied in the table layout. Sorting will be applicable across hierarchies as shown below.
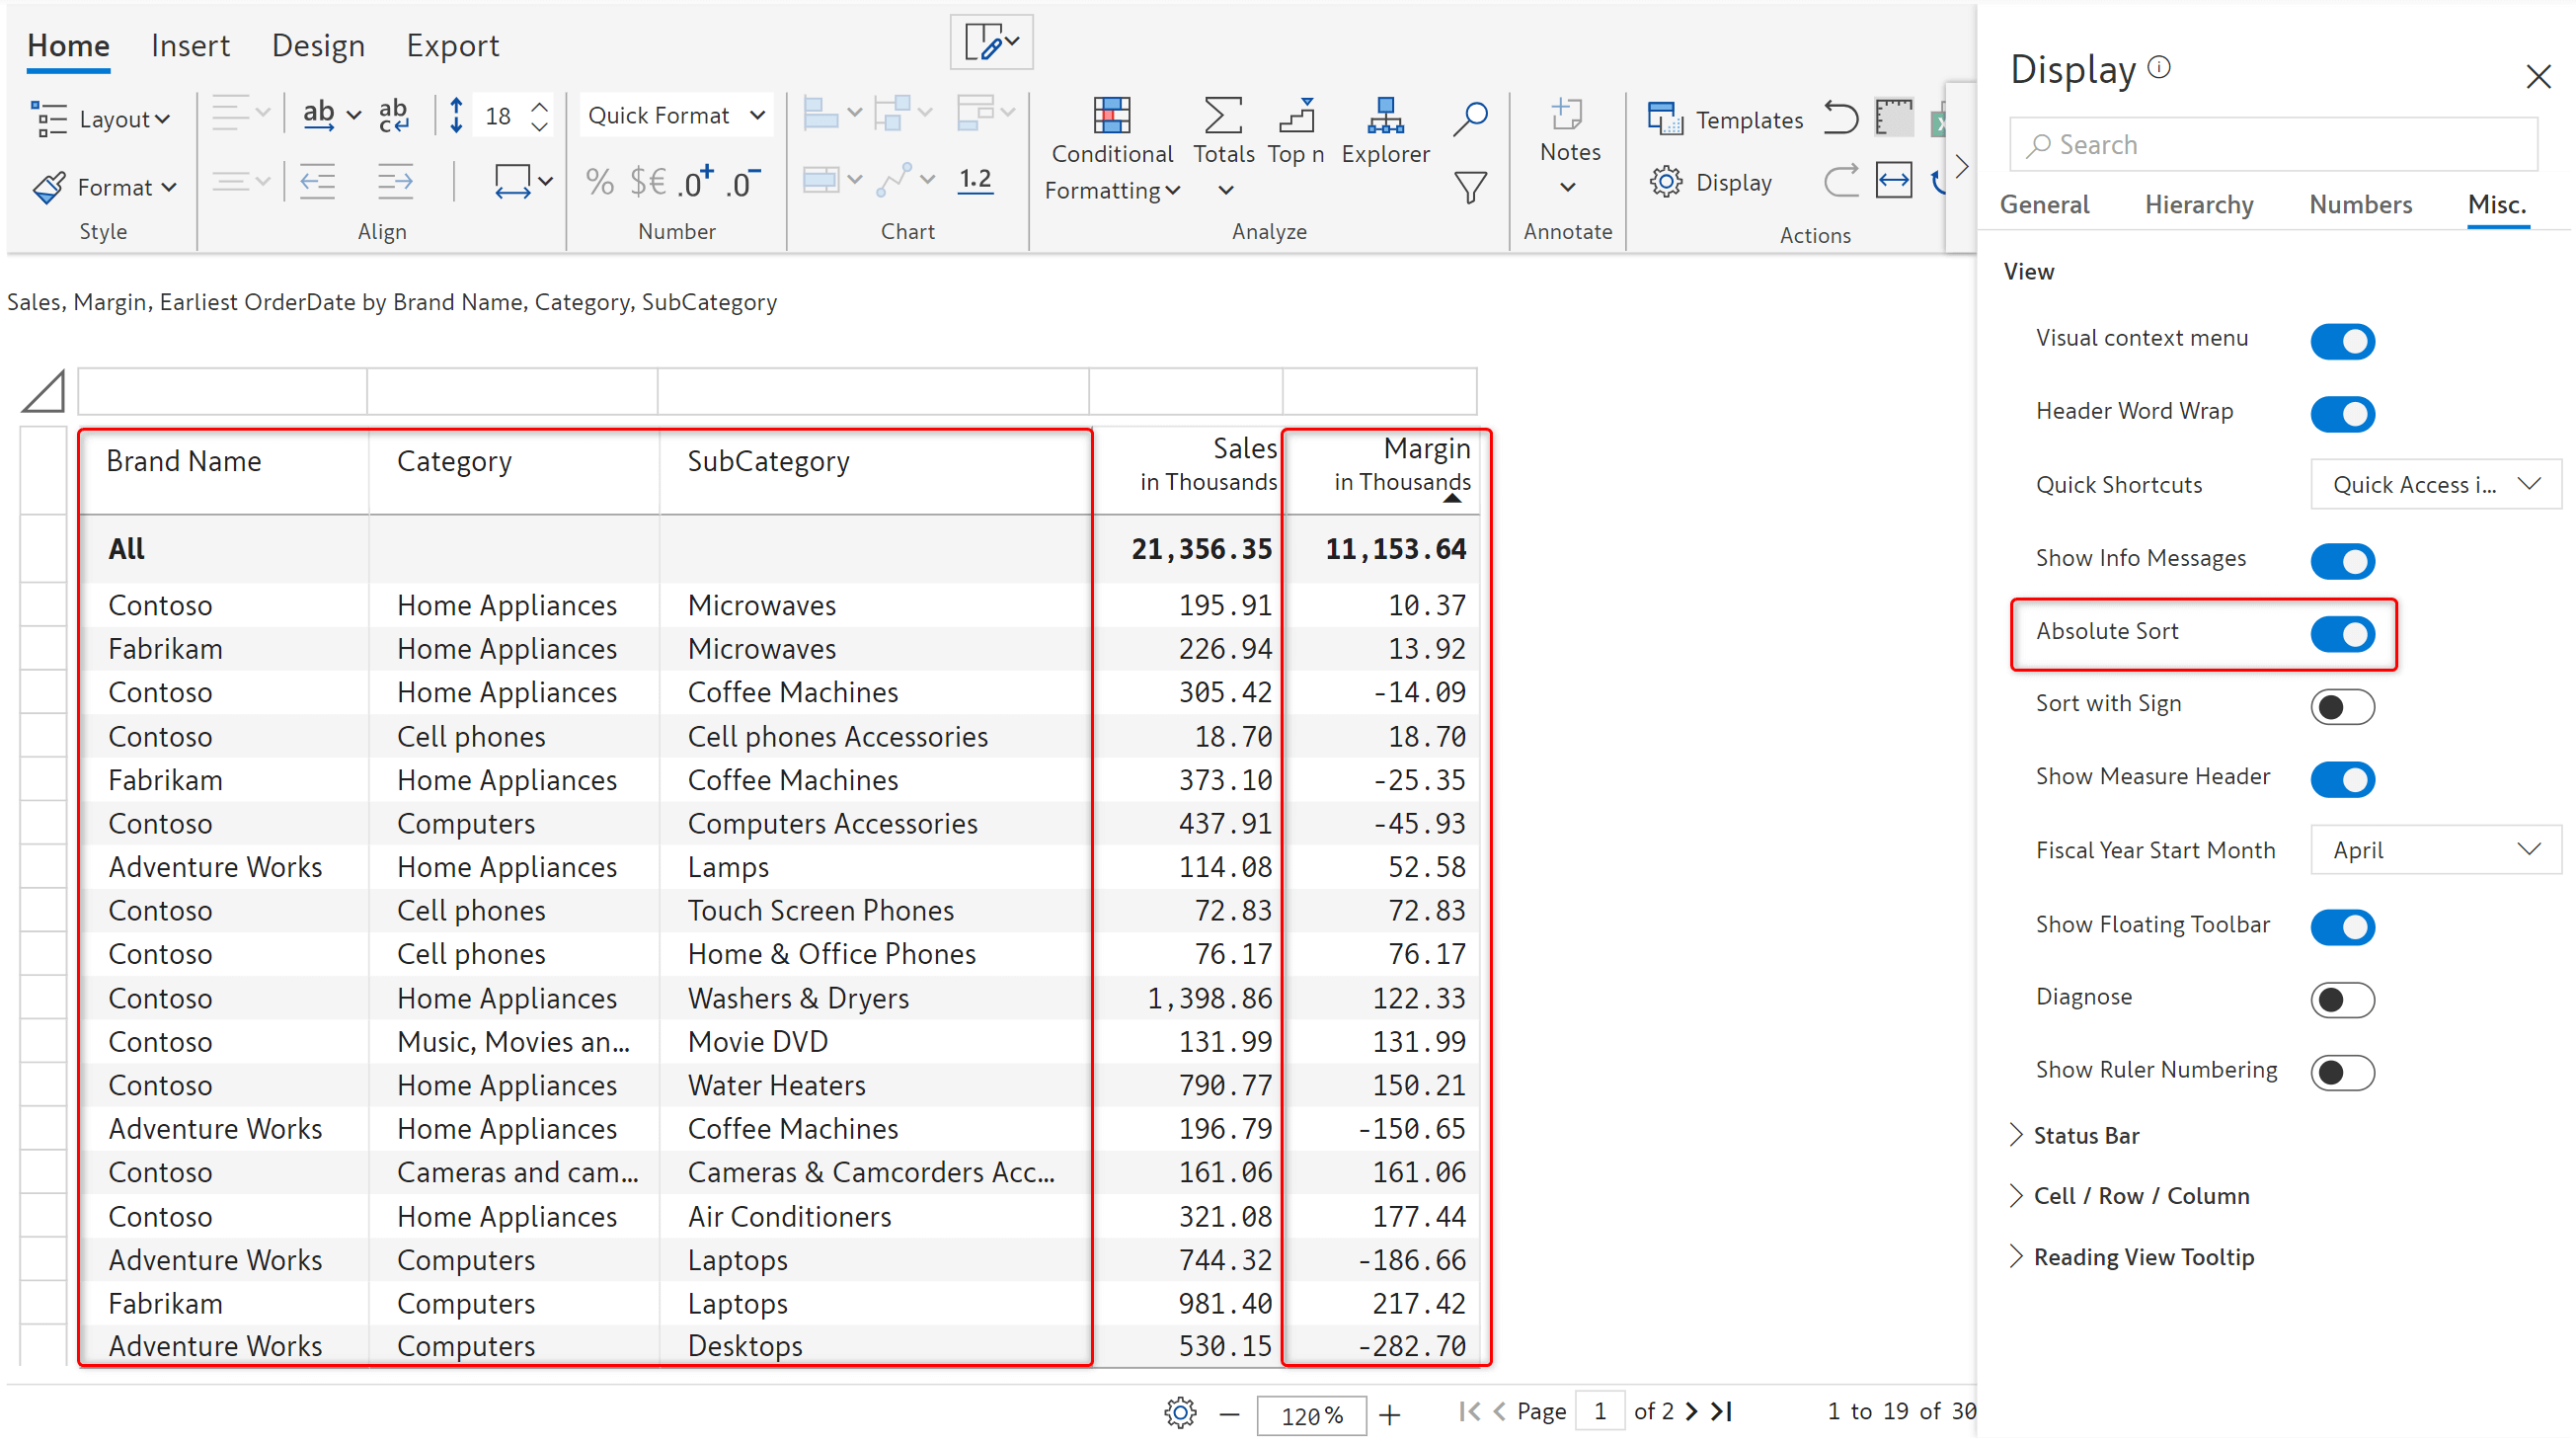
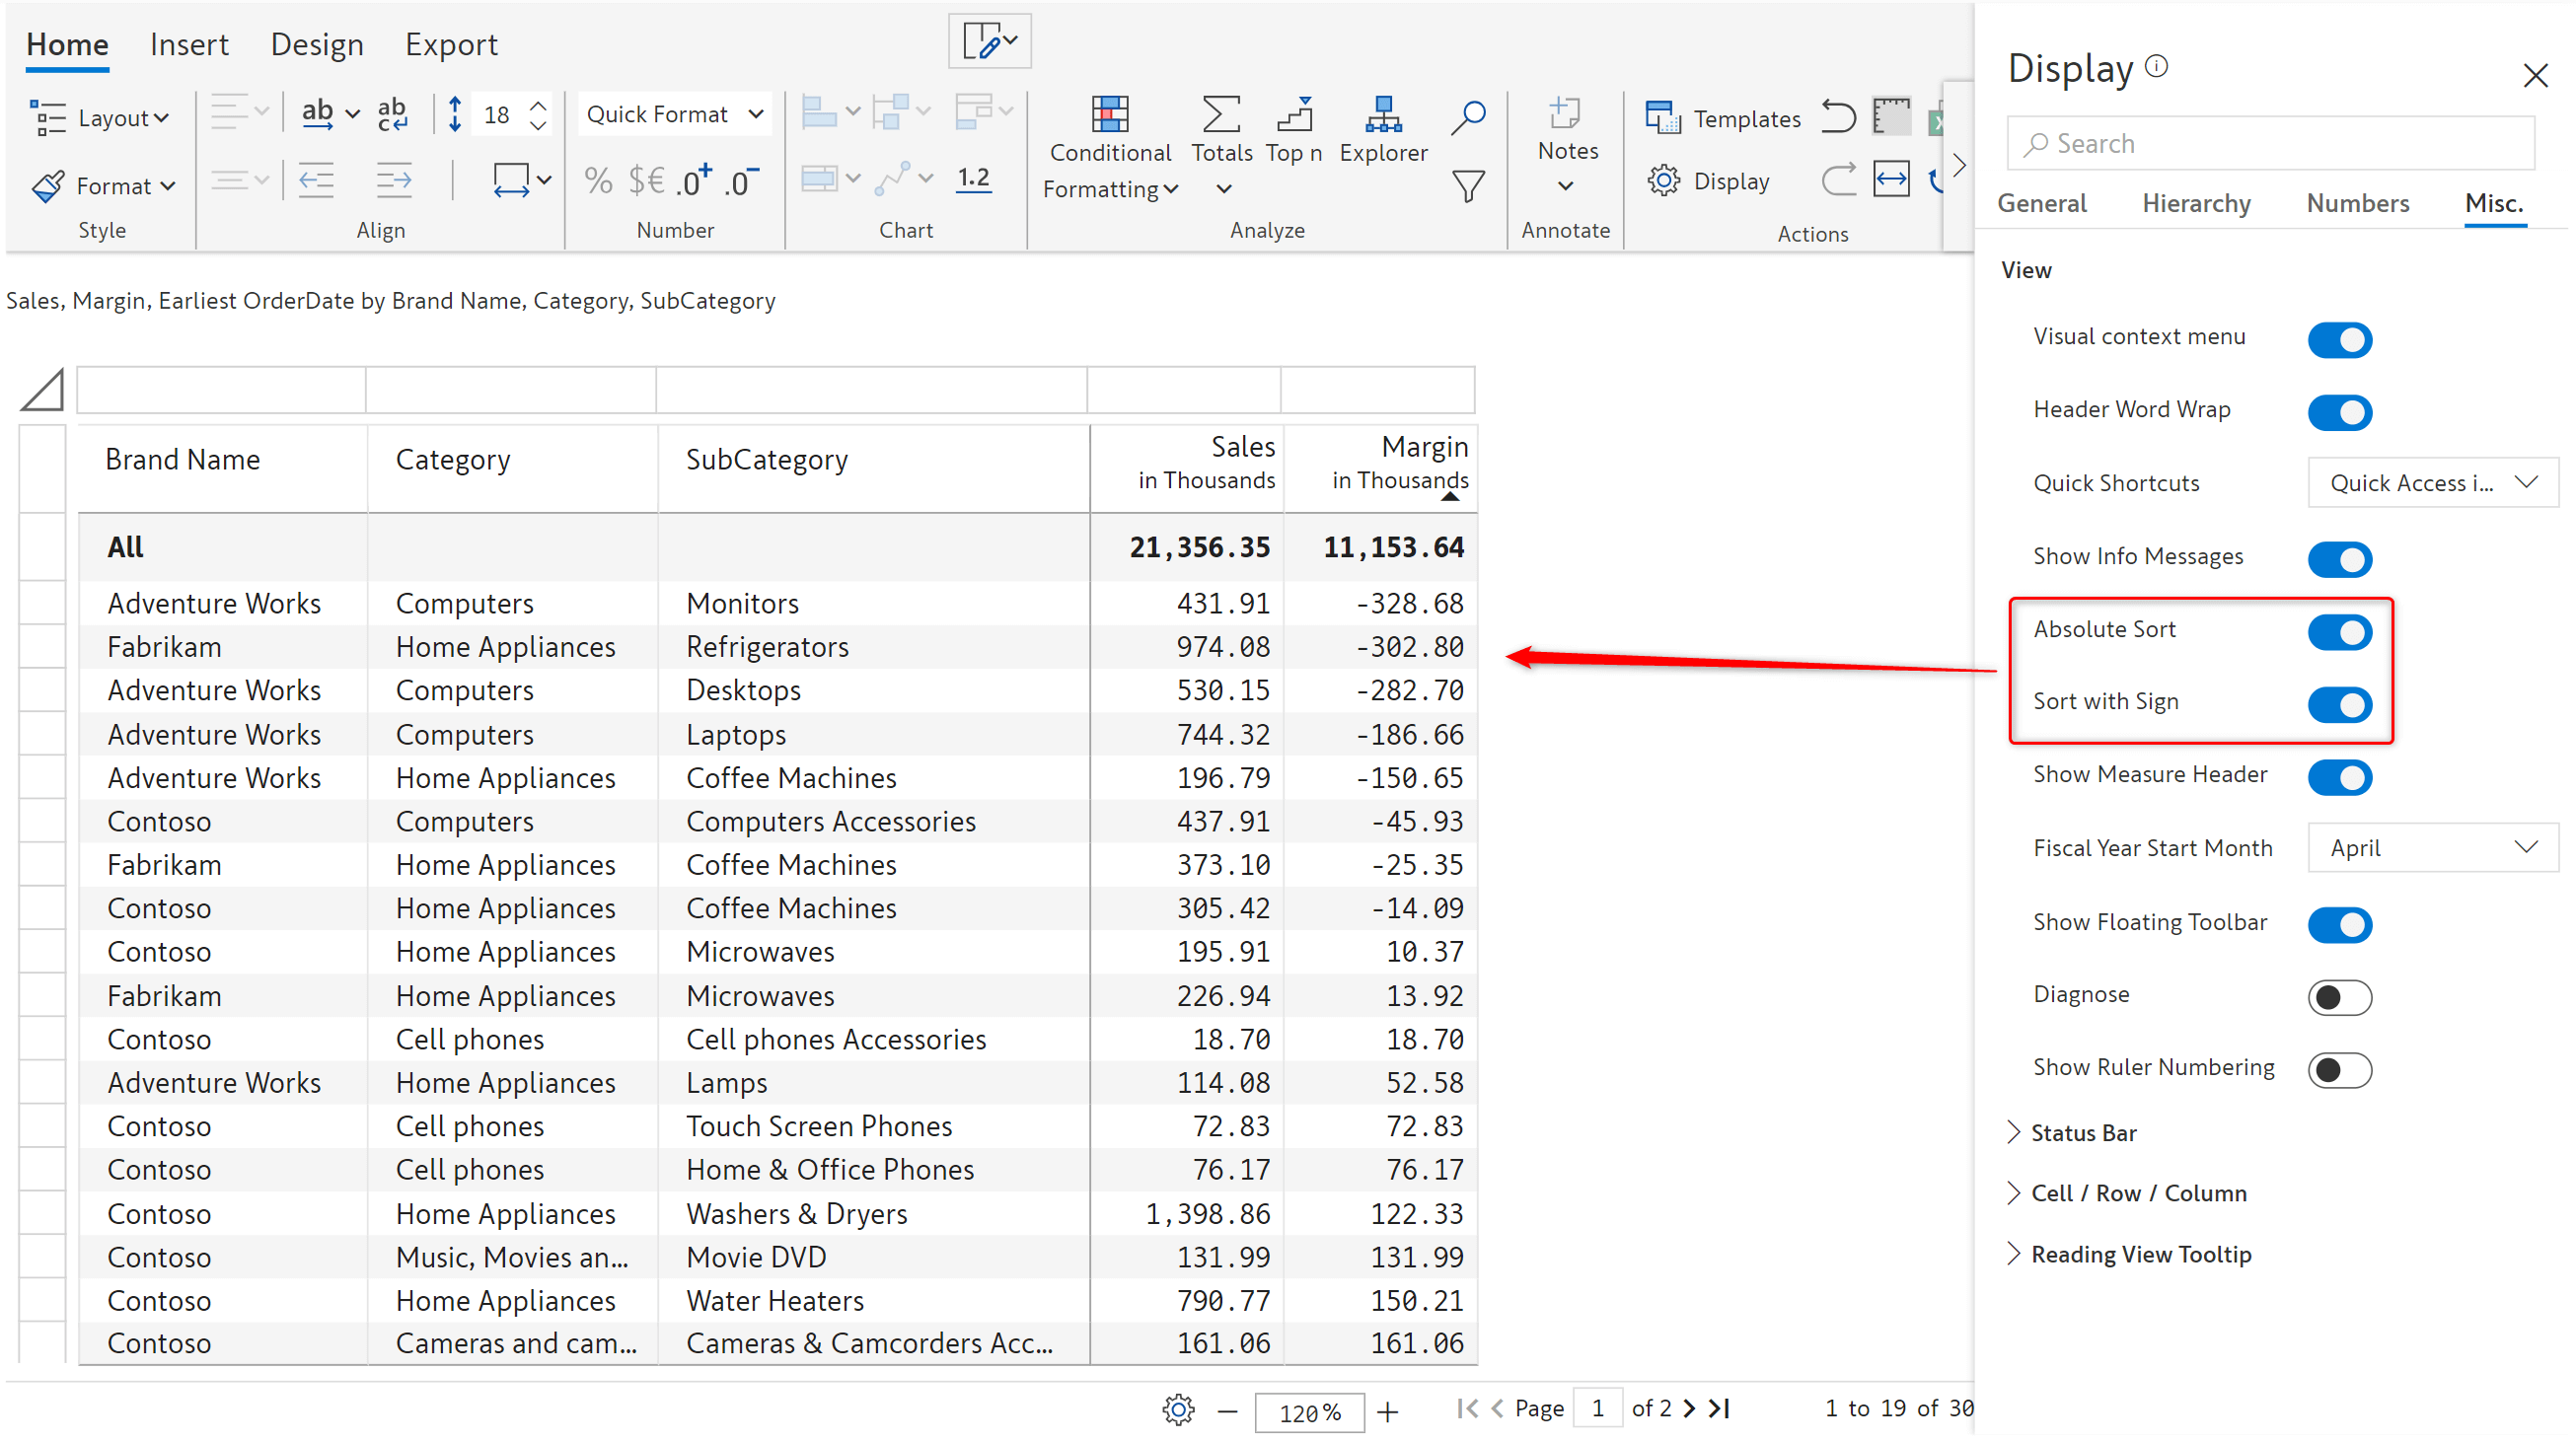
When absolute sort is turned on in the table layout, an option called ‘sort with sign’ gets enabled. On enabling this toggle, the signage of the numbers is considered for the sorting.
In the table layout, you can now pin rows to the top or bottom. Pin icon is available on hover next to the lowest level in the hierarchy.
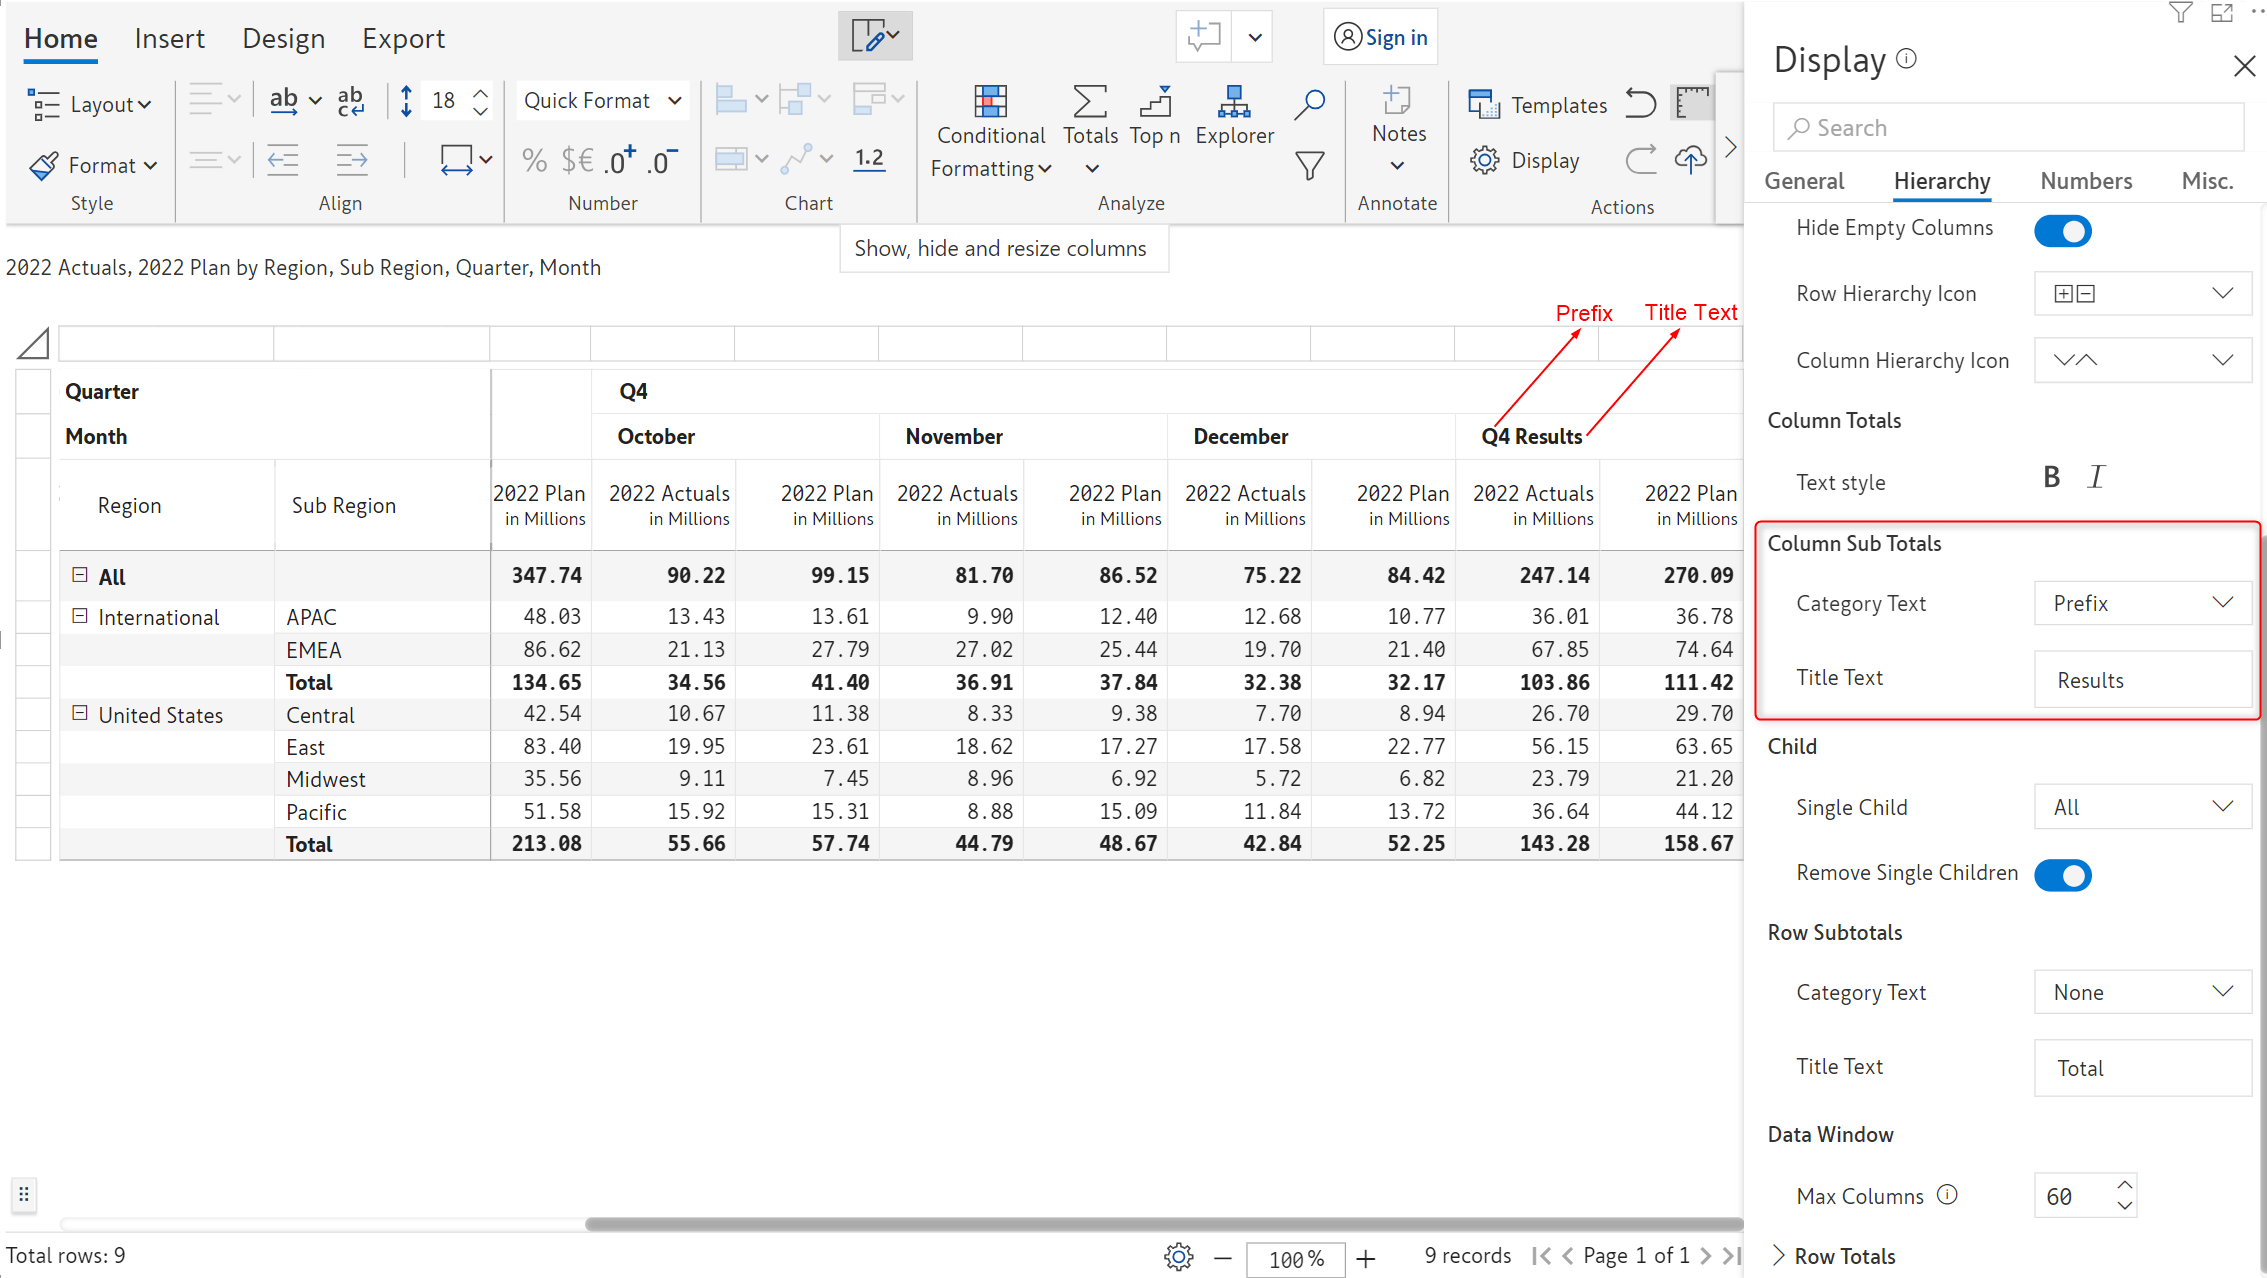
8.2. Column subtotals customization for stepped layout
The July release provides the capability to customize the field name when column sub-totals is enabled in the stepped layout. The default field name of ‘Totals’ can be updated to a relevant user-defined name. To add more context, there is also an option to add a prefix or a suffix.
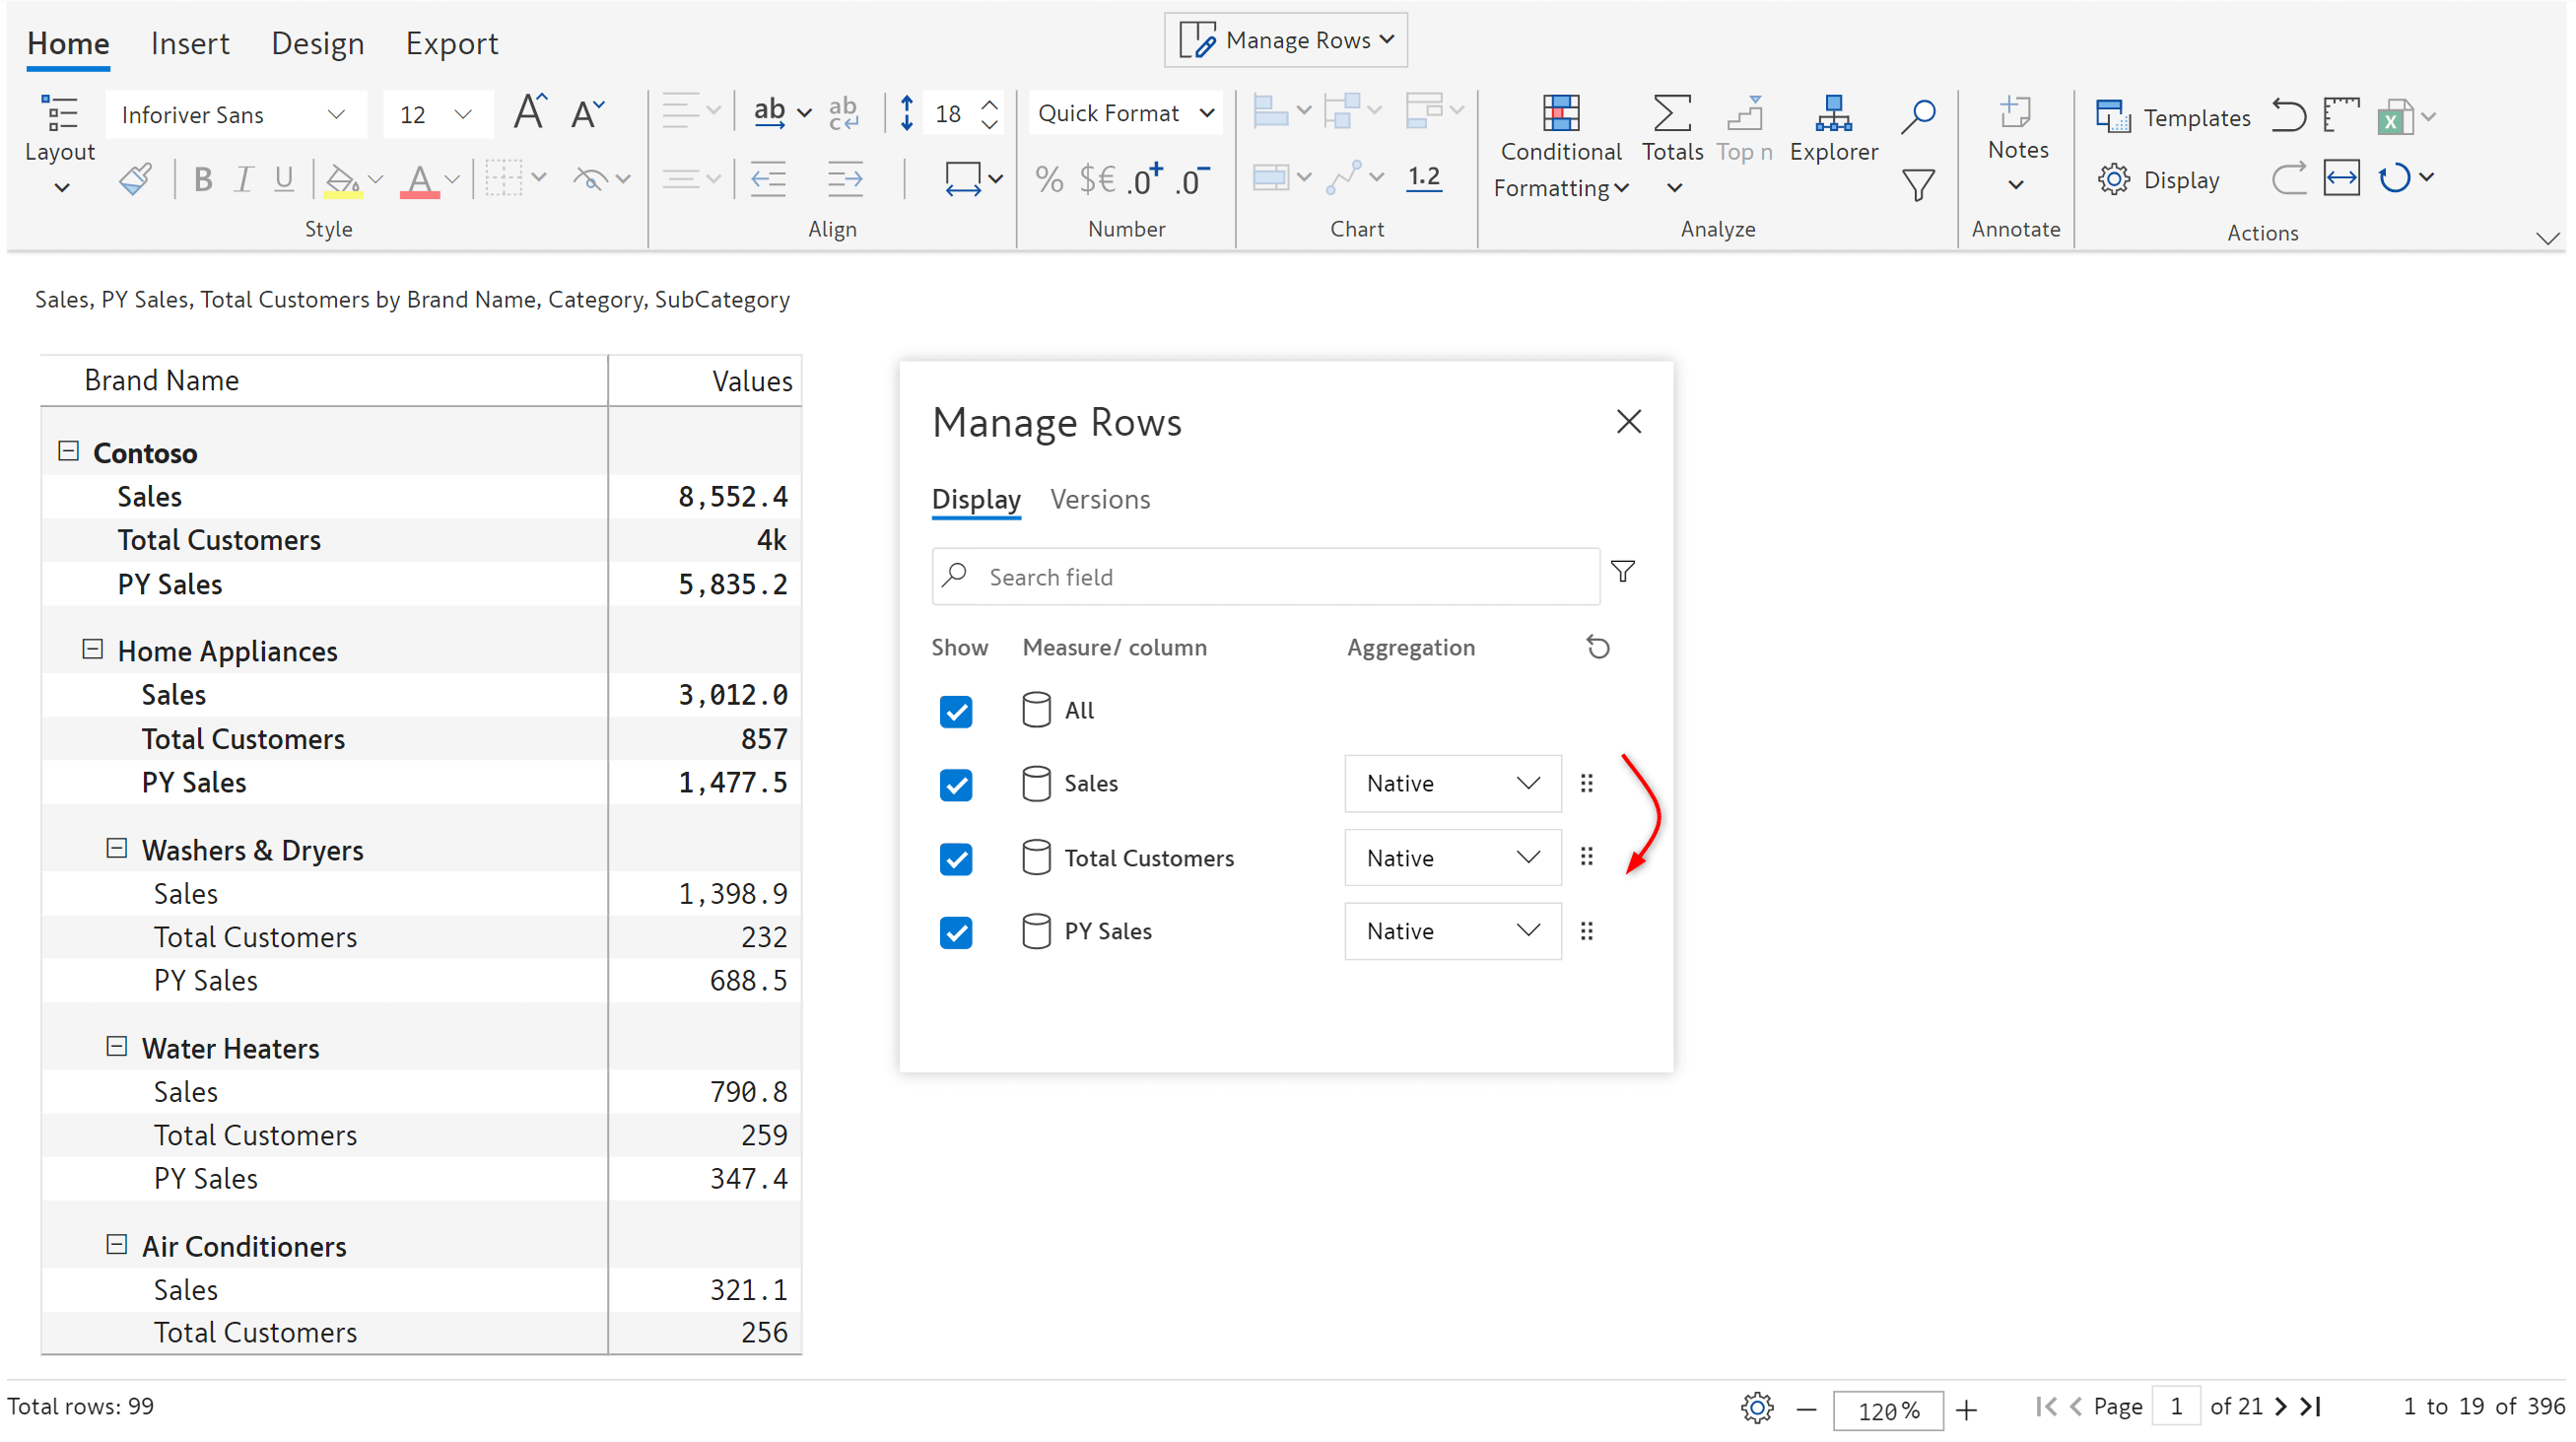
8.3. Reorder rows when measure on rows is enabled
The 2.3 release comes with two options to reorder measures, when measure on rows is enabled:
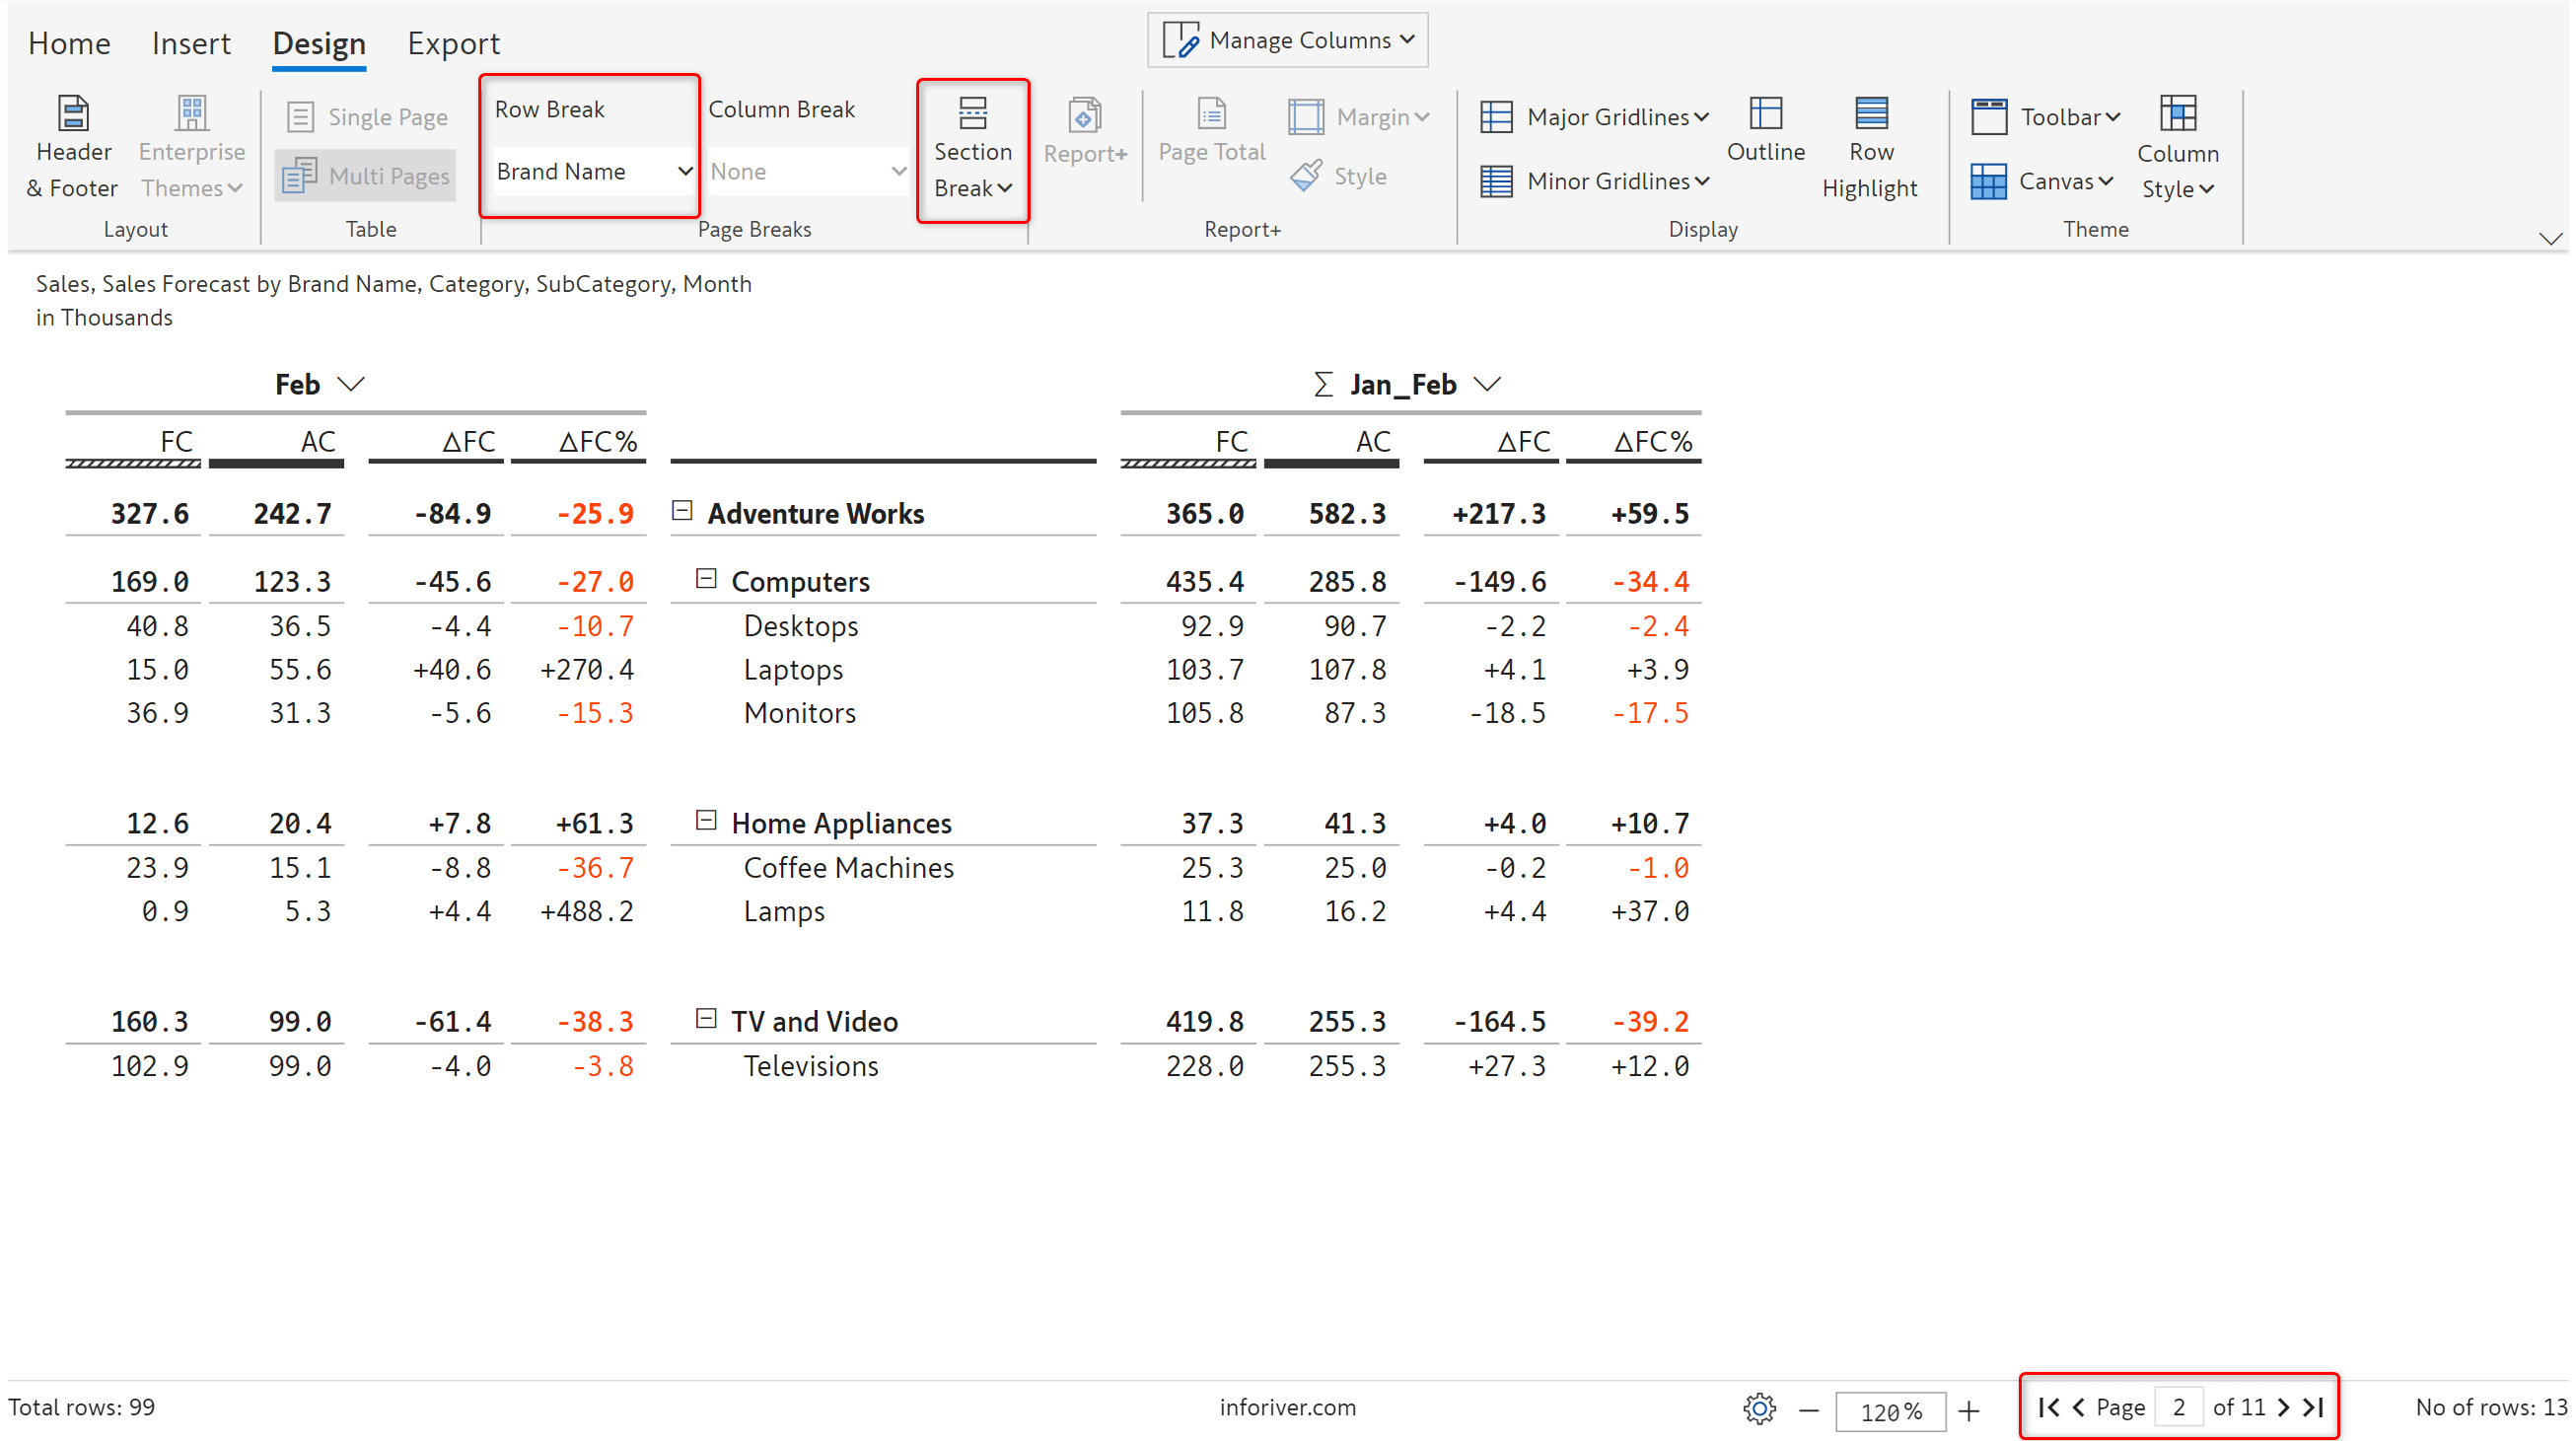
9.1. Page break
In the case of T01 and T02 templates, you can now apply row and section breaks.
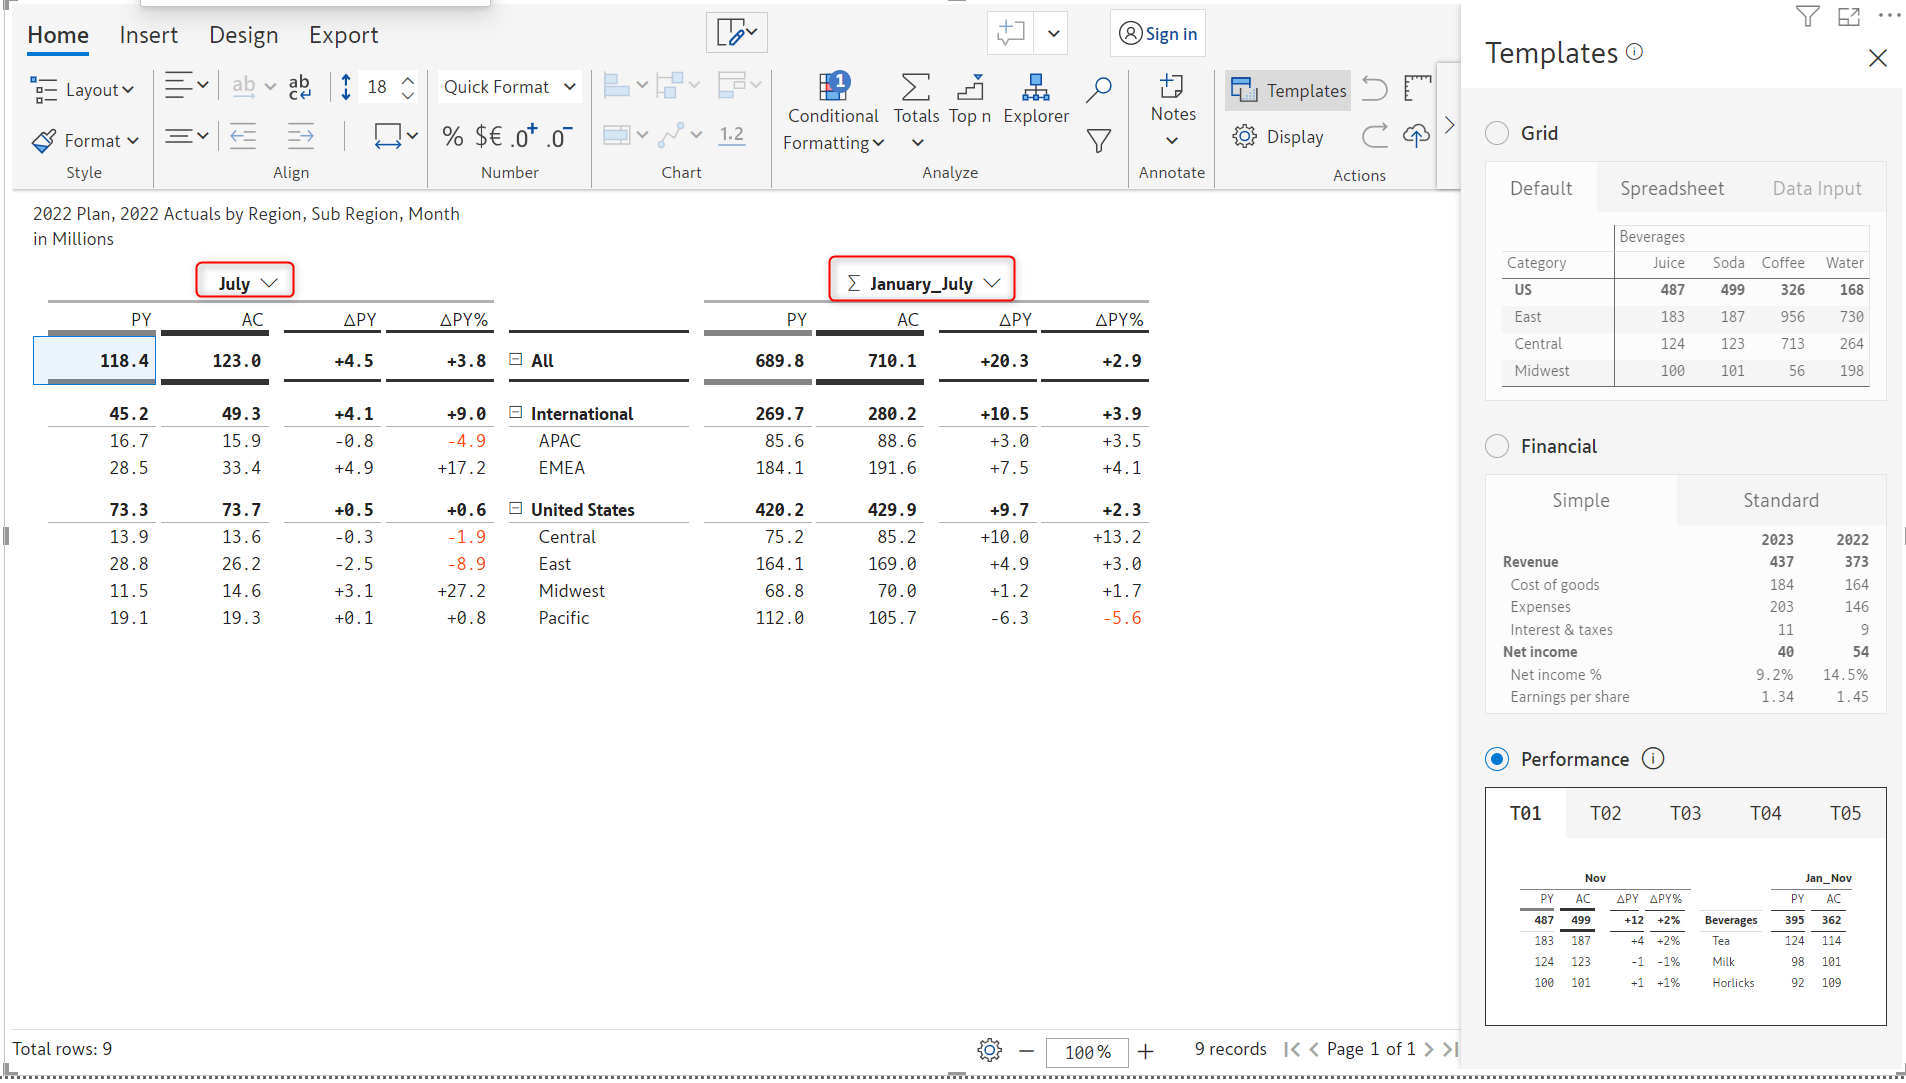
9.2. Automatic YTD comparison in T01 and T02 templates
The IBCS templates T01 and T02 have been enhanced to show YTD values automatically on the right based on the month selected in the left dropdown.
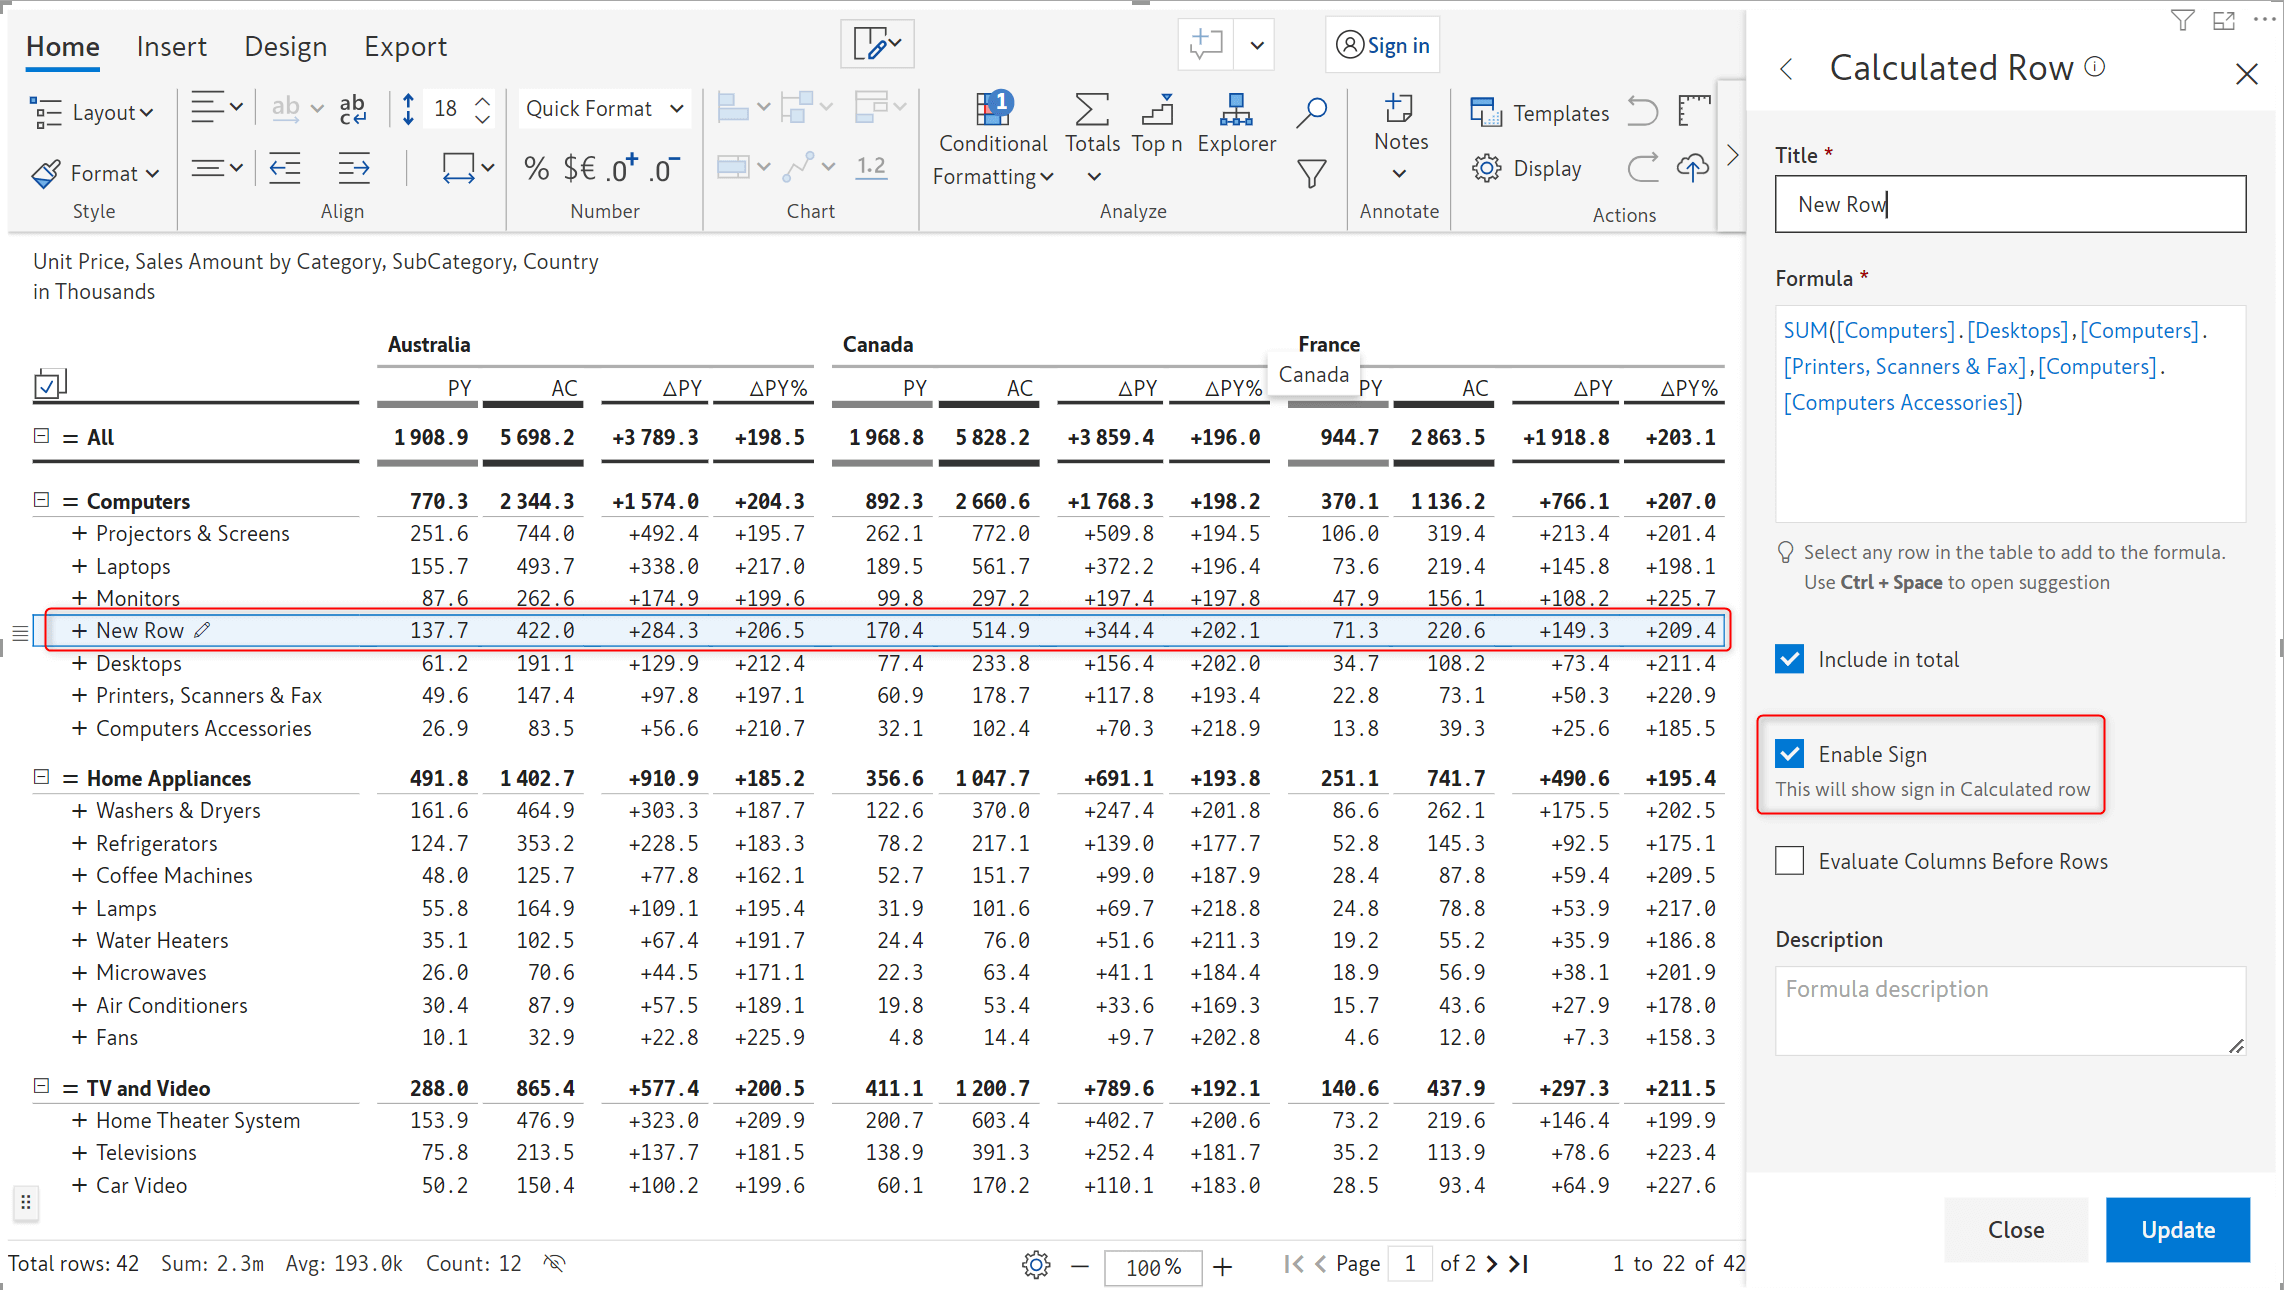
9.3. Show sign for inserted rows in IBCS templates
For all IBCS templates, you can enable sign for inserted rows by selecting the ‘Enable sign’ checkbox.
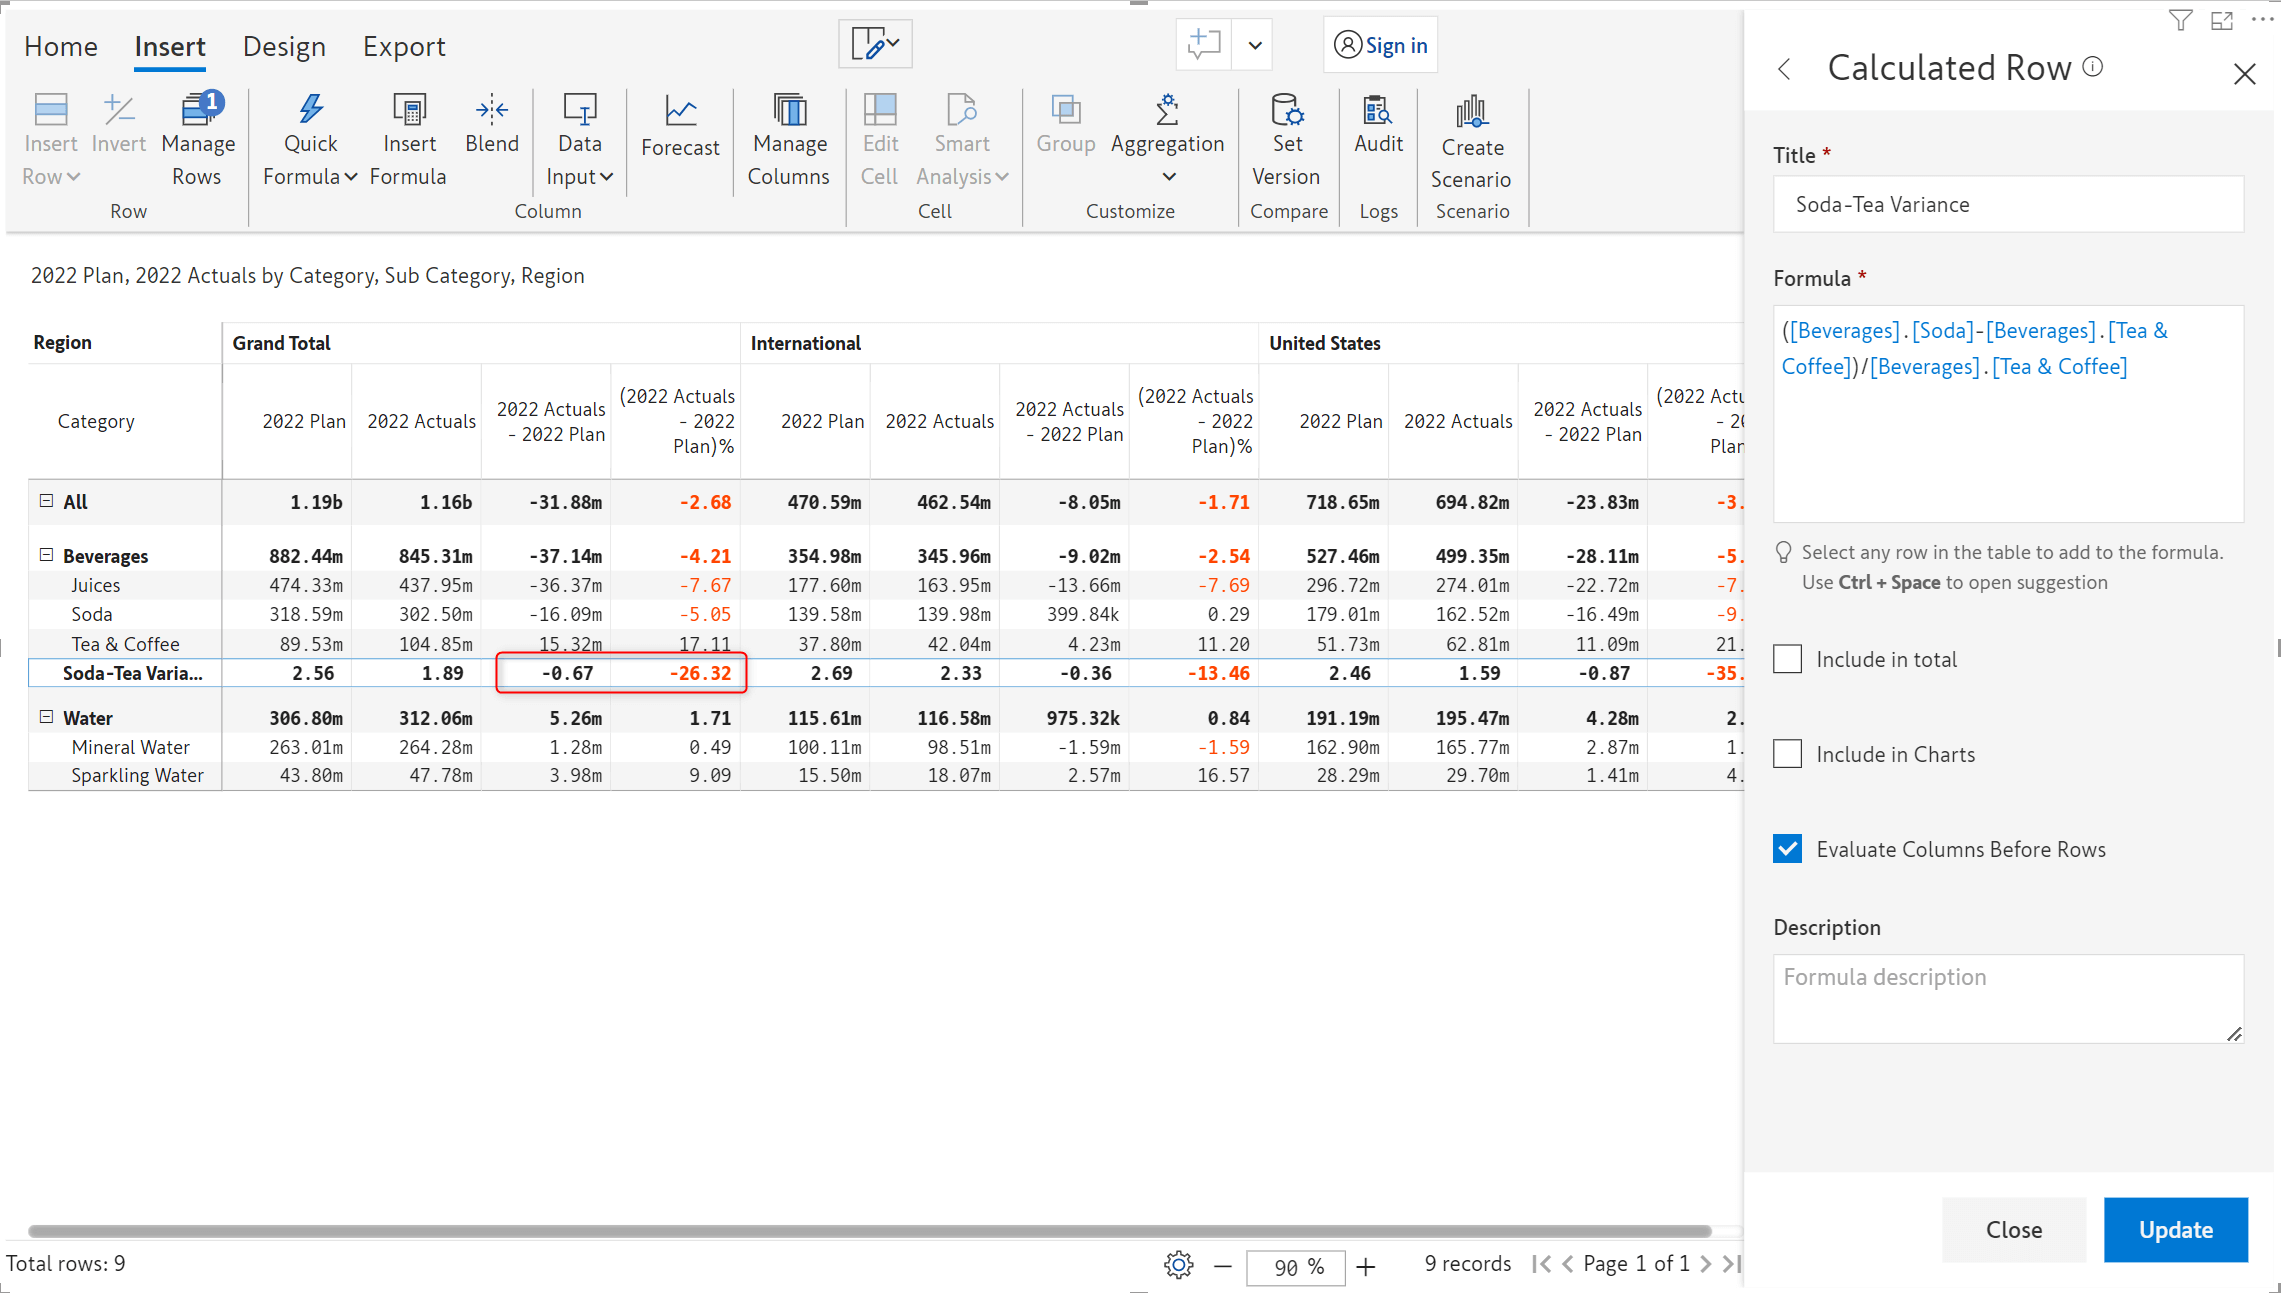
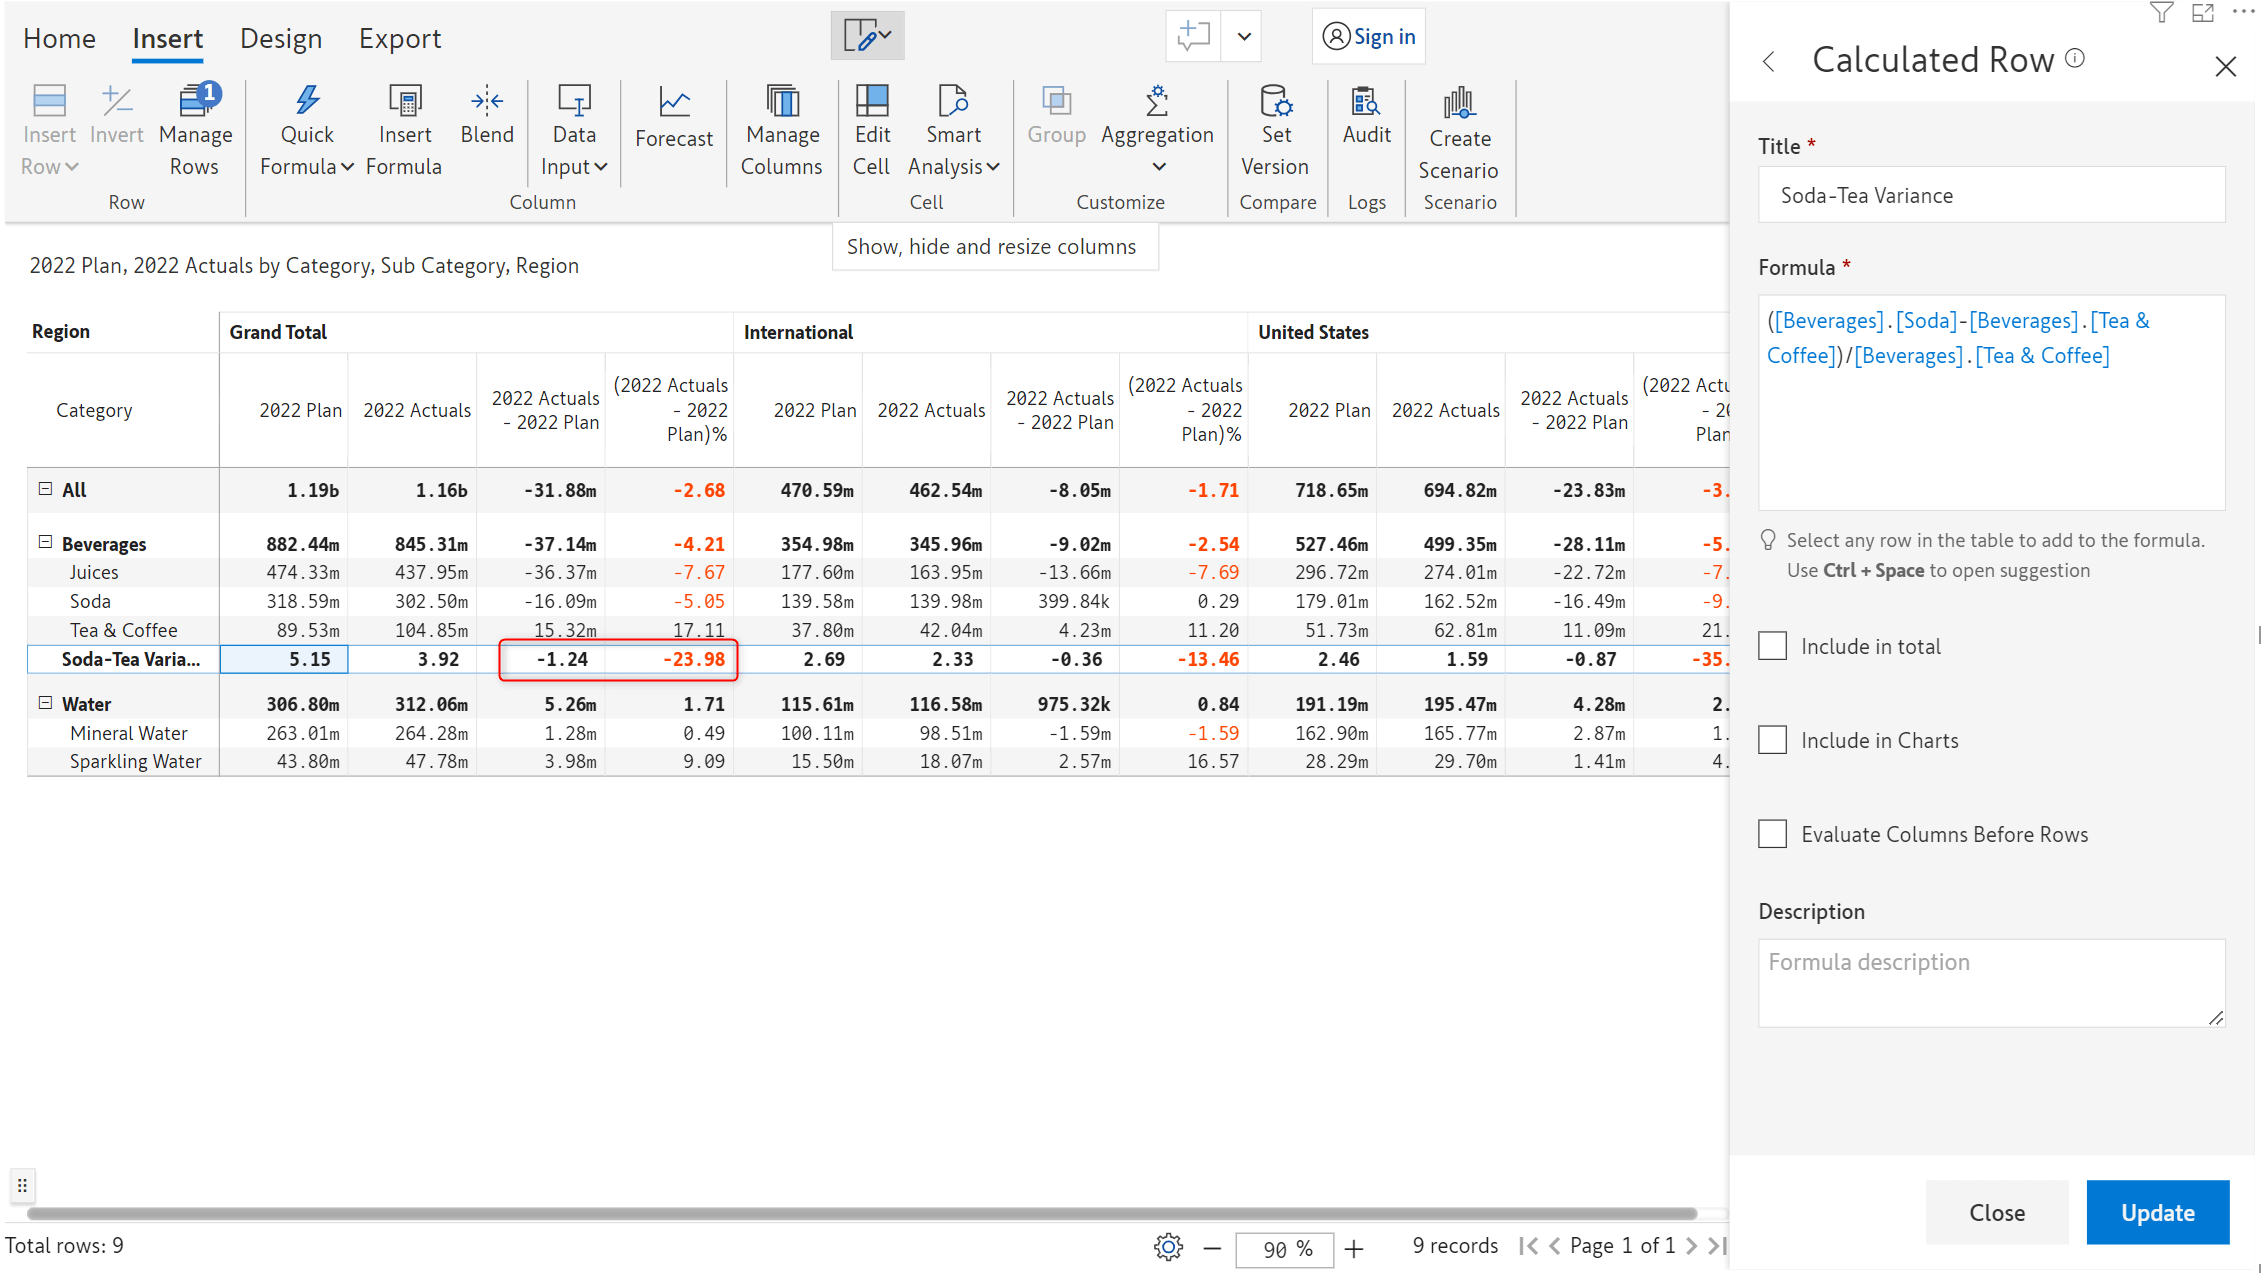
For calculated rows, the variance and variance% values will be calculated based on the two measures being compared.
The example below shows the variance and variance% with the ‘Evaluate columns before rows’ enabled.
The image below shows the same report with ‘Evaluate columns before rows’ disabled.
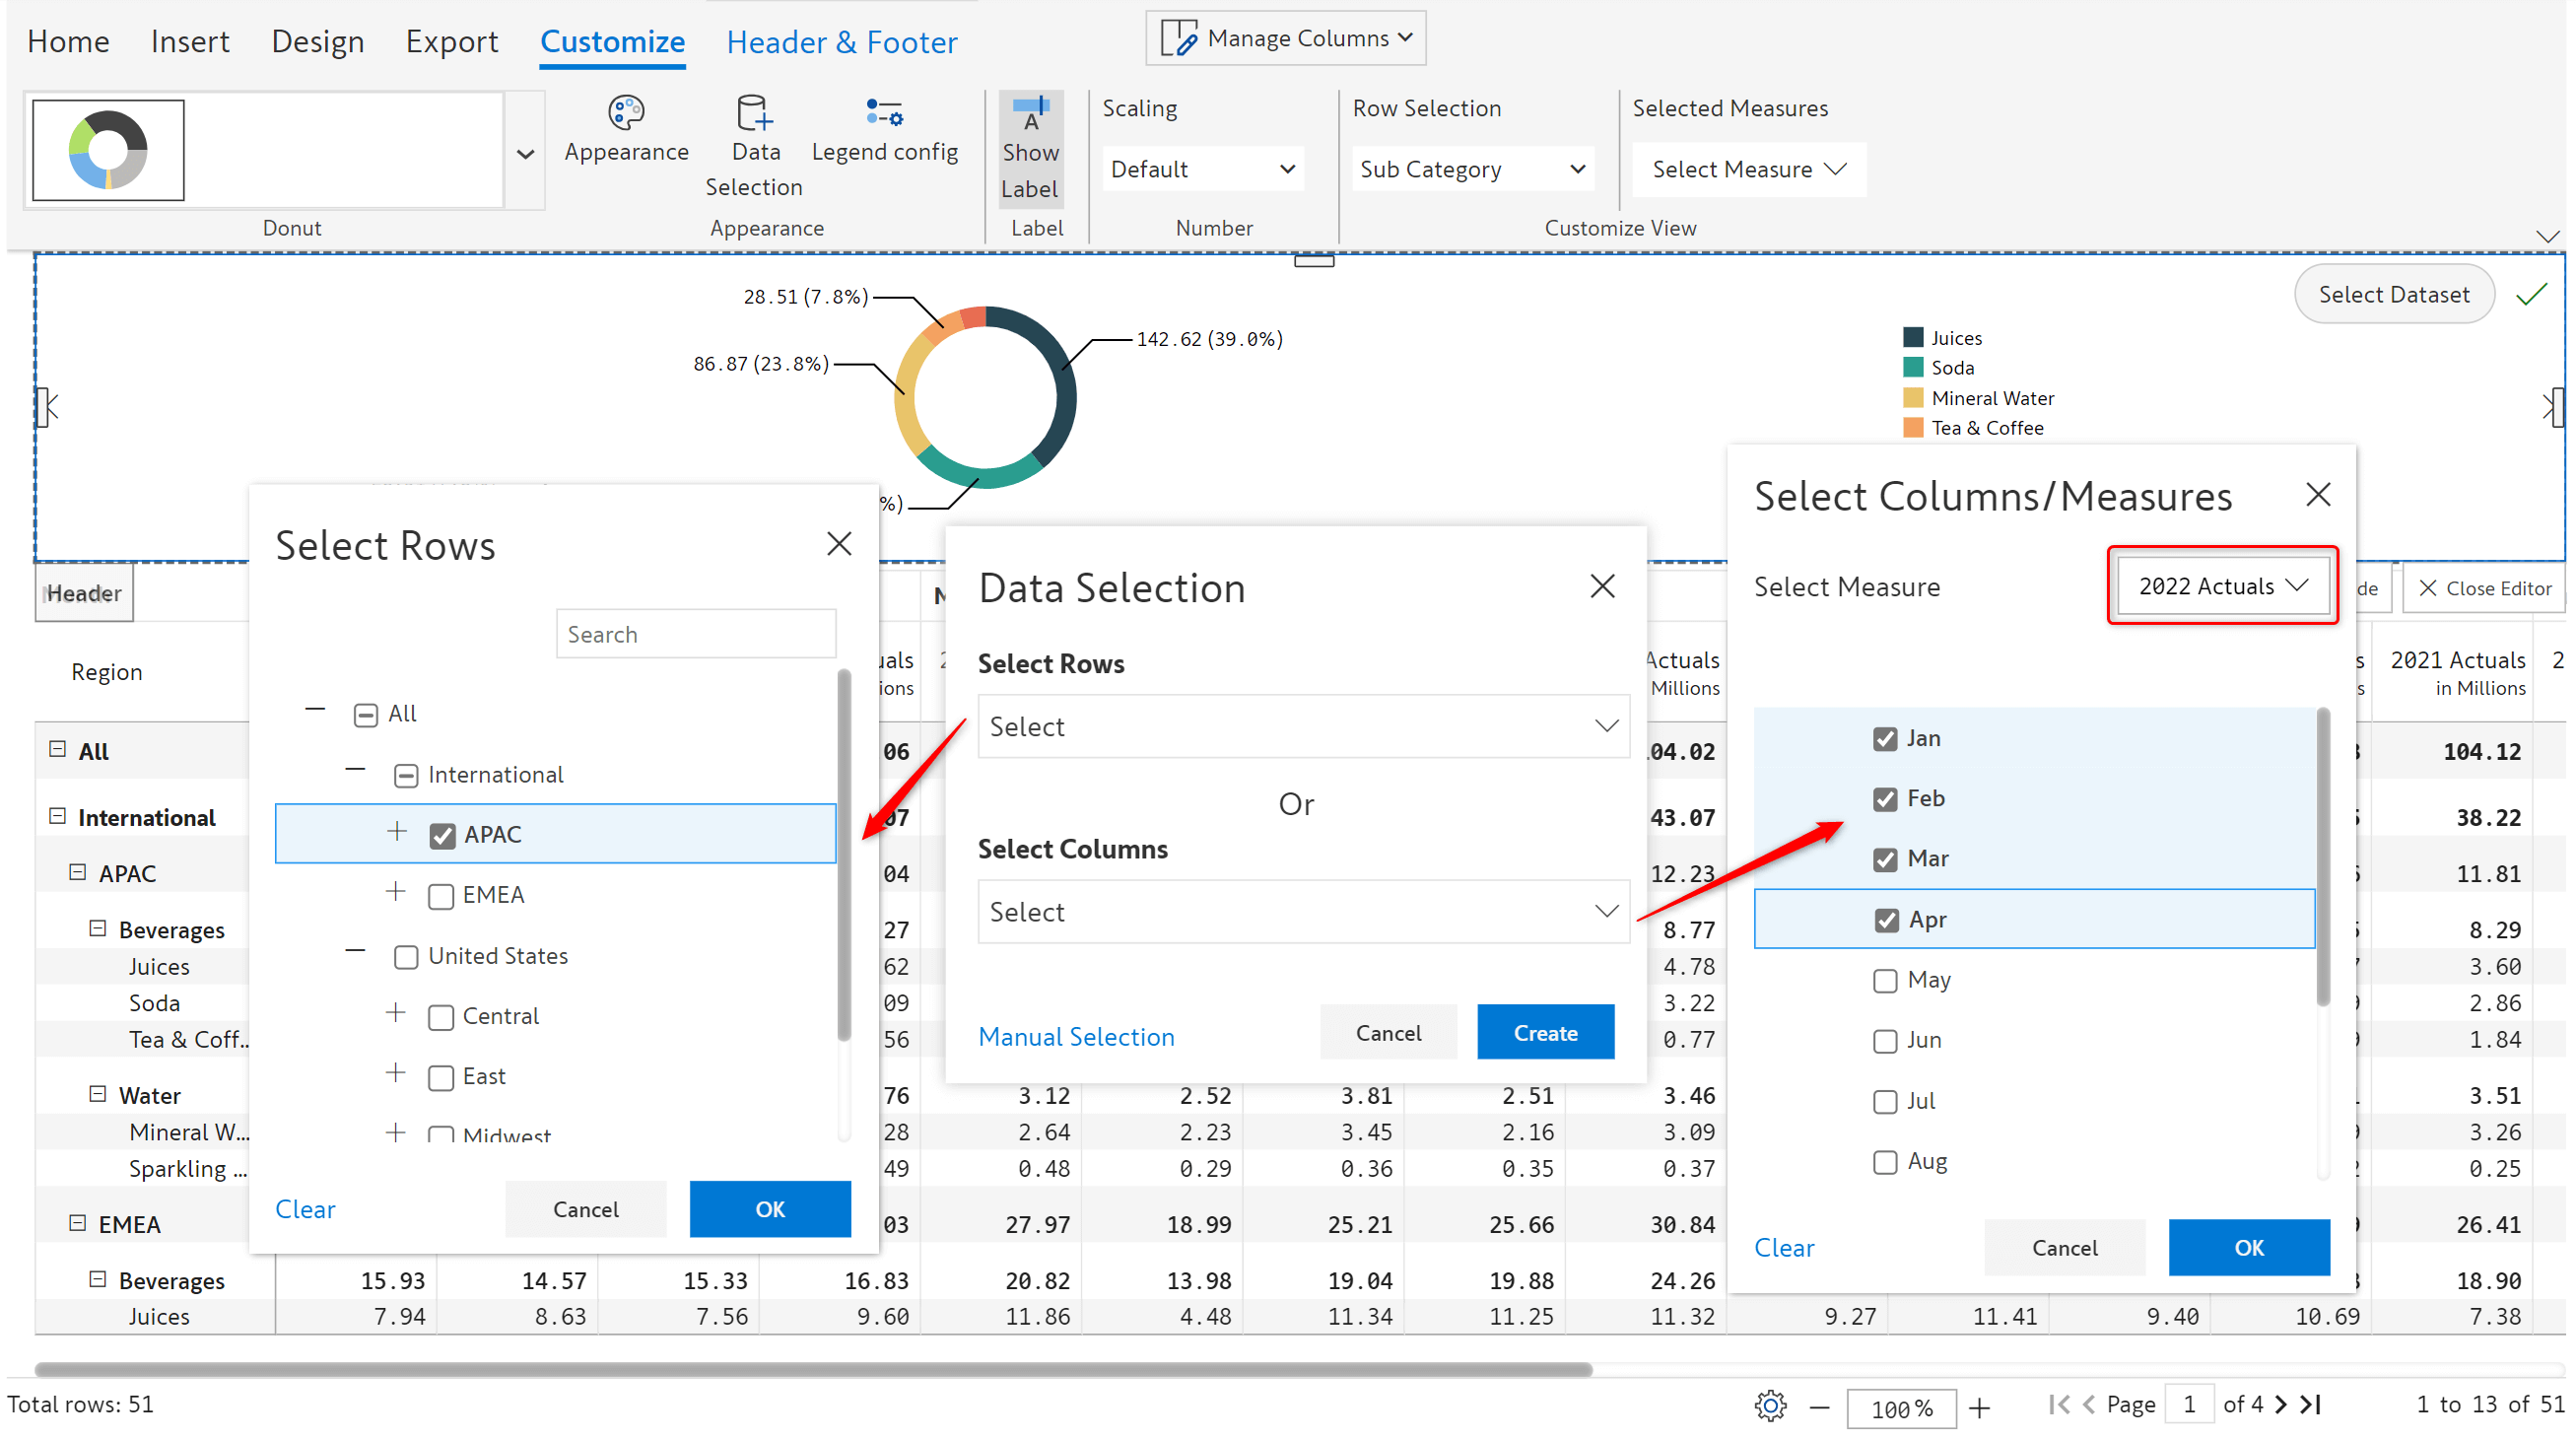
11.1. Data selection for charts and KPIs in header
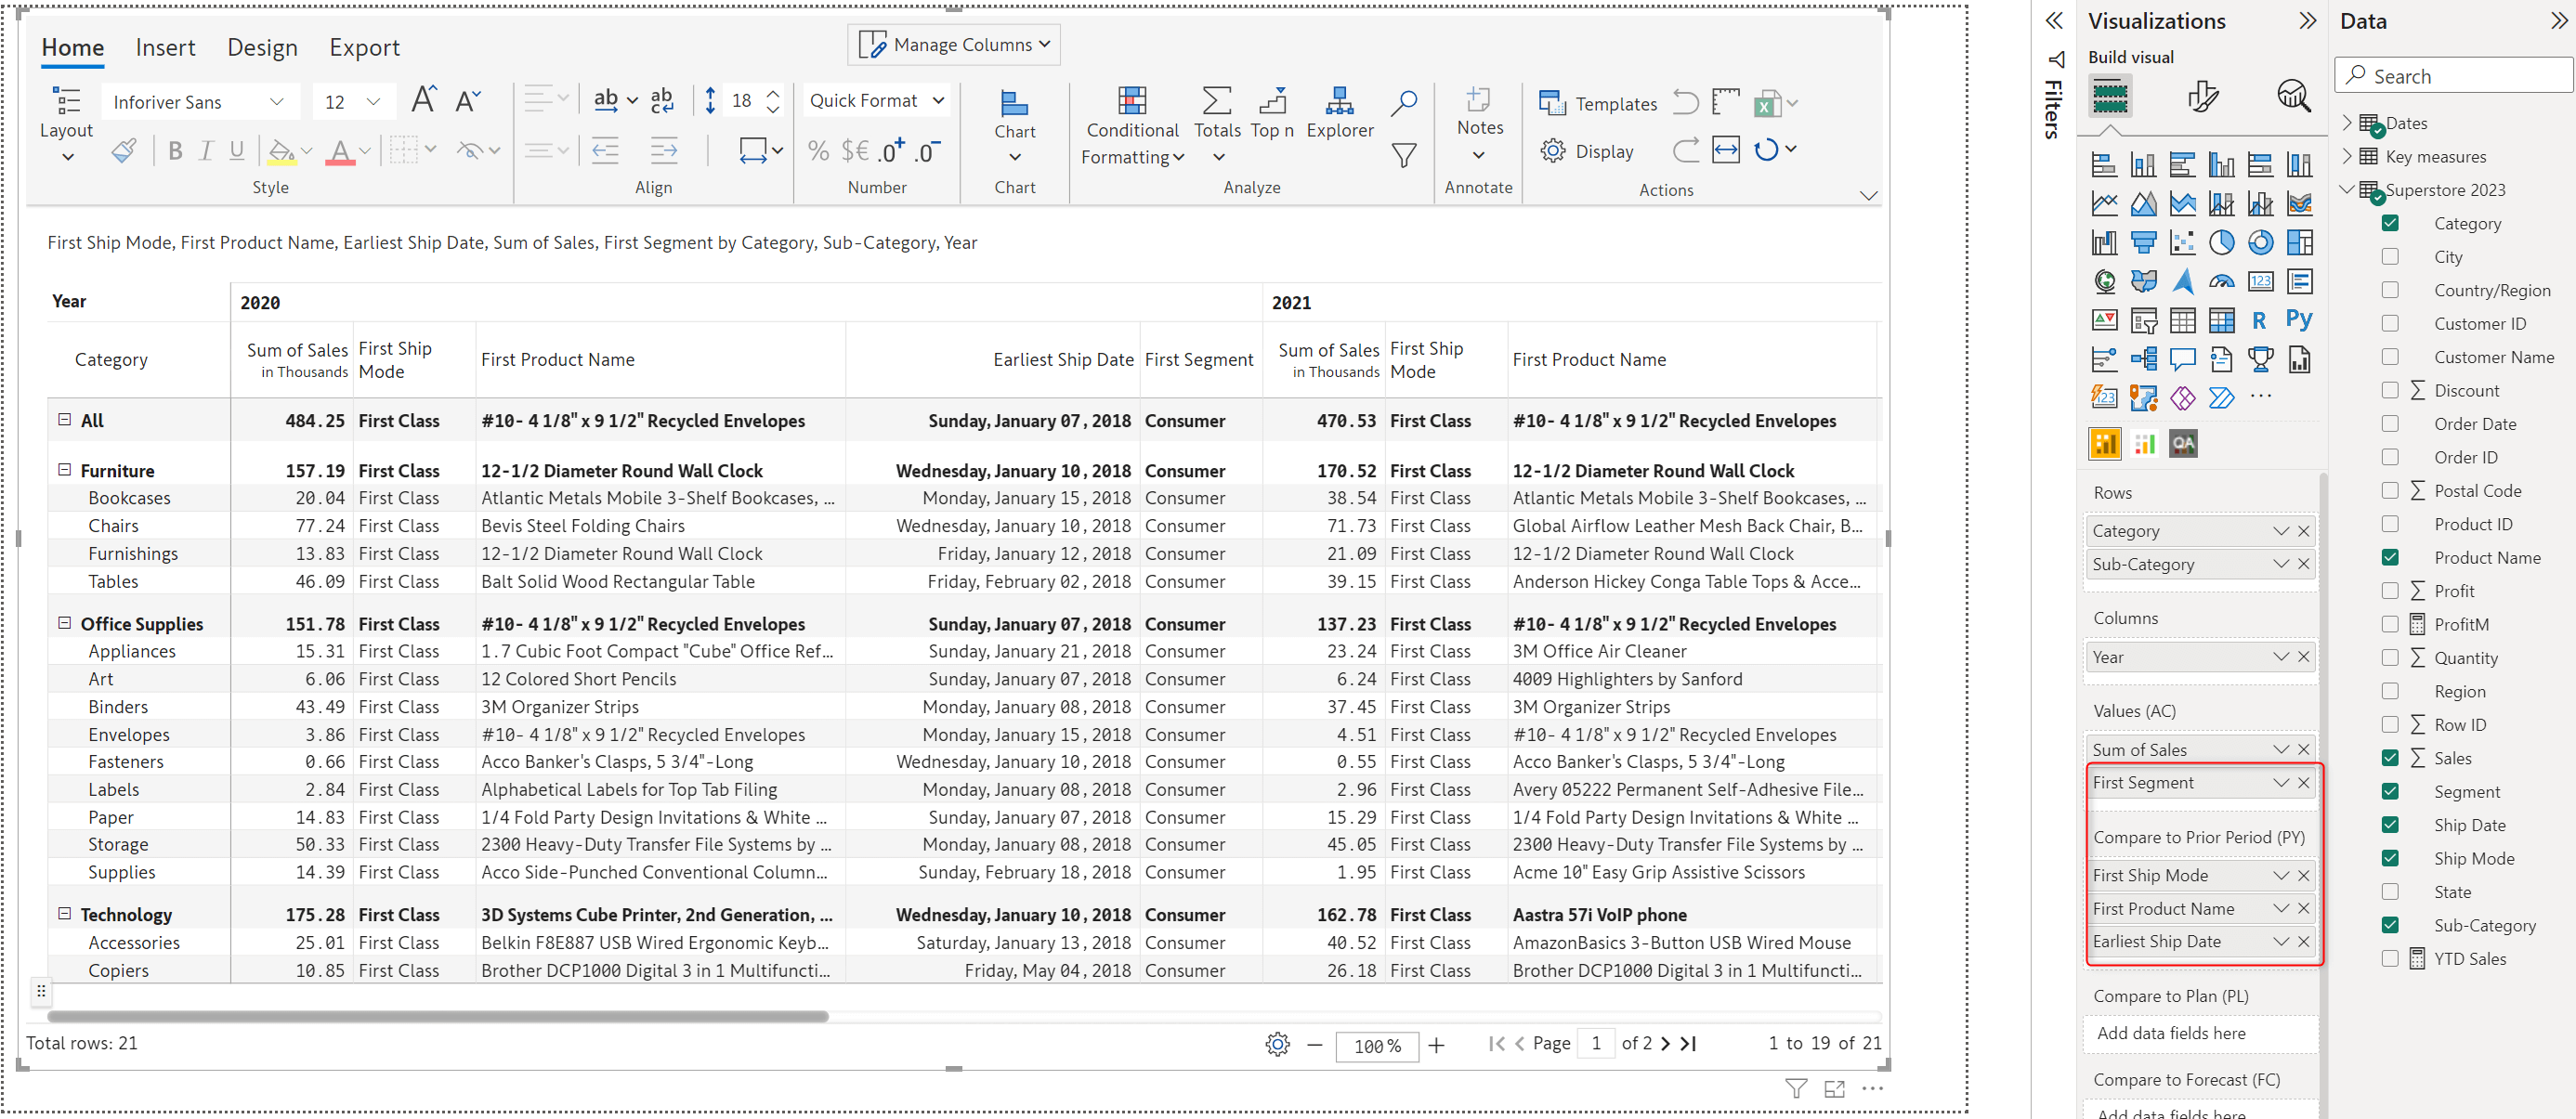
Data selection for the charts and KPIs in the report header has been streamlined. You can either select rows or columns as shown below. Manual selection can also be performed.
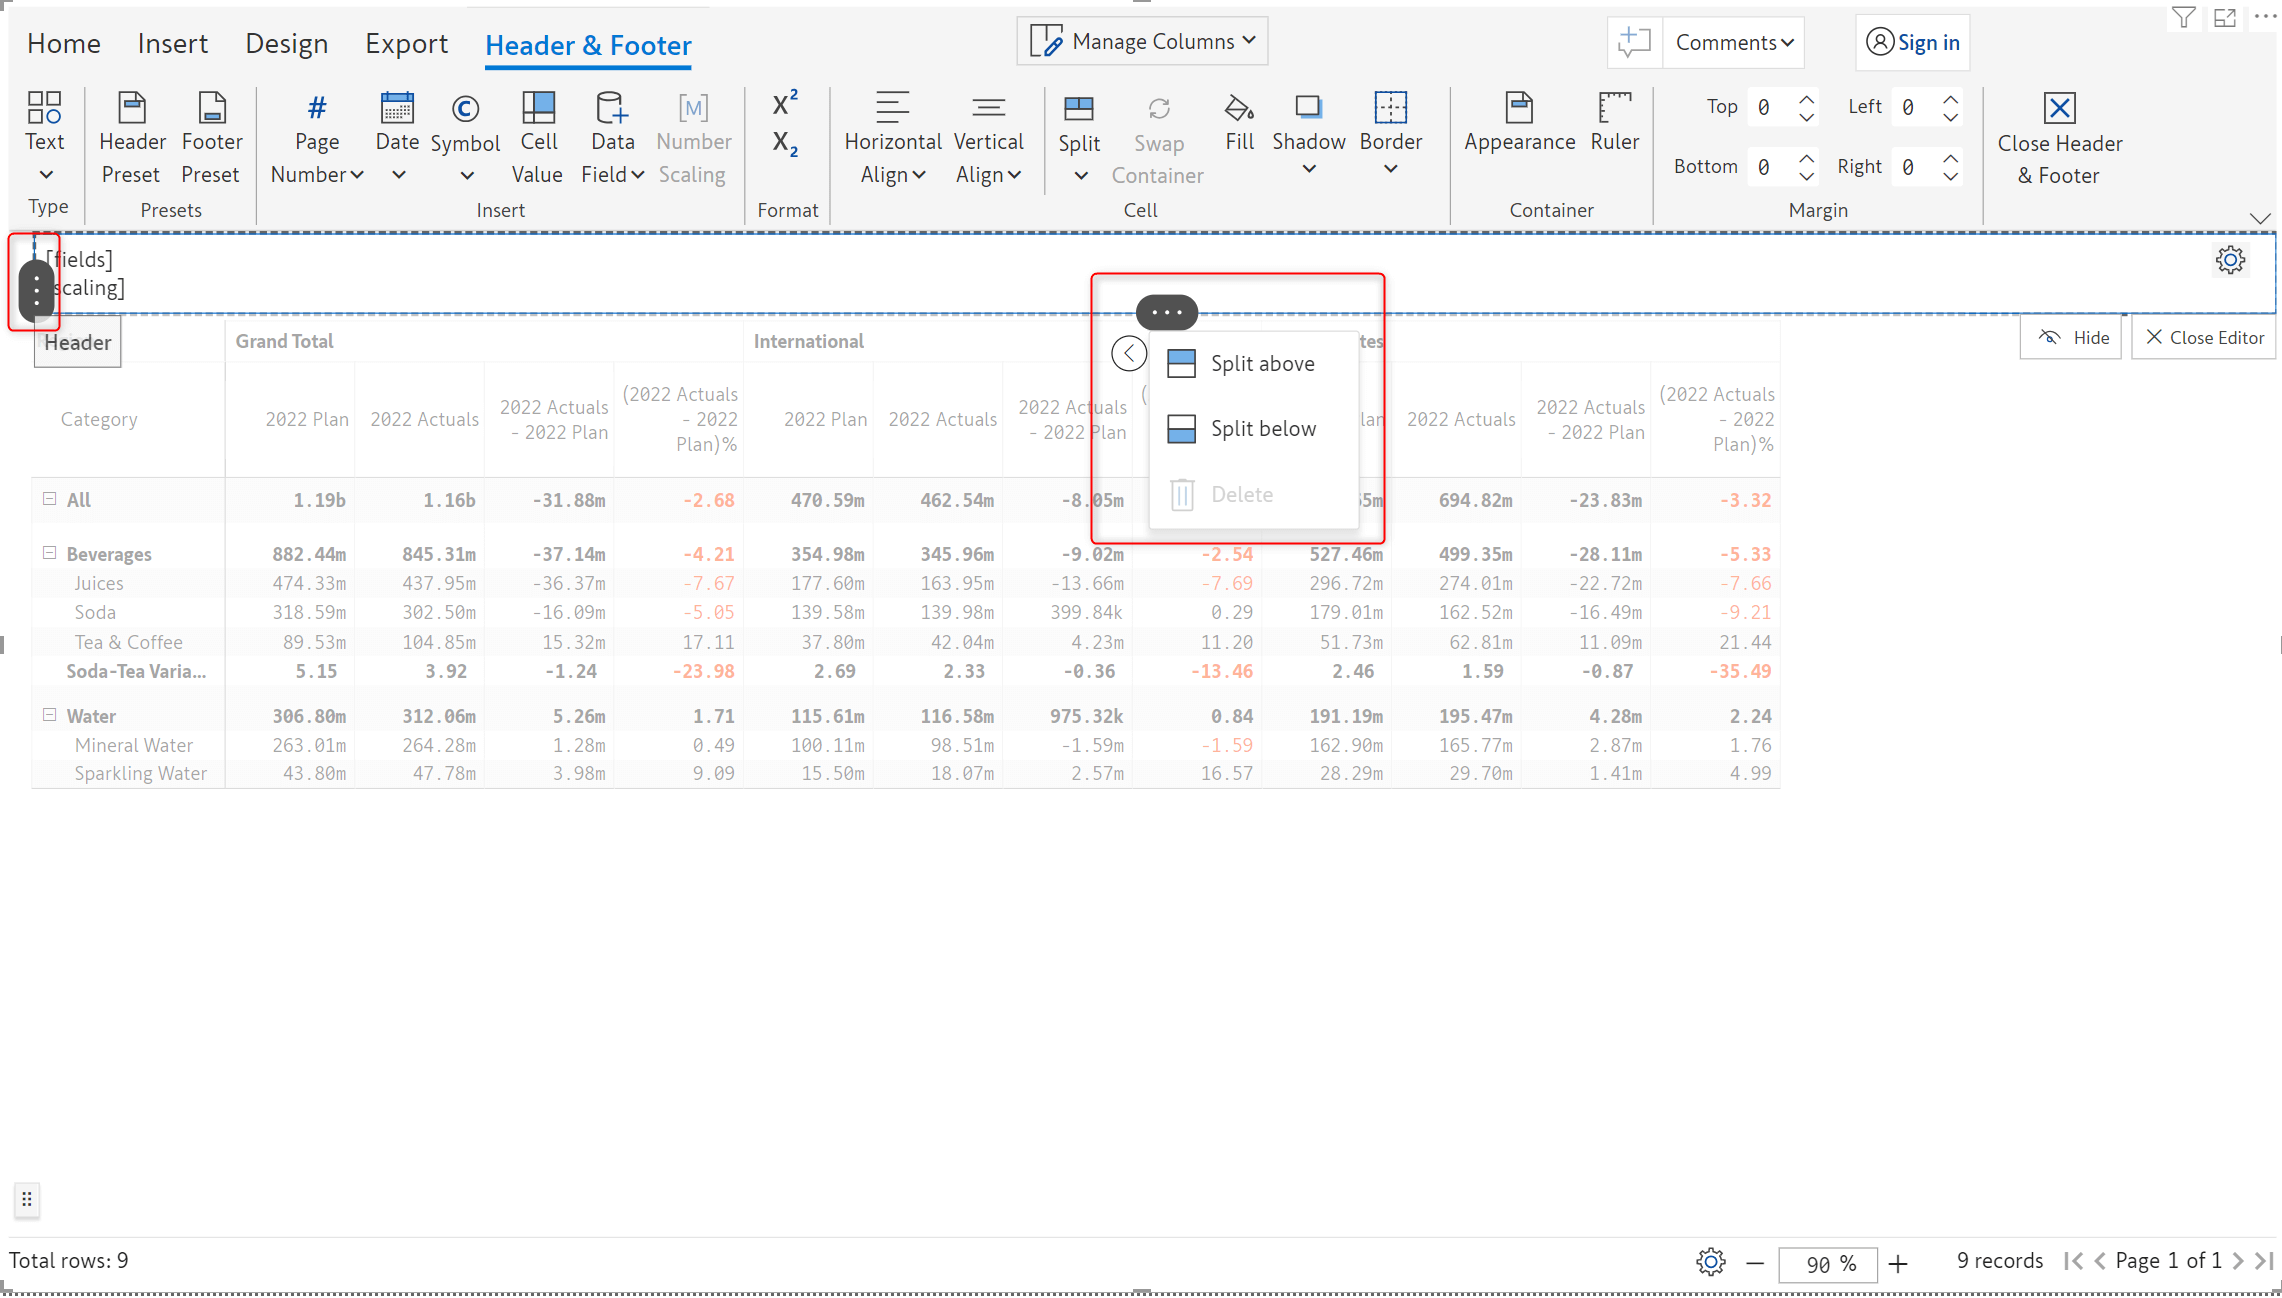
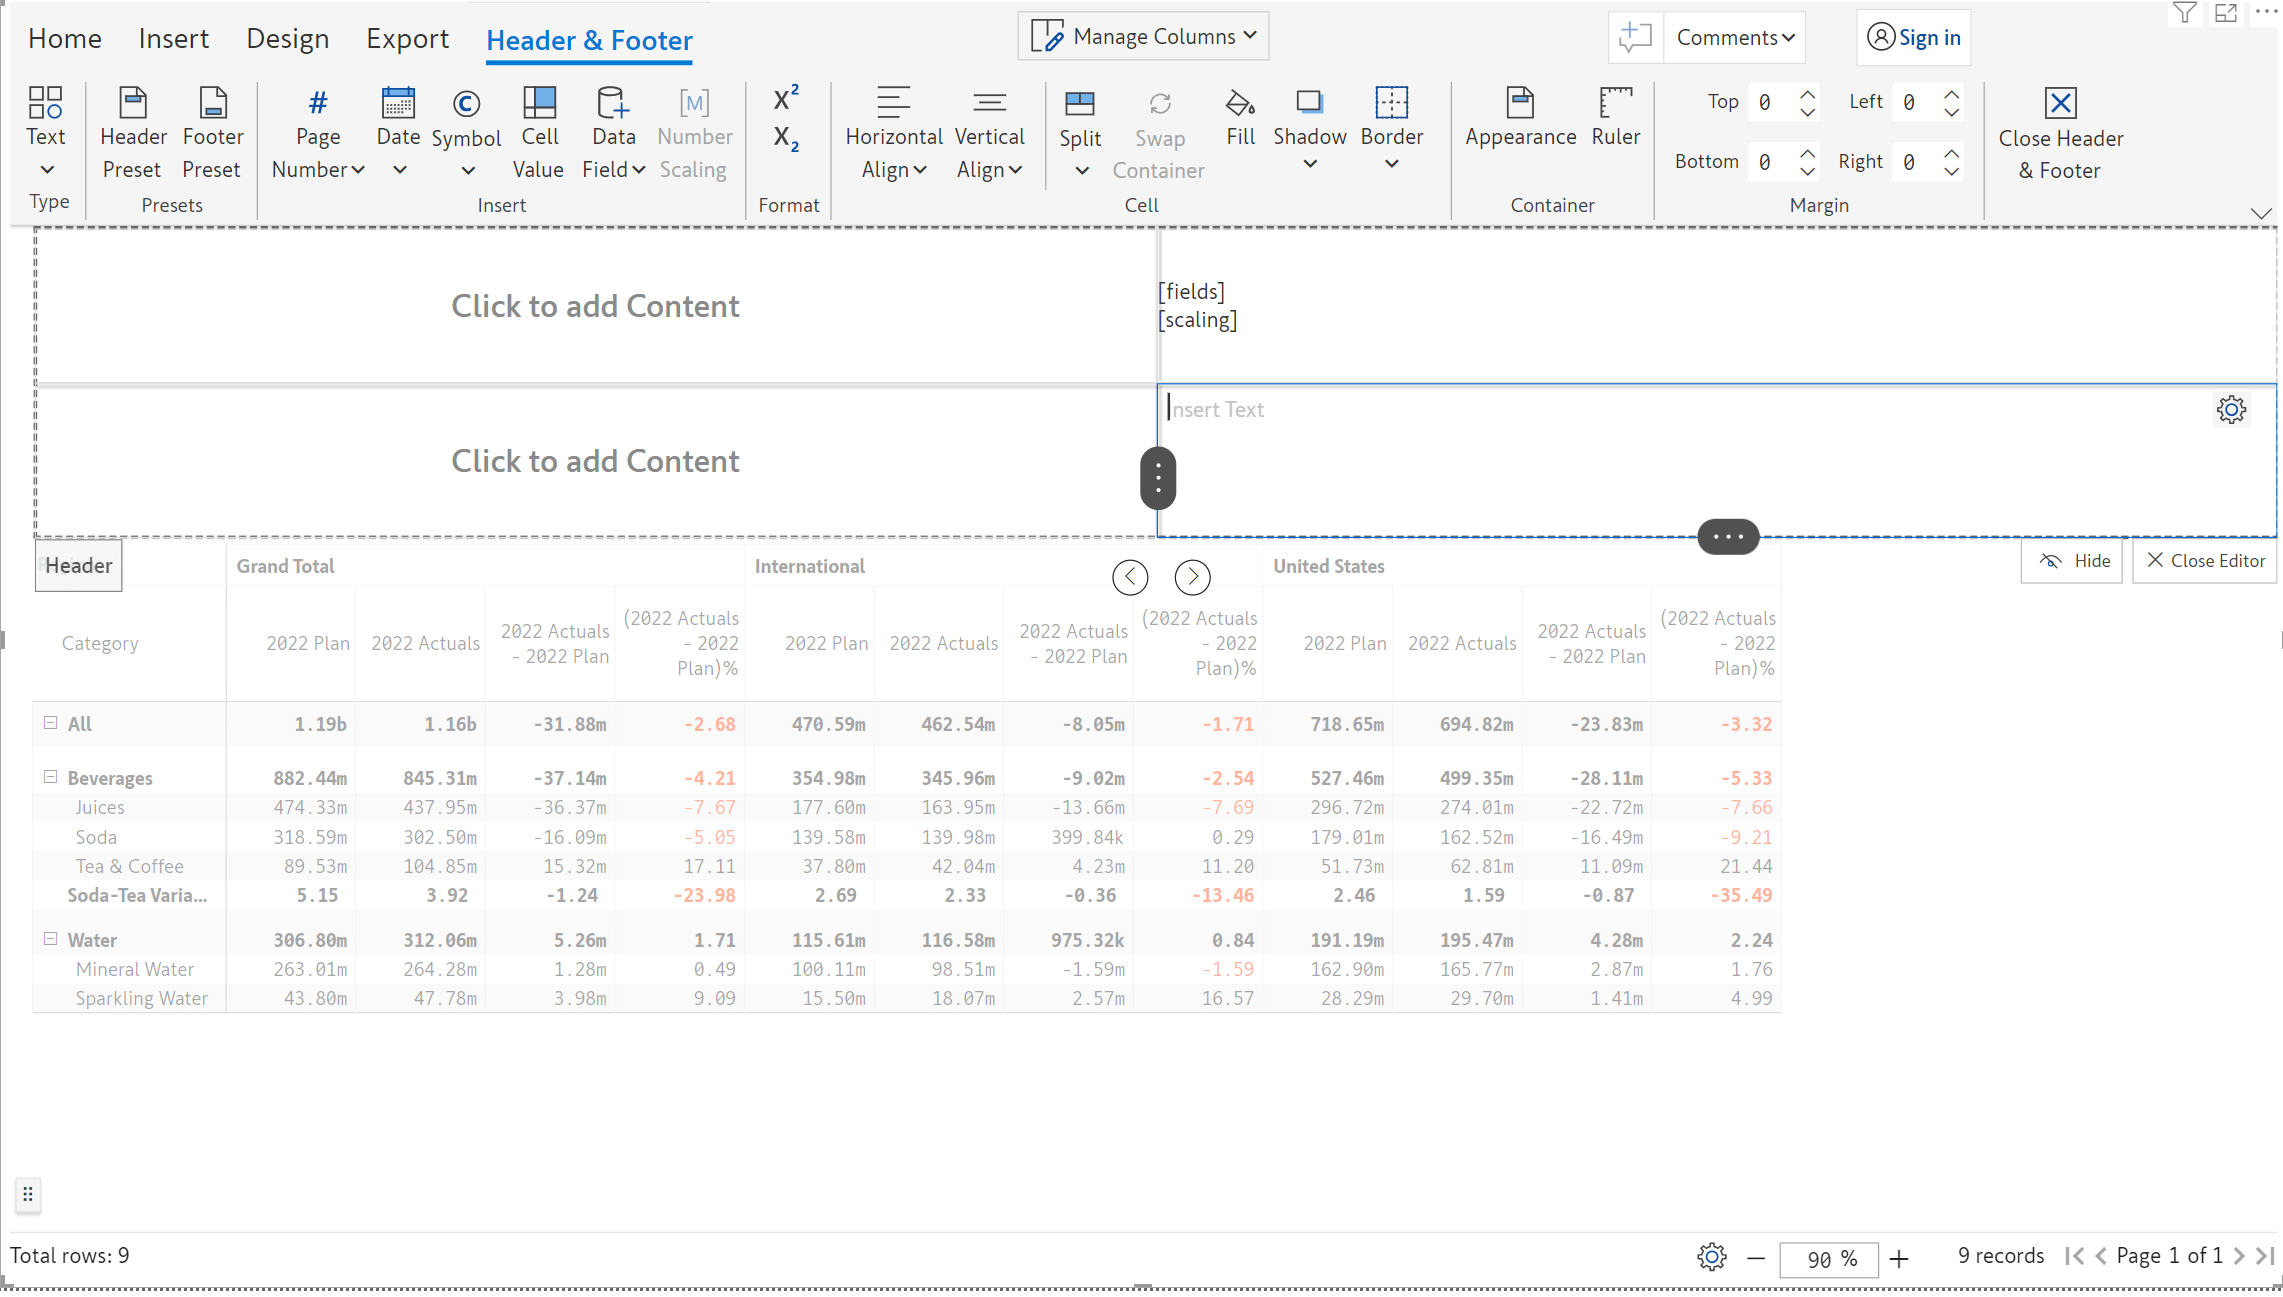
11.2. Split container
The interface to split the header container has been modified to make it more intuitive. Simply click on the menu icon at the bottom or on the side of the header container to split it:
11.3. Ungroup KPI
Till the previous version, the customization options for KPI cards in the header were limited to:
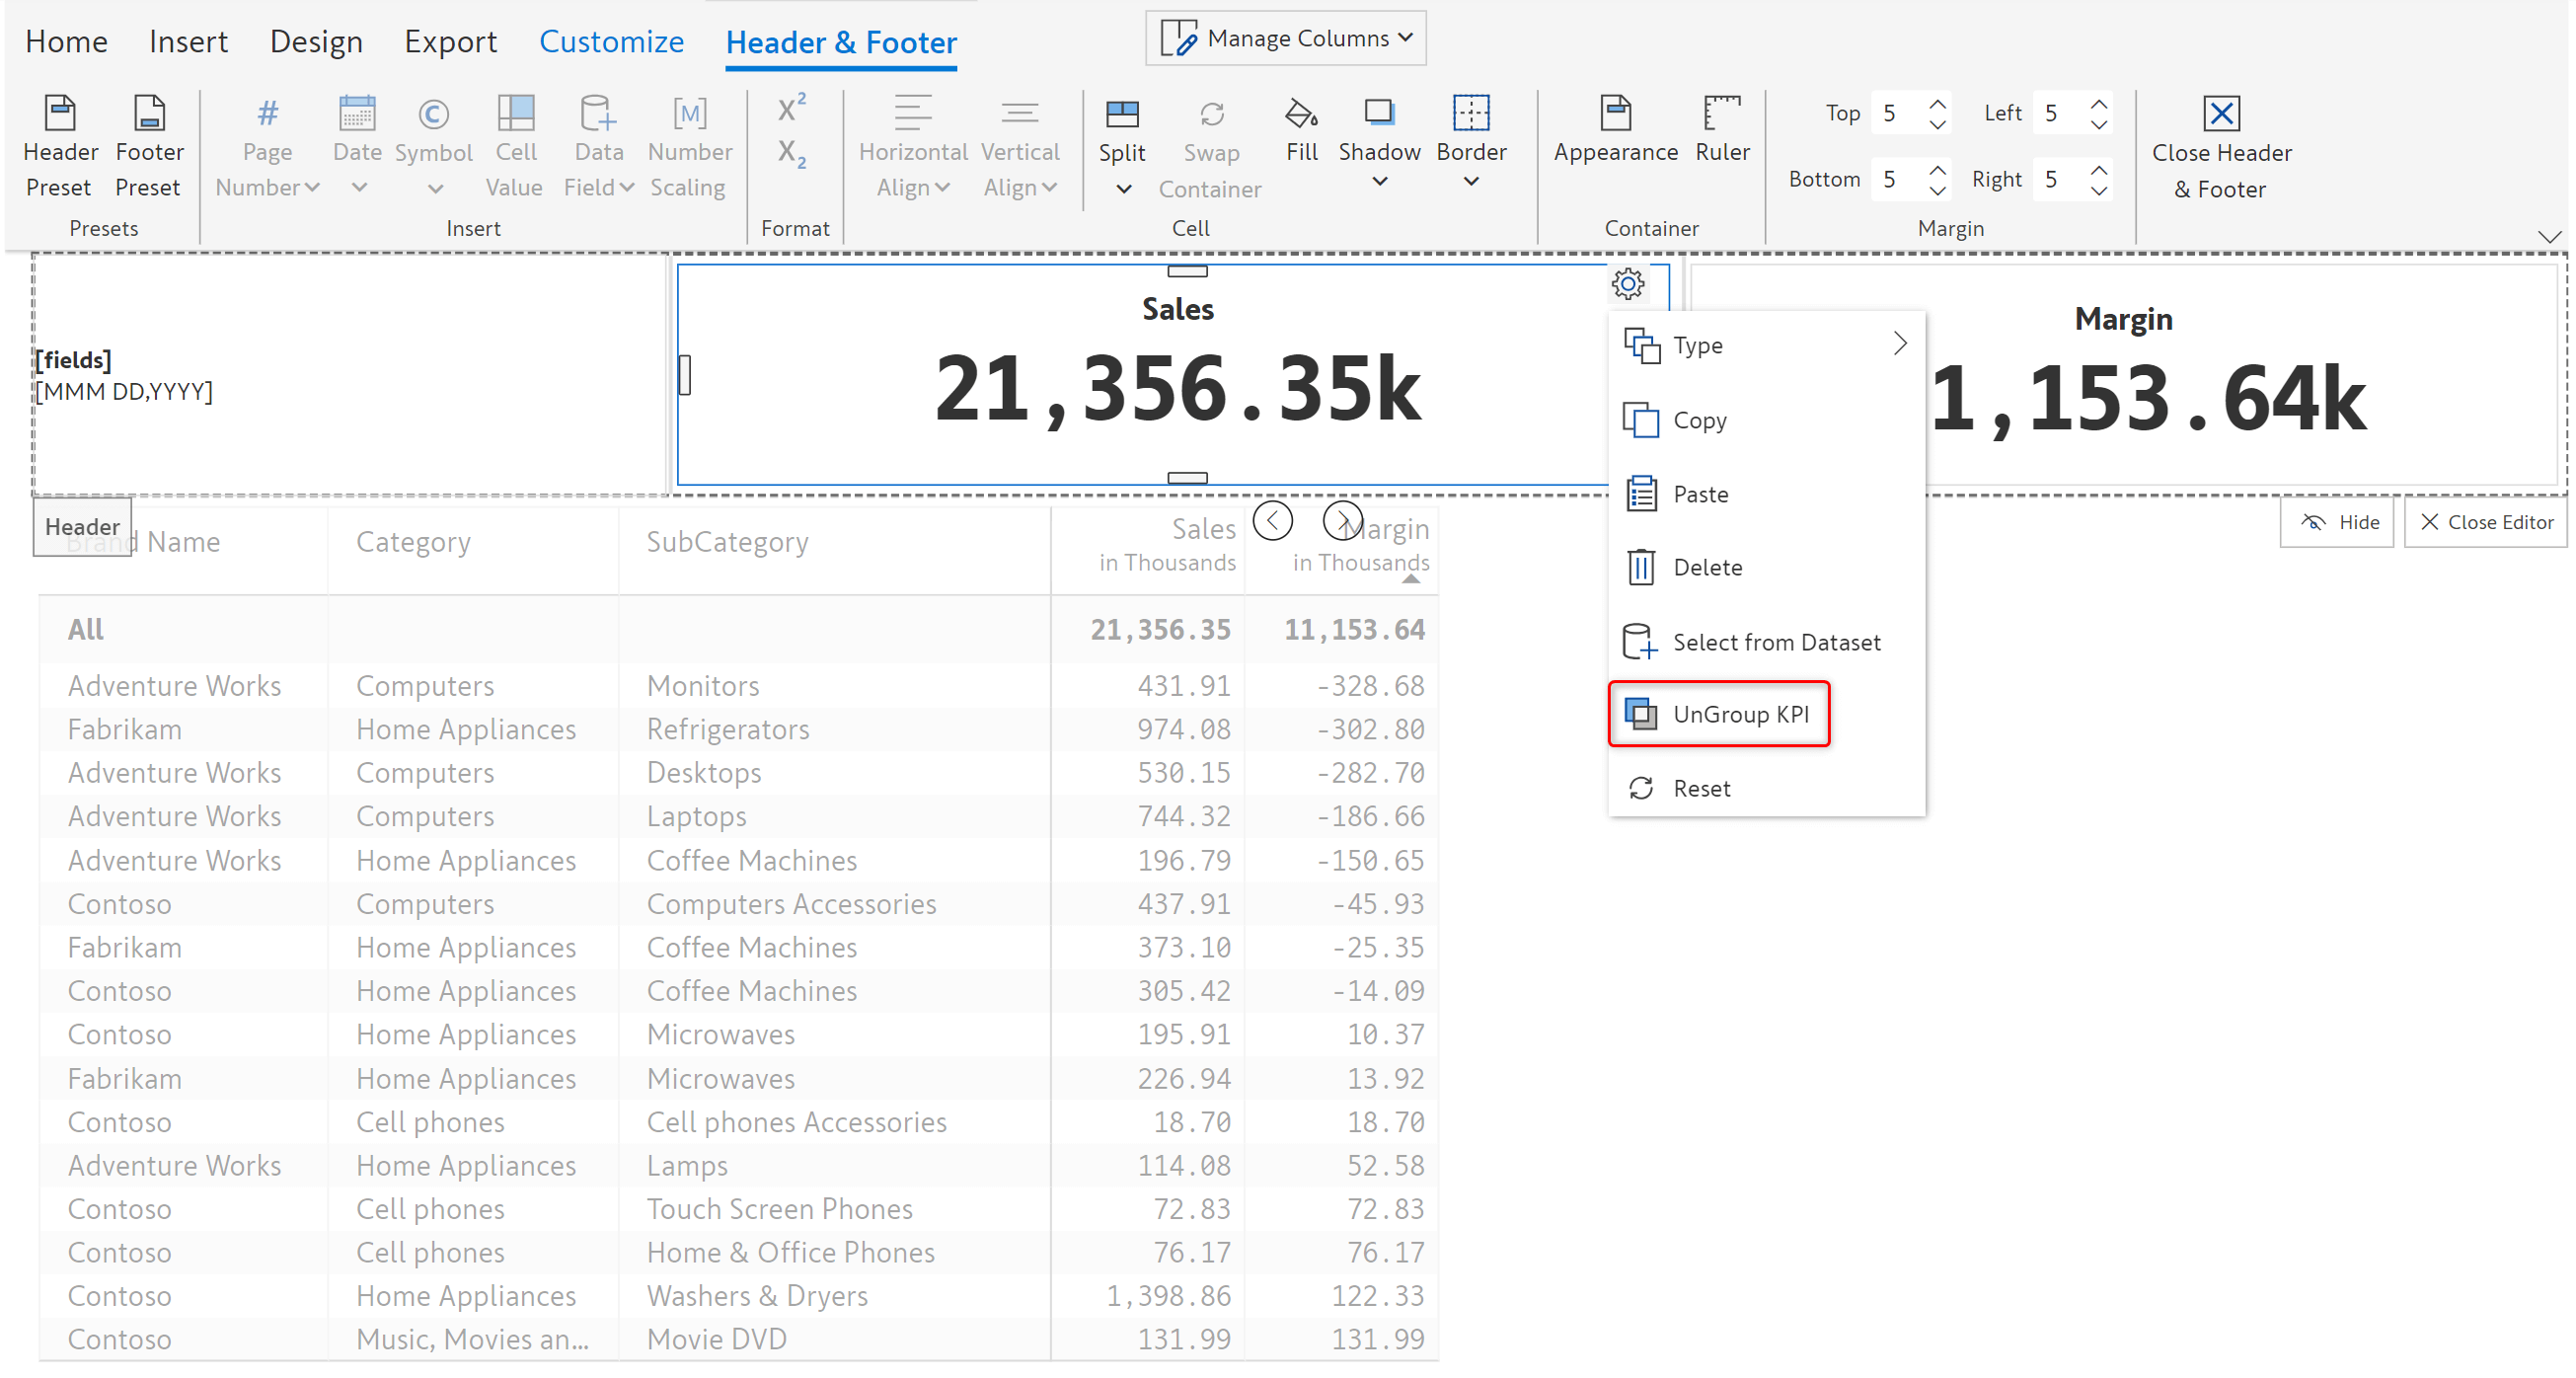
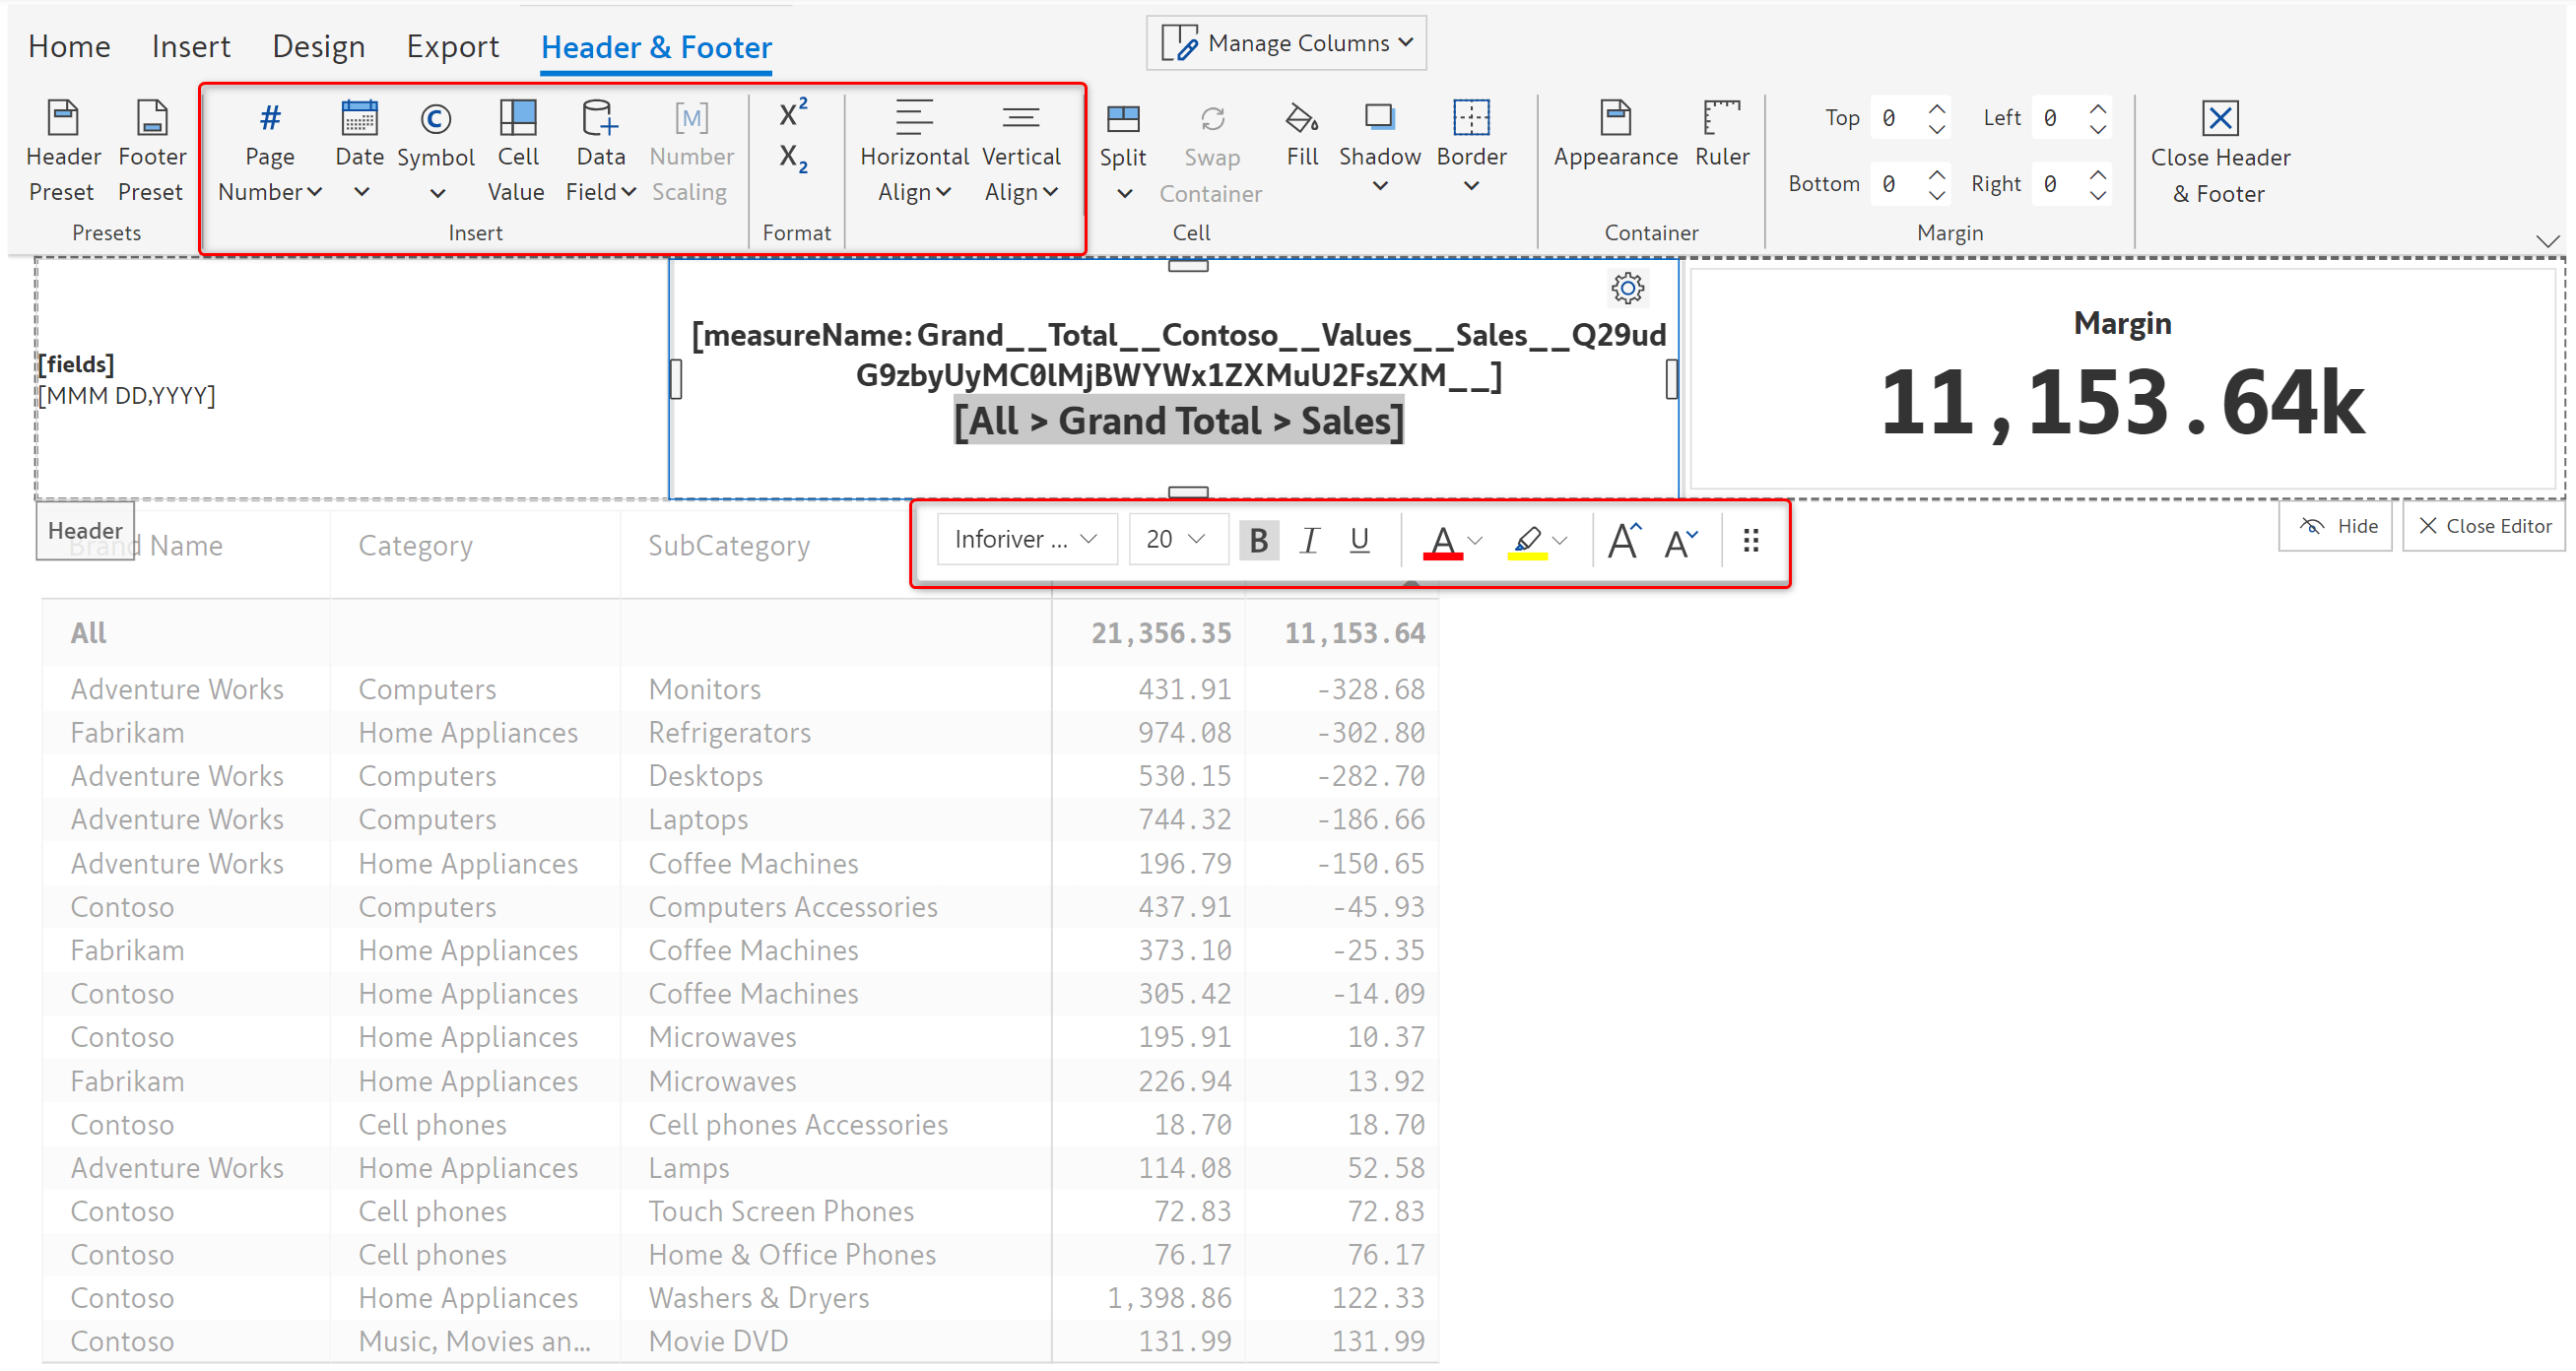
With this new release, you can ungroup the desired KPIs, apply advanced formatting using the floating toolbar and insert elements such as cell value, data field, number scaling etc.
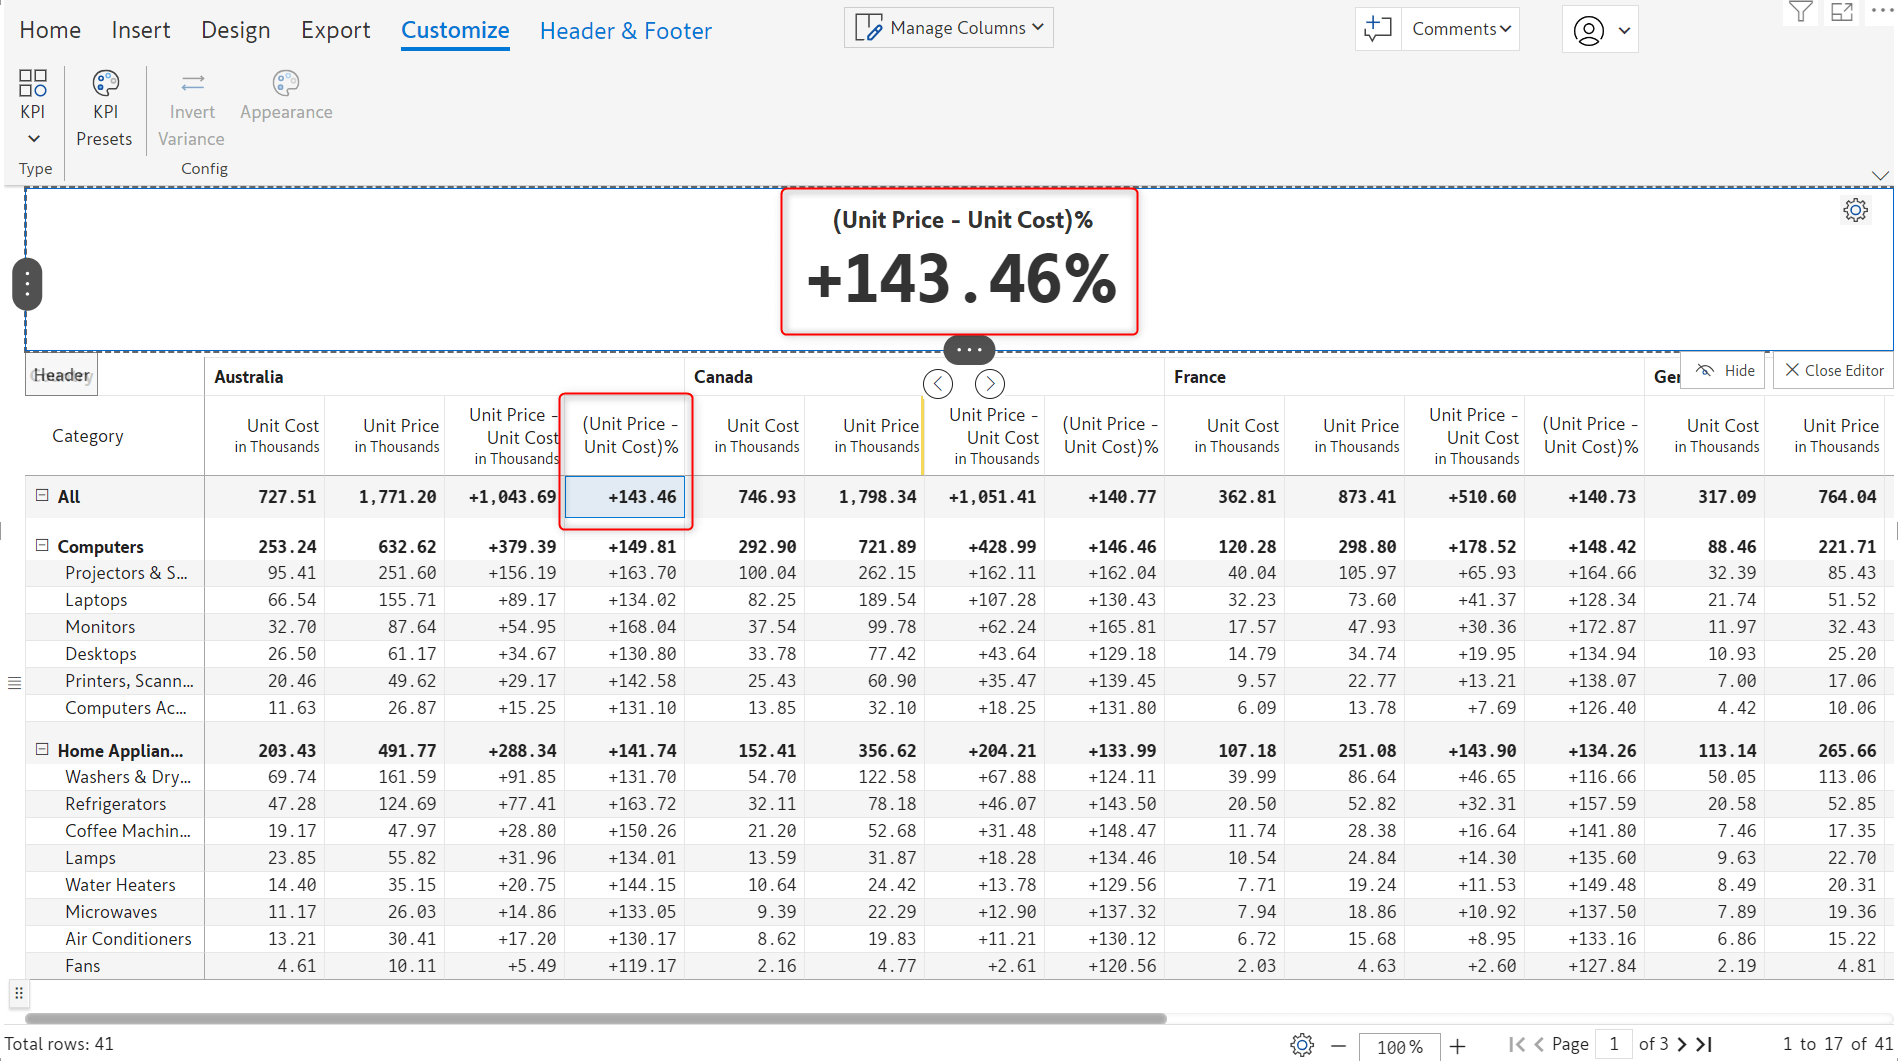
Inforiver 2.3 also enables you to display variance or variance percentage in the header KPI cards using manual data selection.
Dimensions added in measure fields will be considered as string or text and not count. Special characters in the data like % or # symbols will be supported and displayed as is.
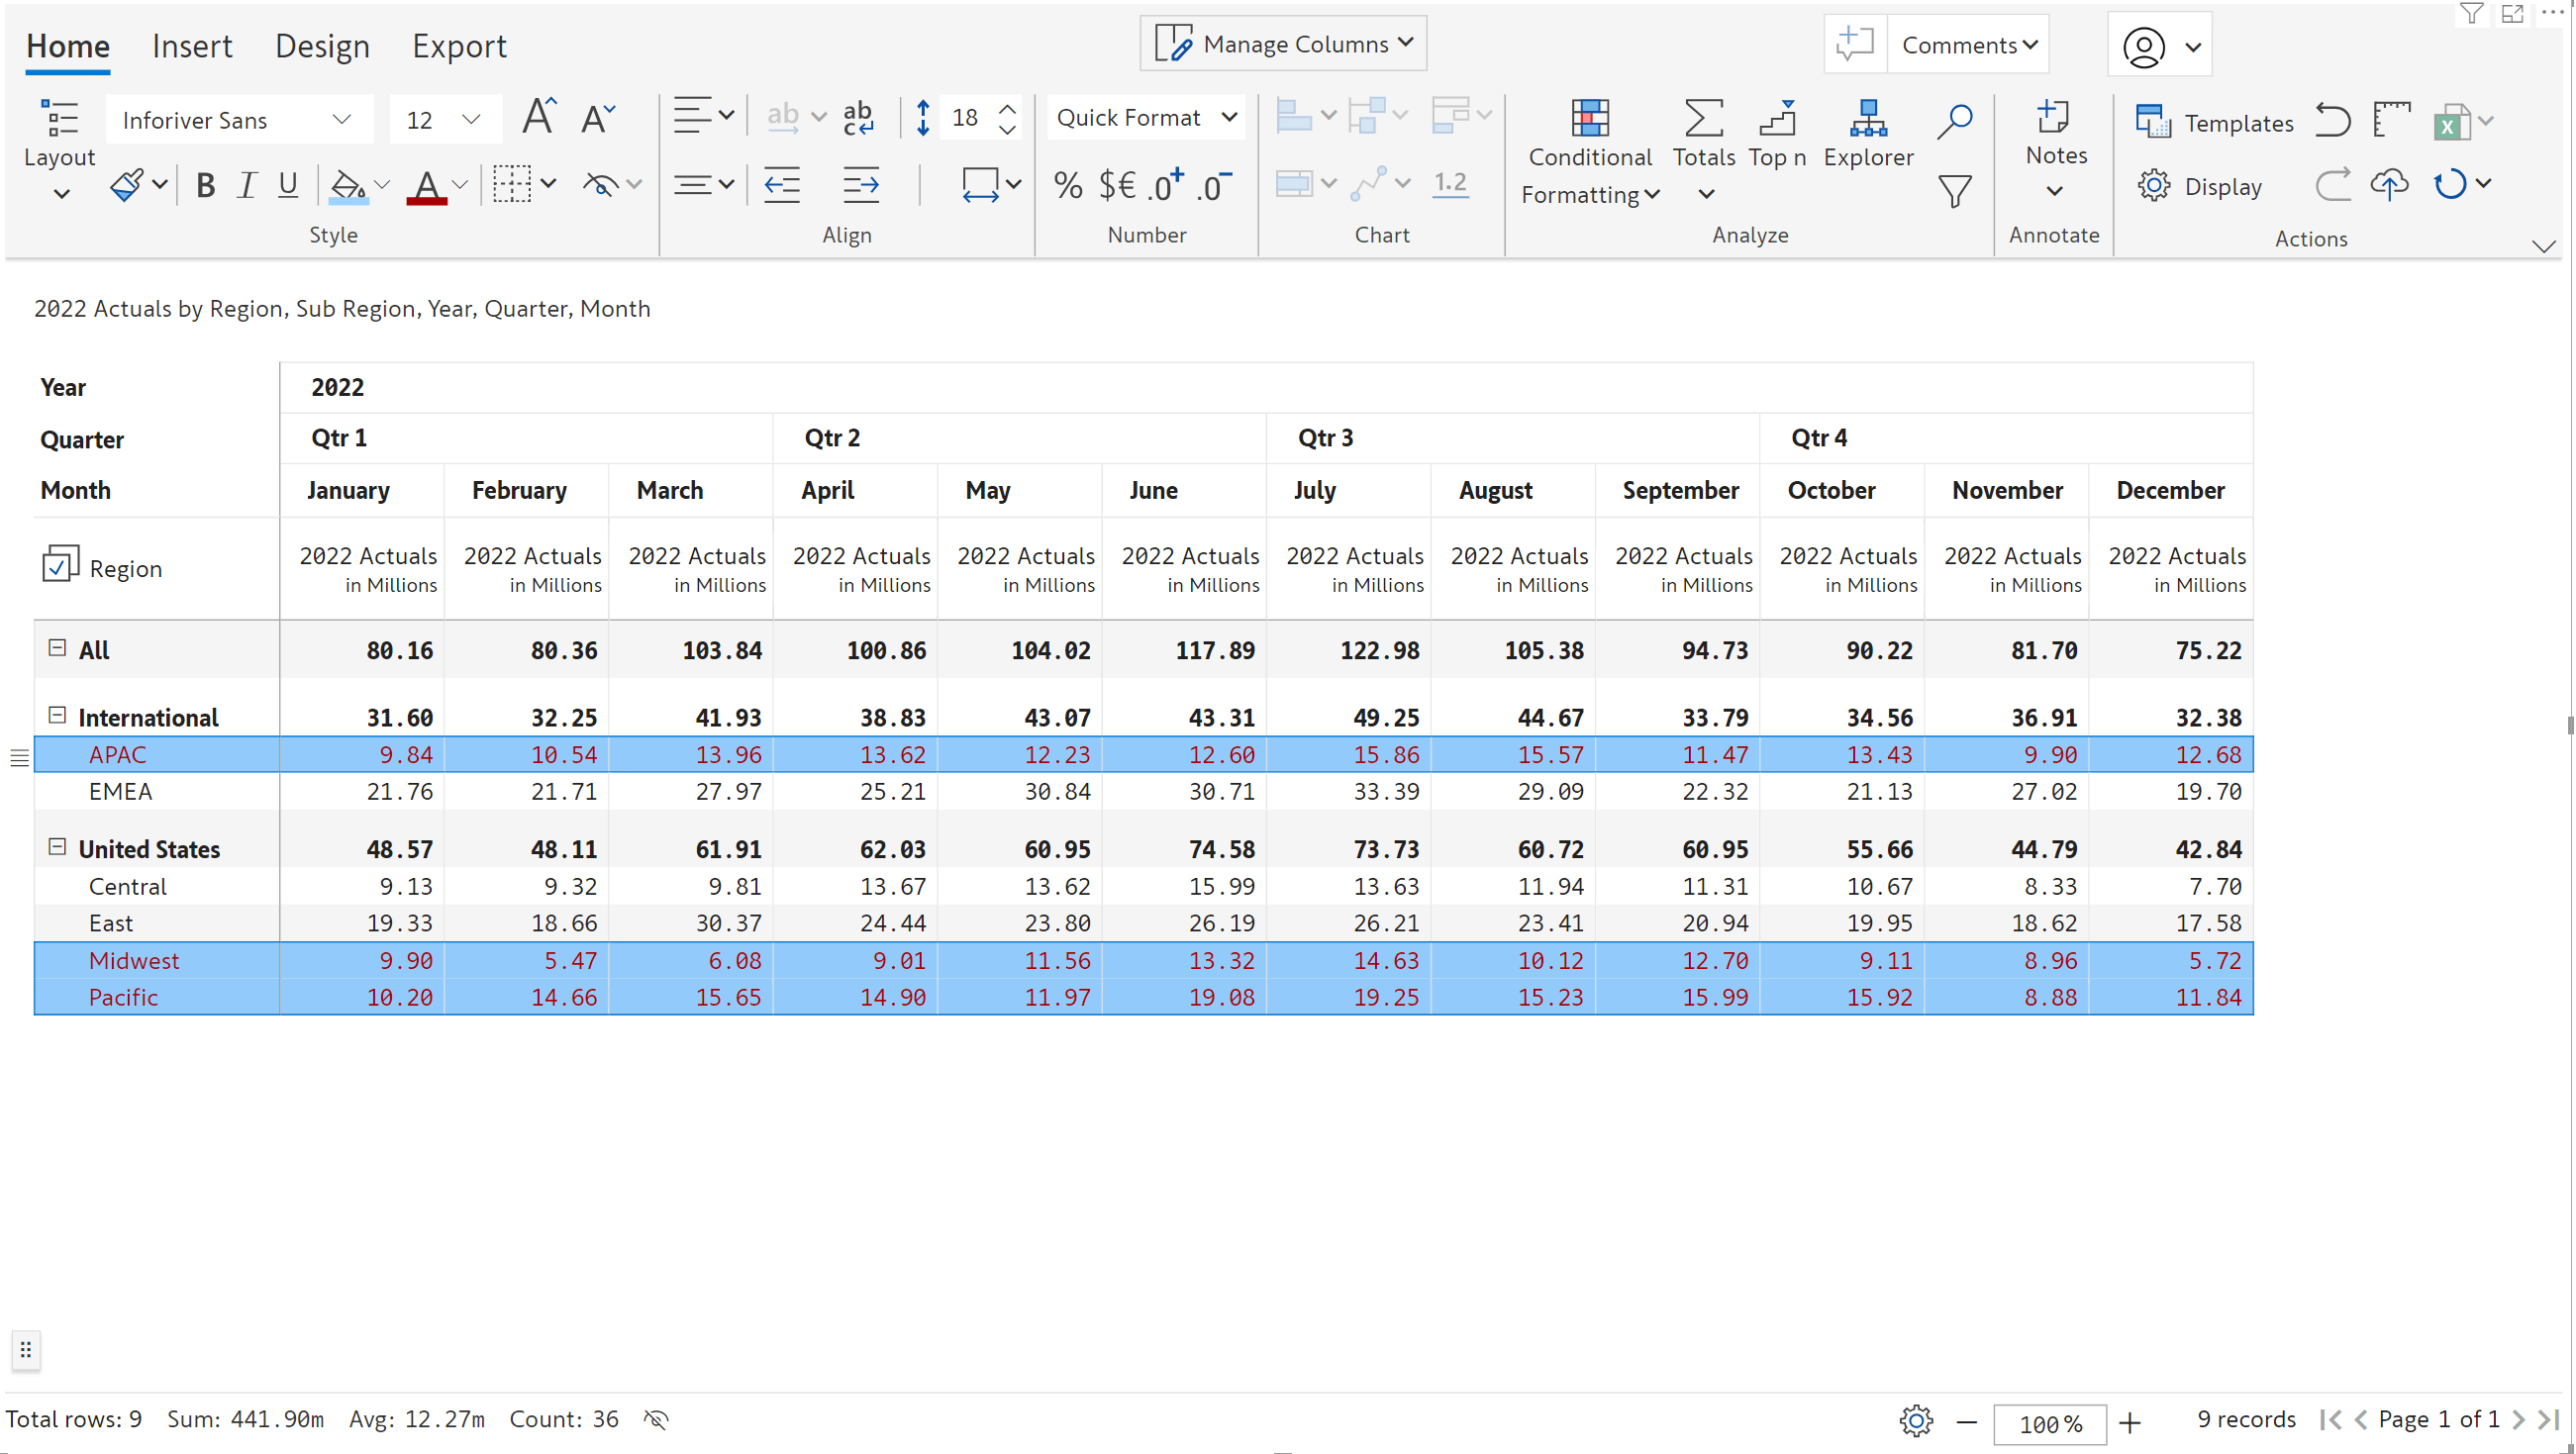
Formatting can easily be replicated across selected rows using the new ‘Apply format to selected rows’ option in 2.3.
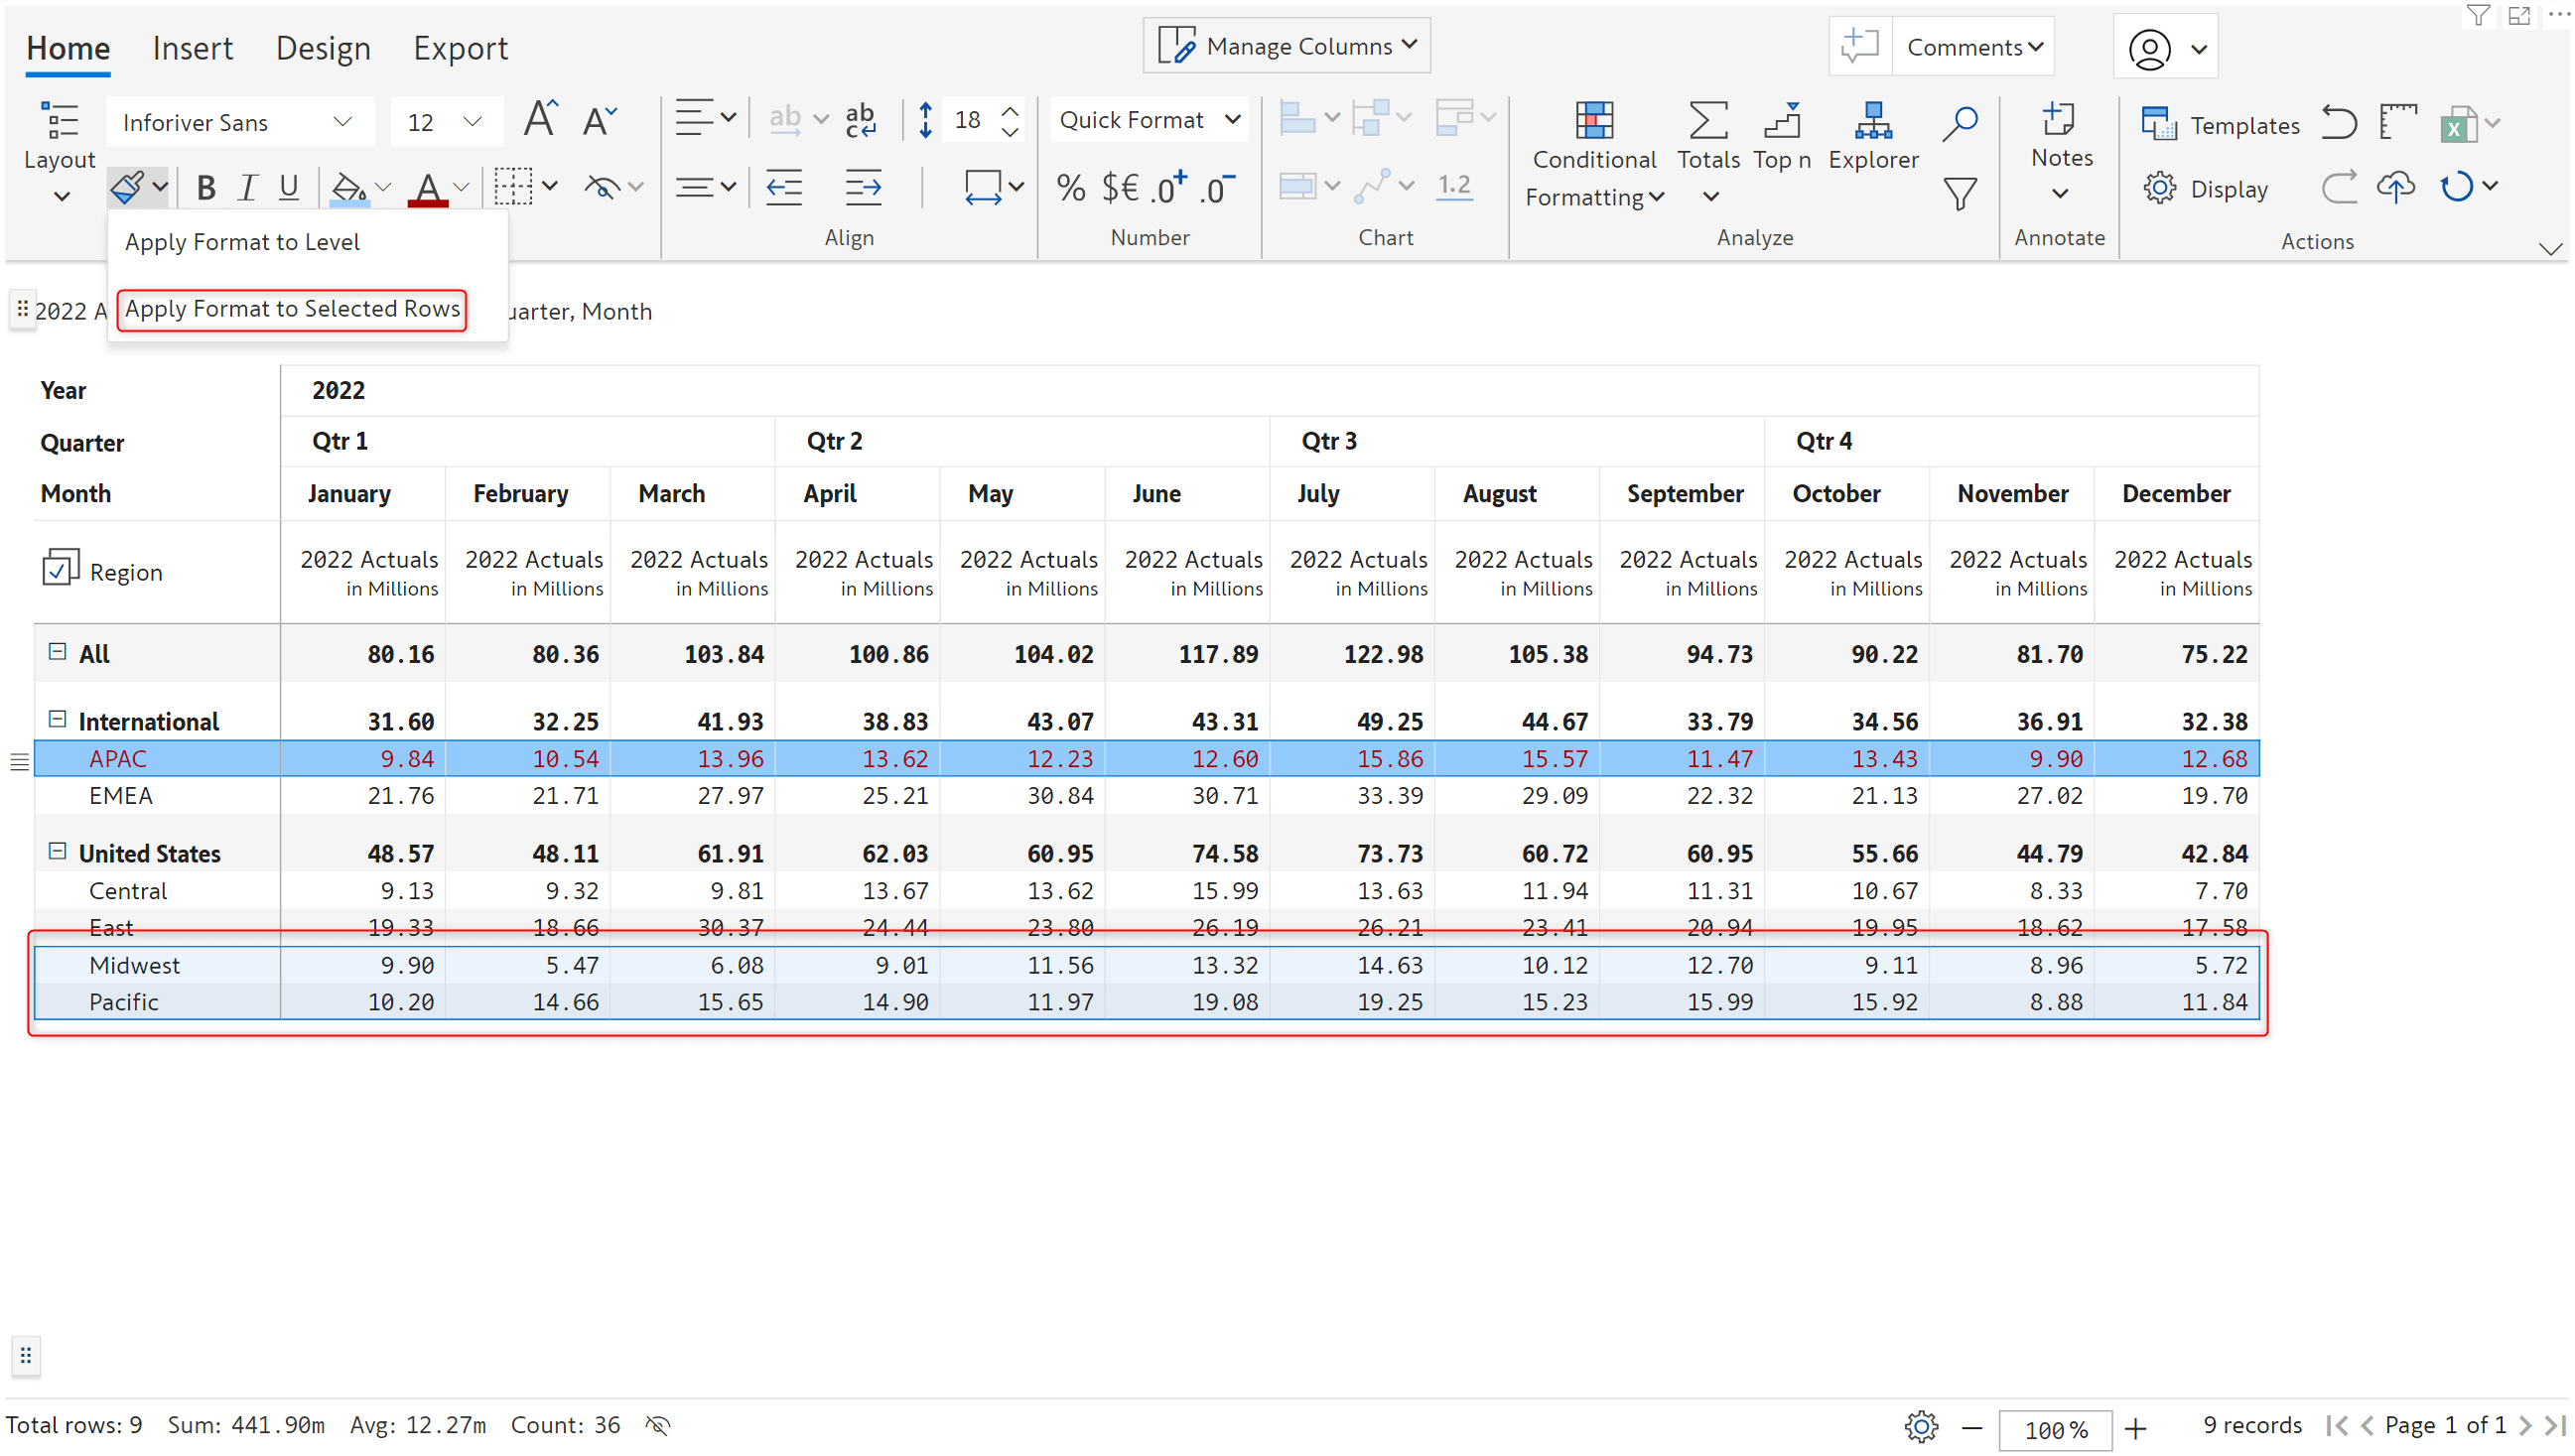
Select the rows for which the formatting has to be applied, click on the ‘Apply format to selected rows’ option. Formatting is replicated as shown below:
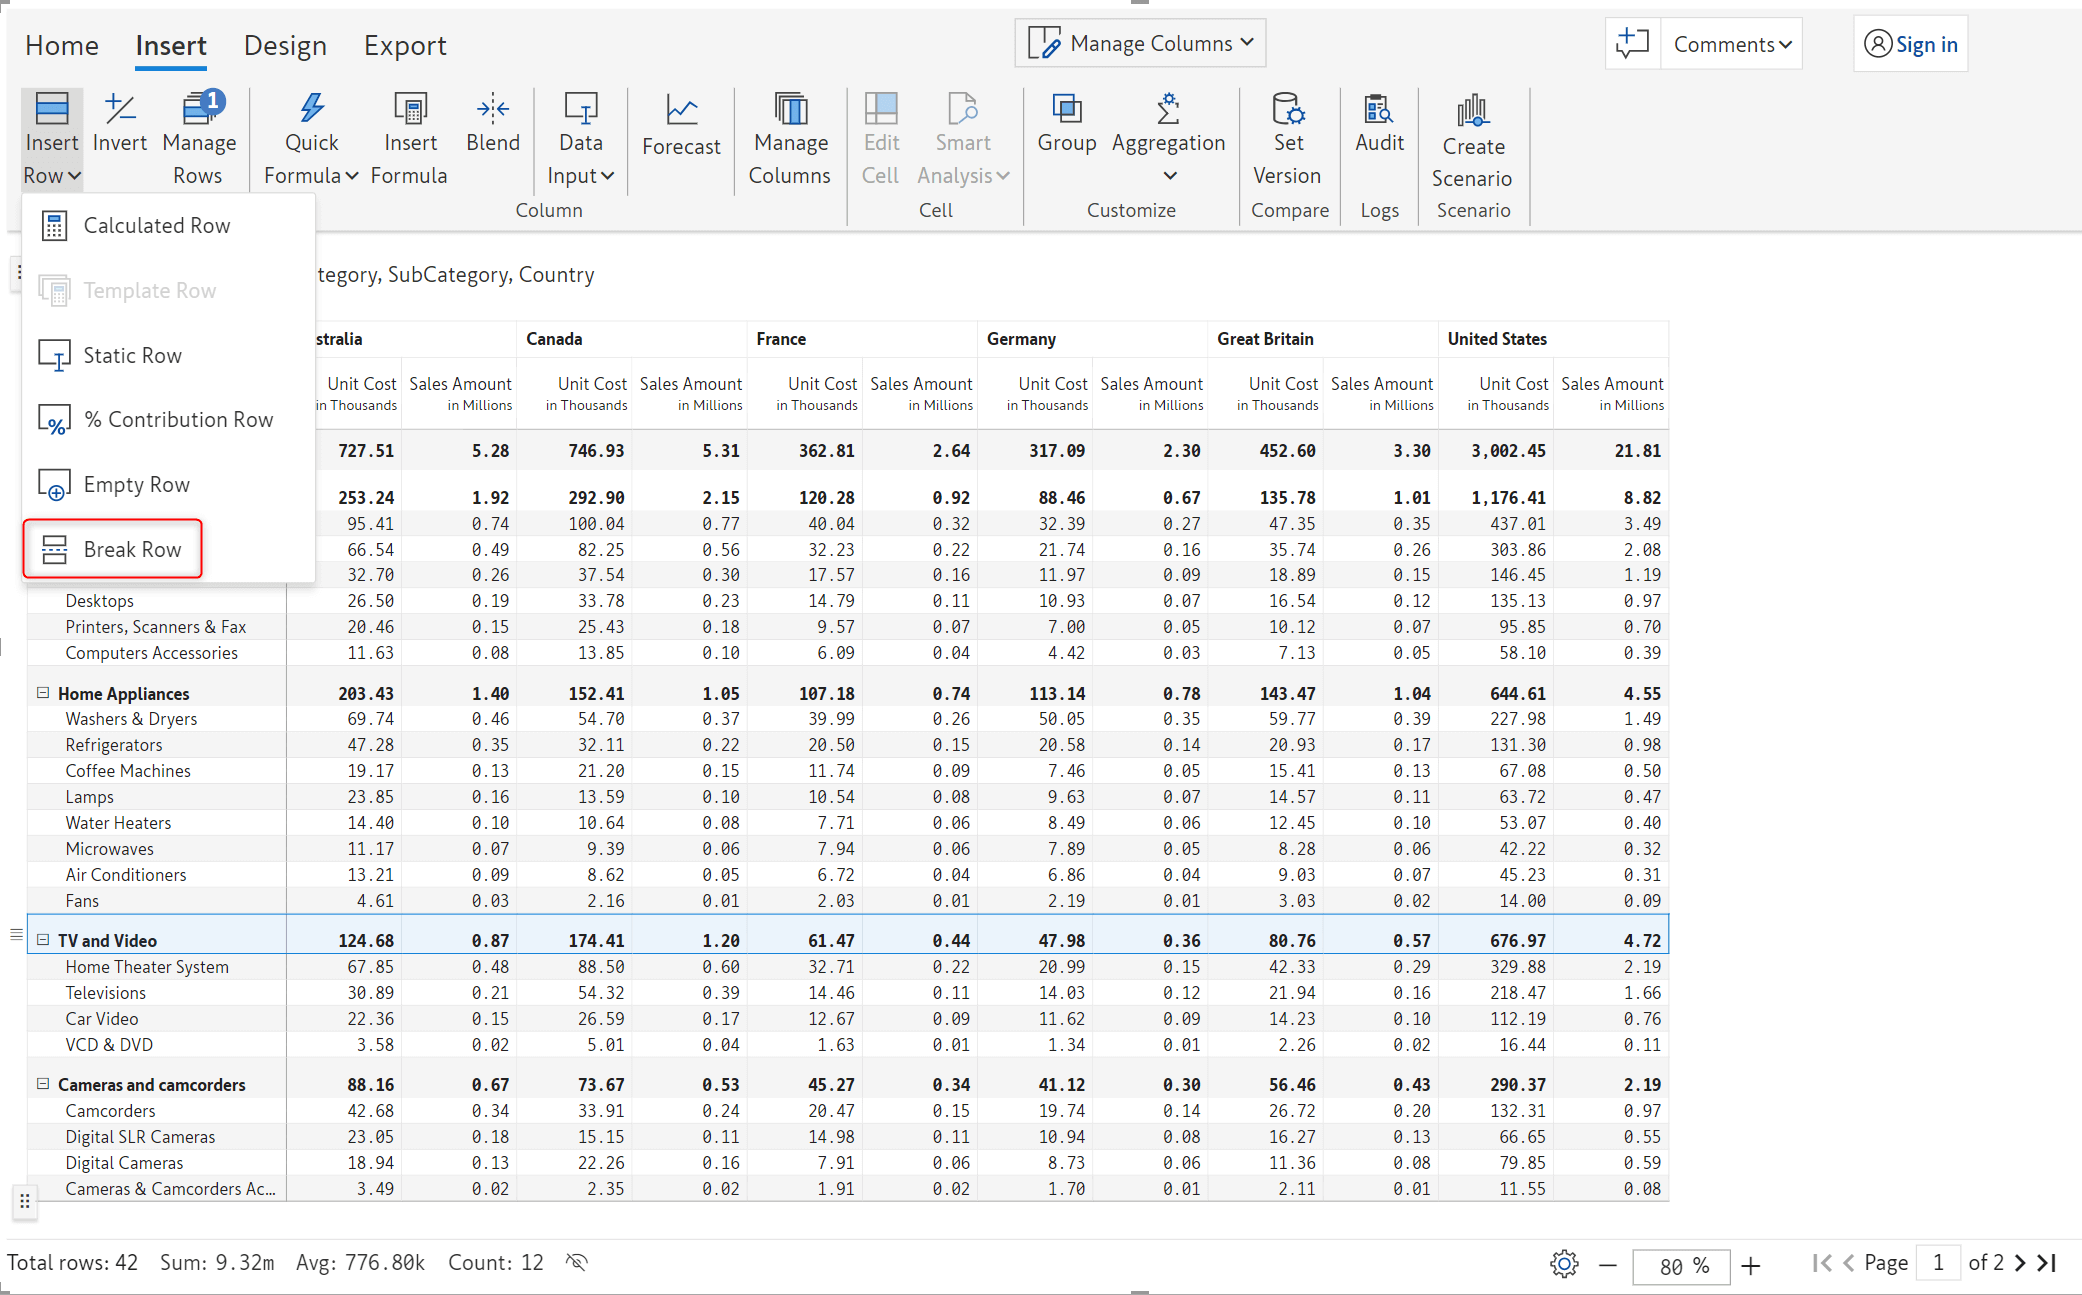
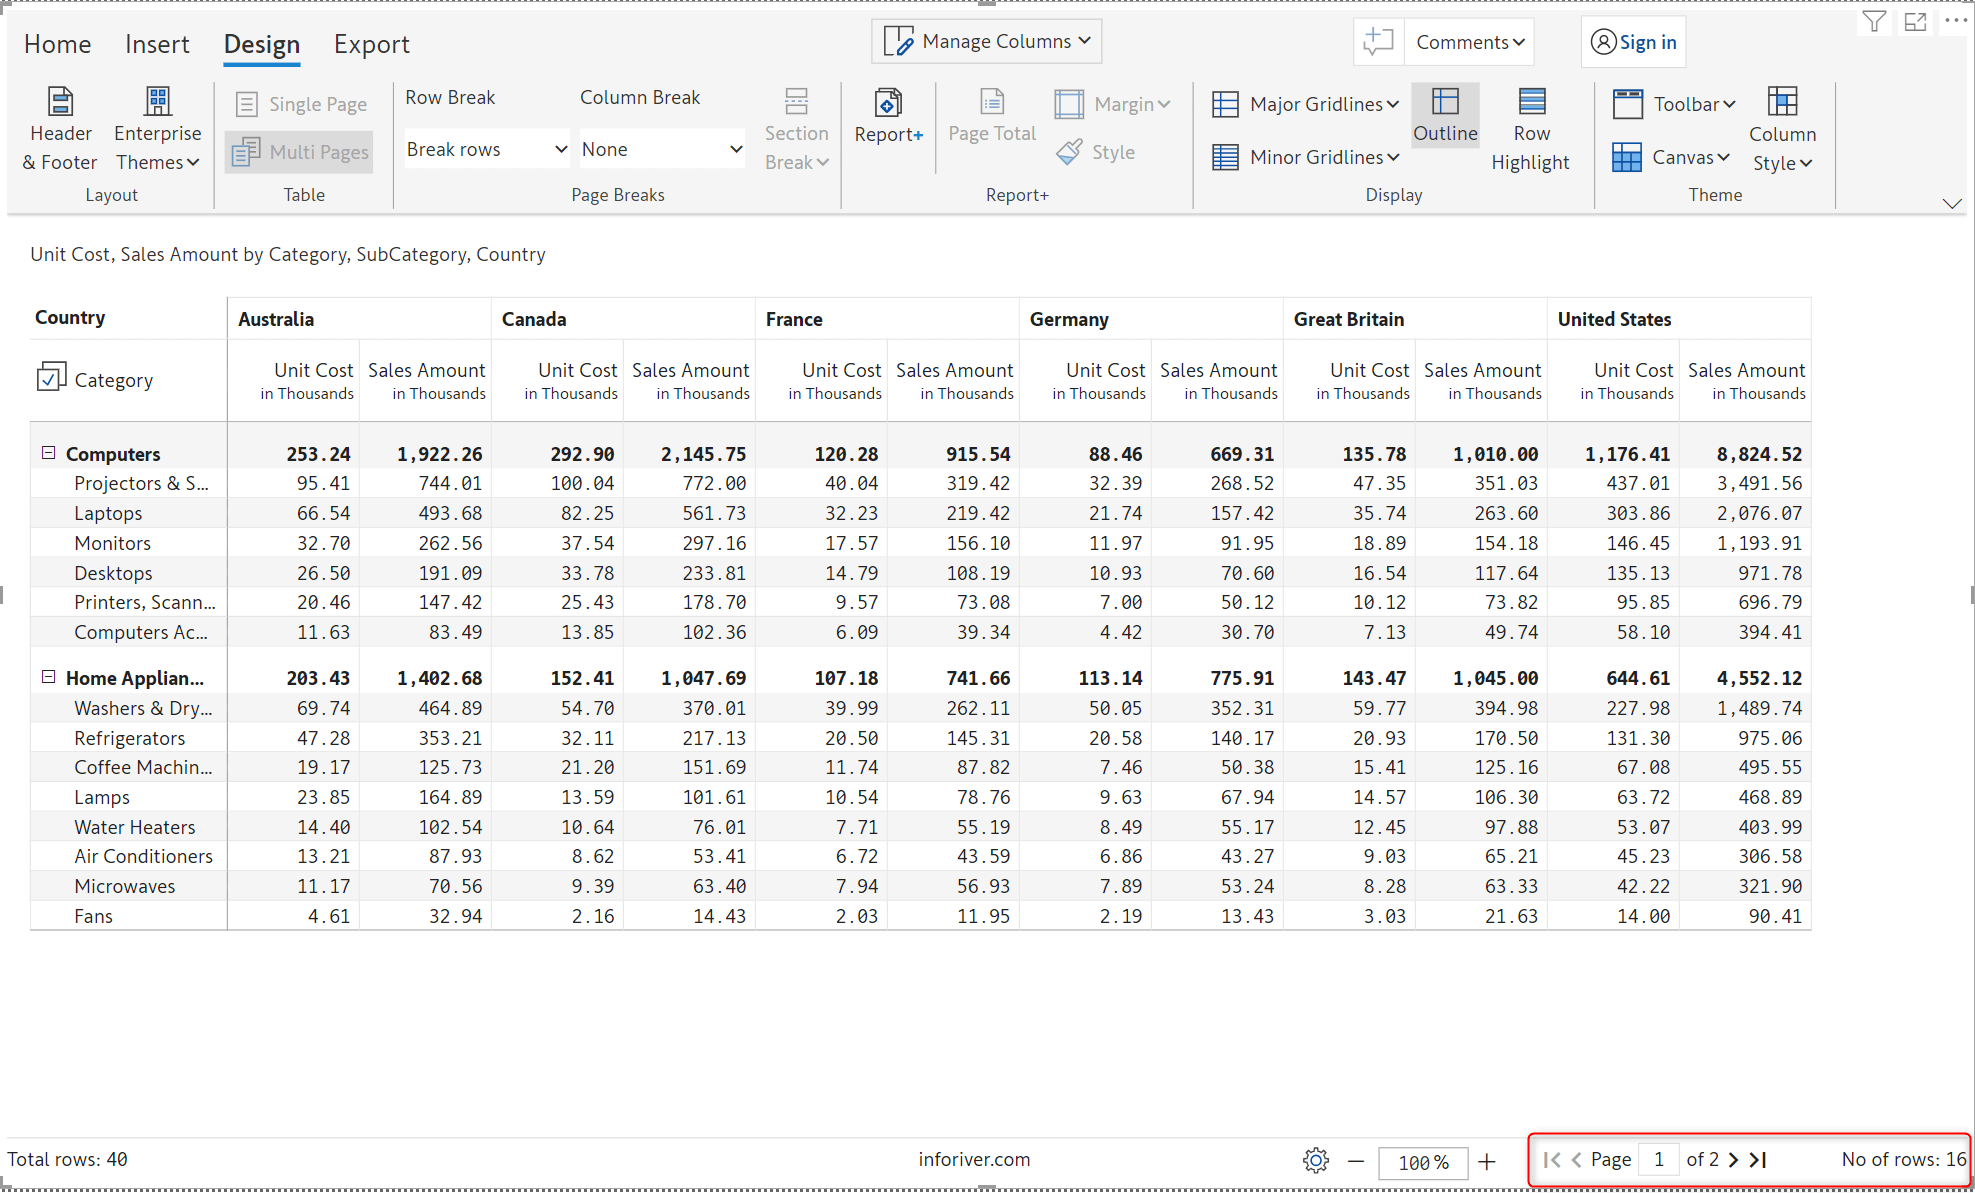
With the implementation of break rows, pagination can now be completely user defined. You can insert break rows as required – the break rows in the report can subsequently be used to create page breaks.
Page break inserted at specified point in the report.
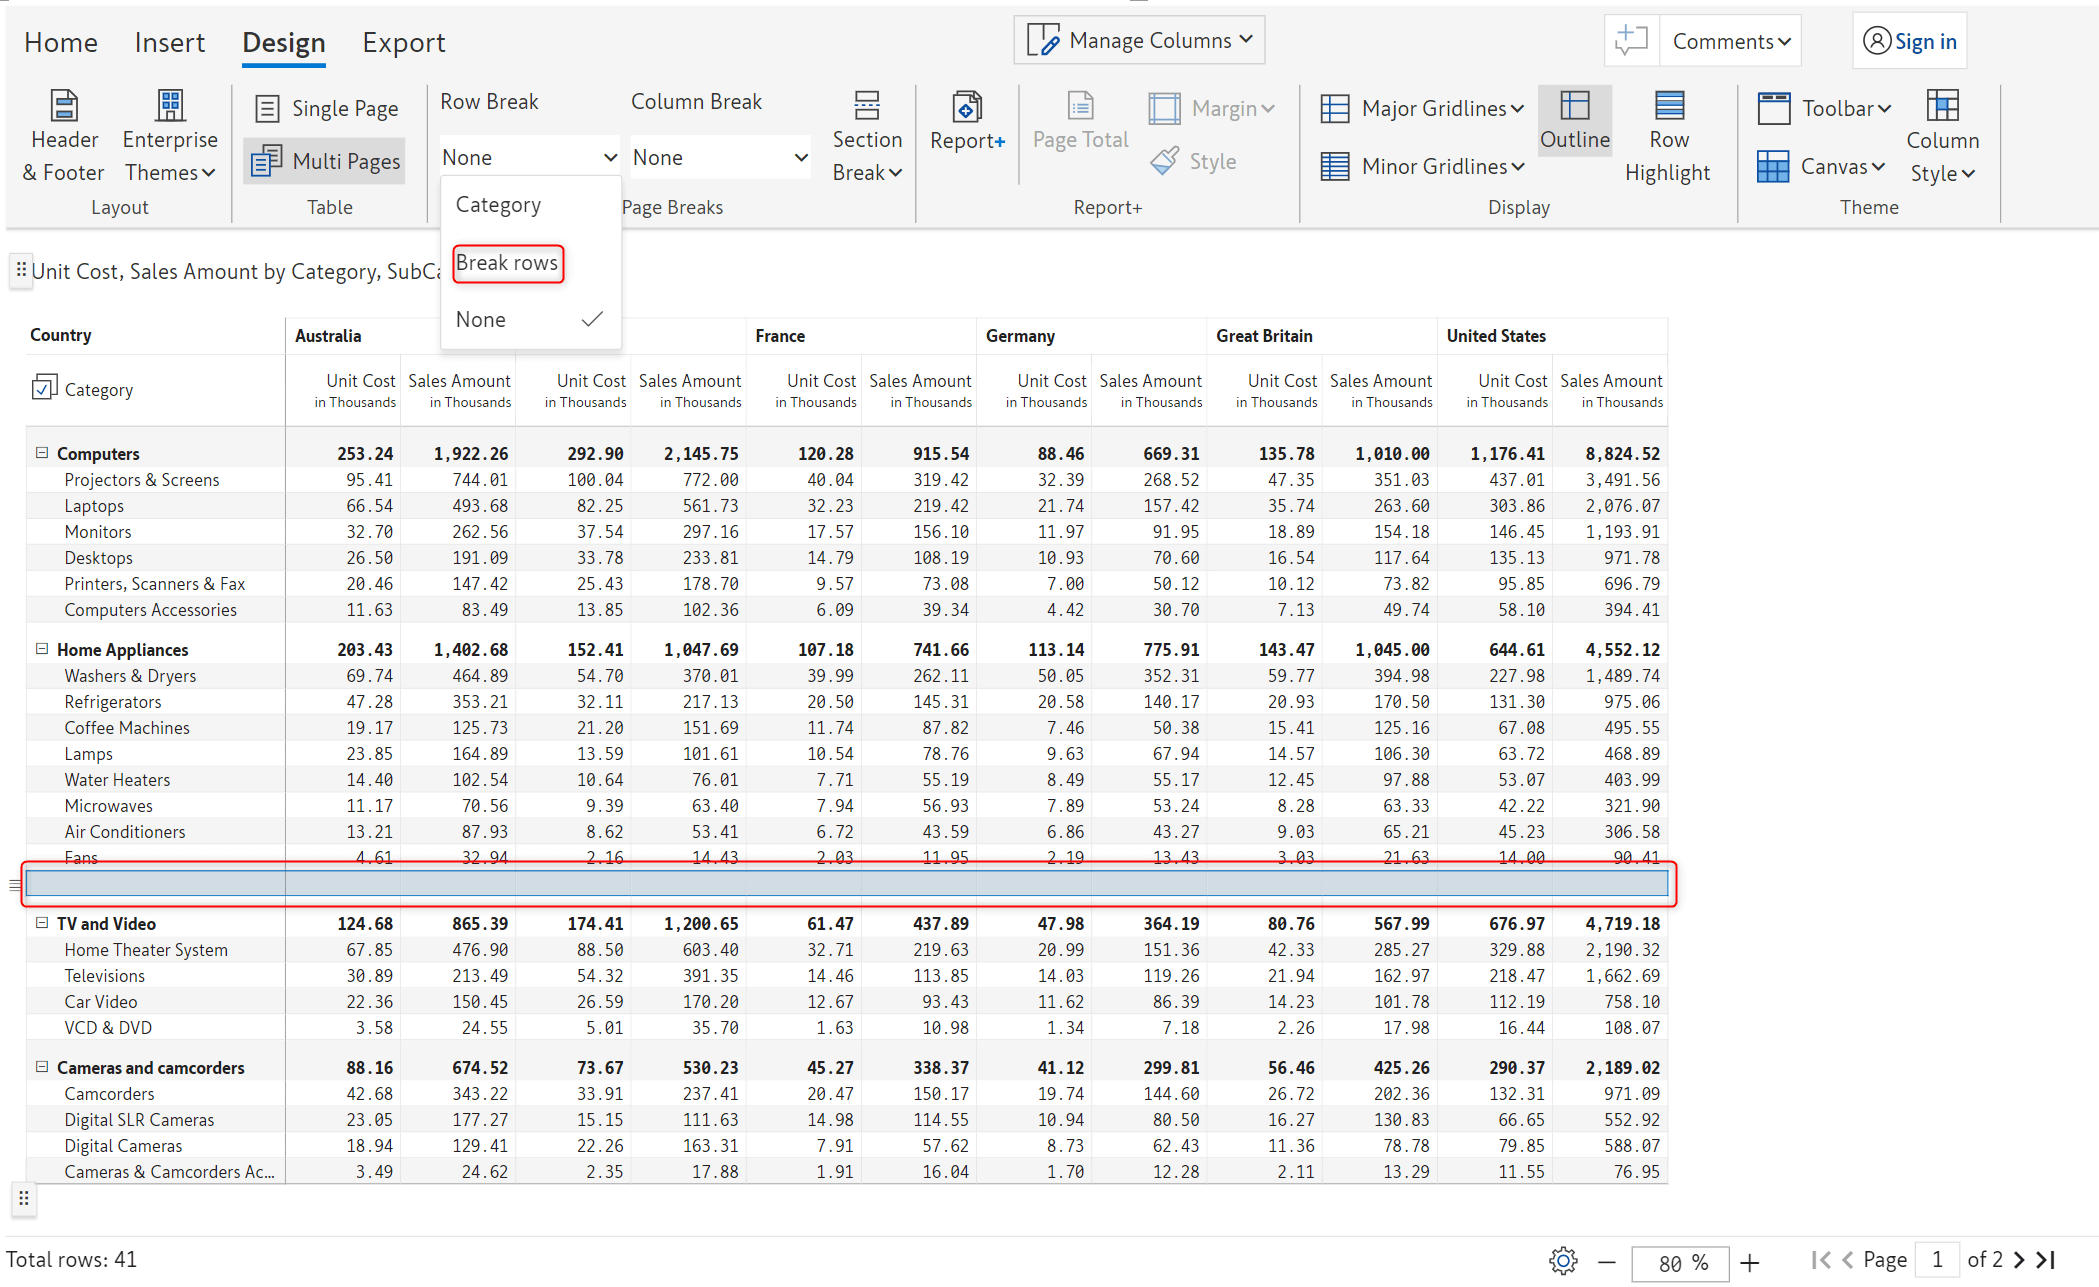
All the data after the break row is shifted to the next page as shown in the image below.
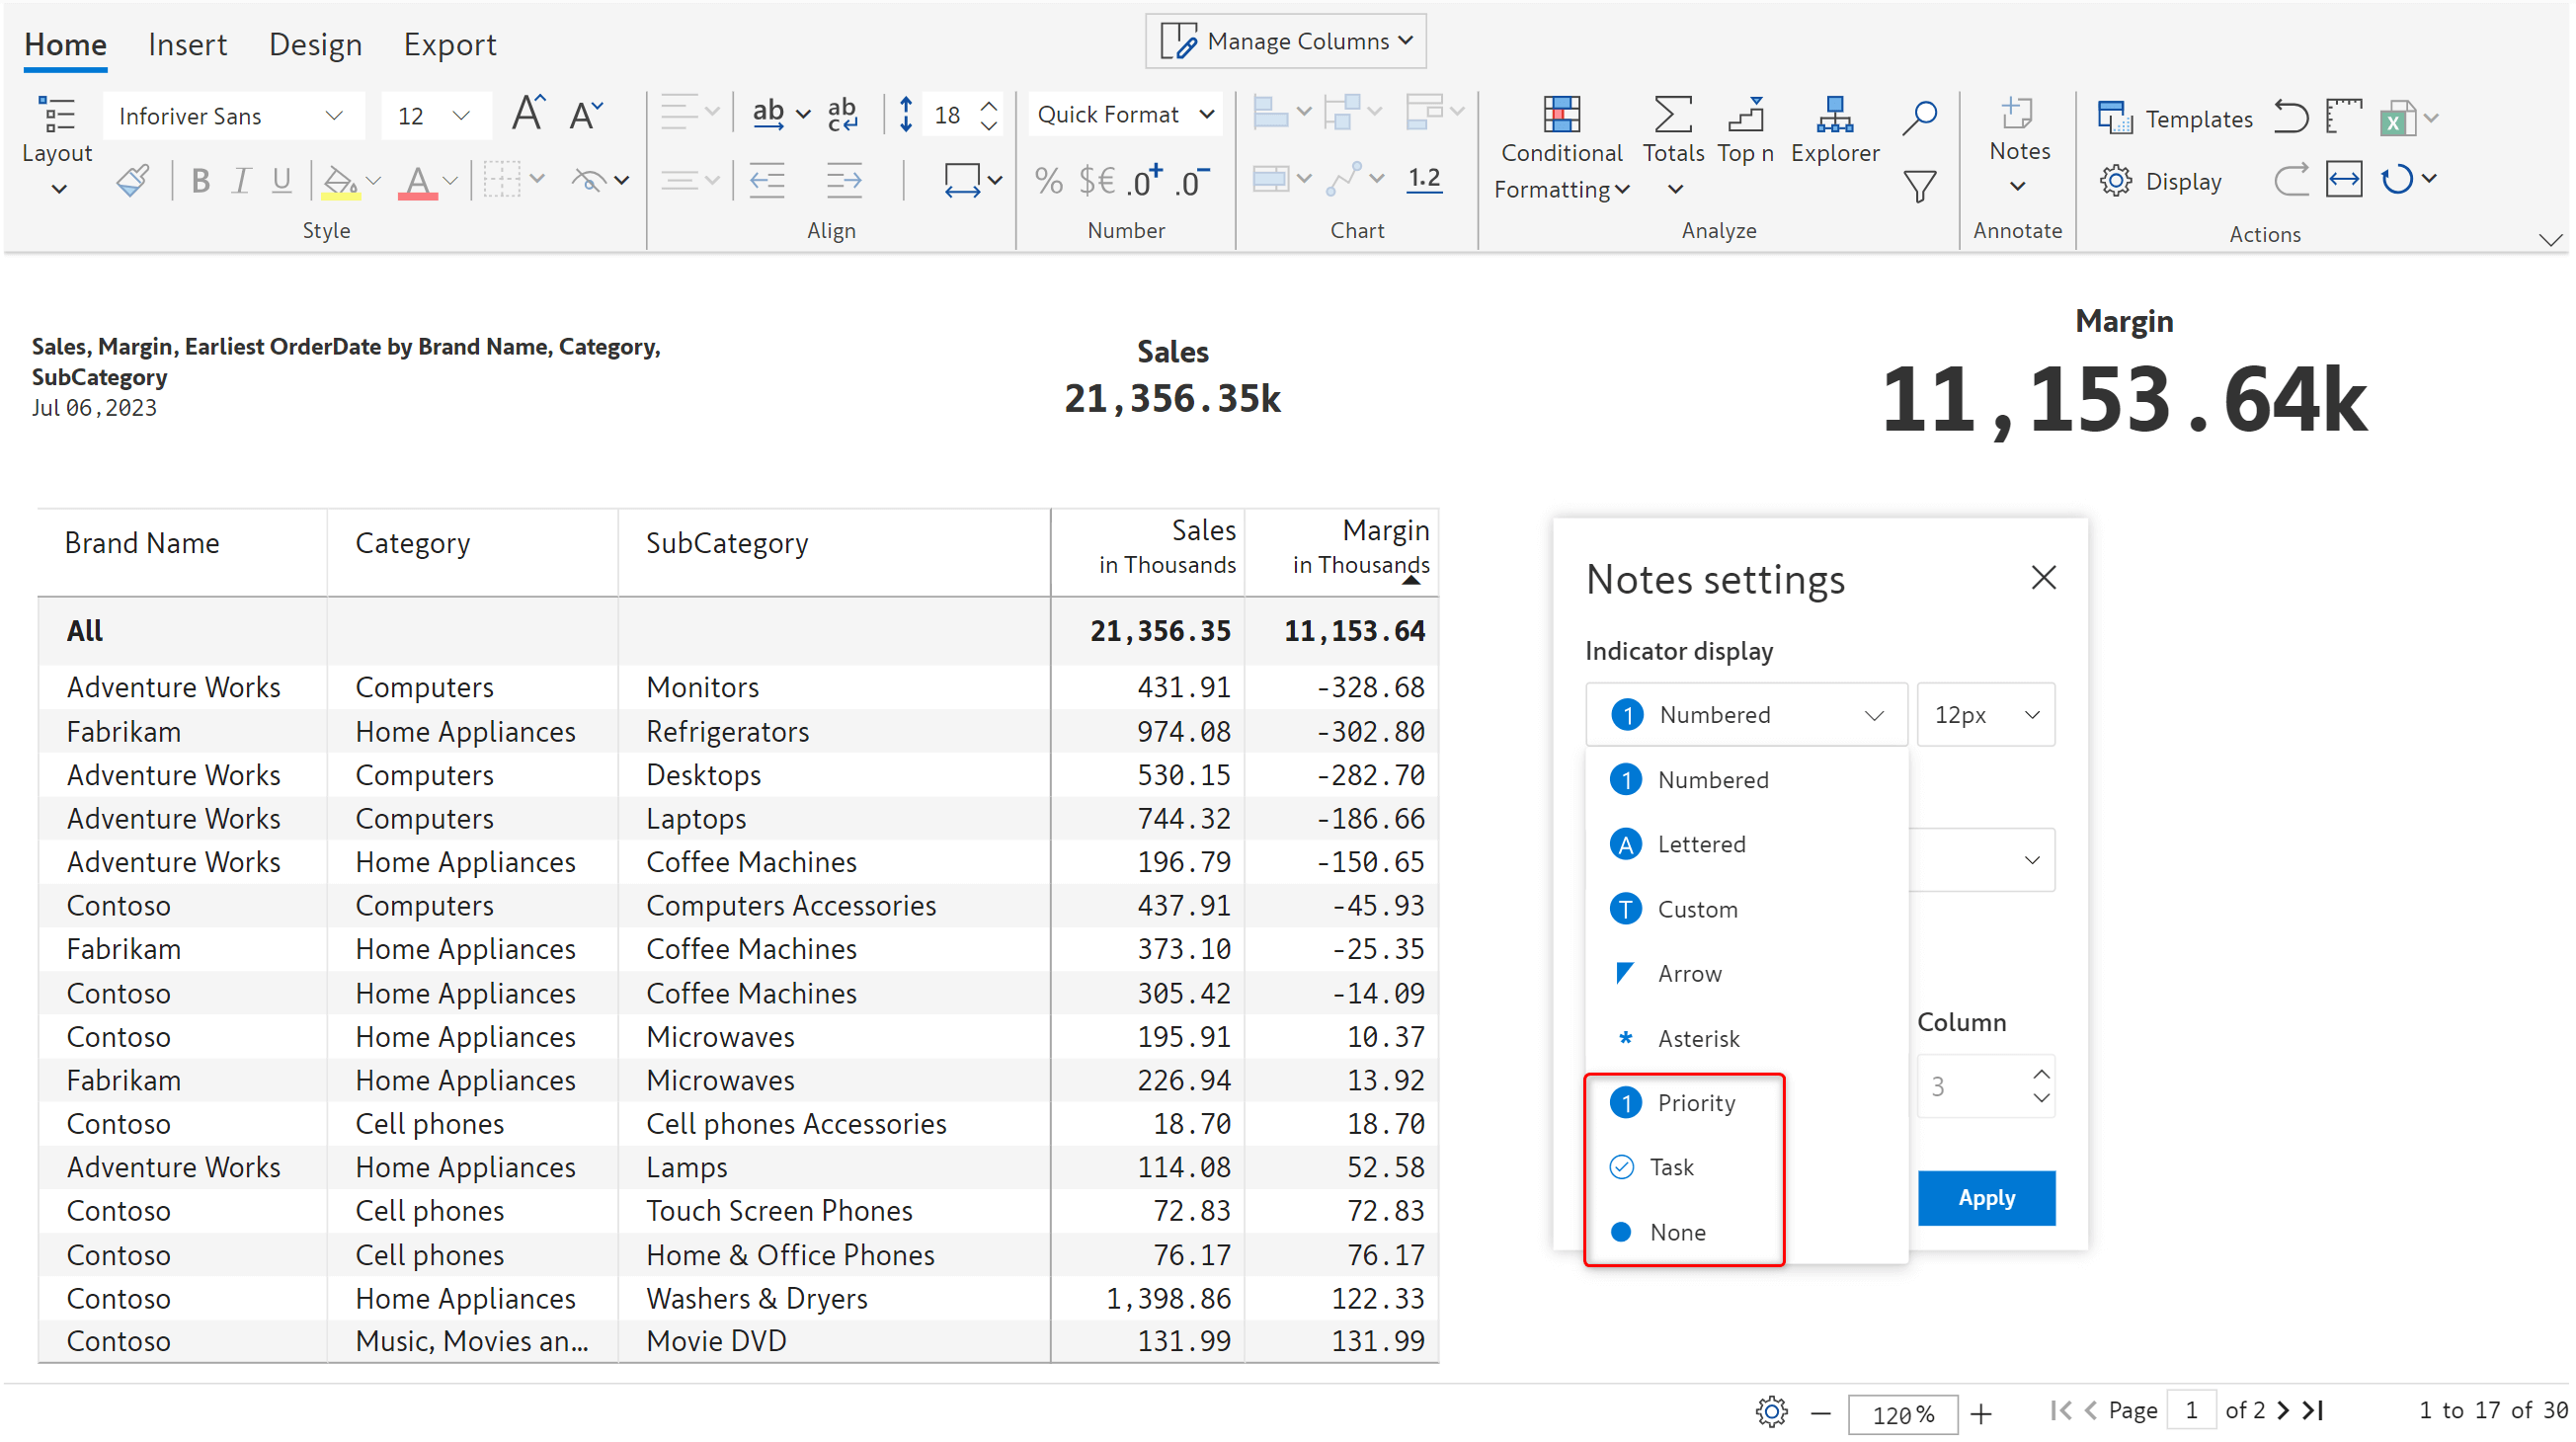
There are three new indicator types for notes – priority, task and none.
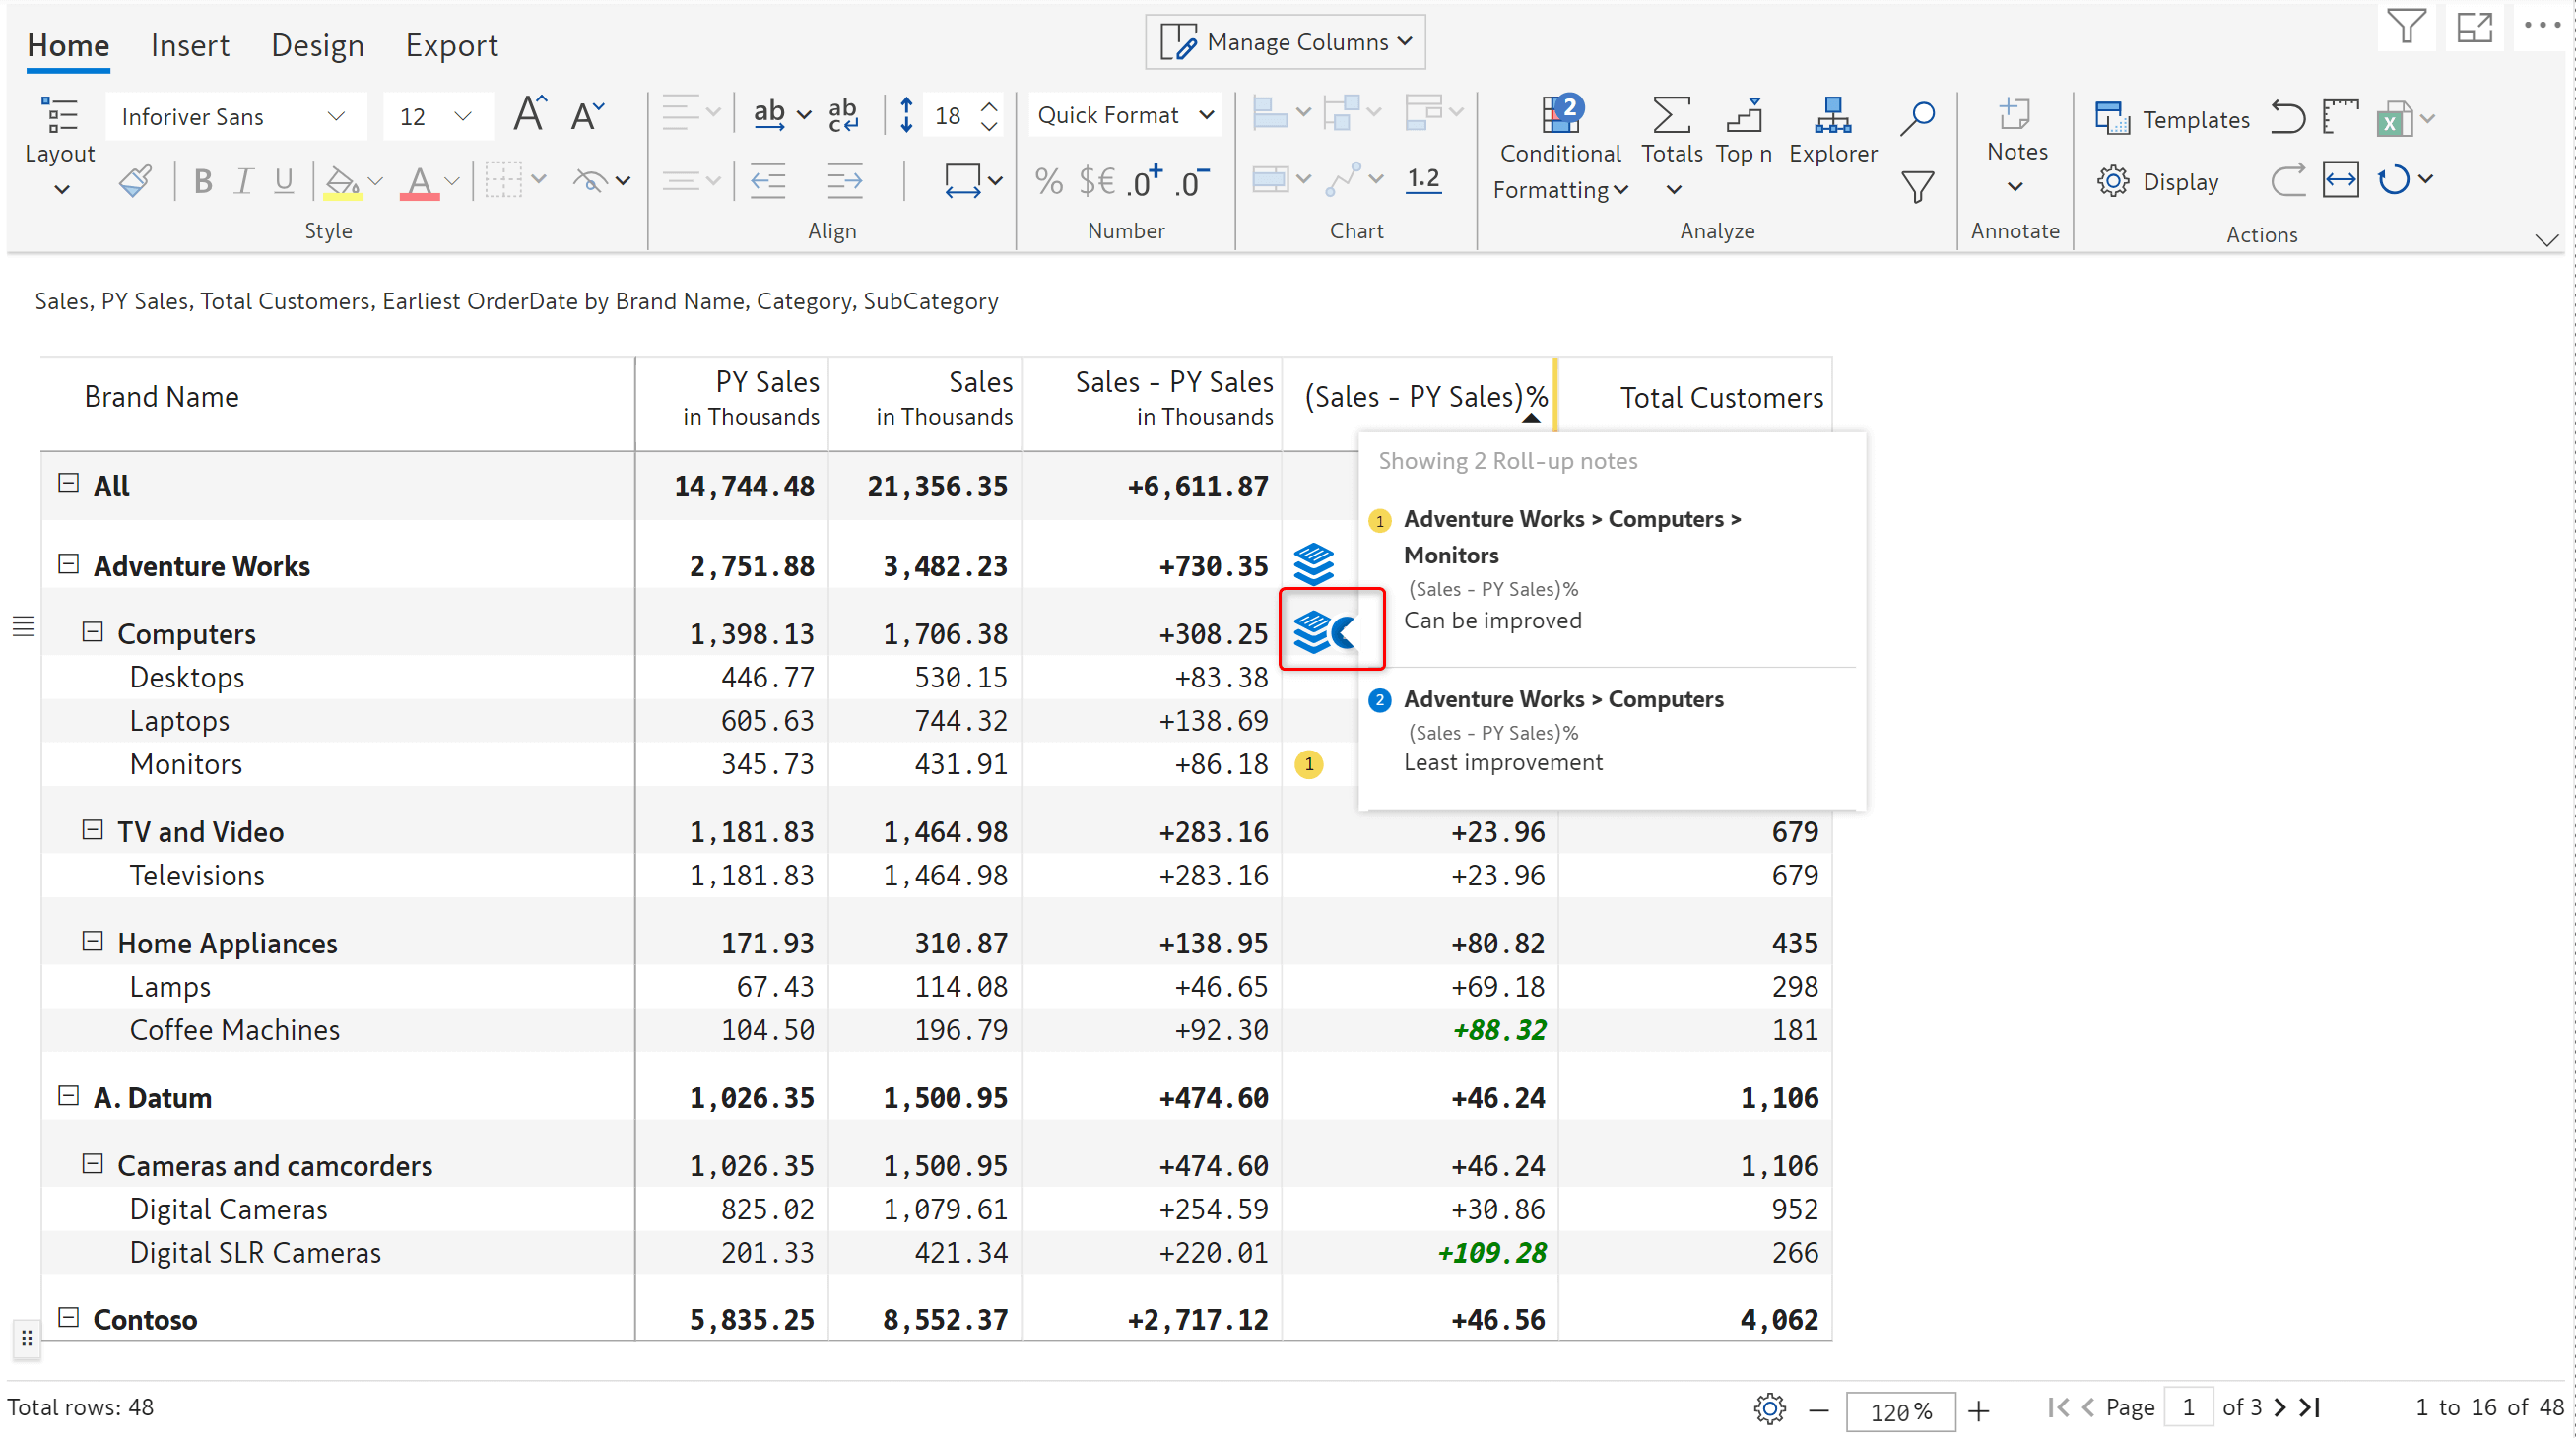
The rollup notes indicator has been redesigned and for a subtotal cell with notes, both the icons are shown.
1. Login issue resolved: The login bug affecting some users has been fixed, ensuring smooth login for all users.
2. Data synchronization bug fixed: Data synchronization discrepancies have been resolved, providing accurate data across devices.
3. Compatibility with older browsers: Compatibility issues with older browser versions have been addressed.
4. Export PDF and XLS: Fixed compatibility issues and addressed specific customer issues and requirements.

Inforiver helps enterprises consolidate planning, reporting & analytics on a single platform (Power BI). The no-code, self-service award-winning platform has been recognized as the industry’s best and is adopted by many Fortune 100 firms.
Inforiver is a product of Lumel, the #1 Power BI AppSource Partner. The firm serves over 3,000 customers worldwide through its portfolio of products offered under the brands Inforiver, EDITable, ValQ, and xViz.