Welcome to the Inforiver Premium 2.0 release update. We are thrilled to announce several new features and key enhancements to formulas & functions, header & footer, set version and UI/UX most anticipated by our Inforiver community!
Key enhancements in this 2.0 release are listed below. Feel free to jump to any specific section!
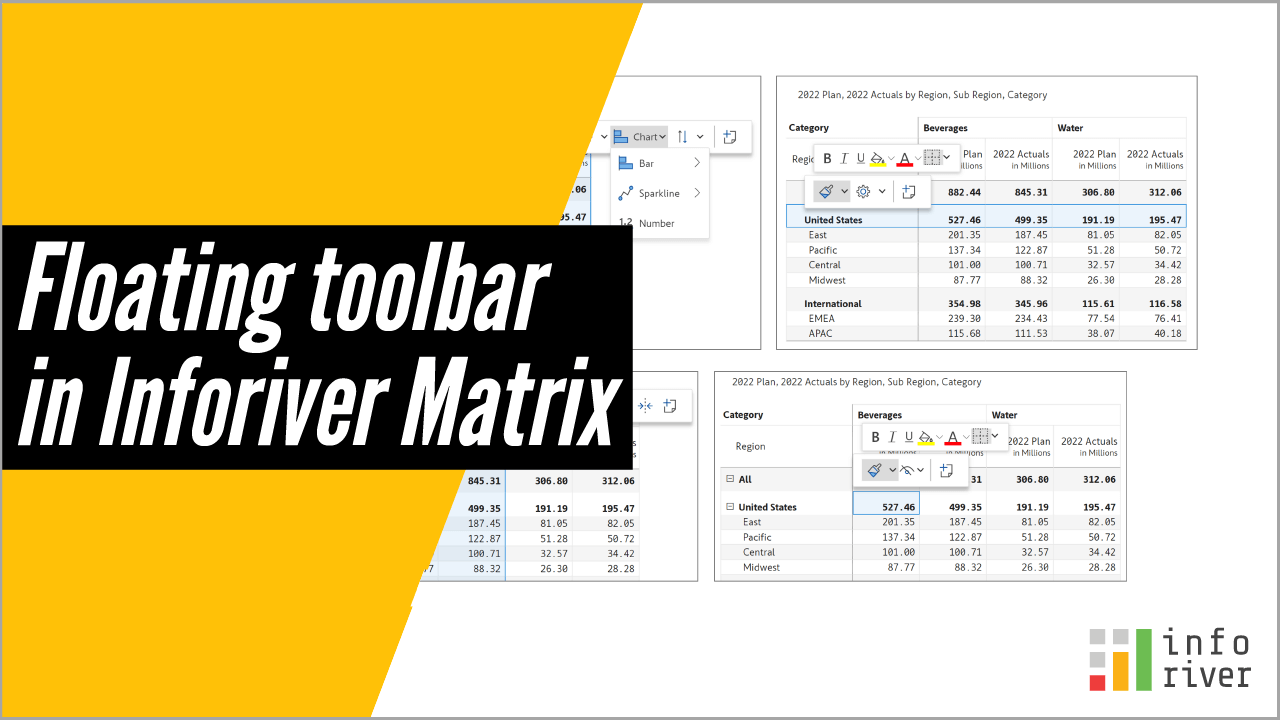
Excel-like floating toolbar based on selection for a cell, rows, and columns in both the edit and read modes when the toolbar is unpinned. Options in read mode can be customized using set reading view access.
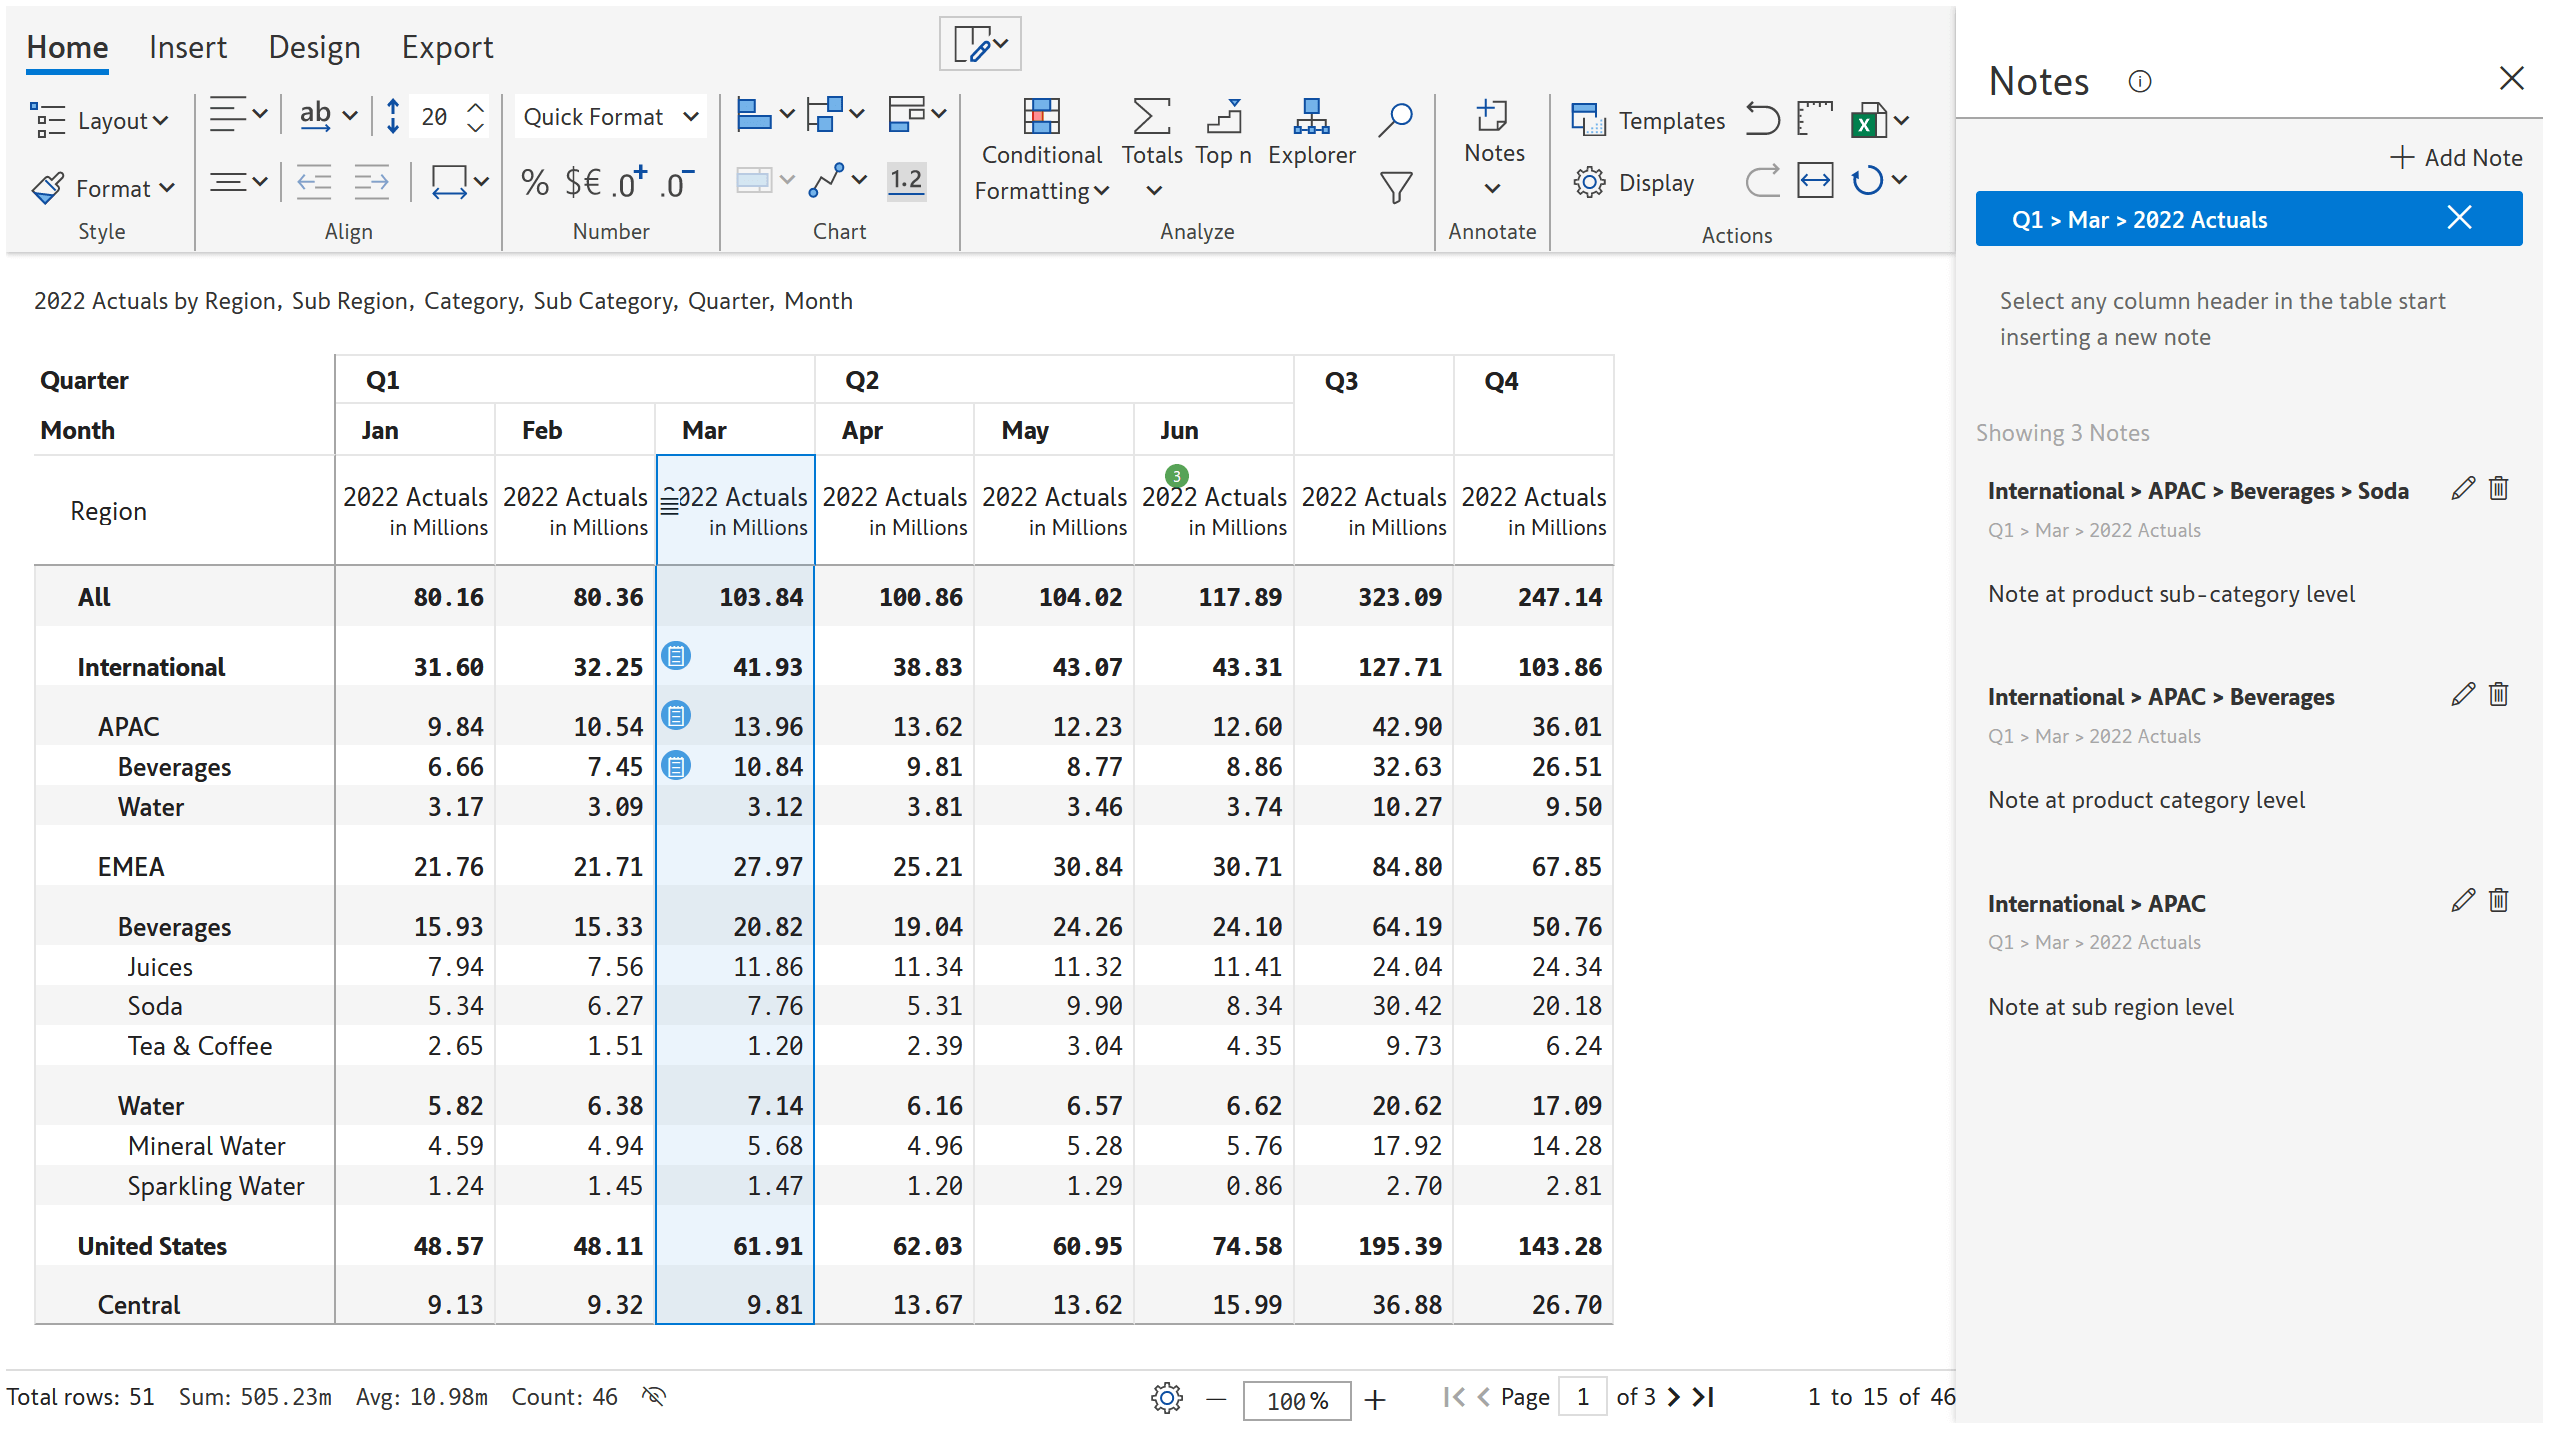
2. Notes
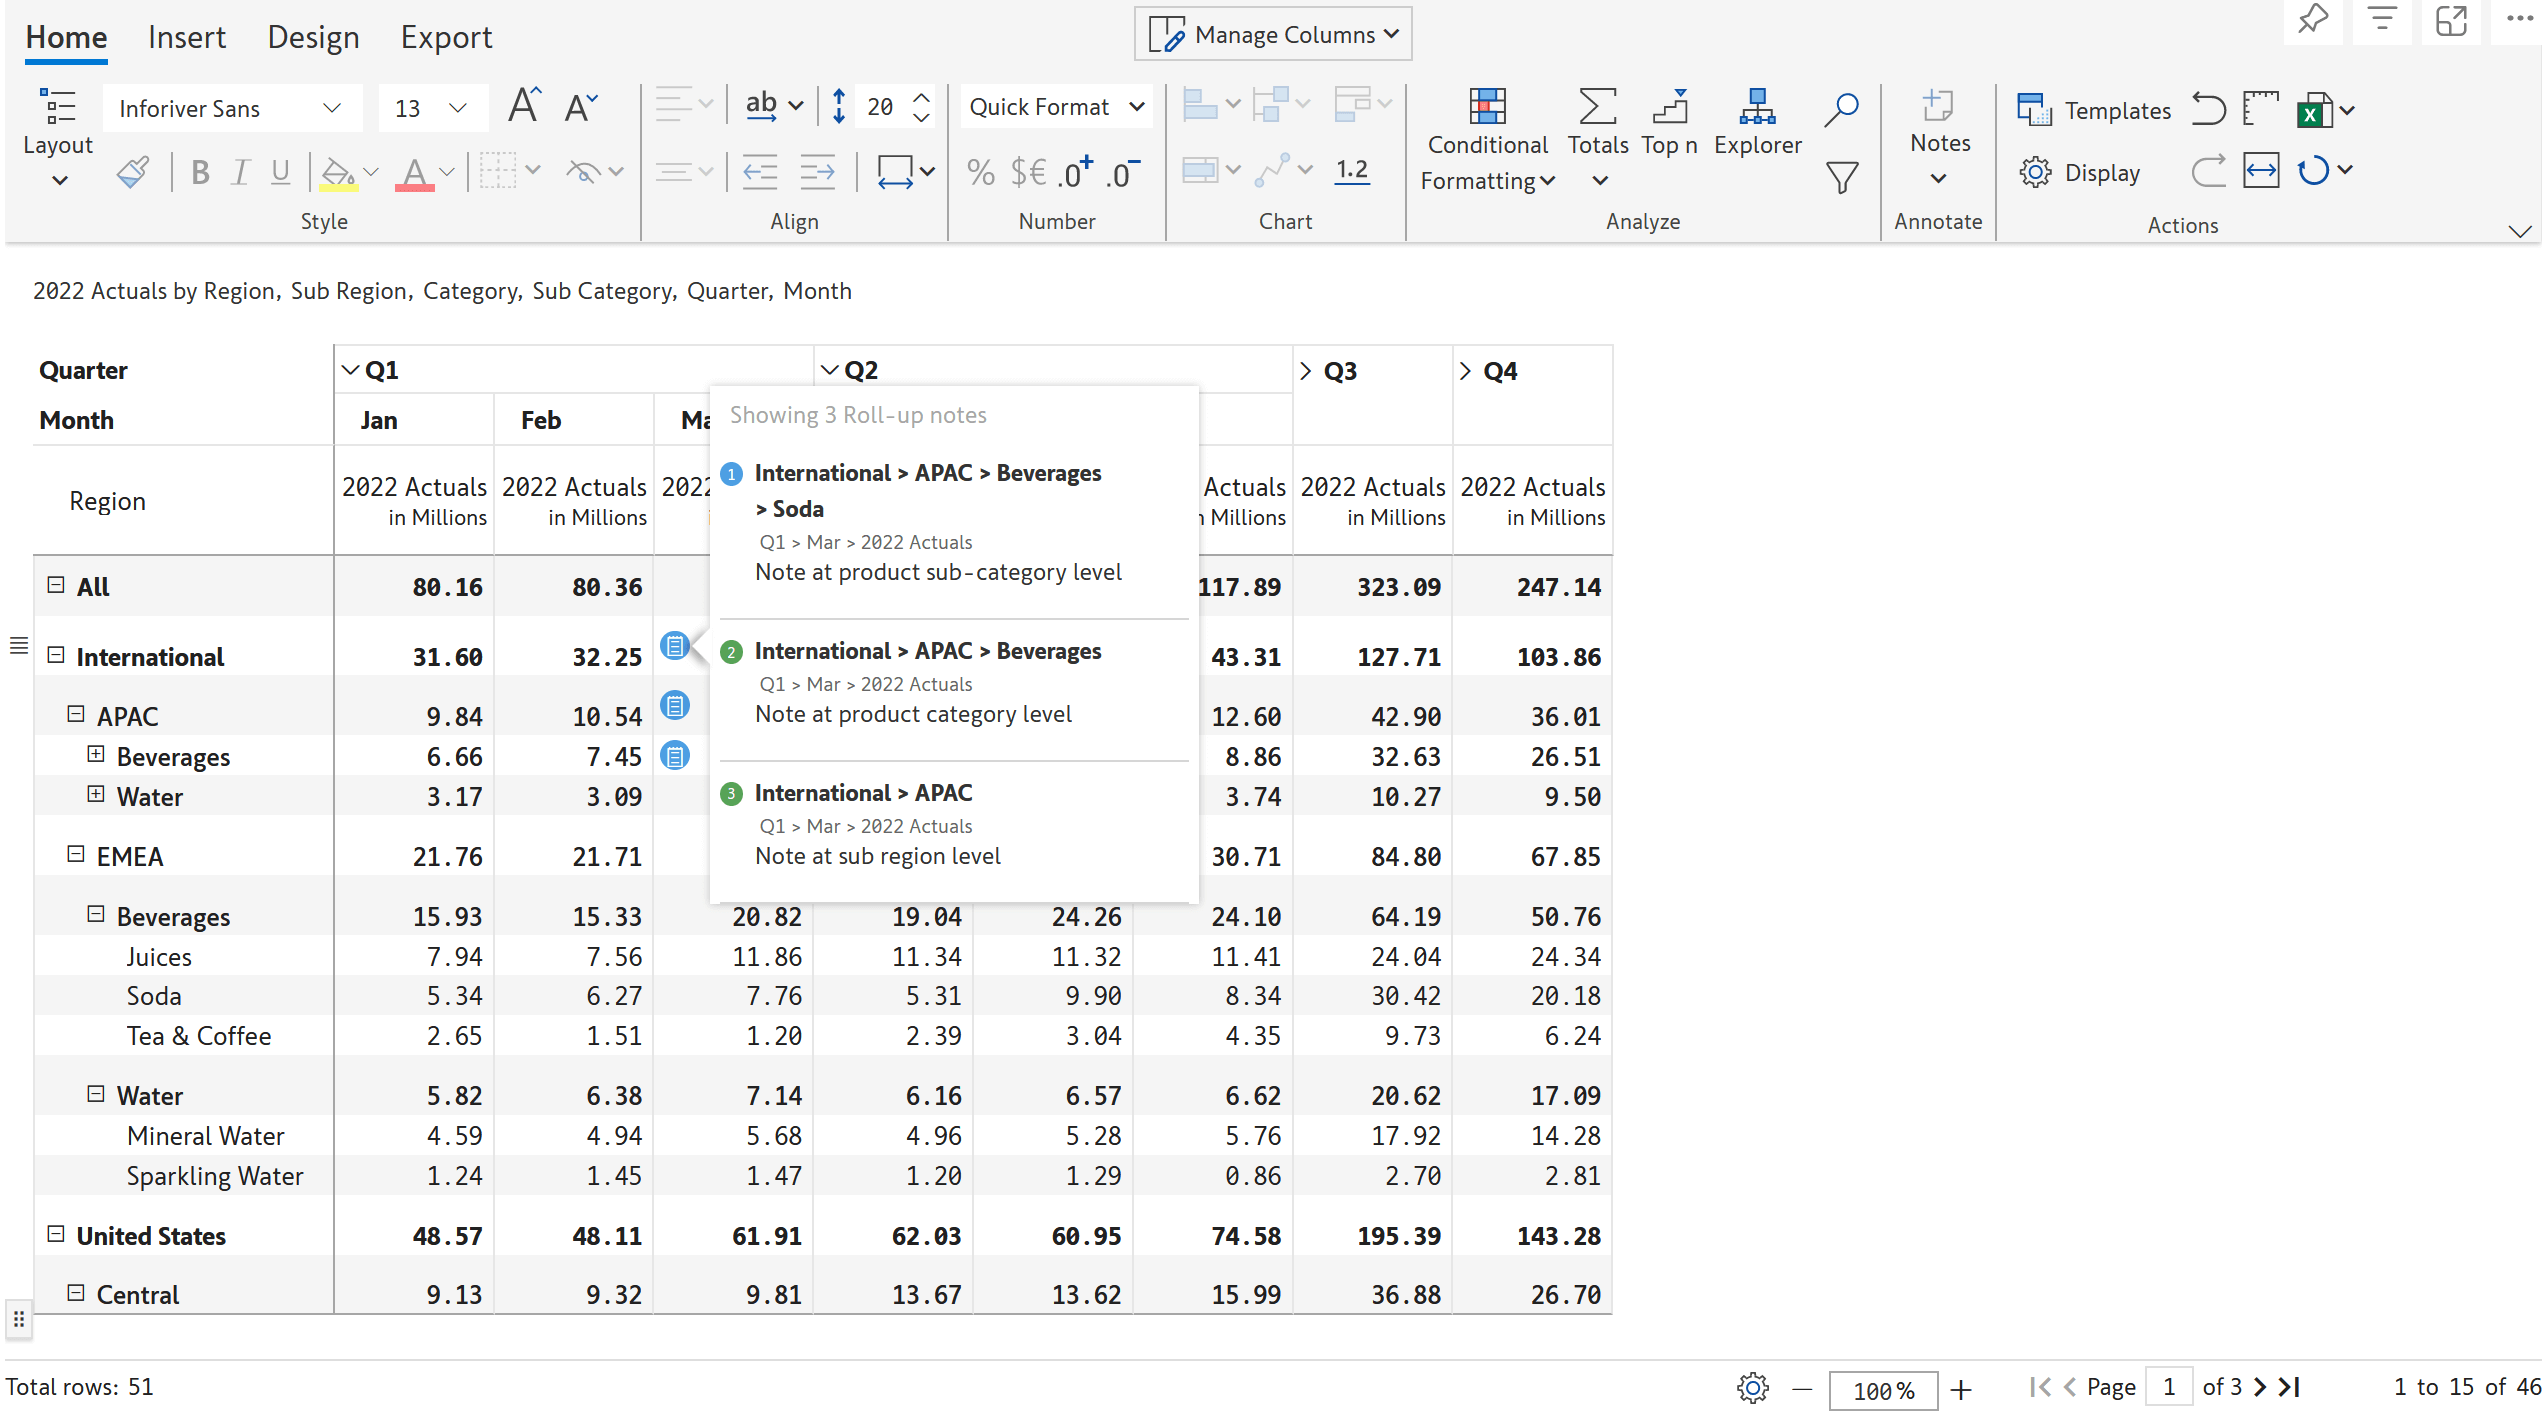
Roll-up notes - In reports with a large number of hierarchies, you can see notes rolled up at the subtotal and grand total level even if the hierarchies are collapsed.
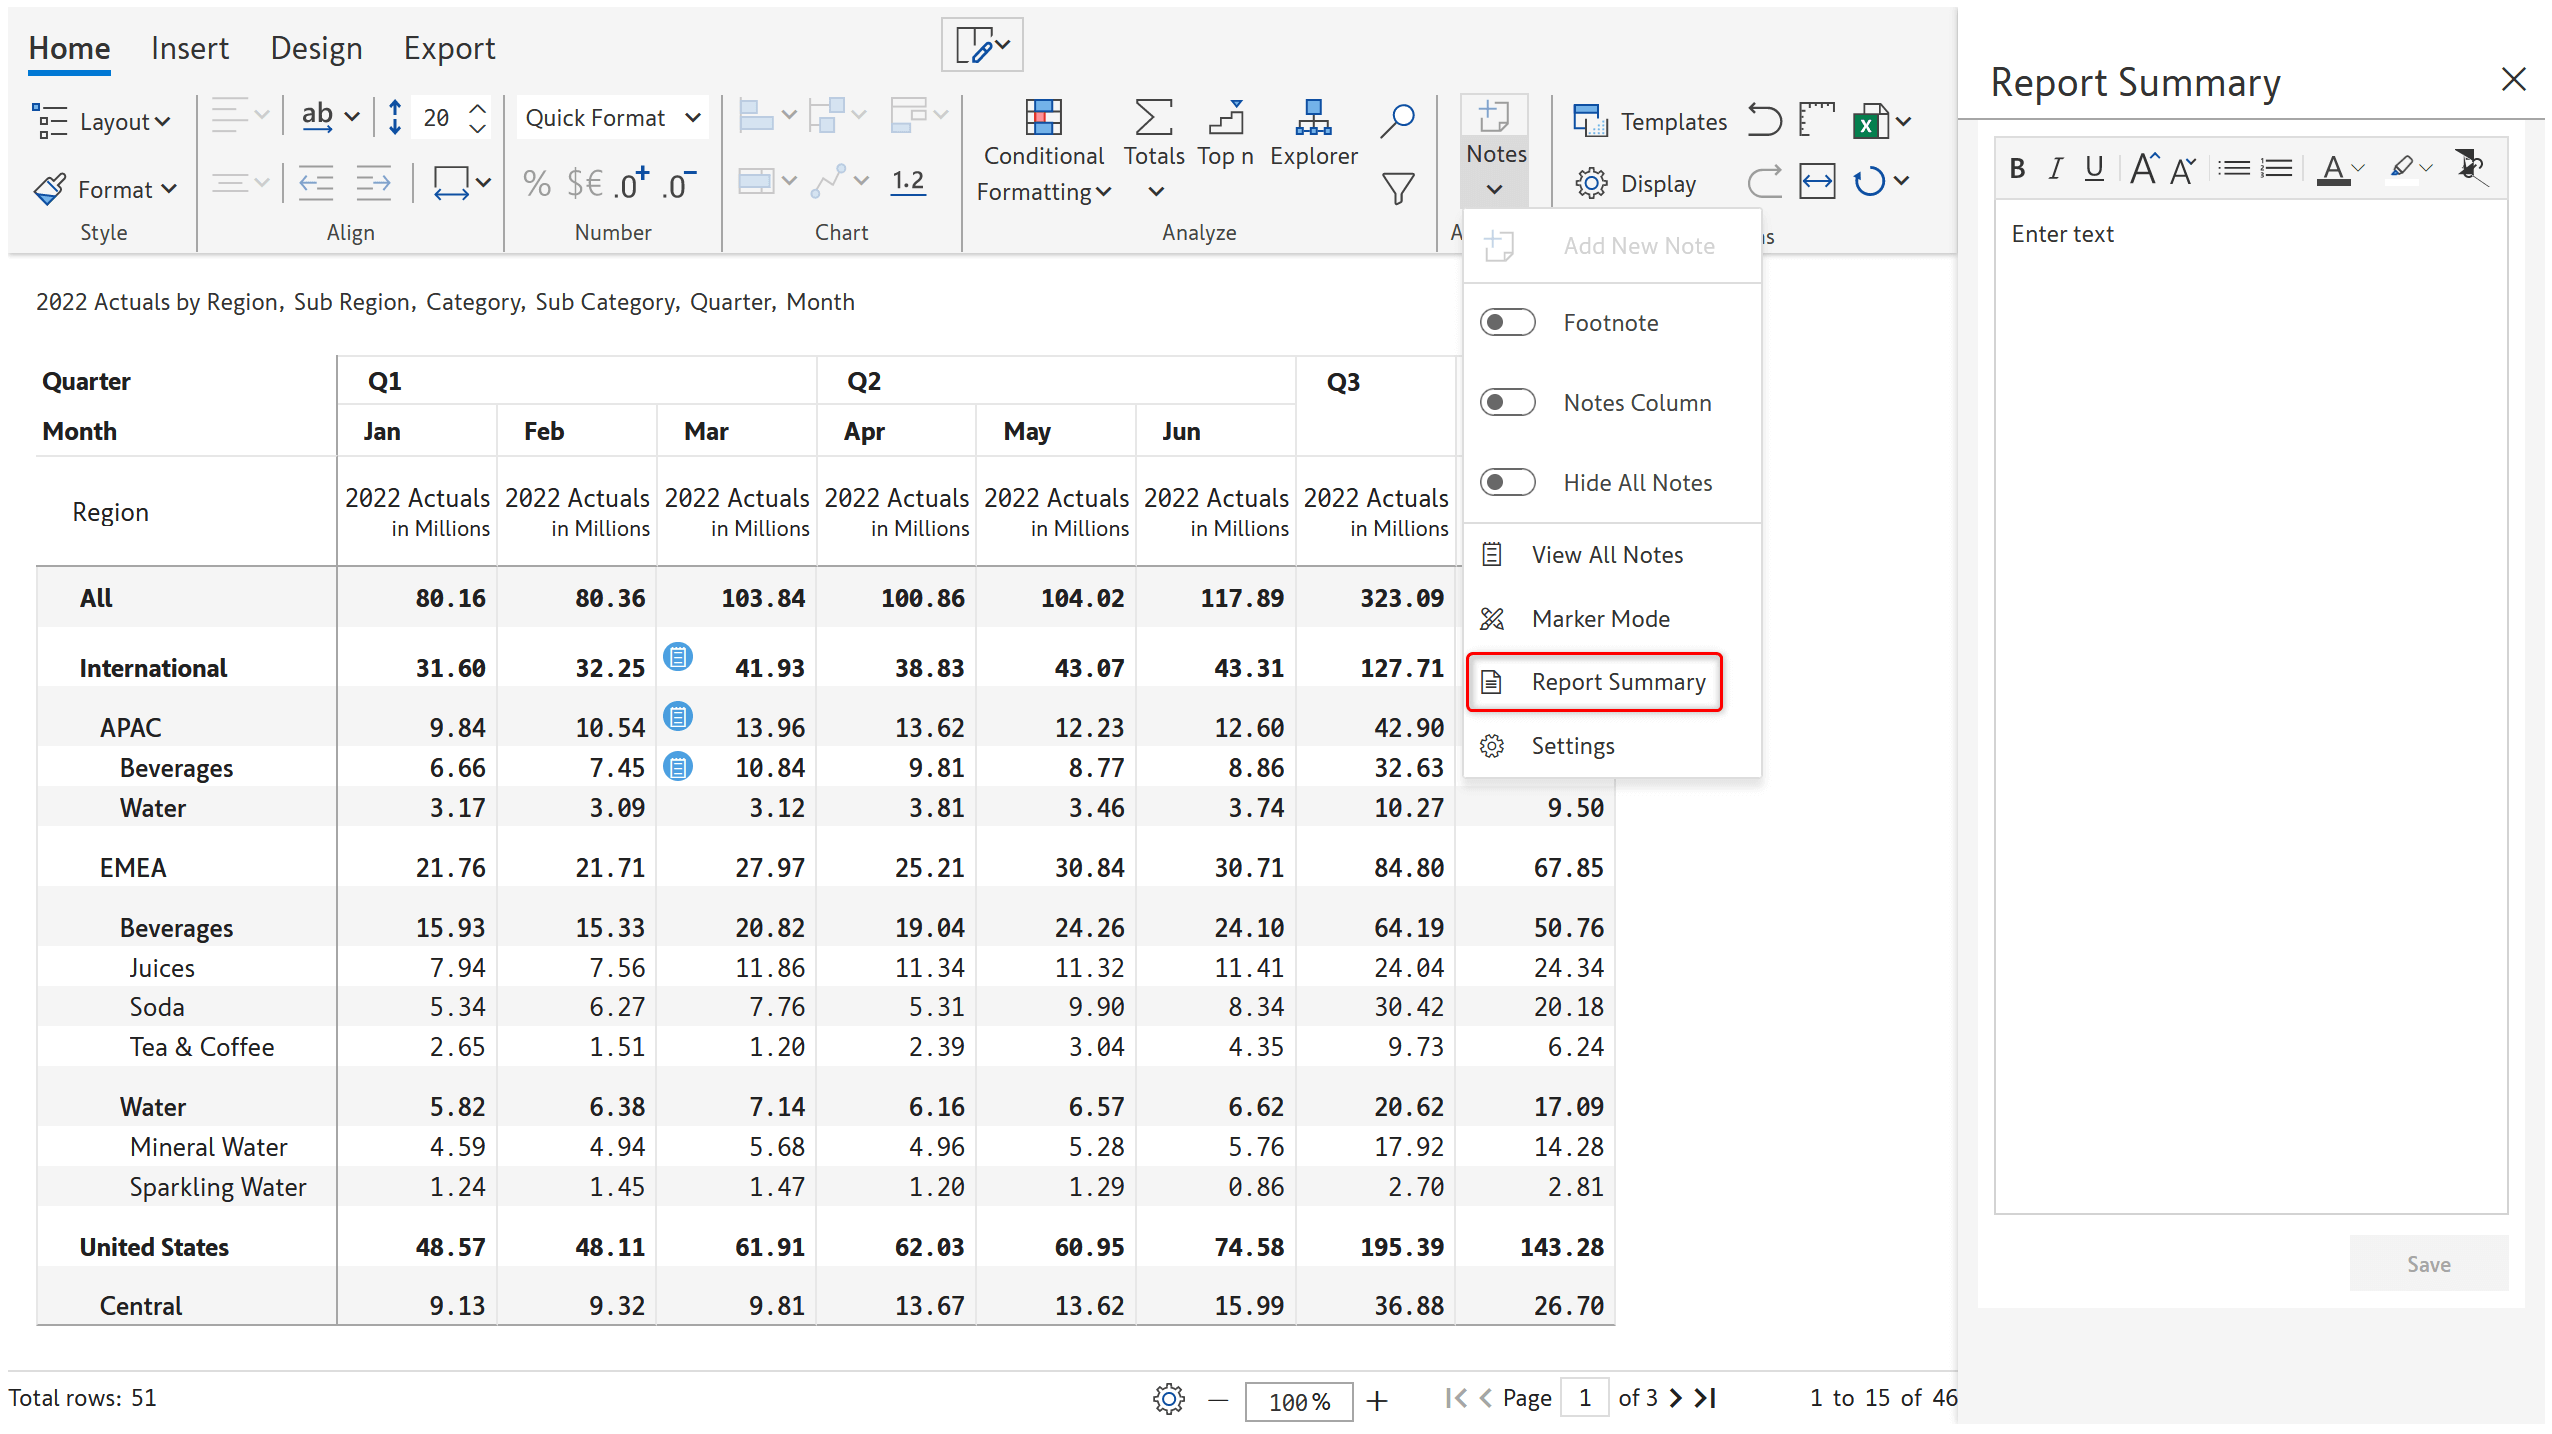
Report summary is now available as a separate option in the notes dropdown.
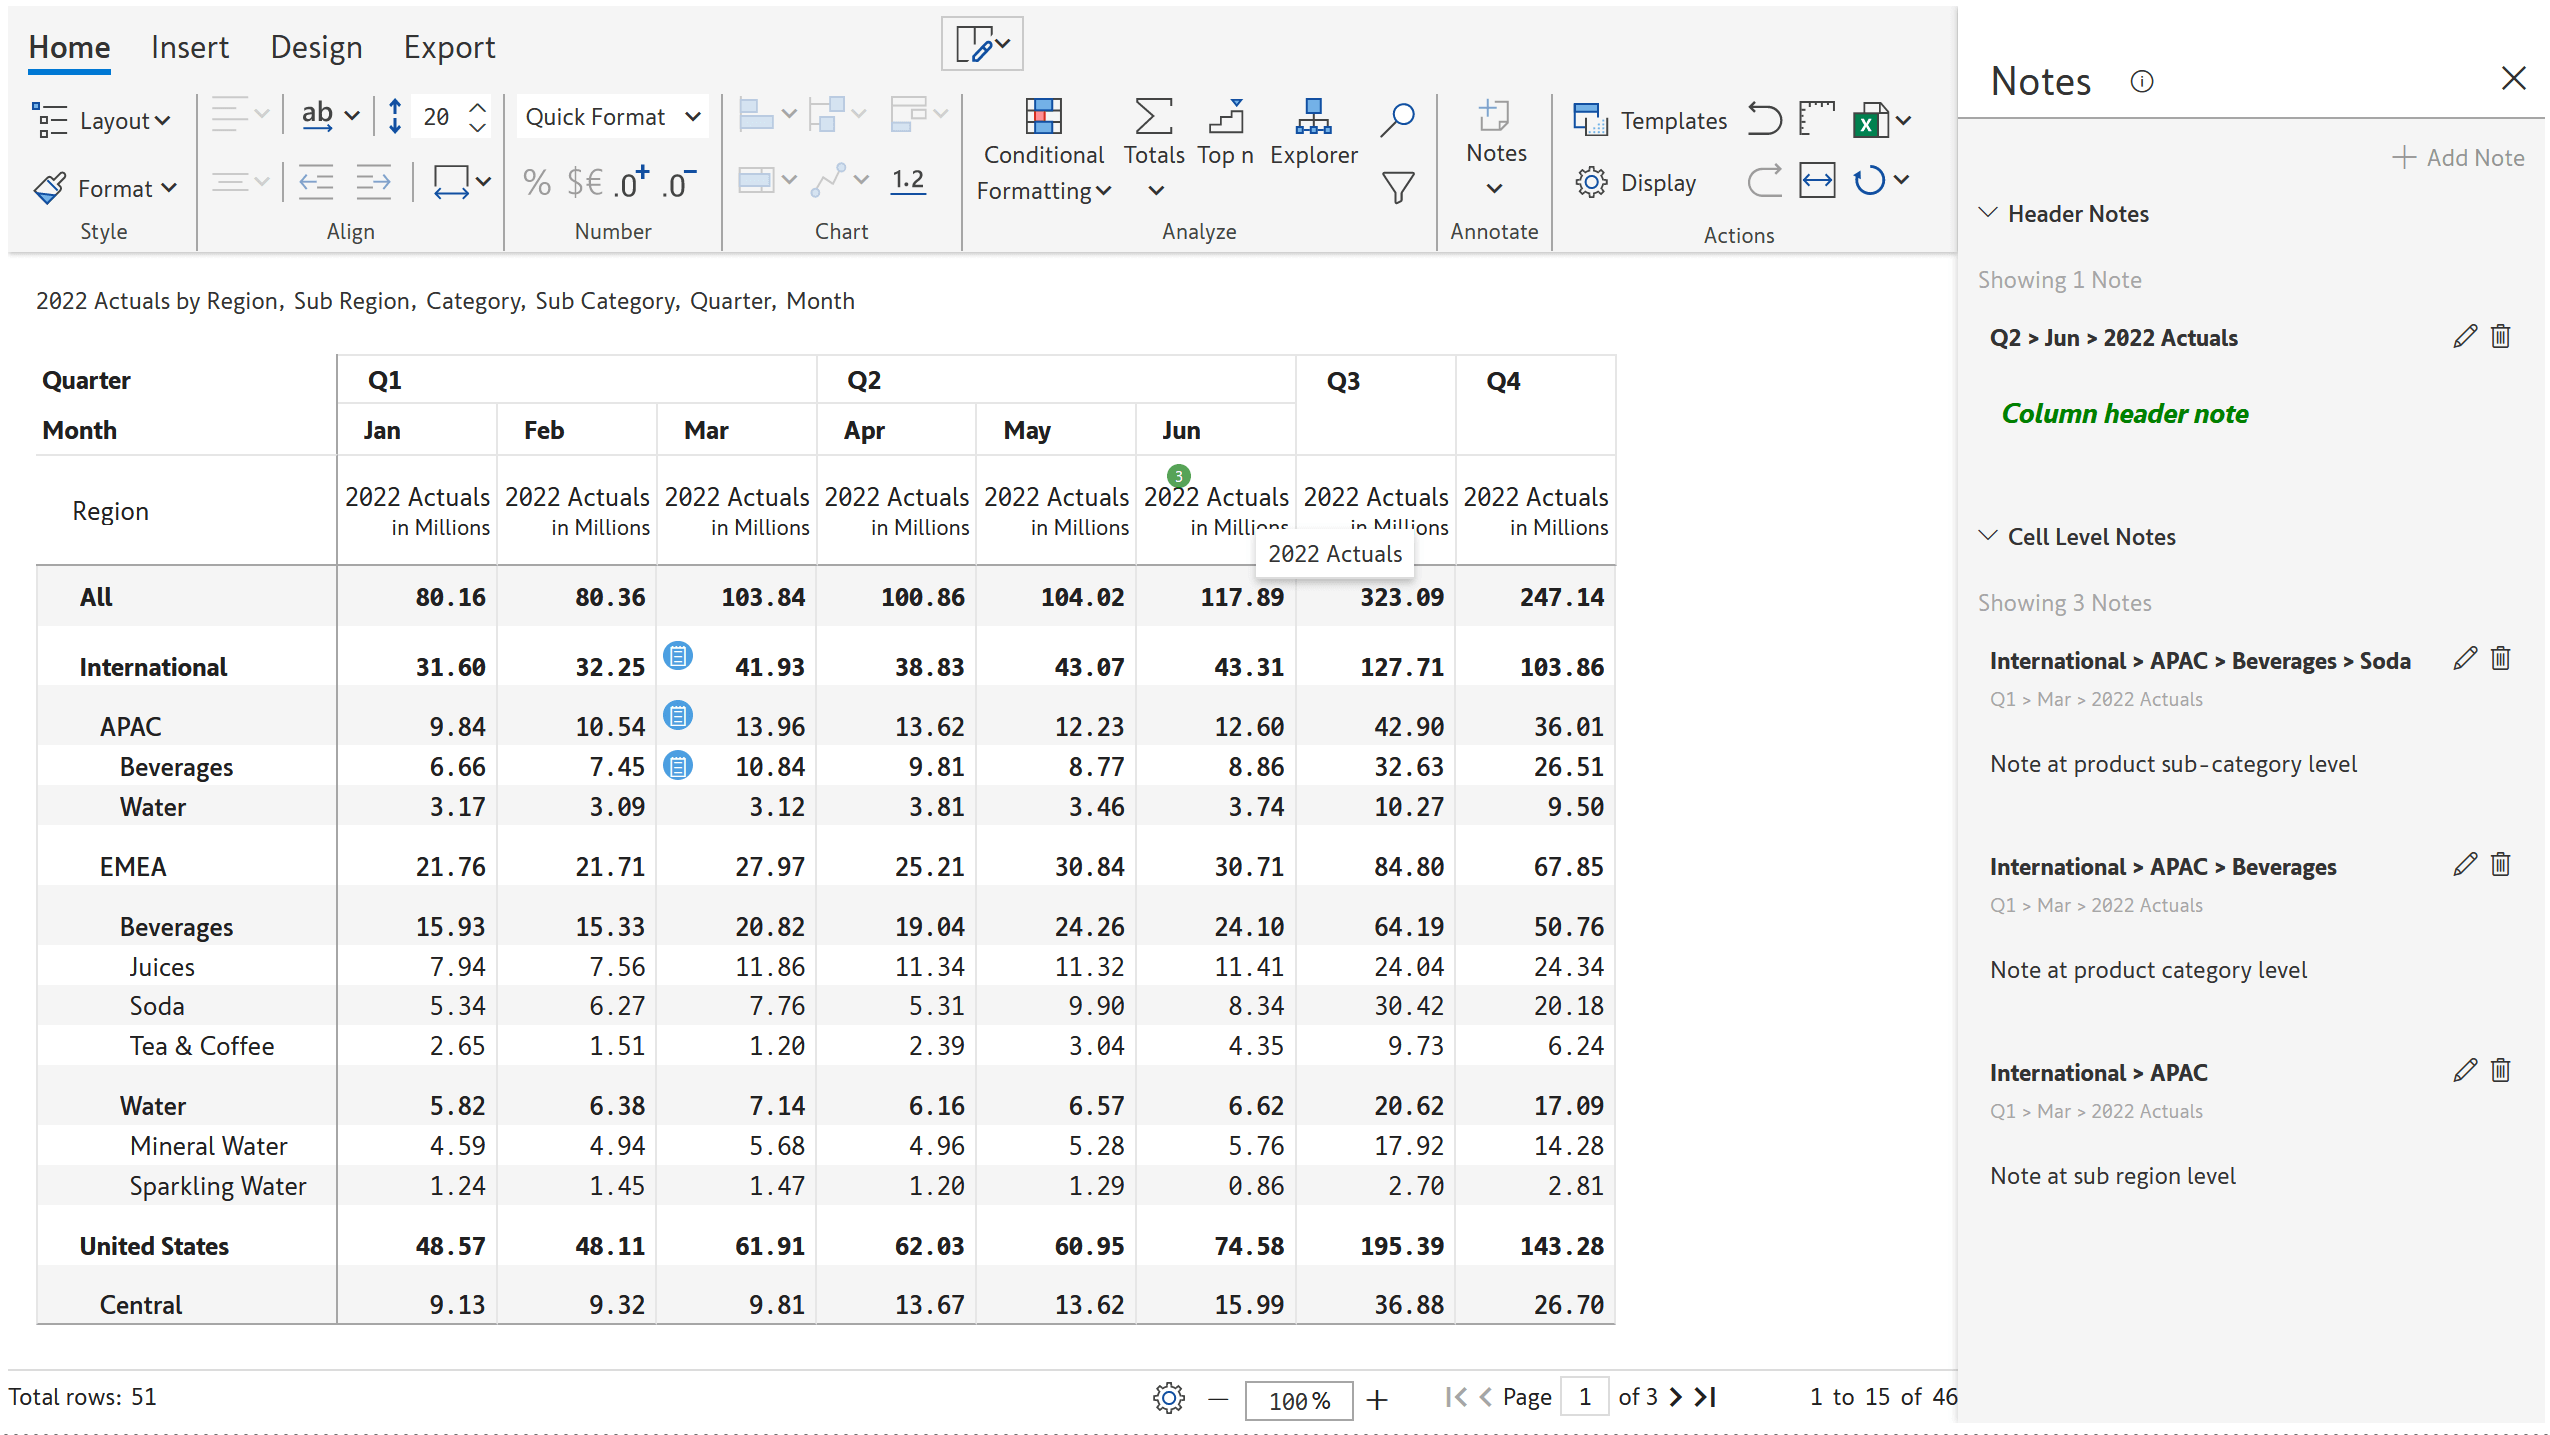
Header & cell level notes sections in the side panel have been modified for improved usability.
Relevant notes get filtered on selecting a cell/row/column.
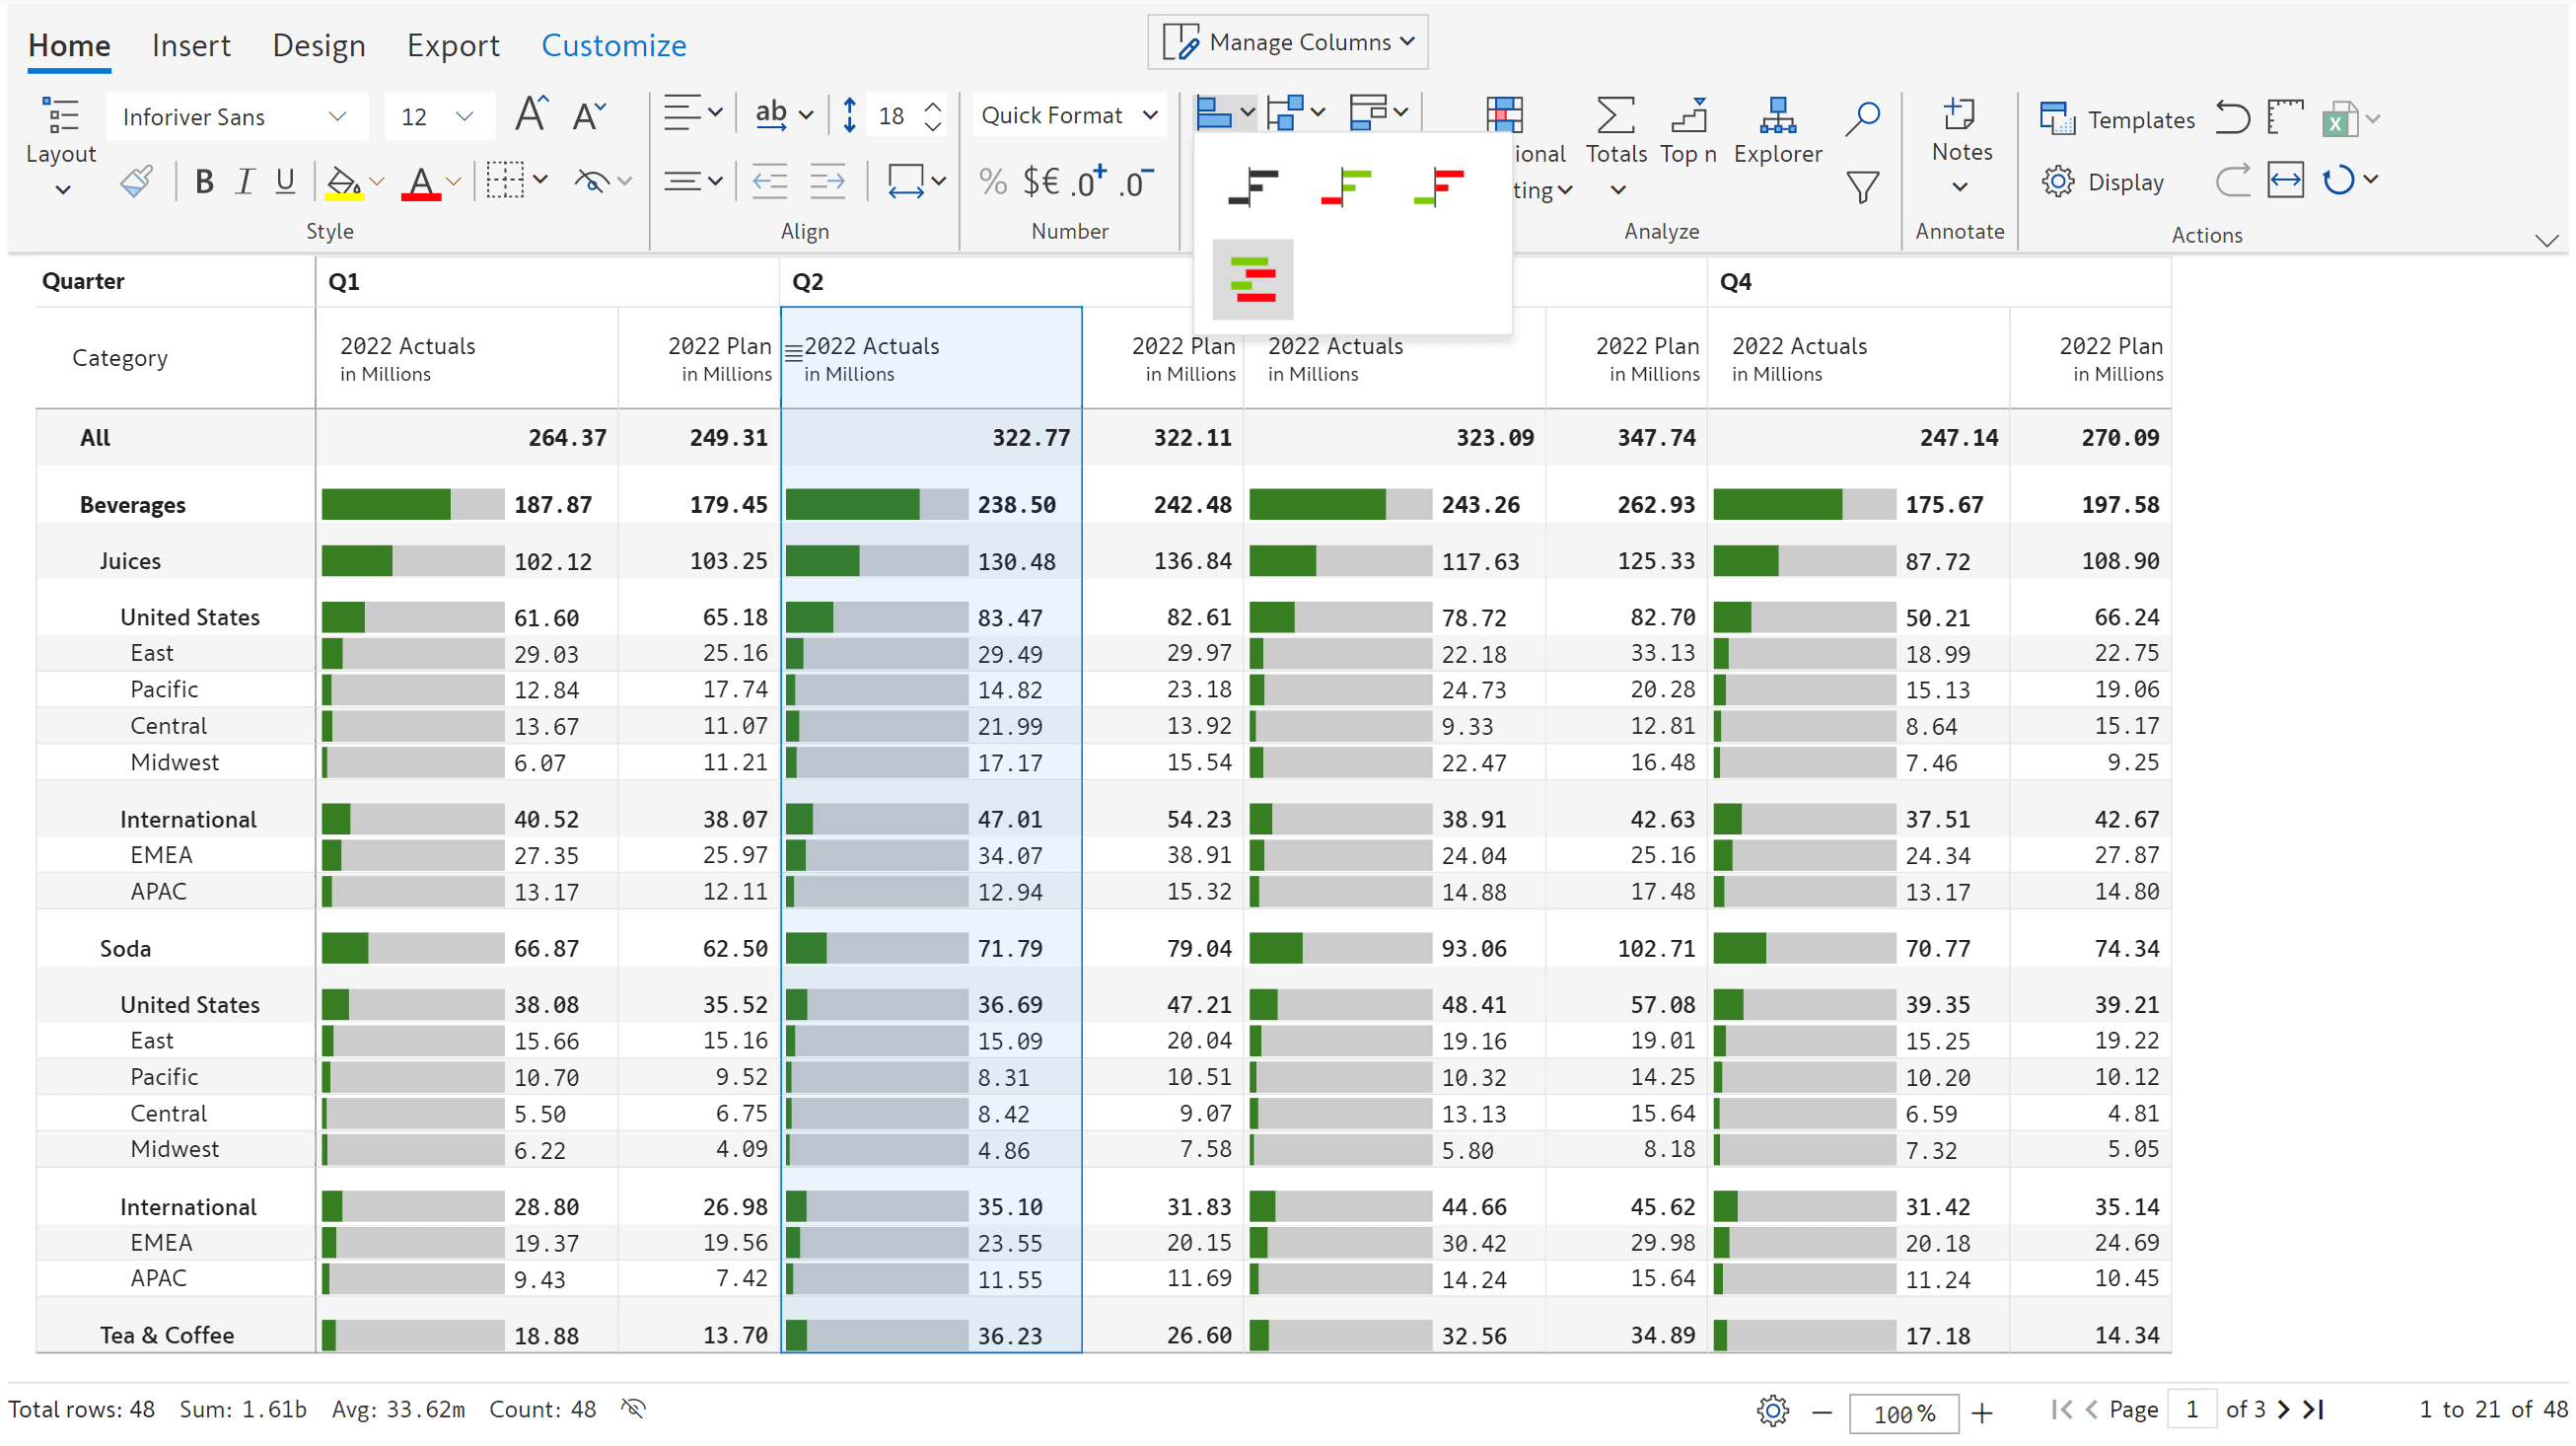
3. New chart type
Range bar chart has been introduced in version 2.0.
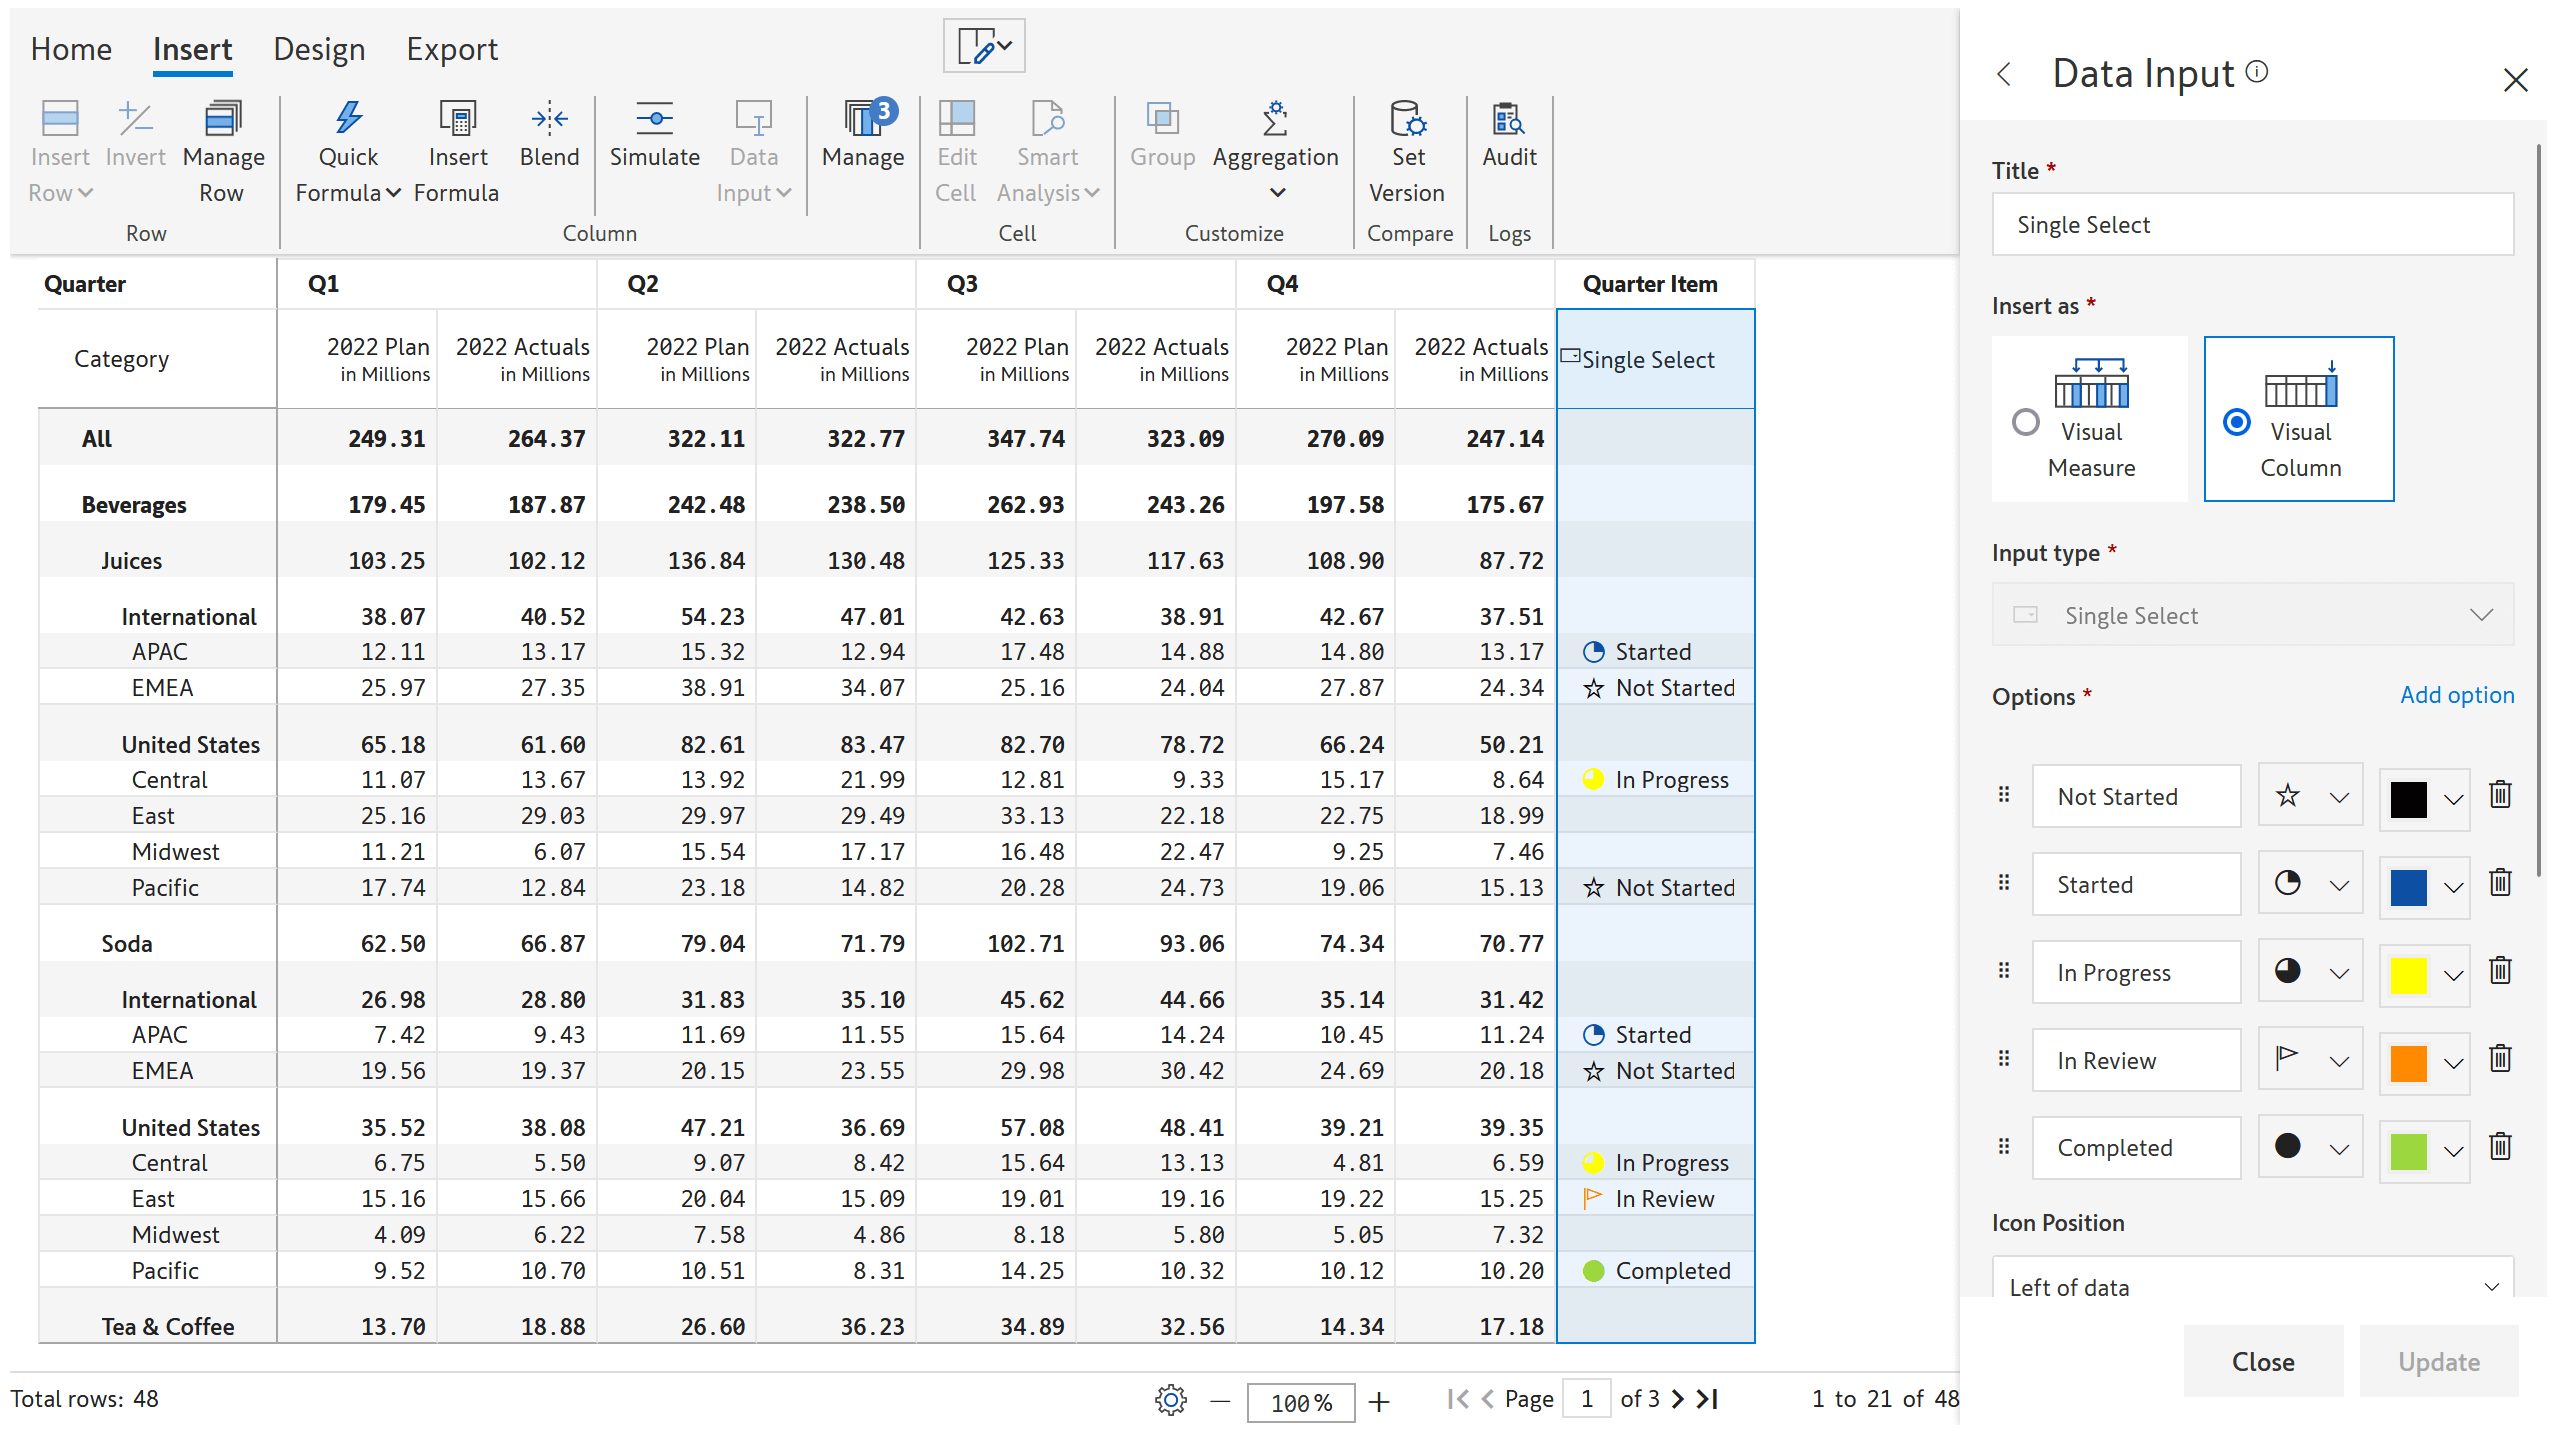
4. Data input
Lock cell feature for non-numeric columns
Conditional formatting based on icon, color and position for select and multi-select columns
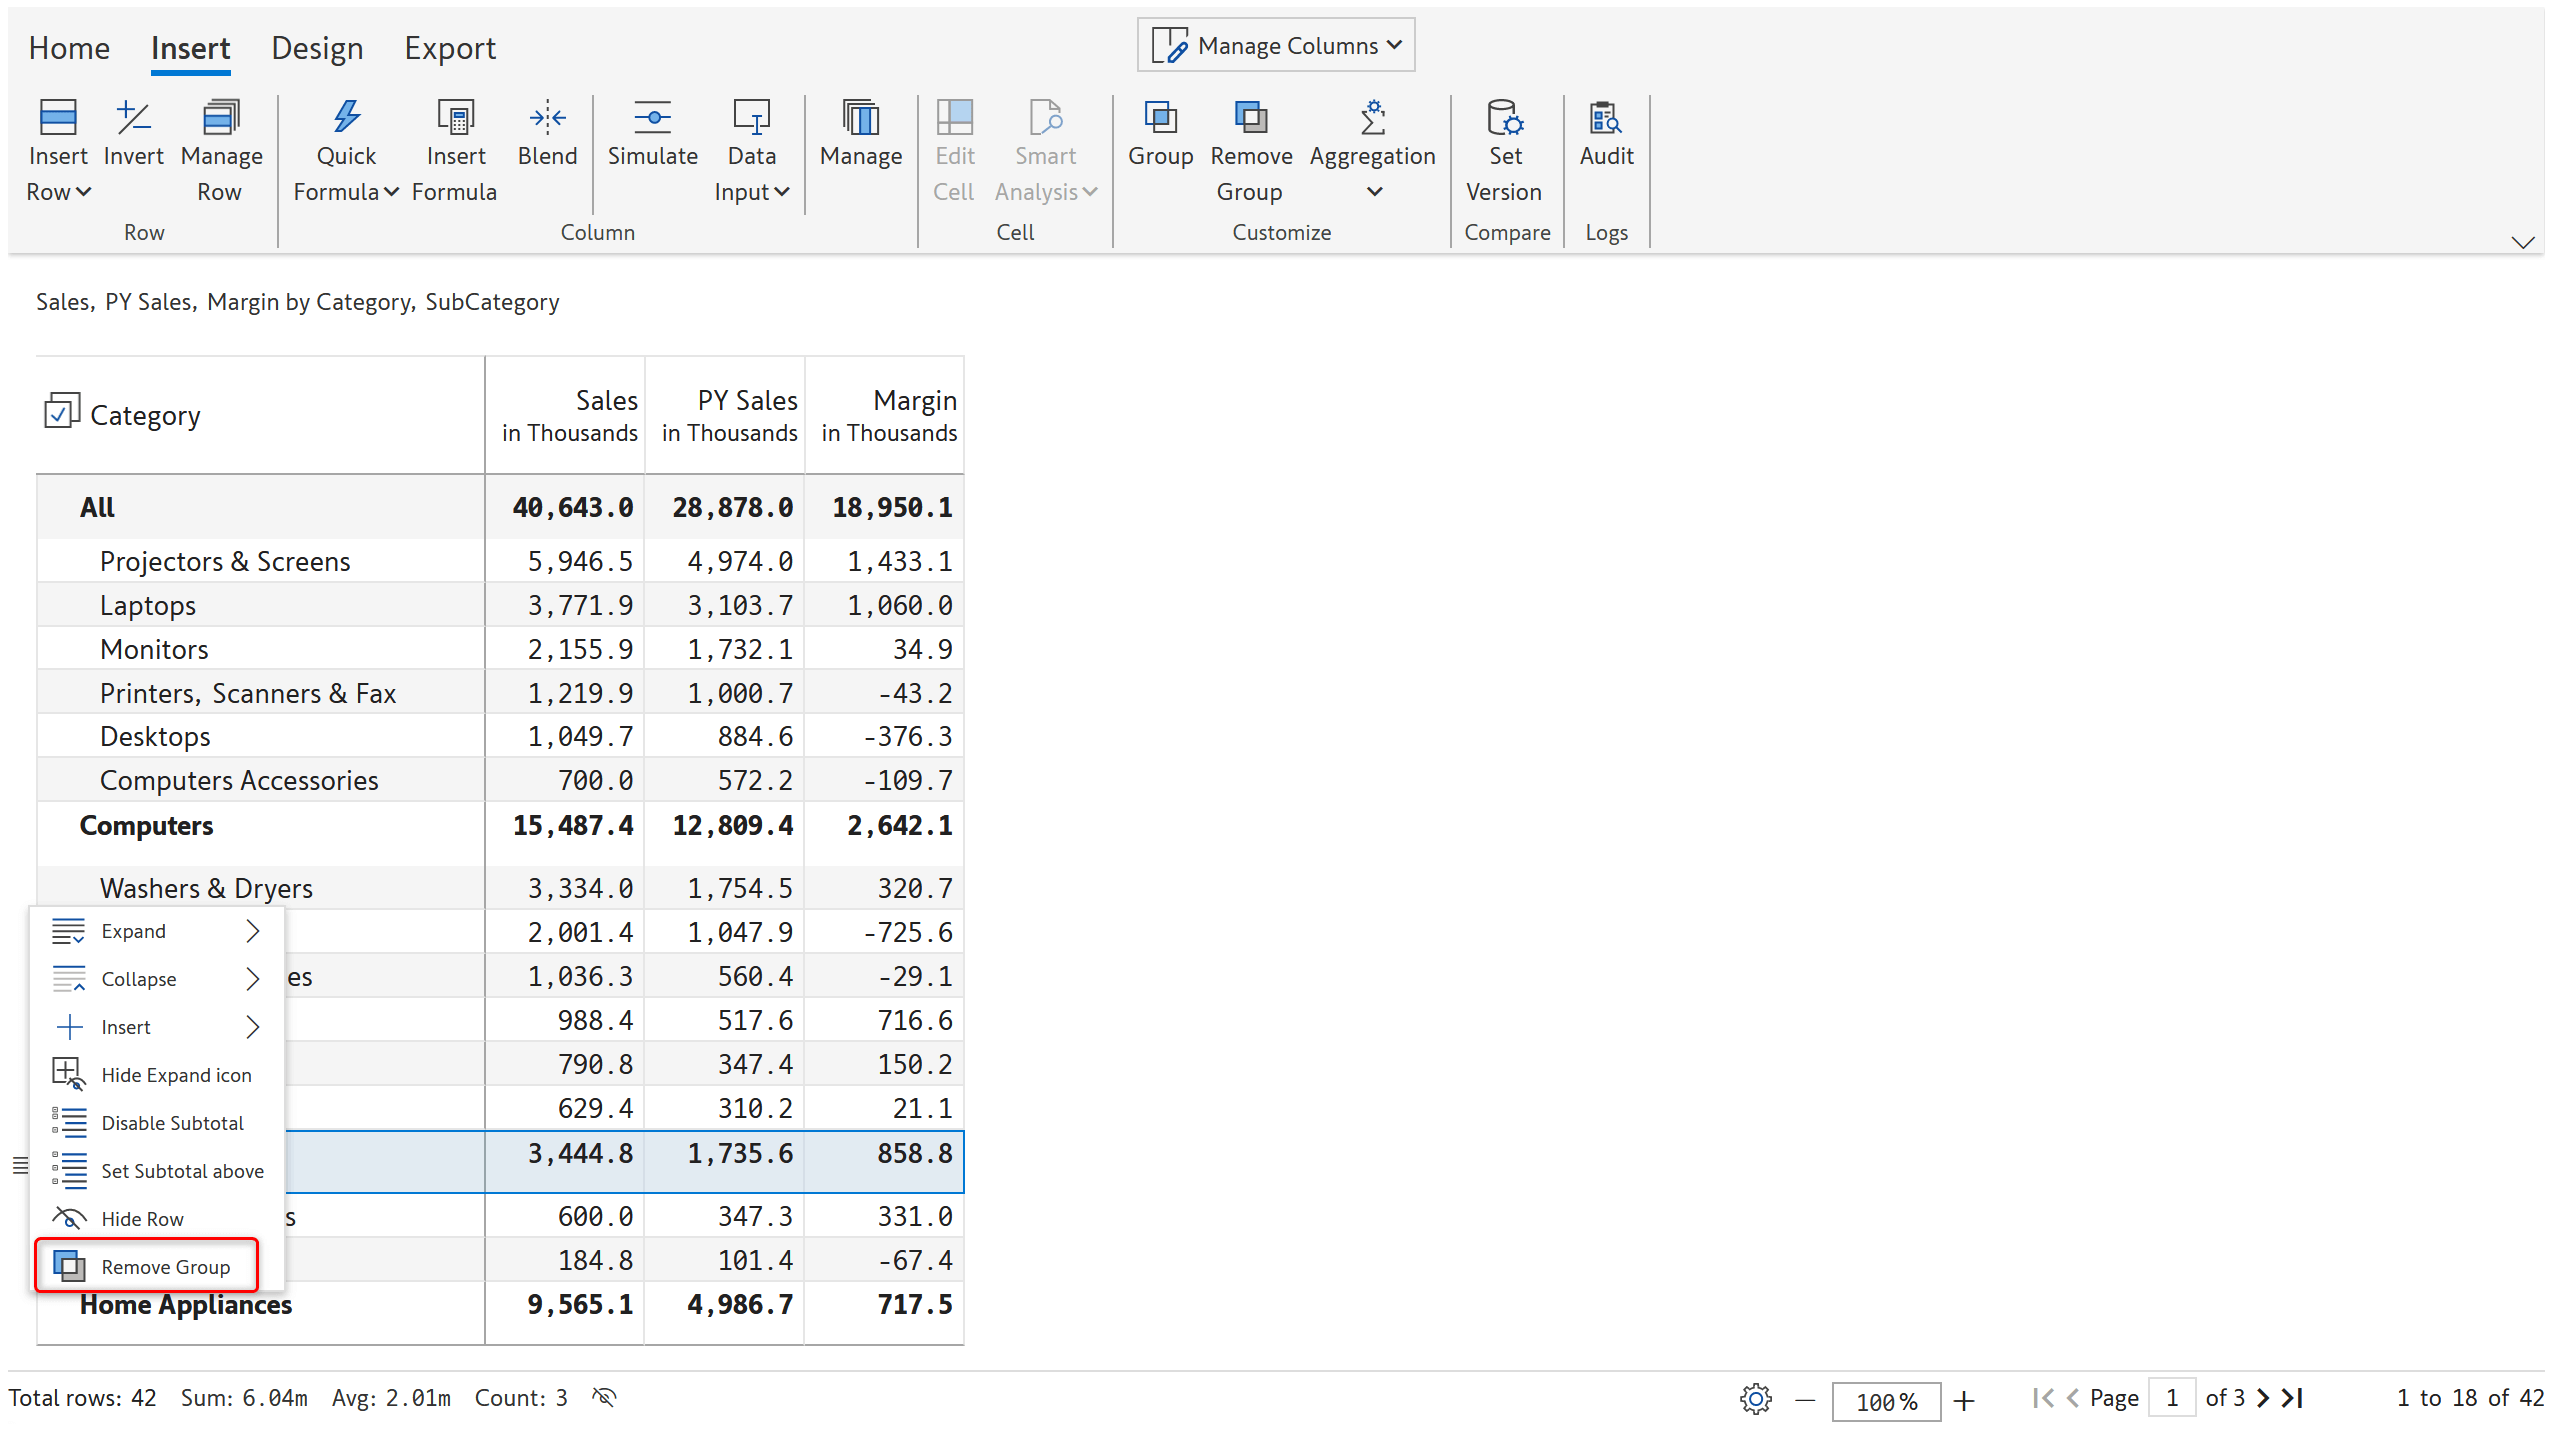
5. Row and column gripper enhancements
There is an option in the row gripper to remove row groups.
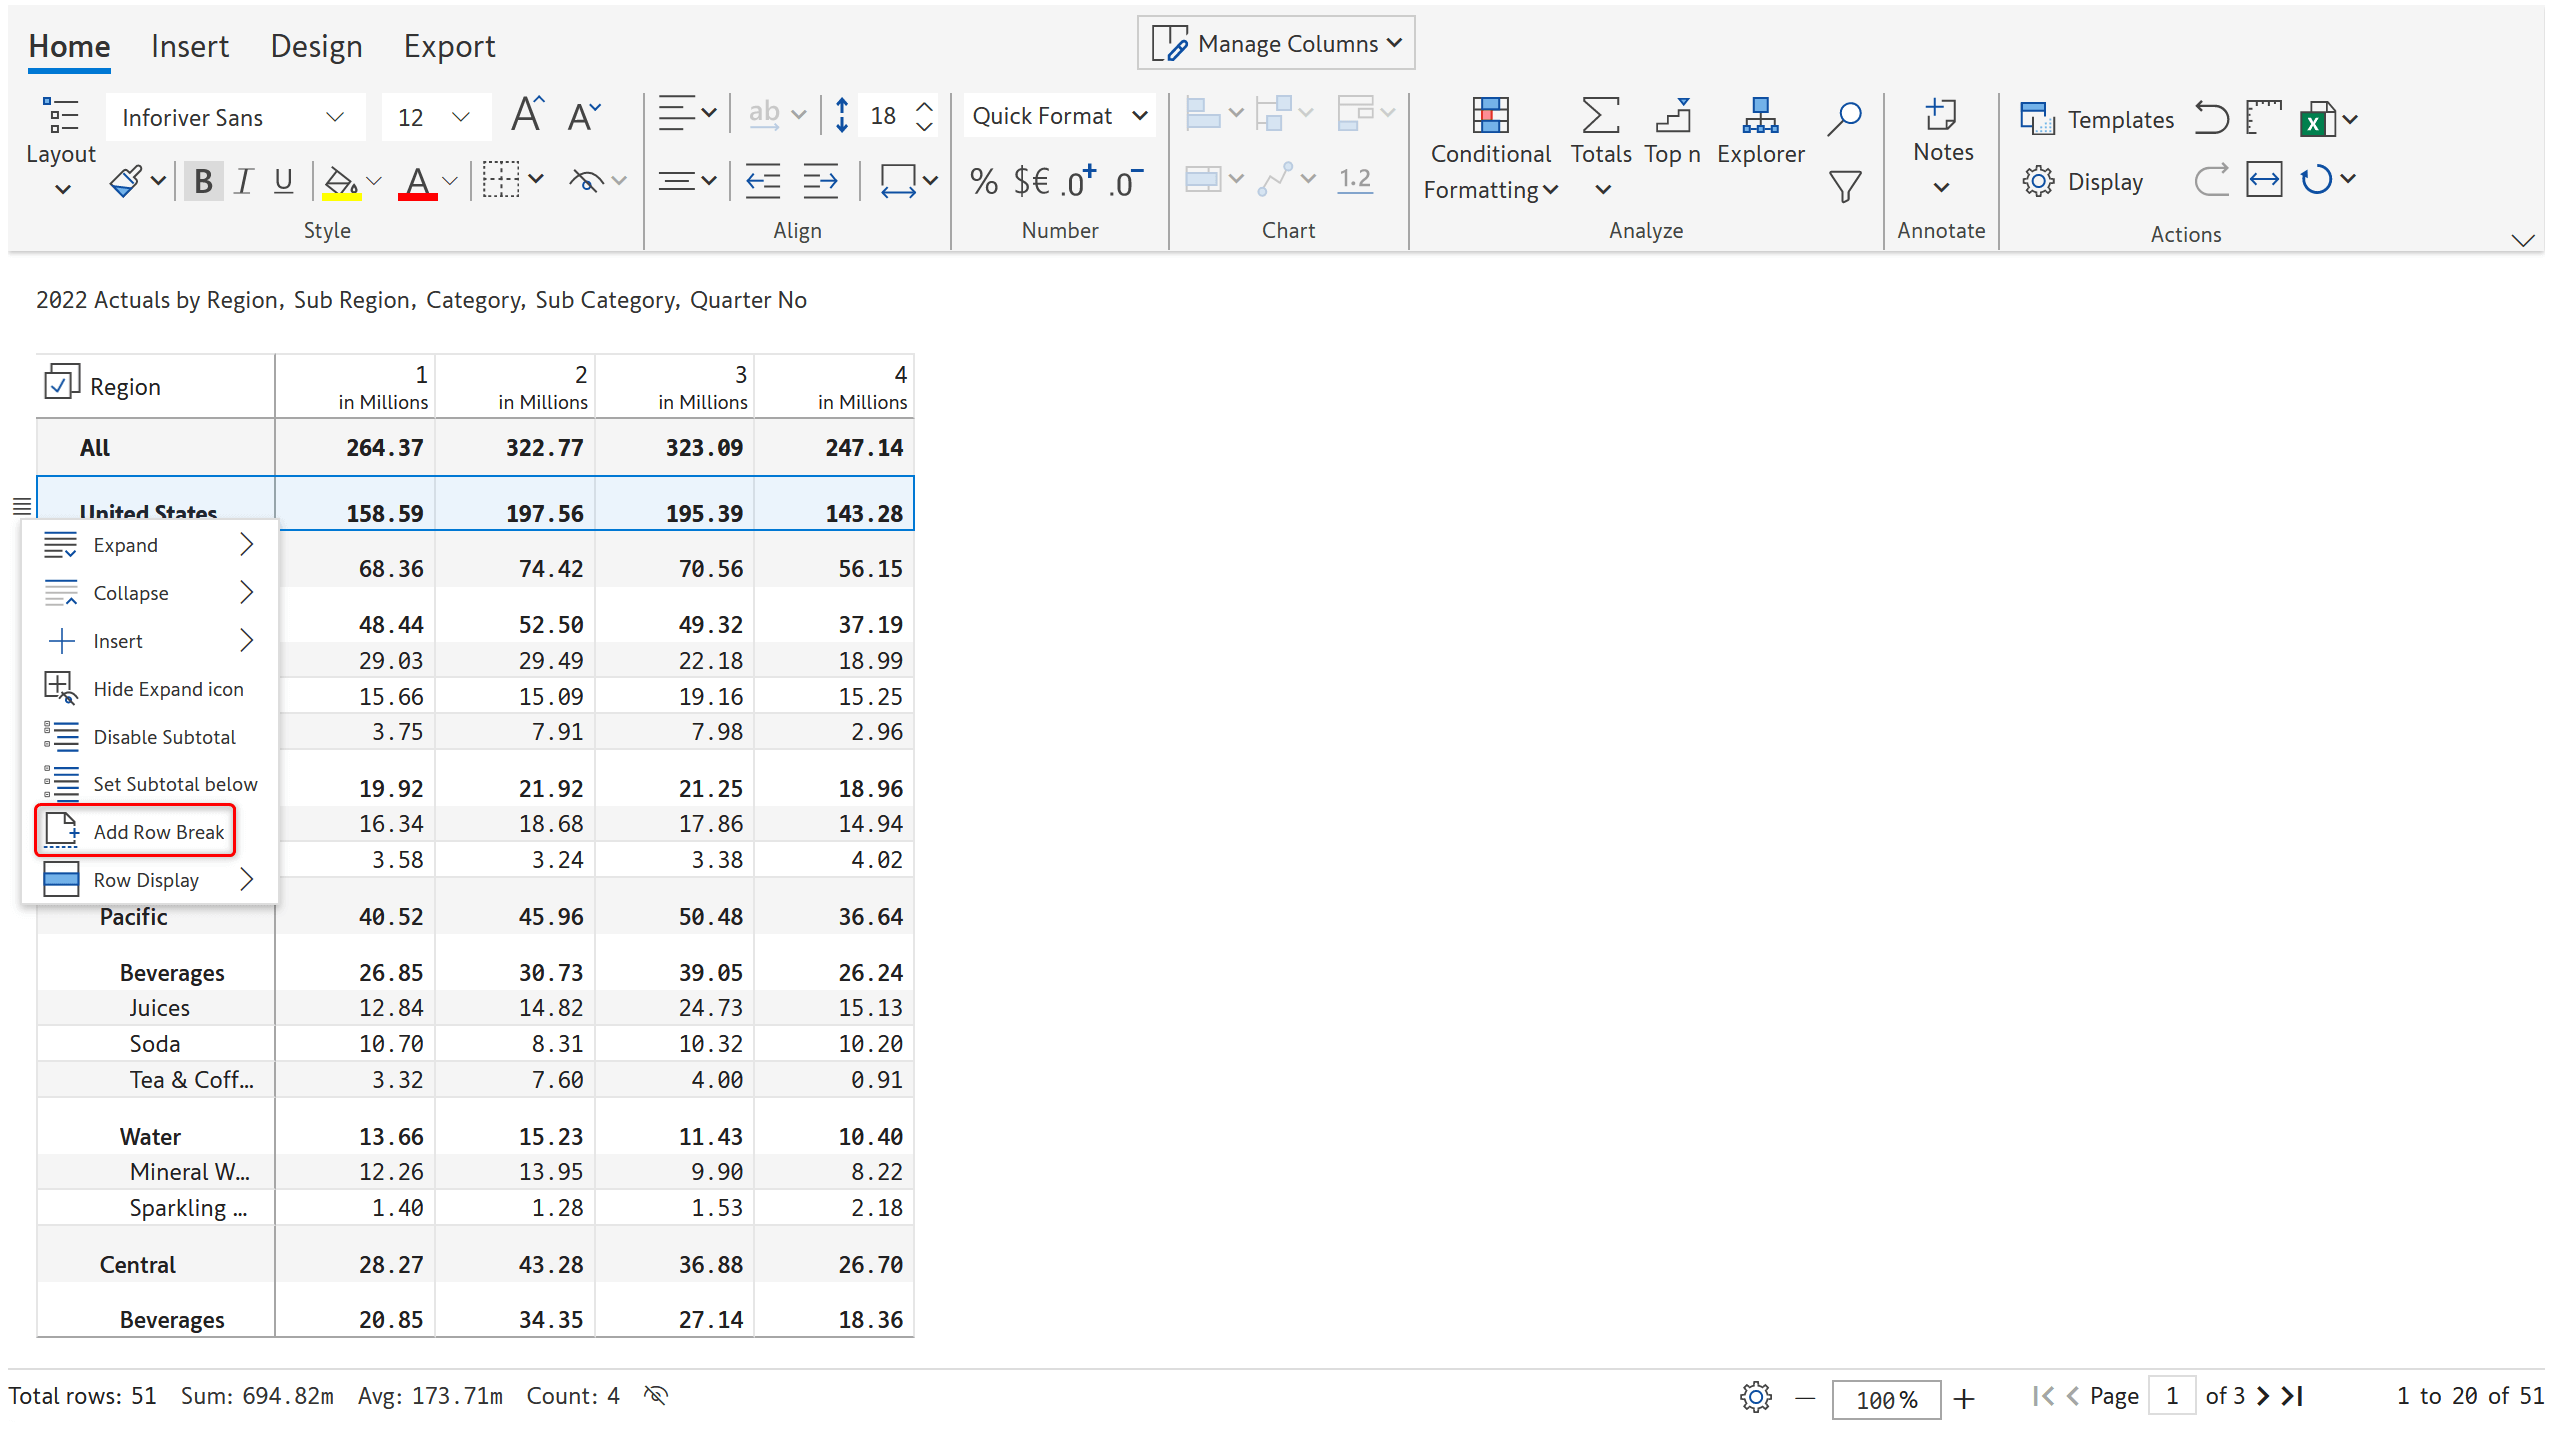
You can insert row break right from the row gripper.
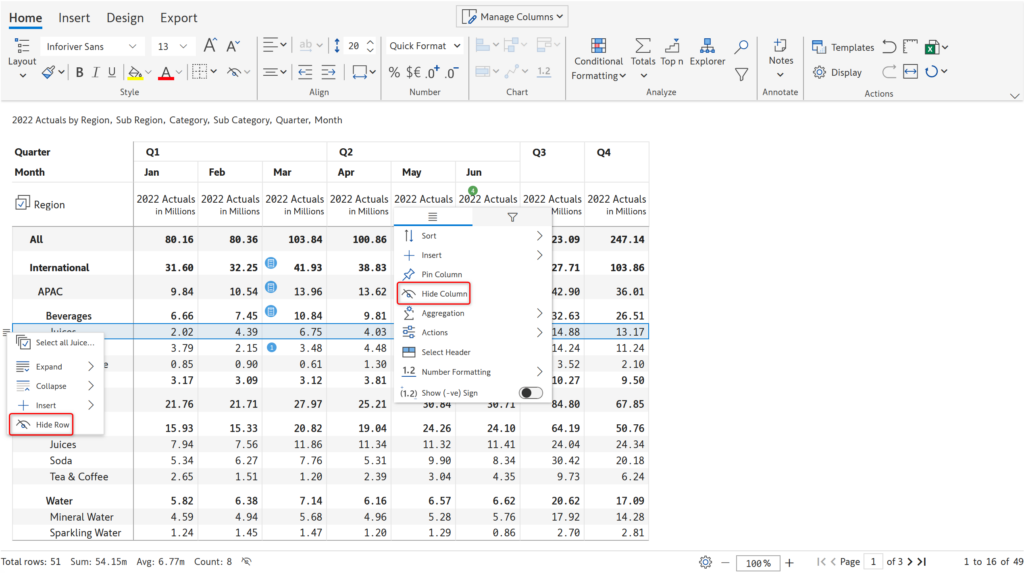
You can hide a row/column using the gripper as shown below.
6. Column styling
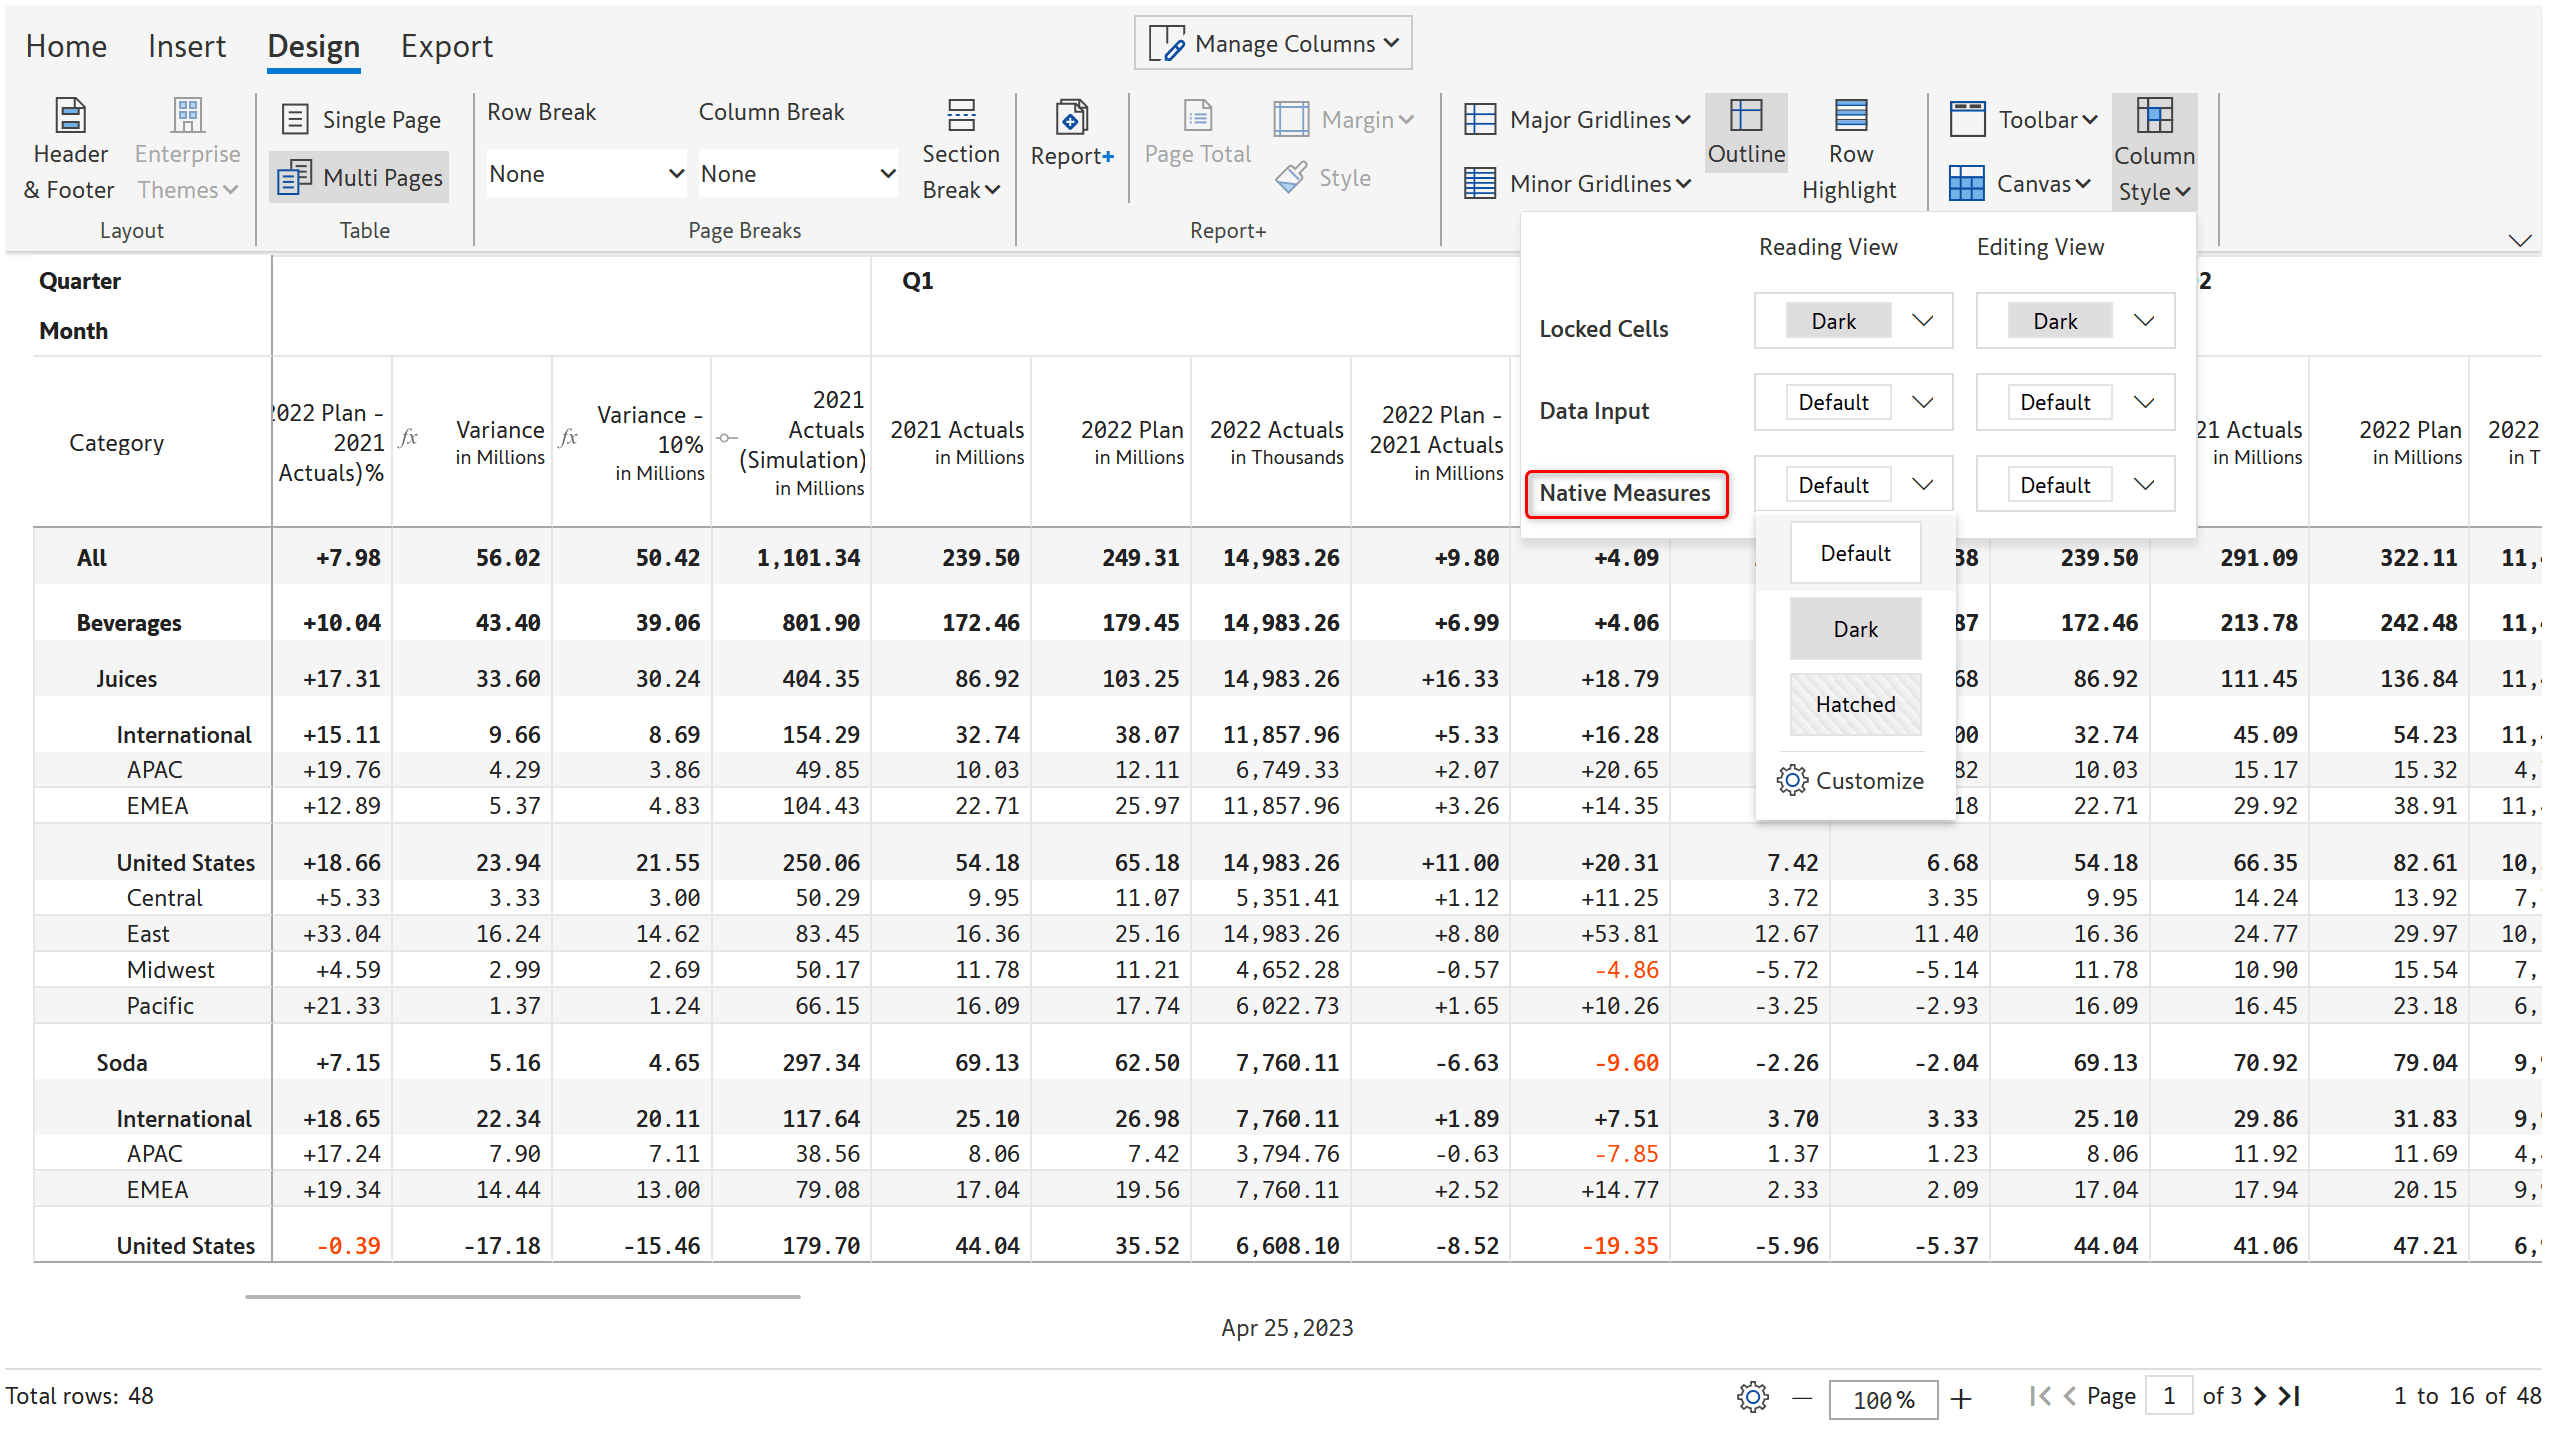
Column styling options have been added in the Design tab.
Other cells field has been renamed as Native measures. Support for notes and comments columns in column style has been removed.
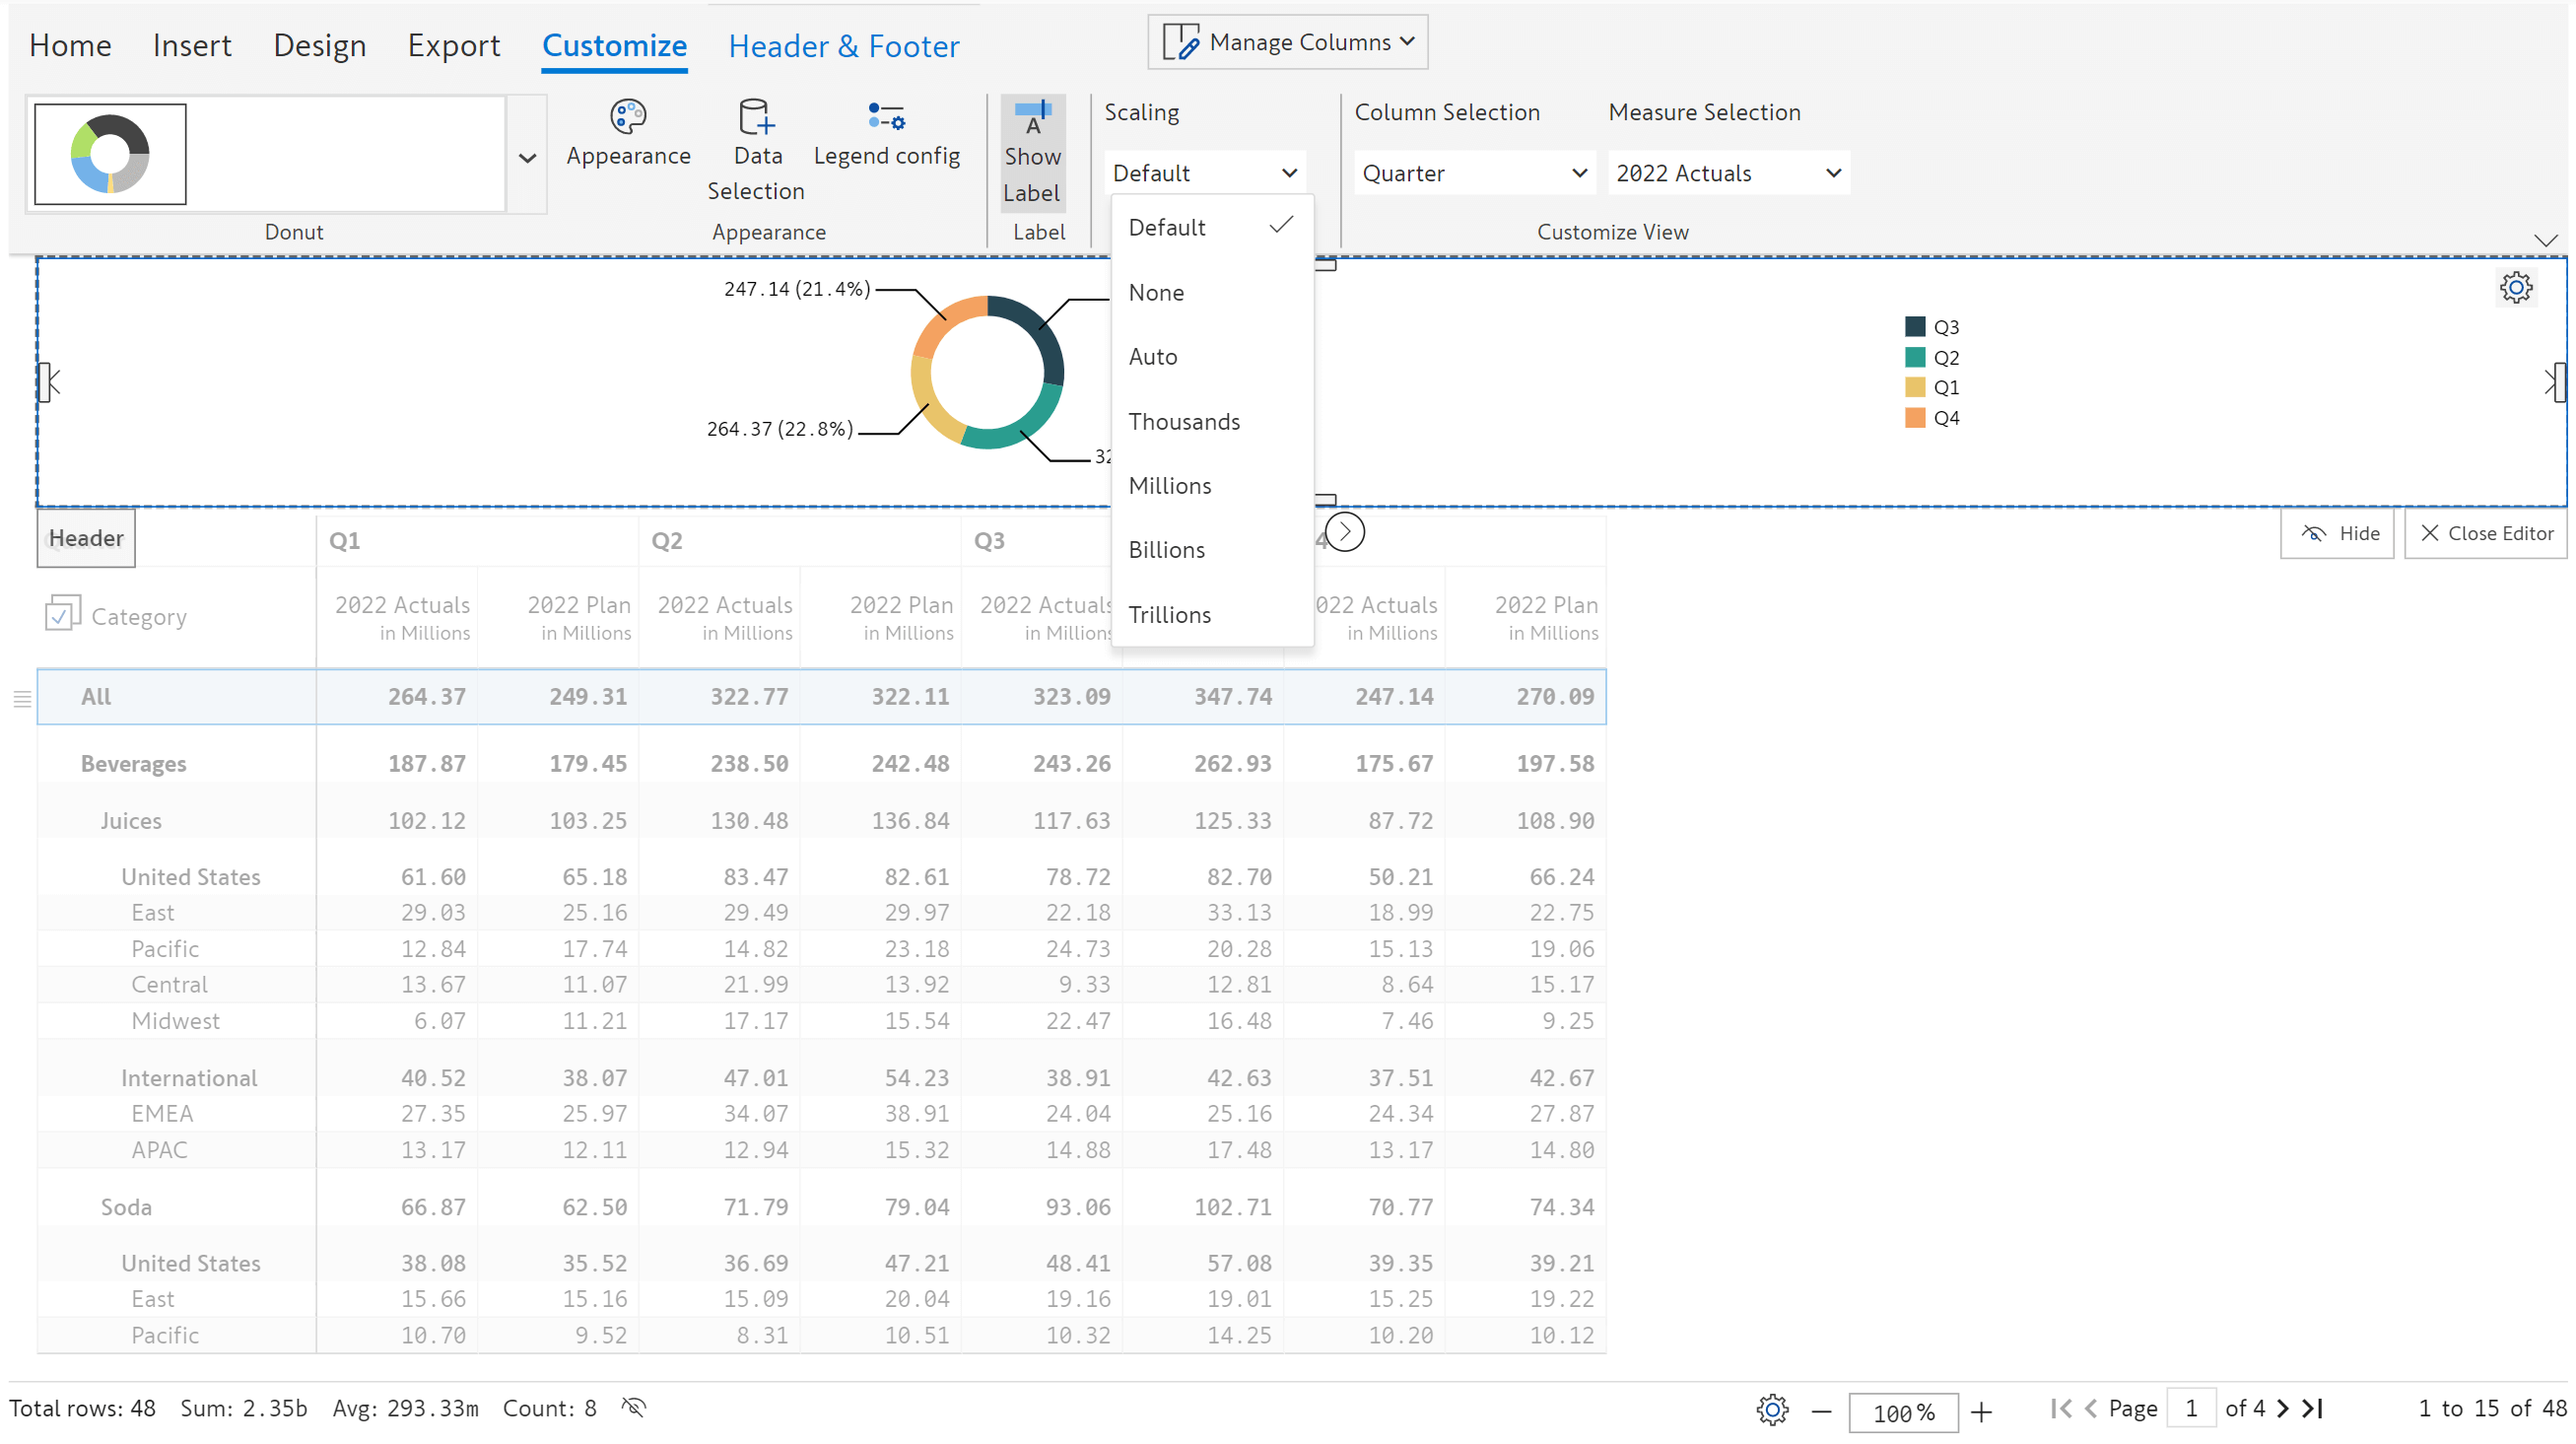
7. Header & Footer
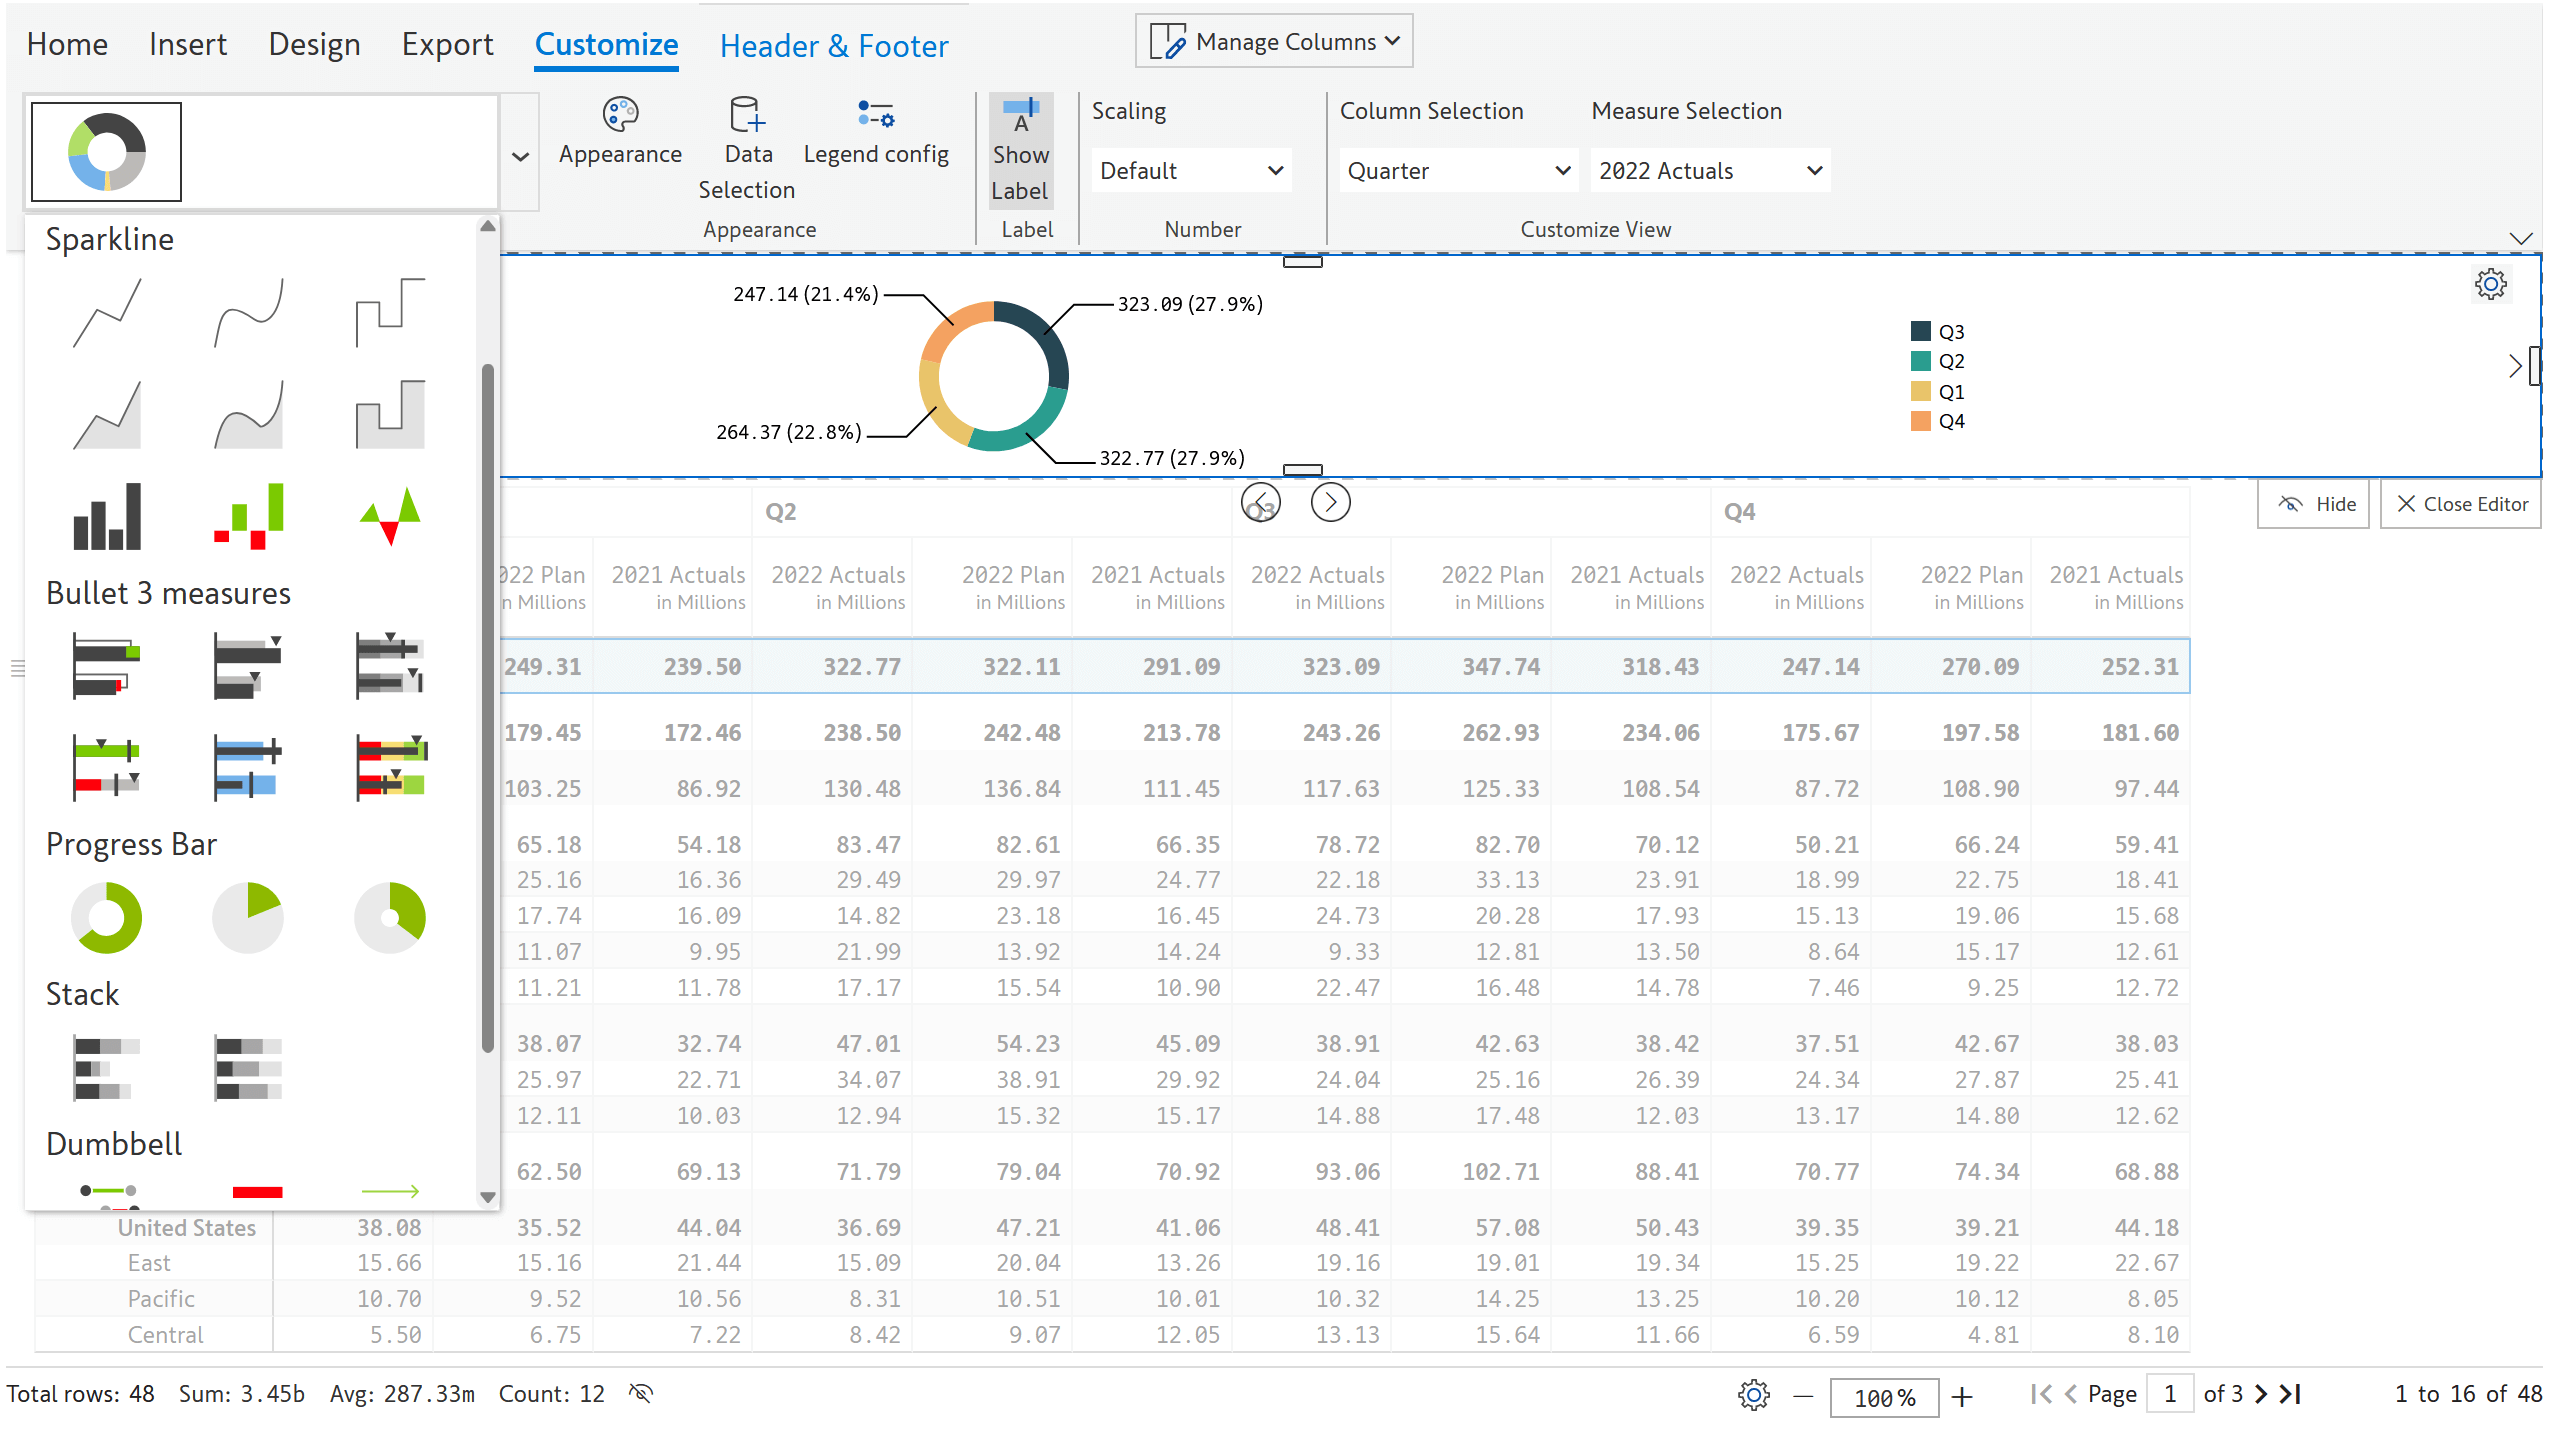
Customize tab now displays all the available chart types.
Legend configuration, number scaling, column and measure selection UI has been improved for better usability.
Navigation icons for KPI and header presets have been added.
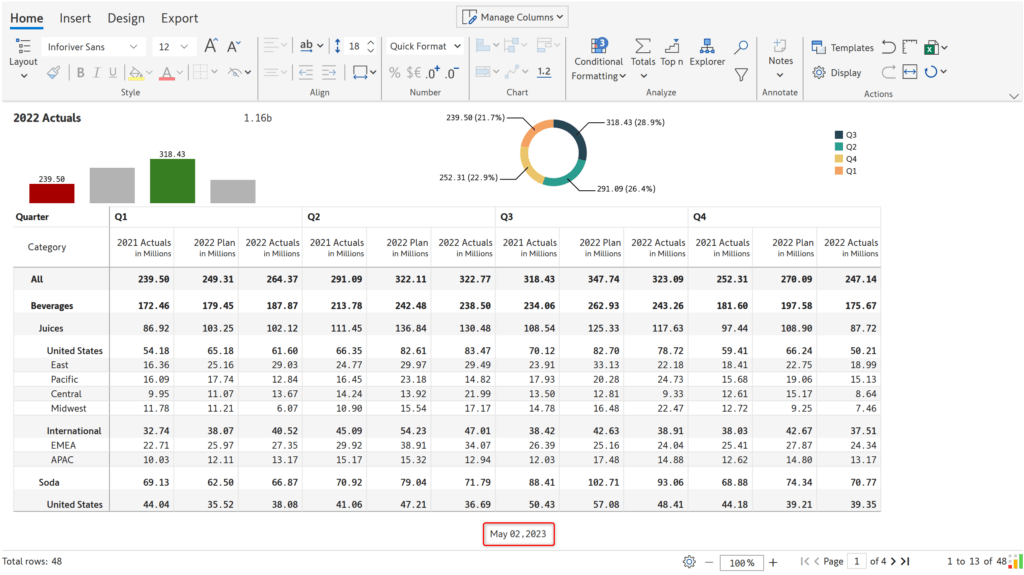
Footer displays current date when "Show footer" is enabled.
Option to flip colors for comparison band in header charts has been added.
Row values are considered by default for plotting charts.
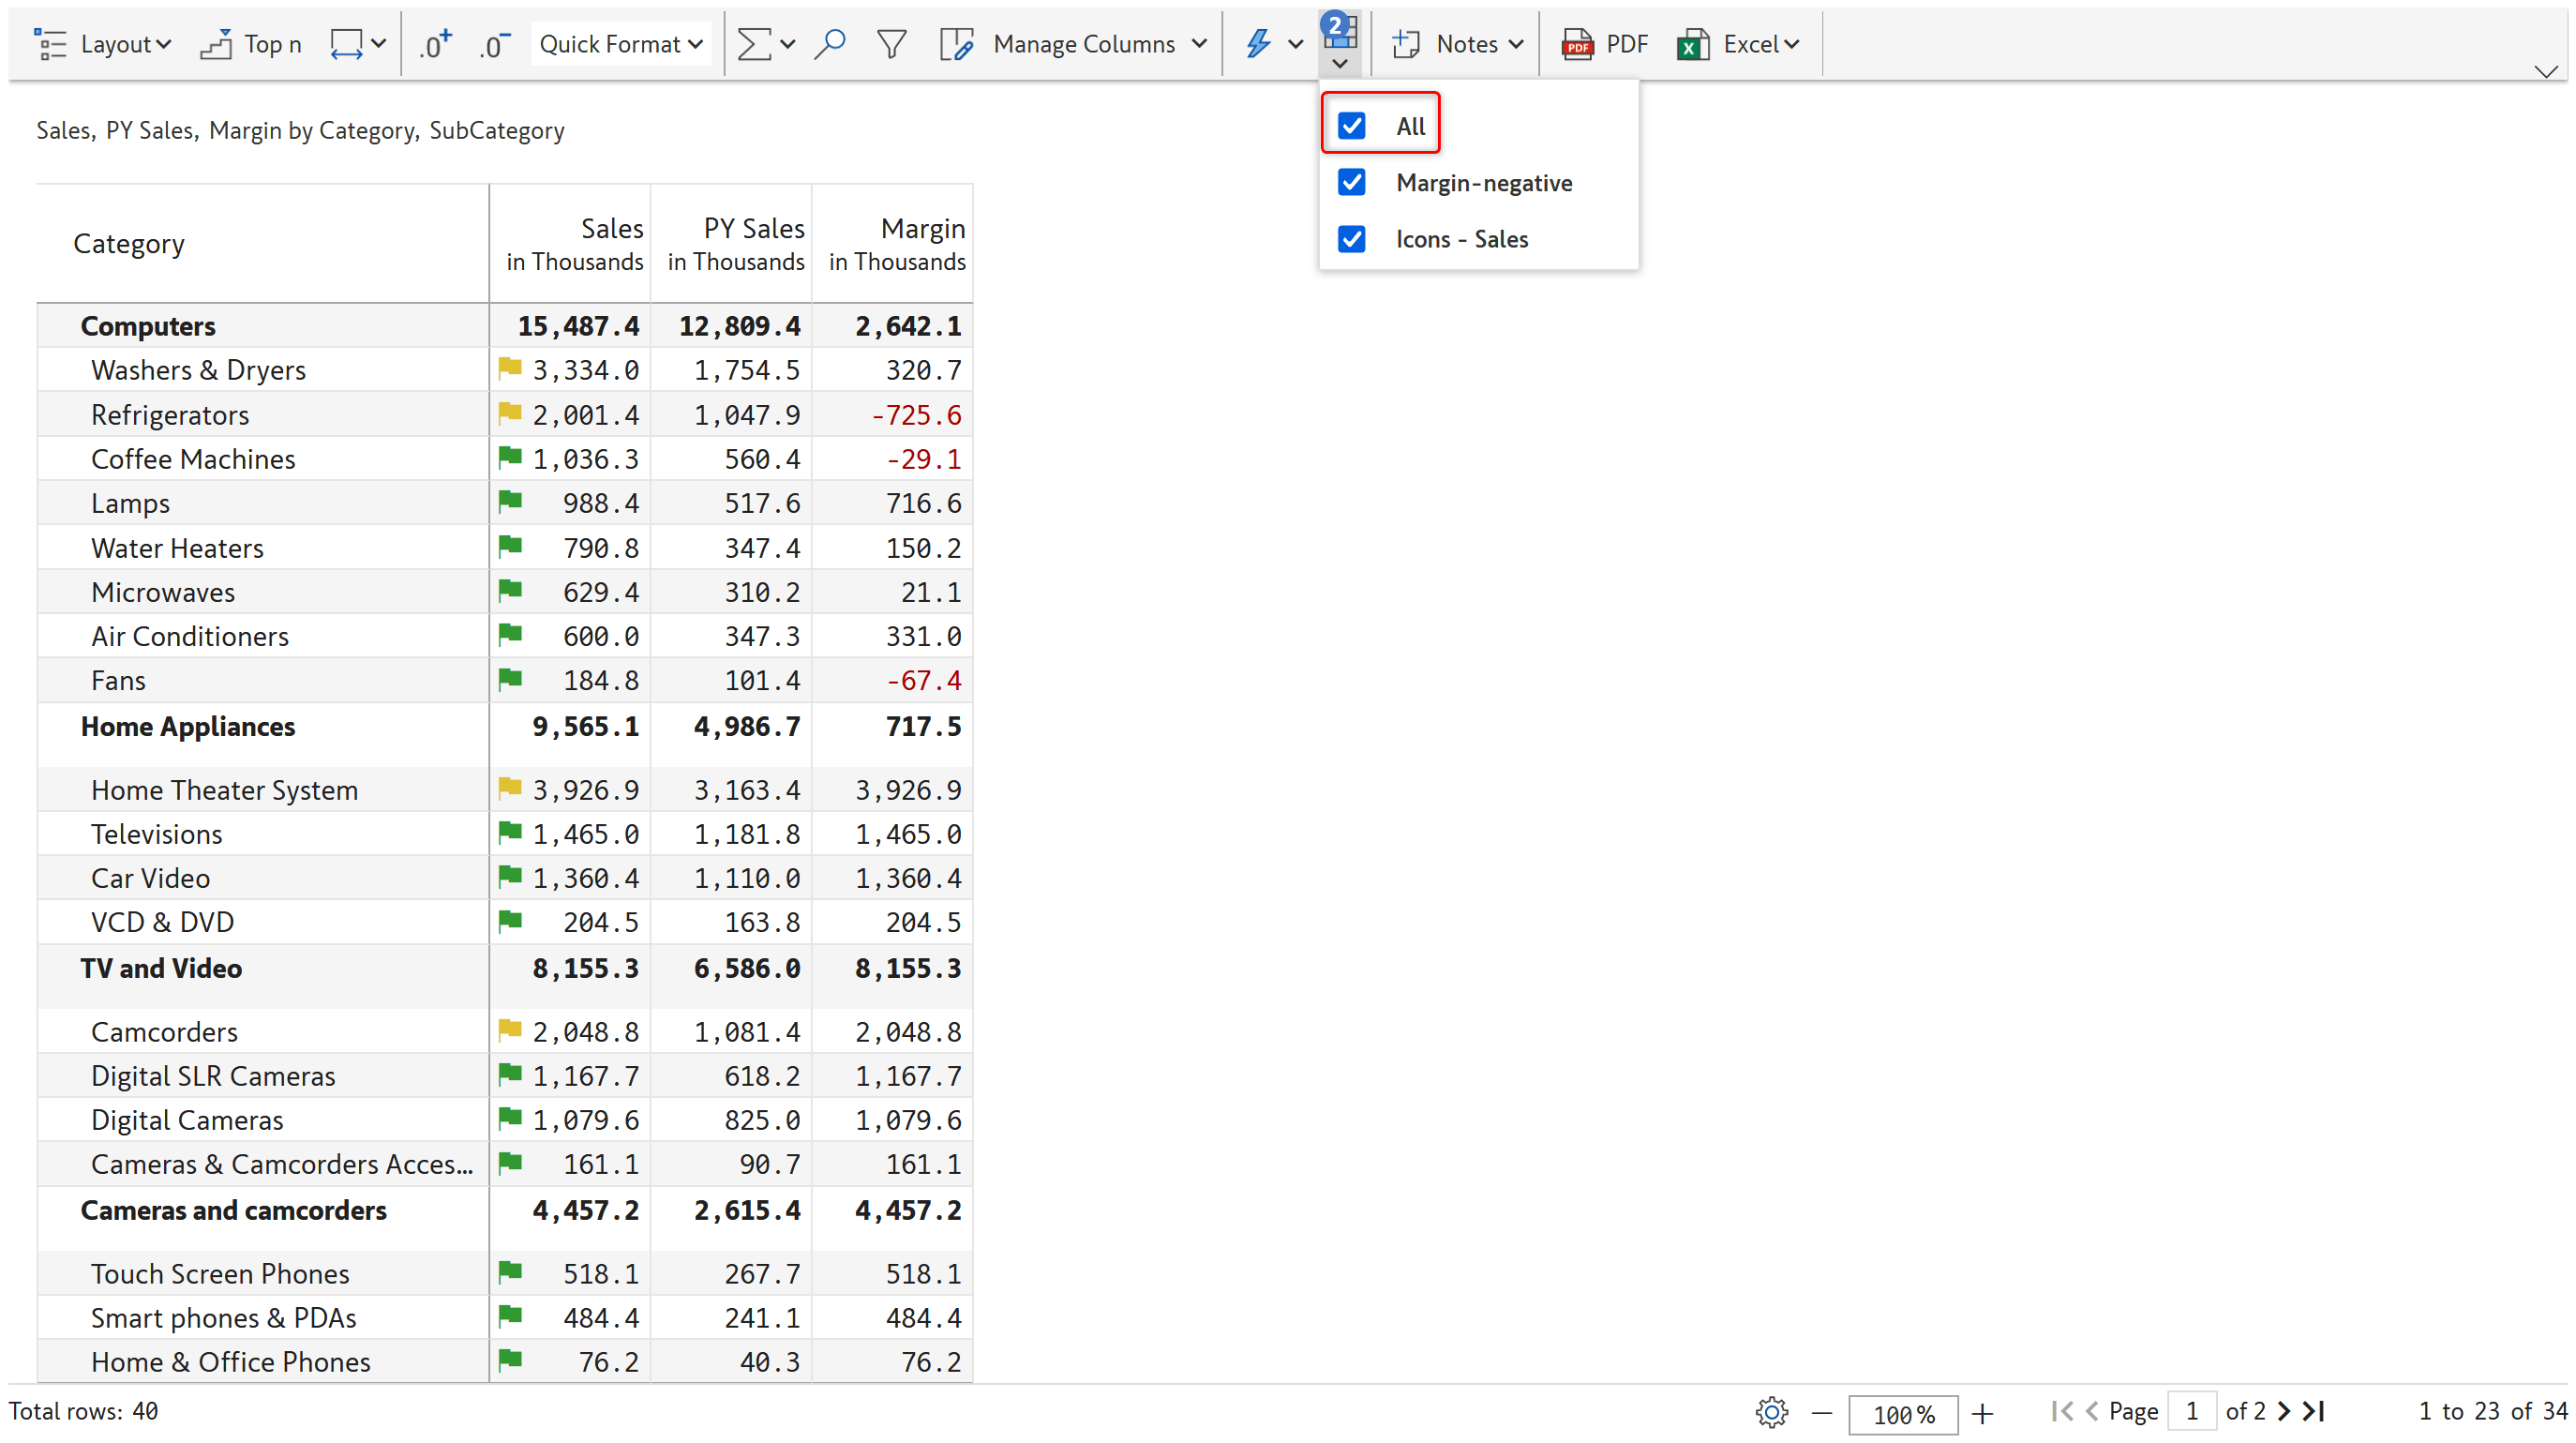
8. Conditional formatting
"All" option to enable/disable conditional formatting rules in reading view has been introduced.
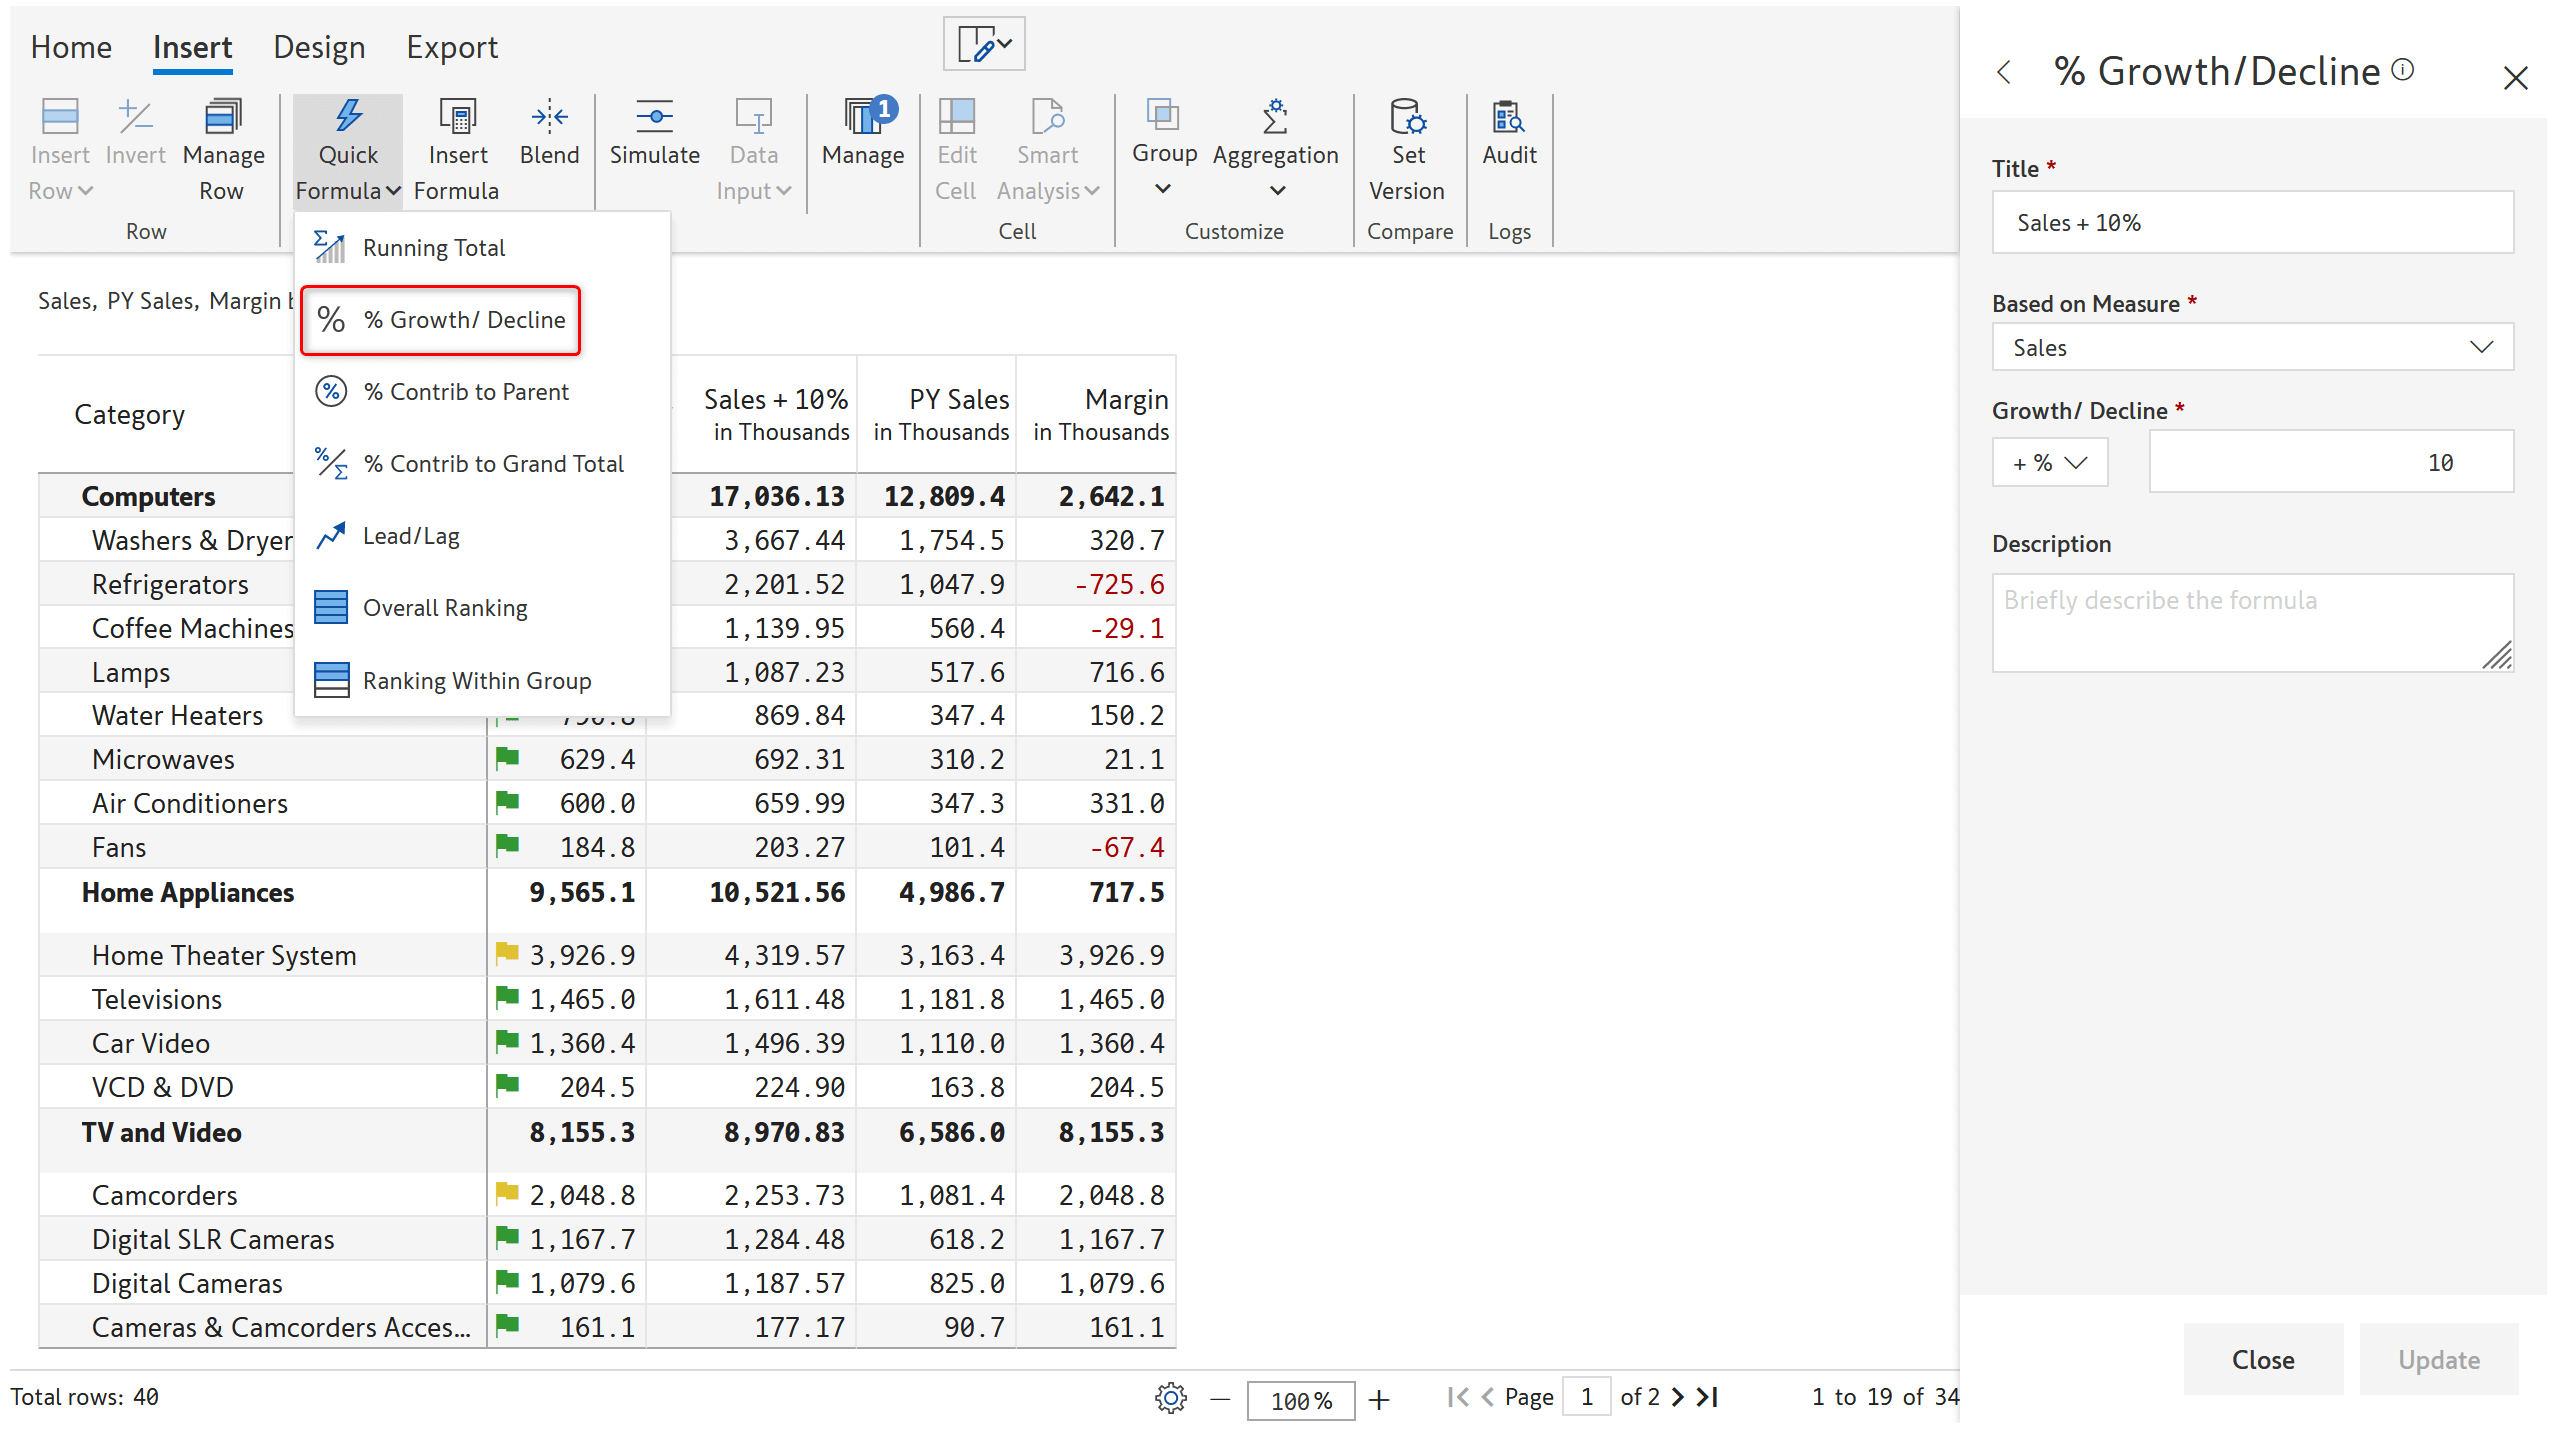
9. Formulas & functions
% growth/decline has been added in Quick formulas.
ROW.LABEL option has been added in Insert Measure formula bar.
New functions have been introduced:
Math – ODD, EVEN, INDEXOF
Text – CLEAN, UPPER, LOWER, PROPER, TRIM, REPLACE, REPT
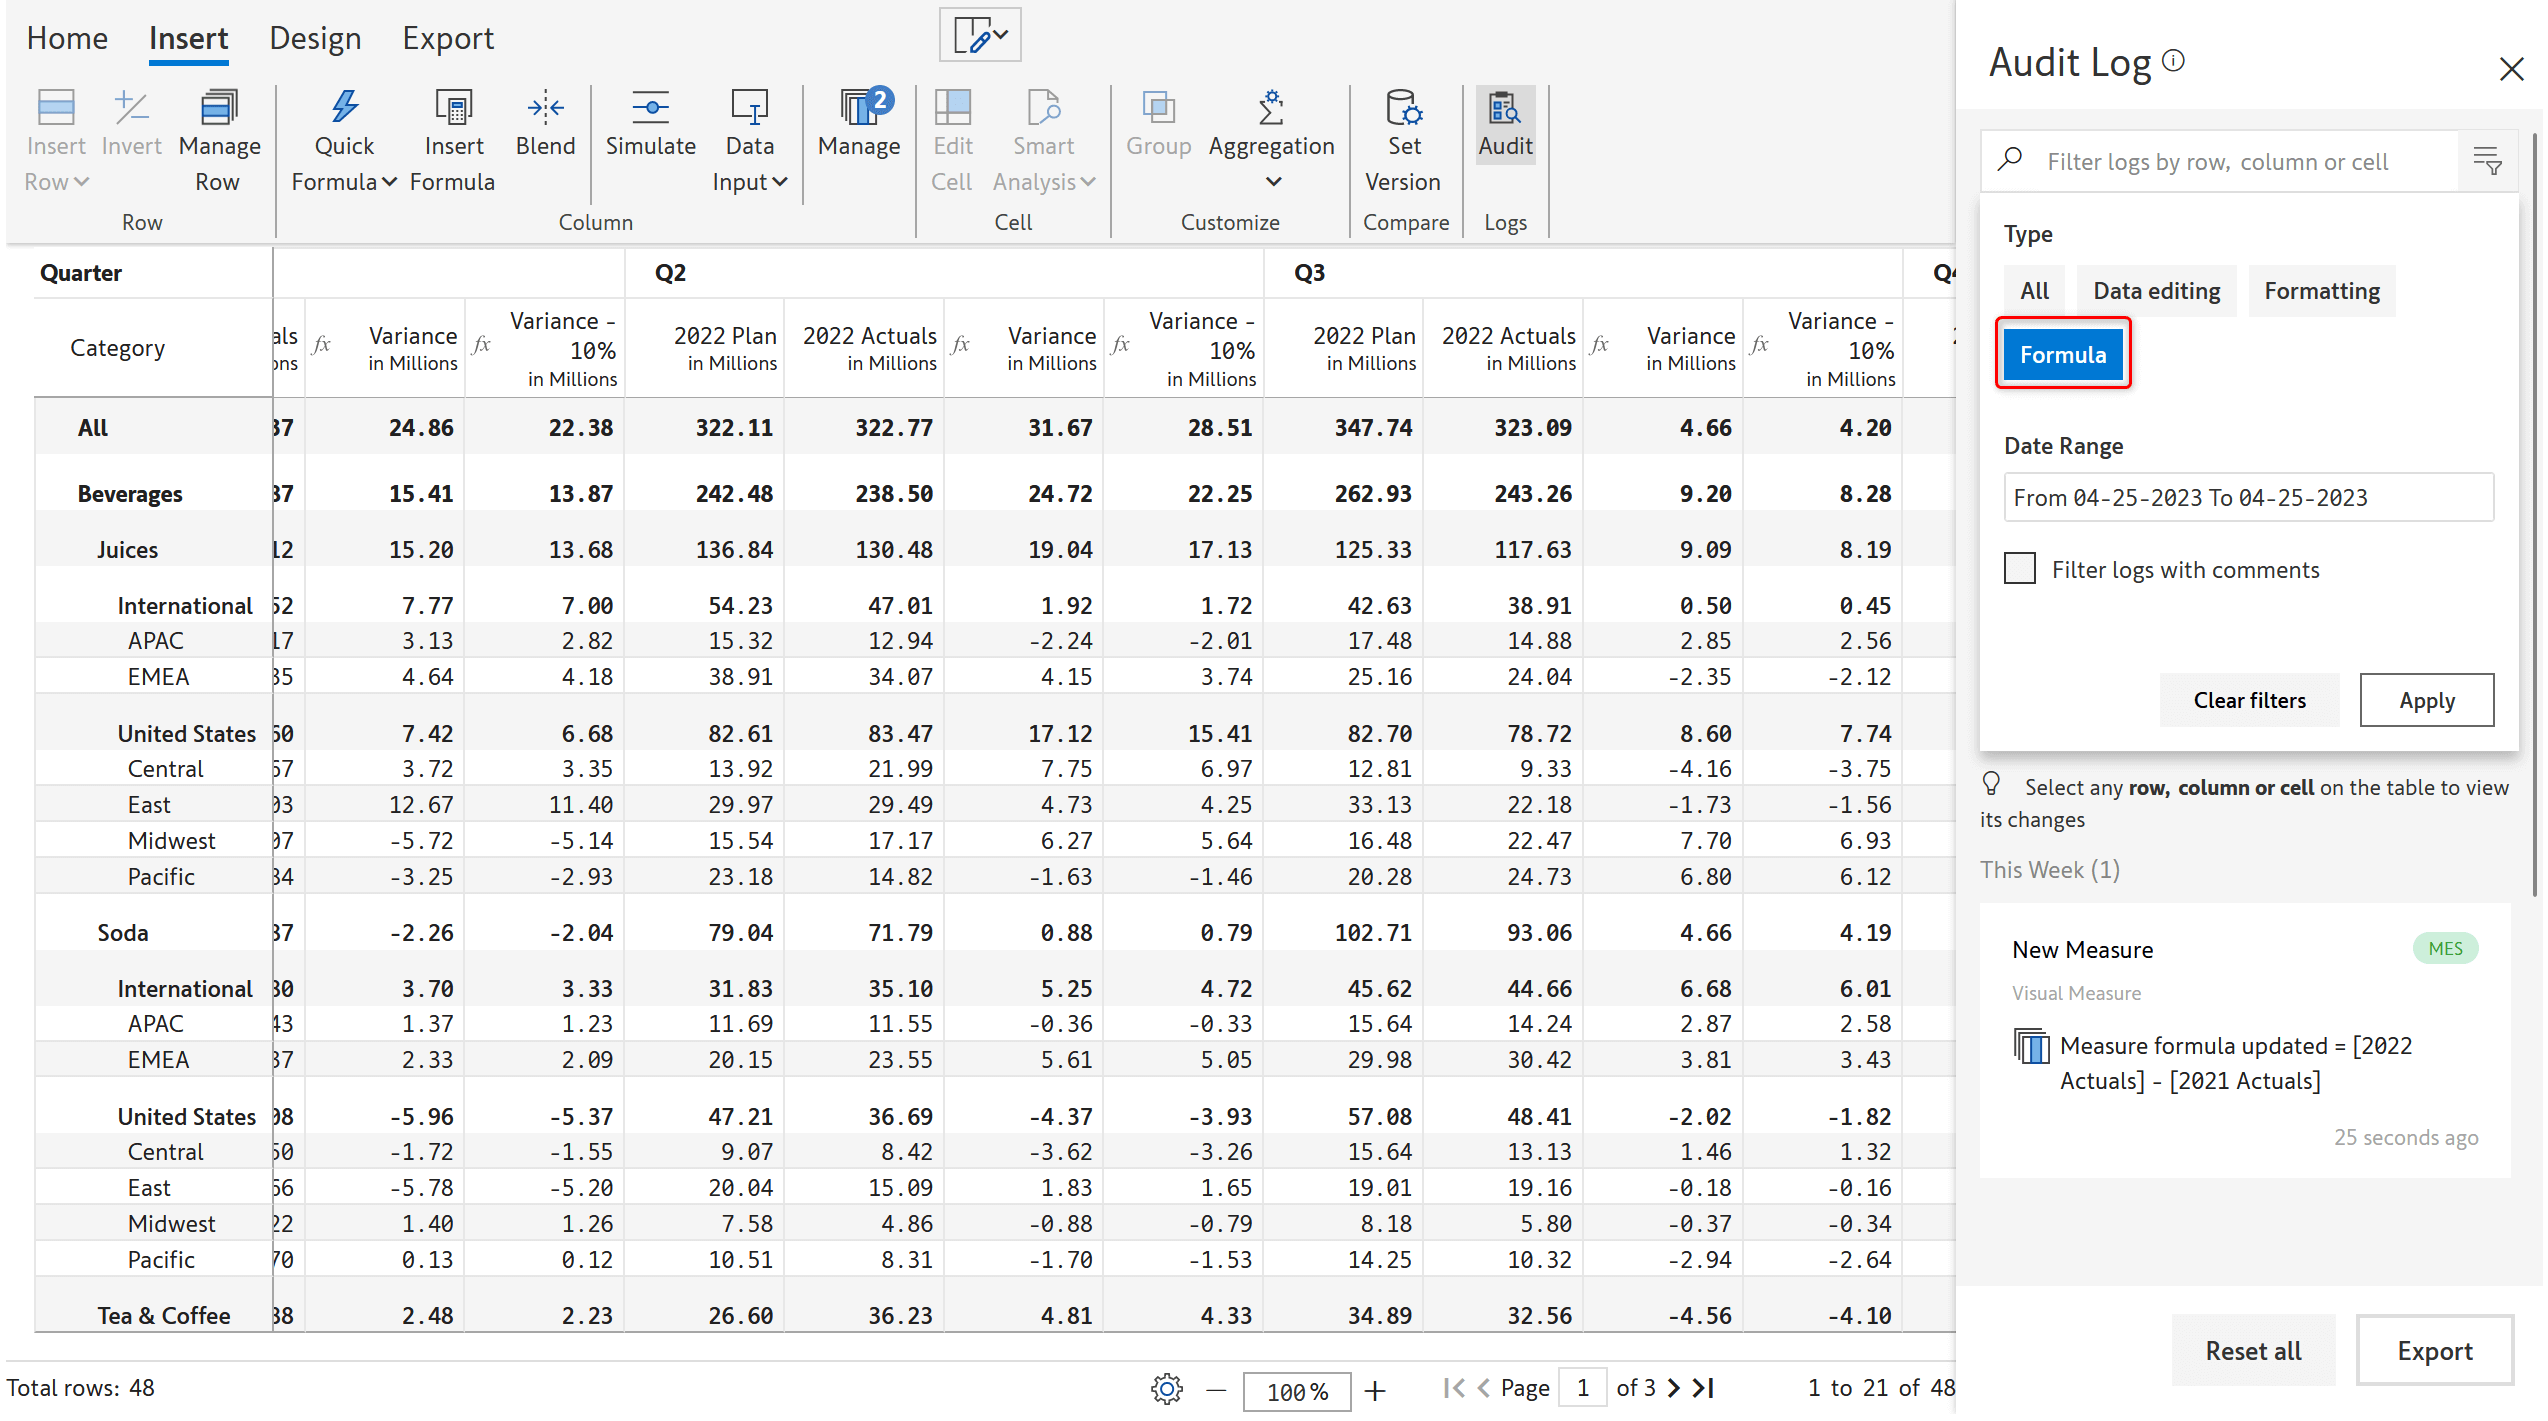
Formula tab has been added which lists all formulas defined in the visual.
11. Quick access
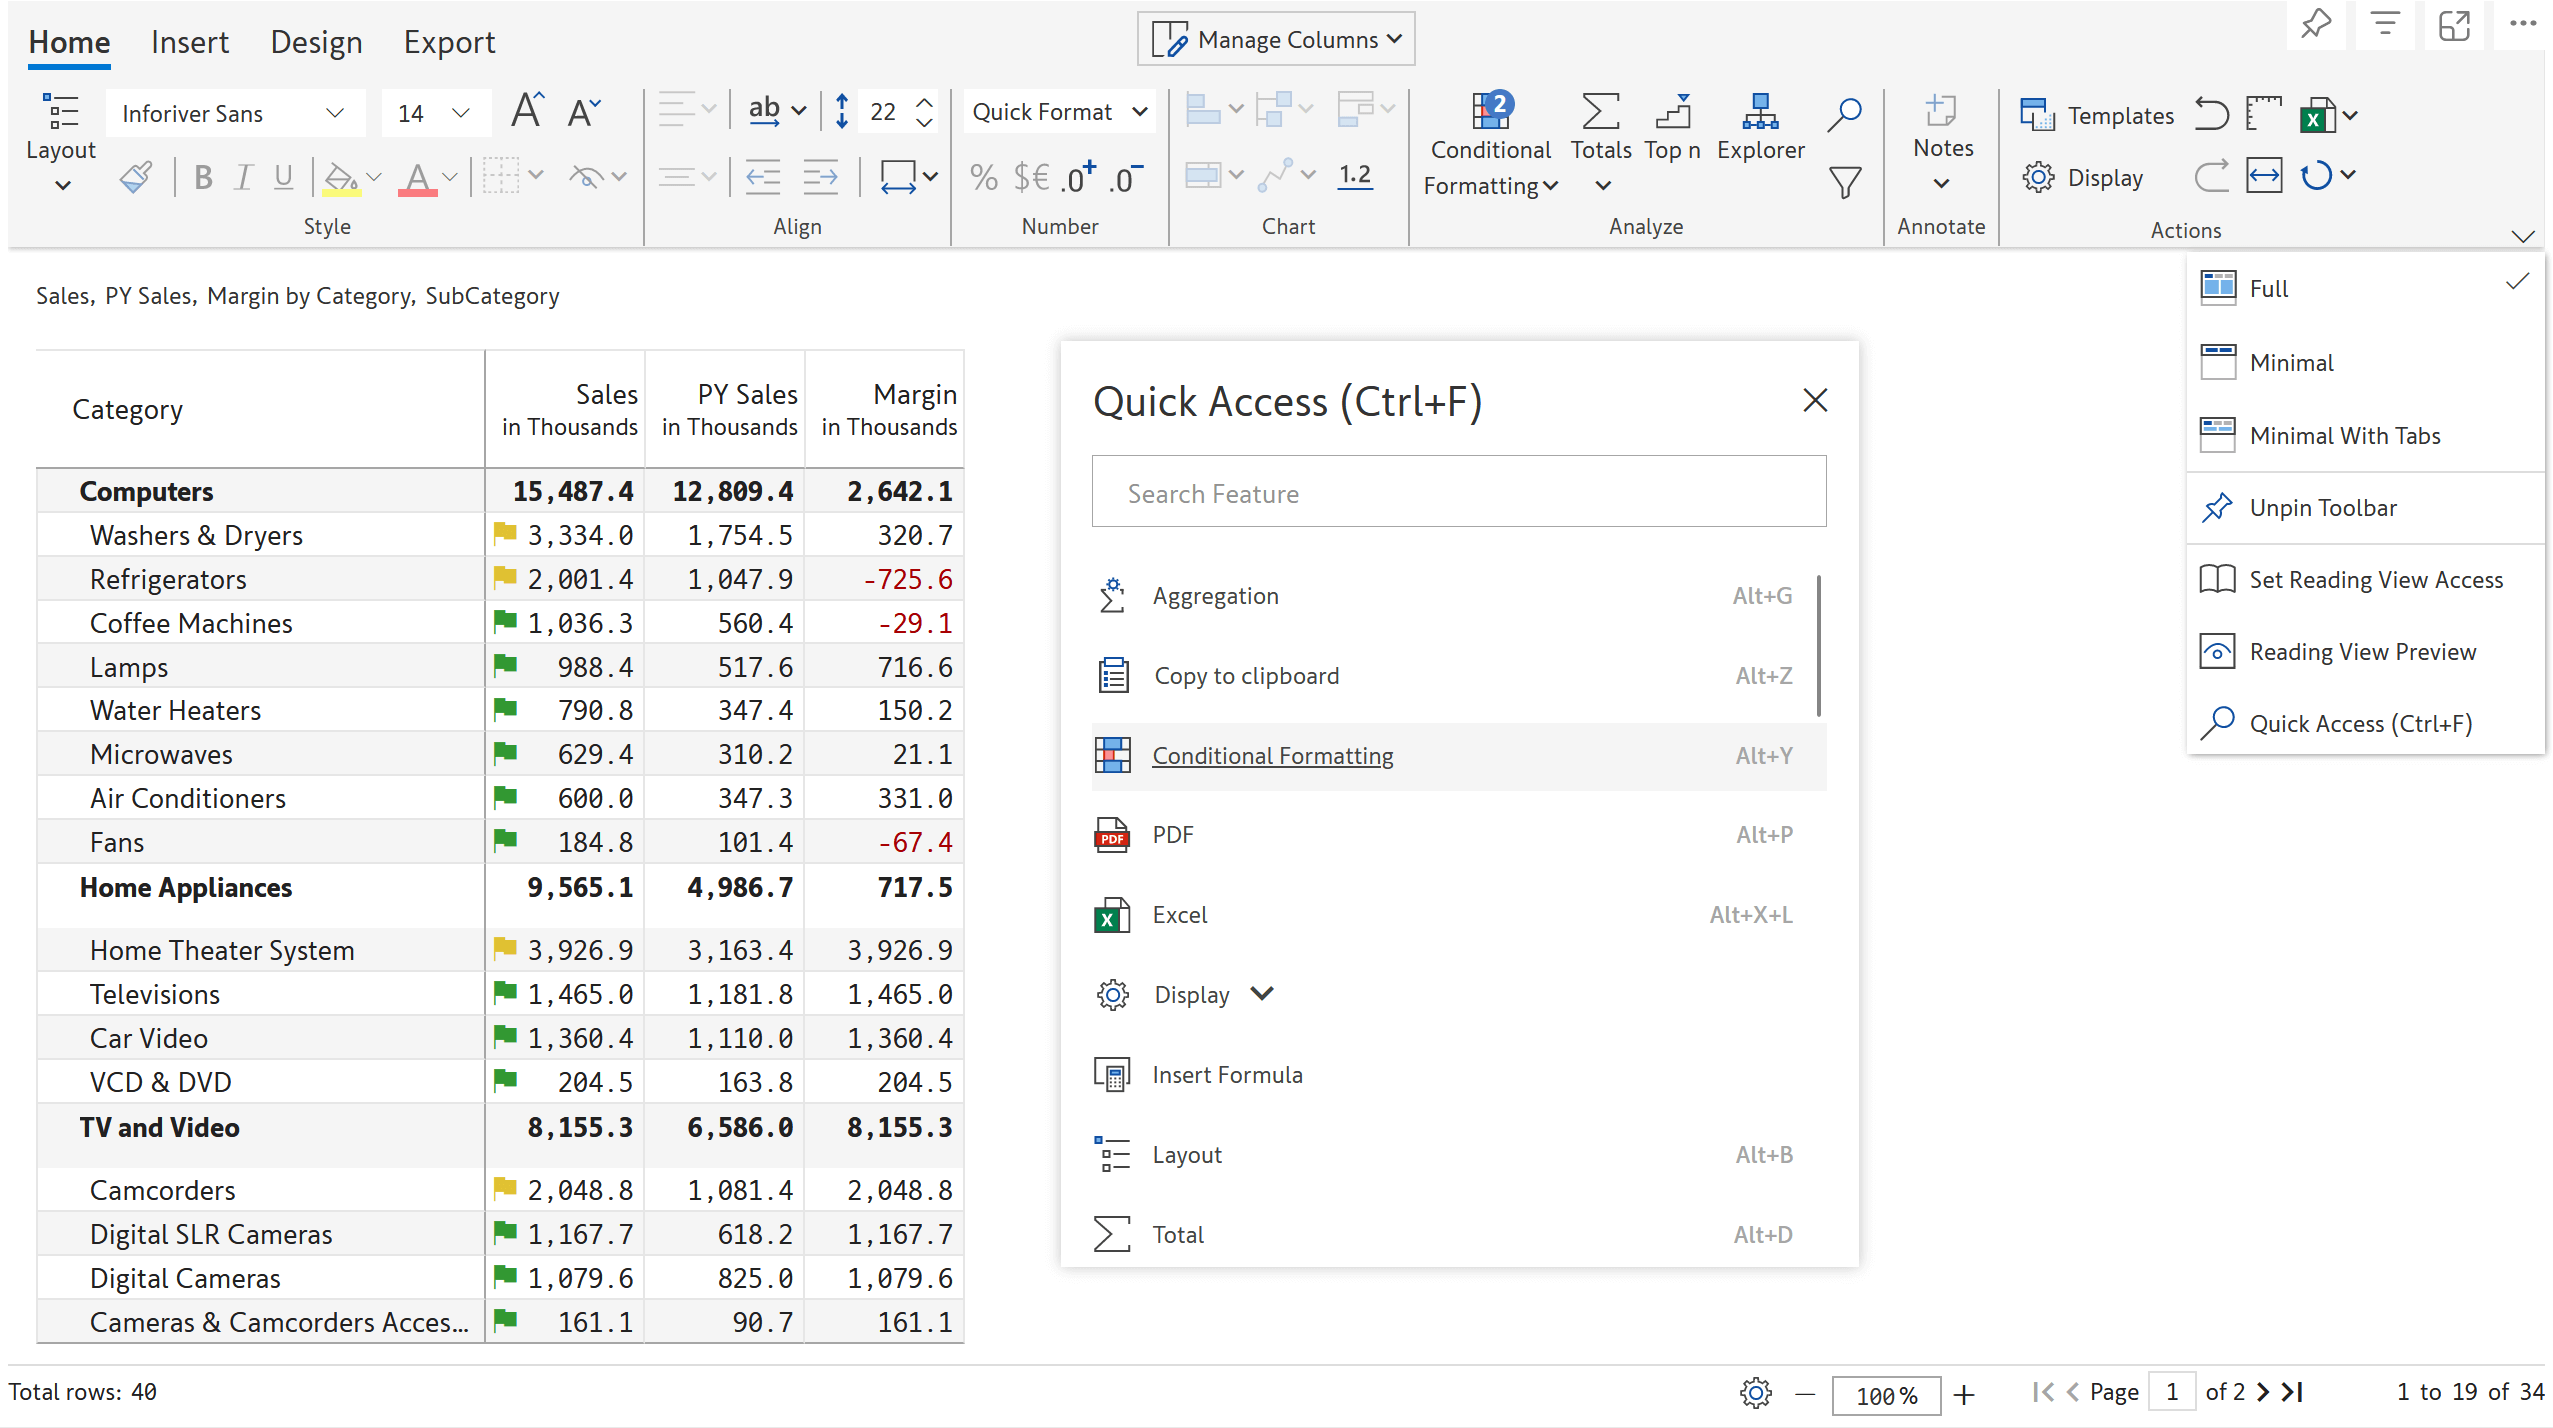
Additional list of features have been added to quick access.
Search based on tags for quick access has been improved.
On searching for options in display tab, the corresponding tab opens and the property is highlighted.
12. Set version
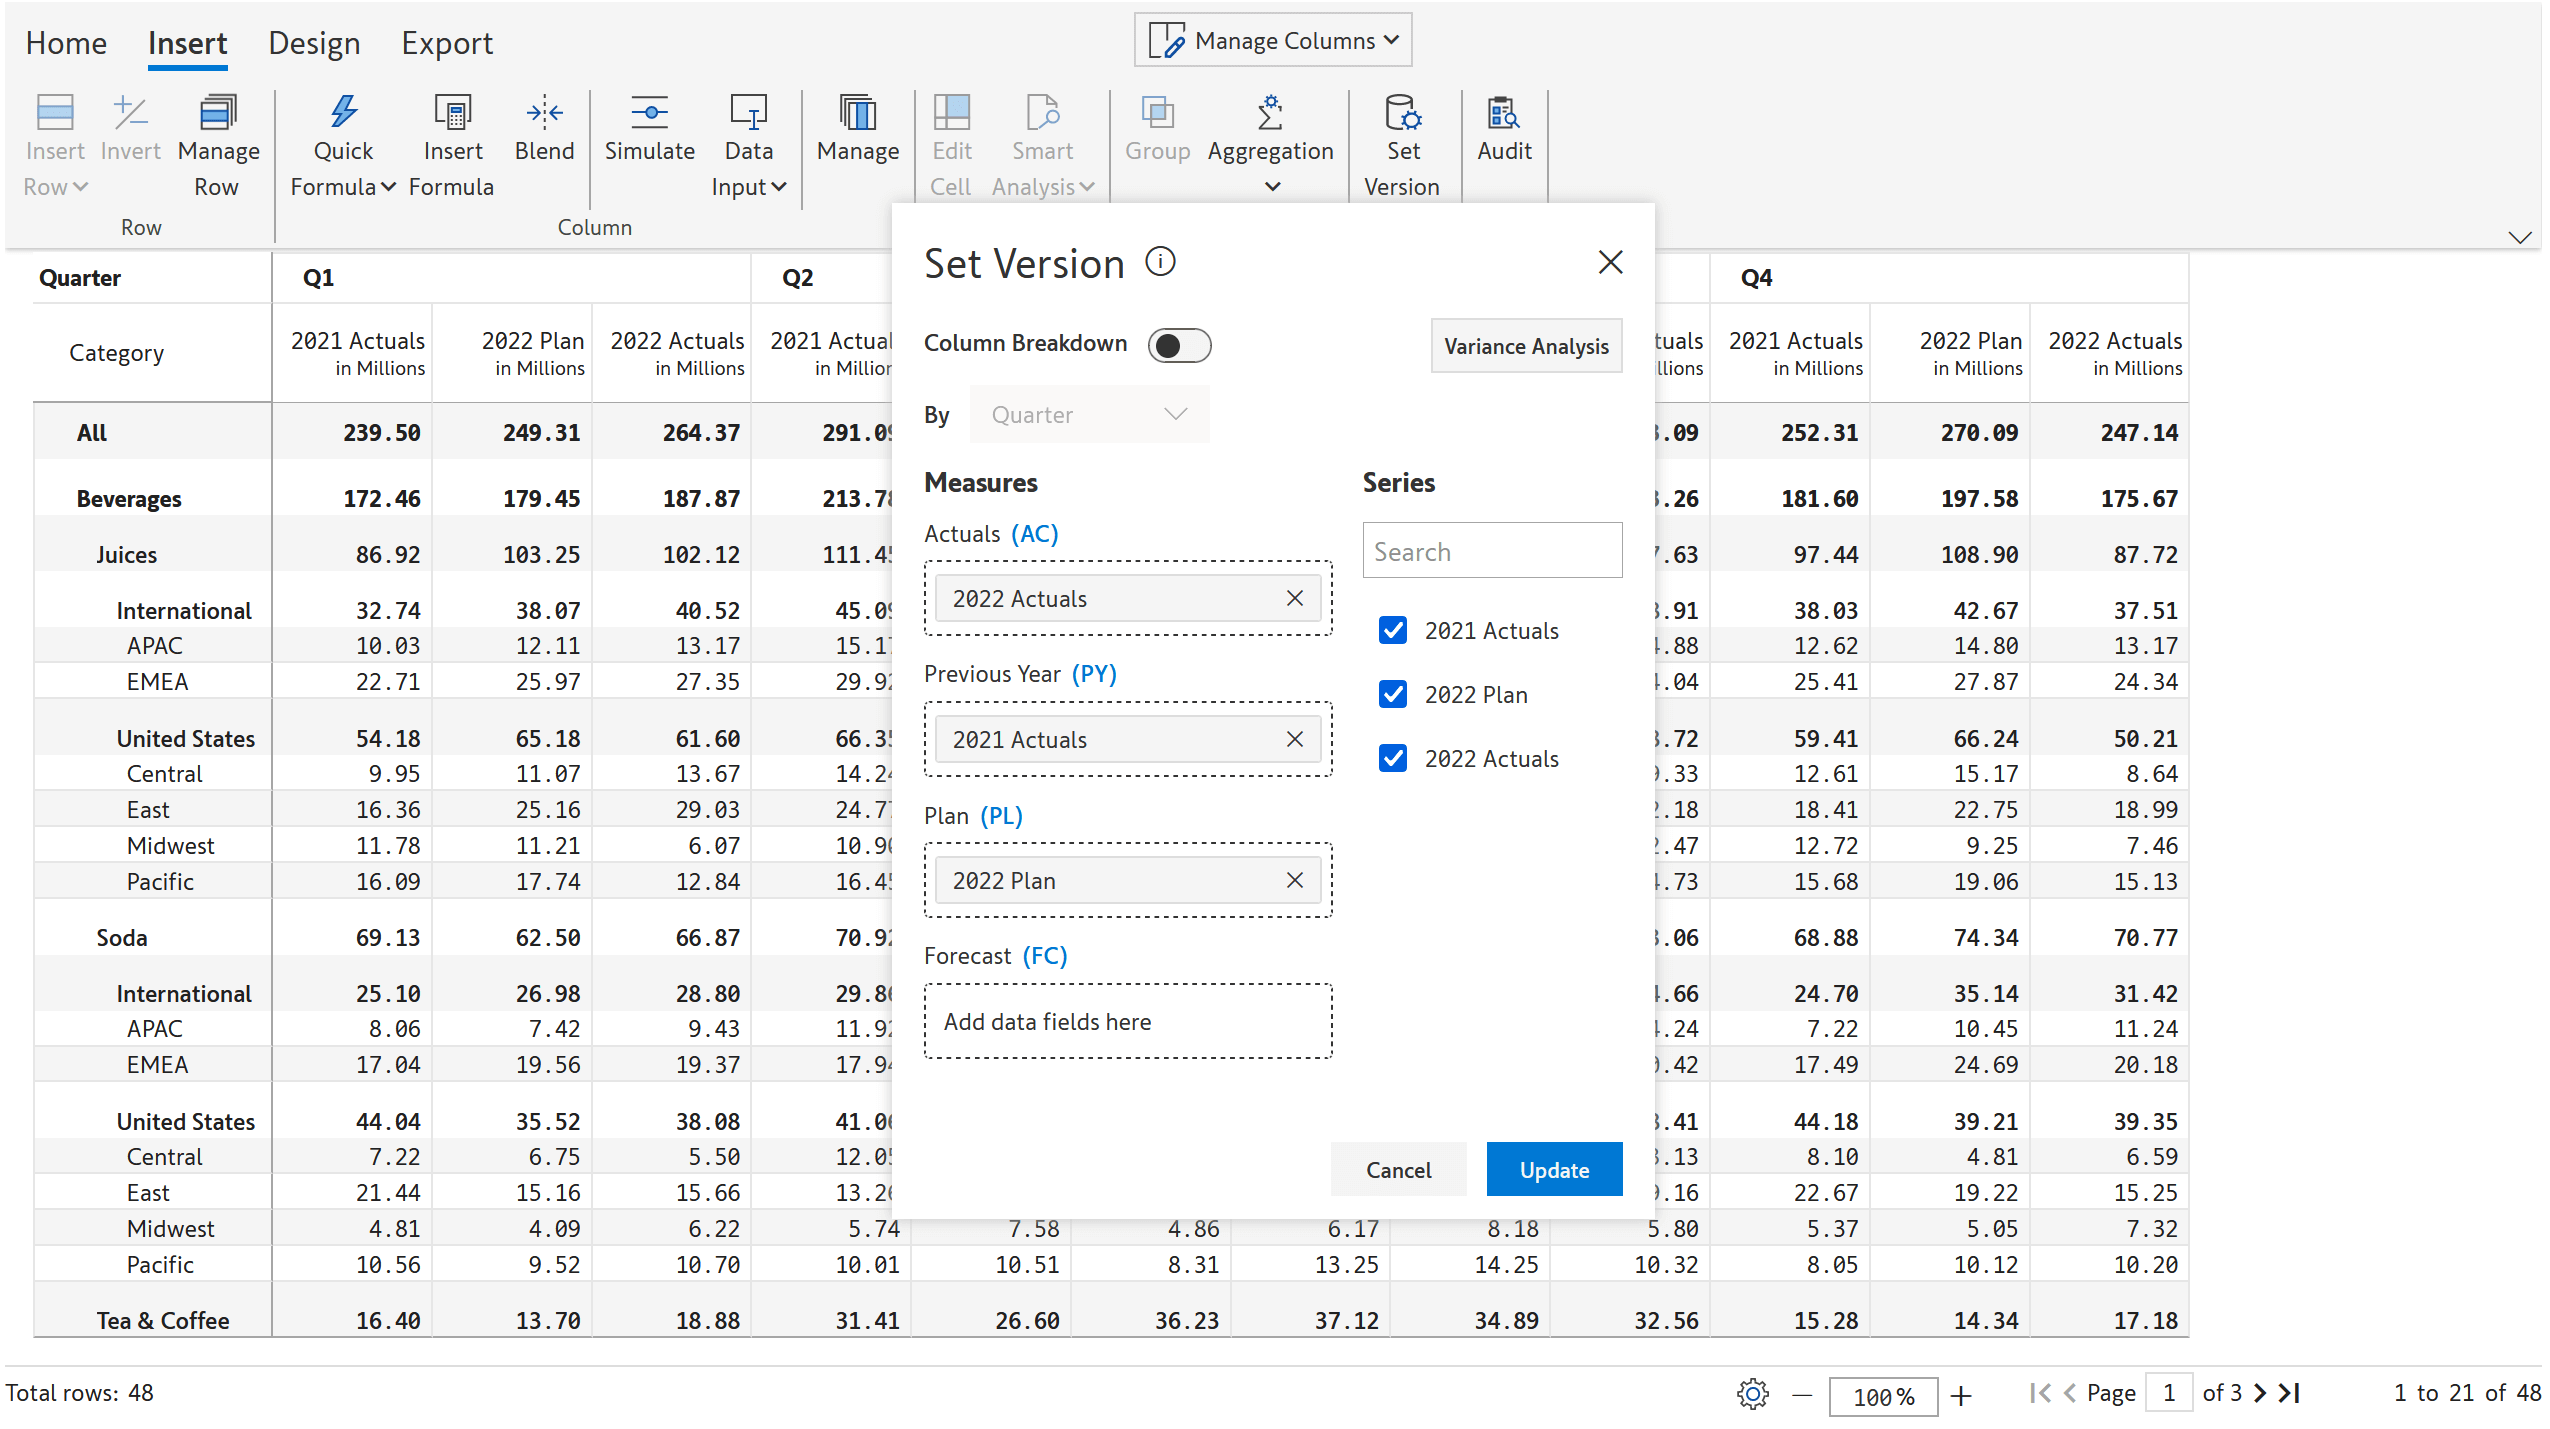
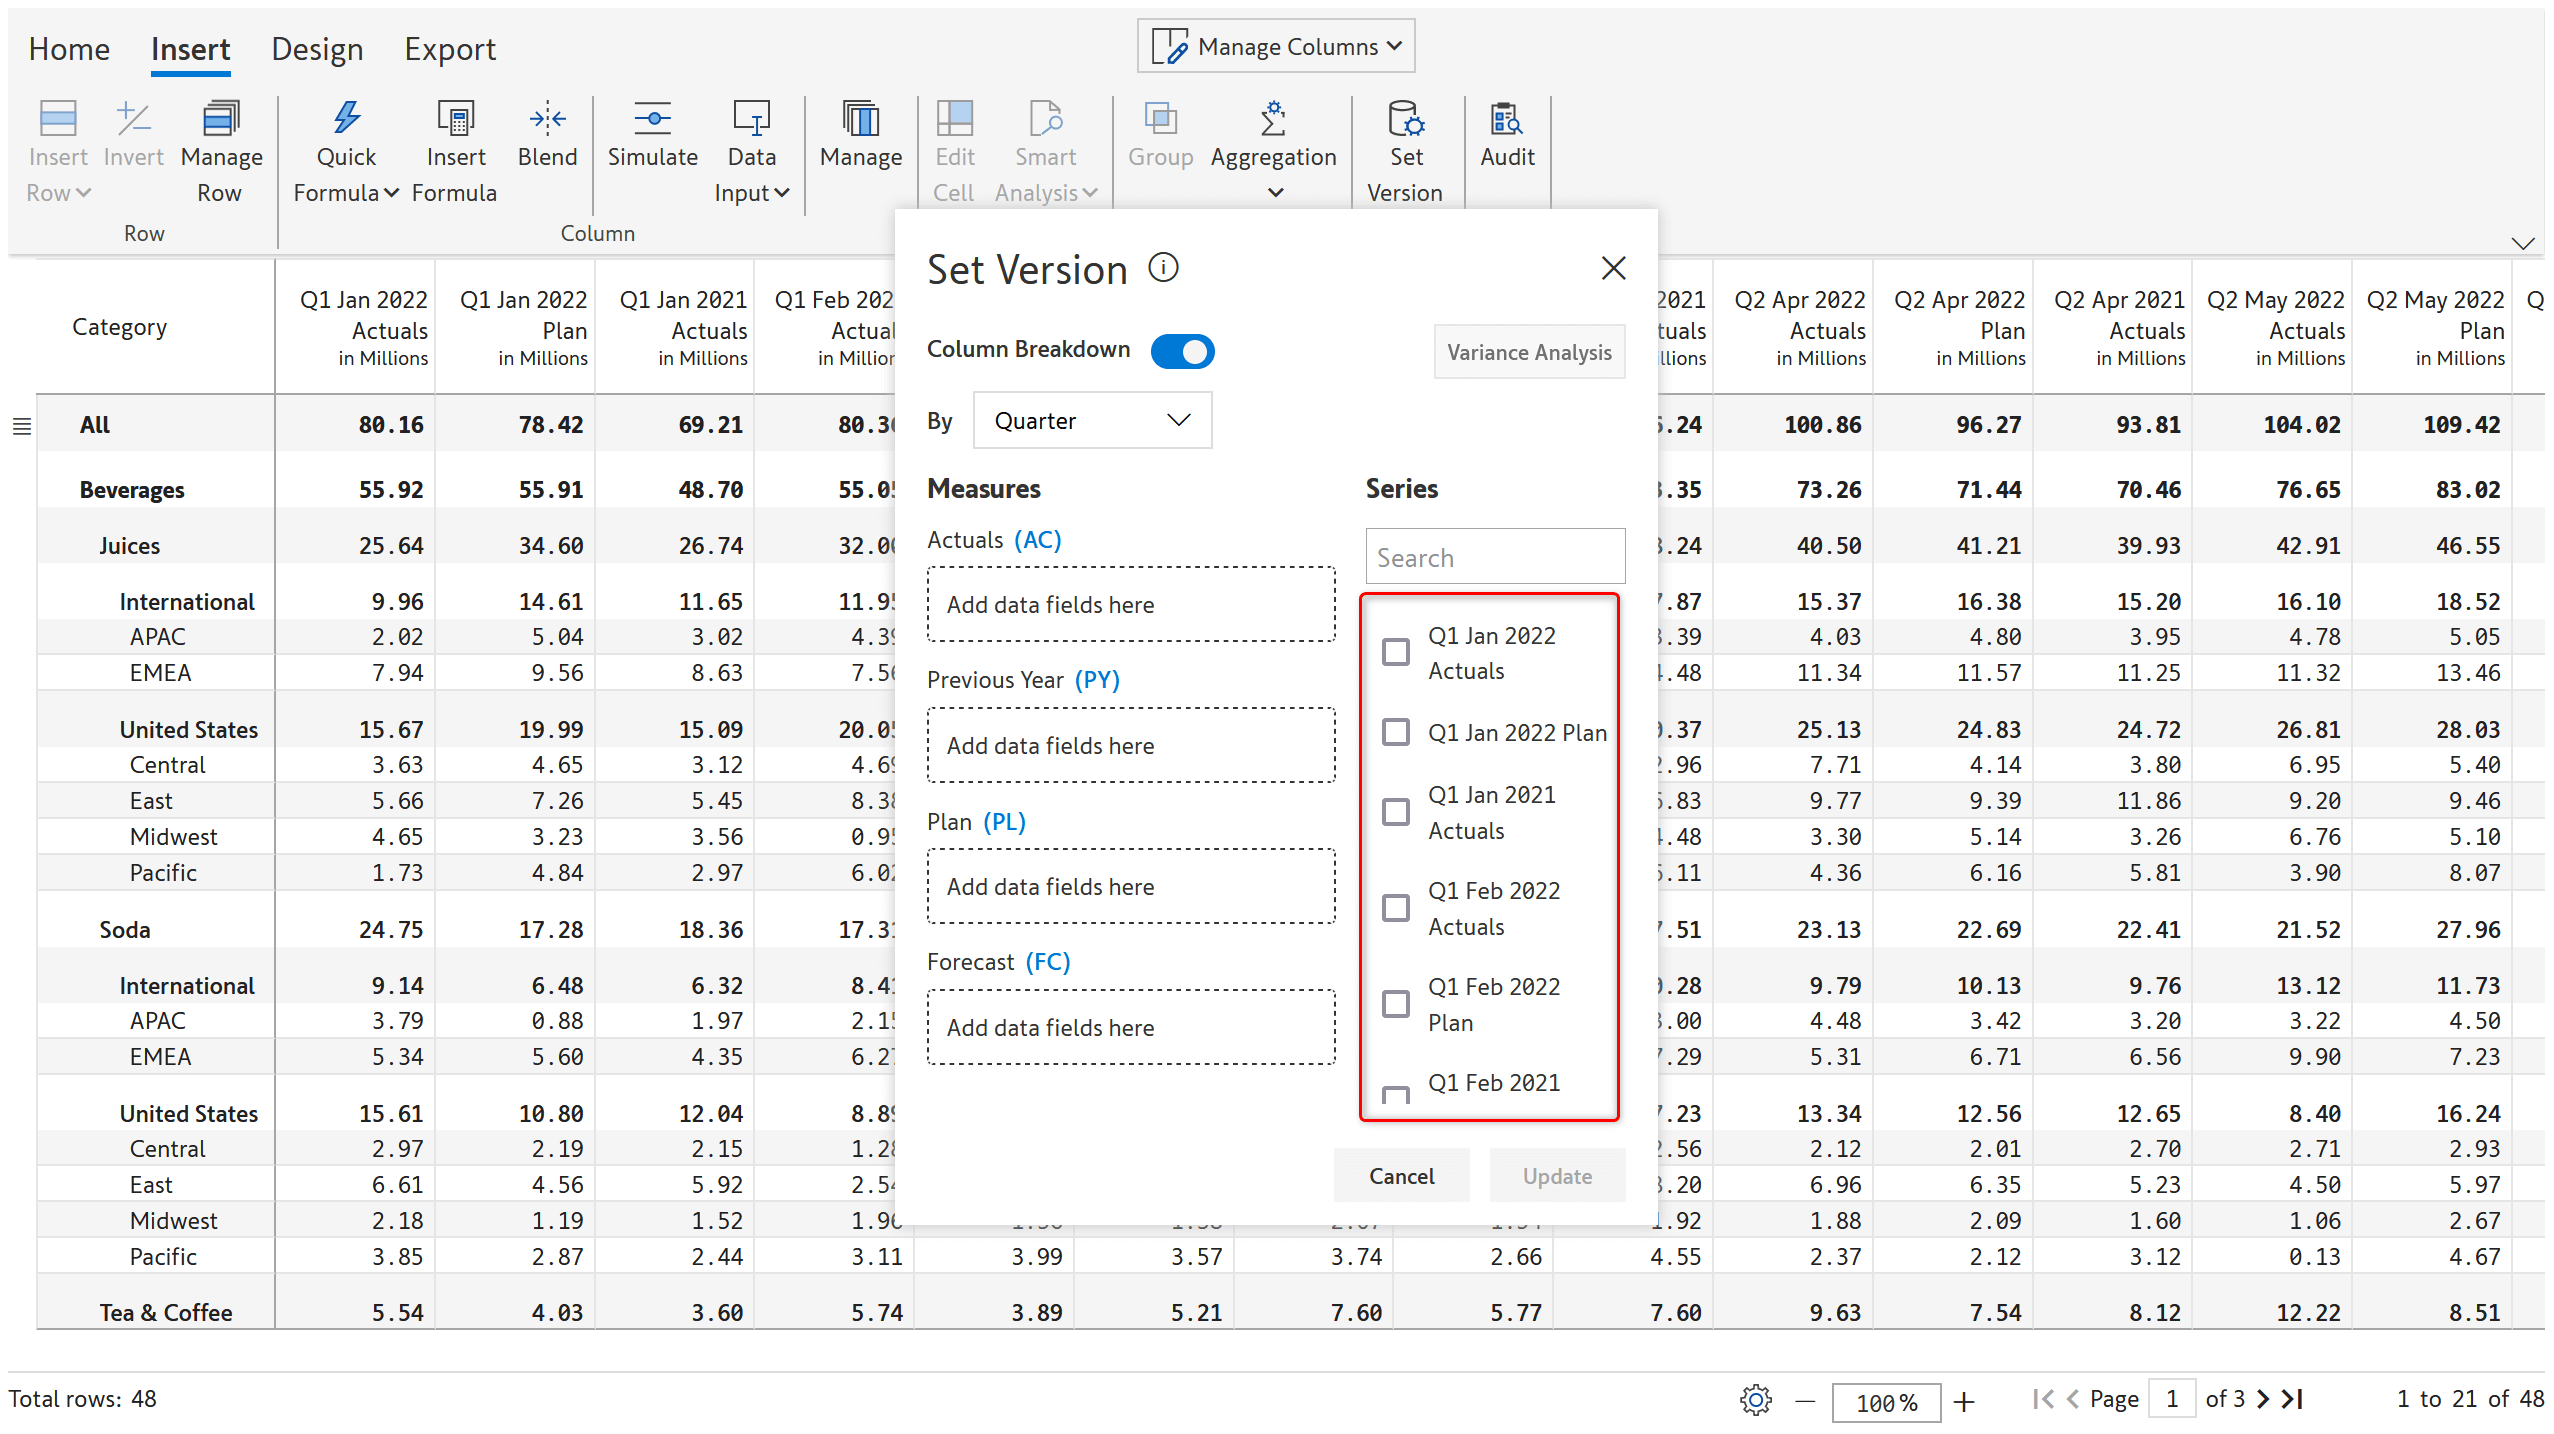
Option to break down measures by column has been introduced.
Columns created by breaking down measures can be used as AC, PY, PL or FC.
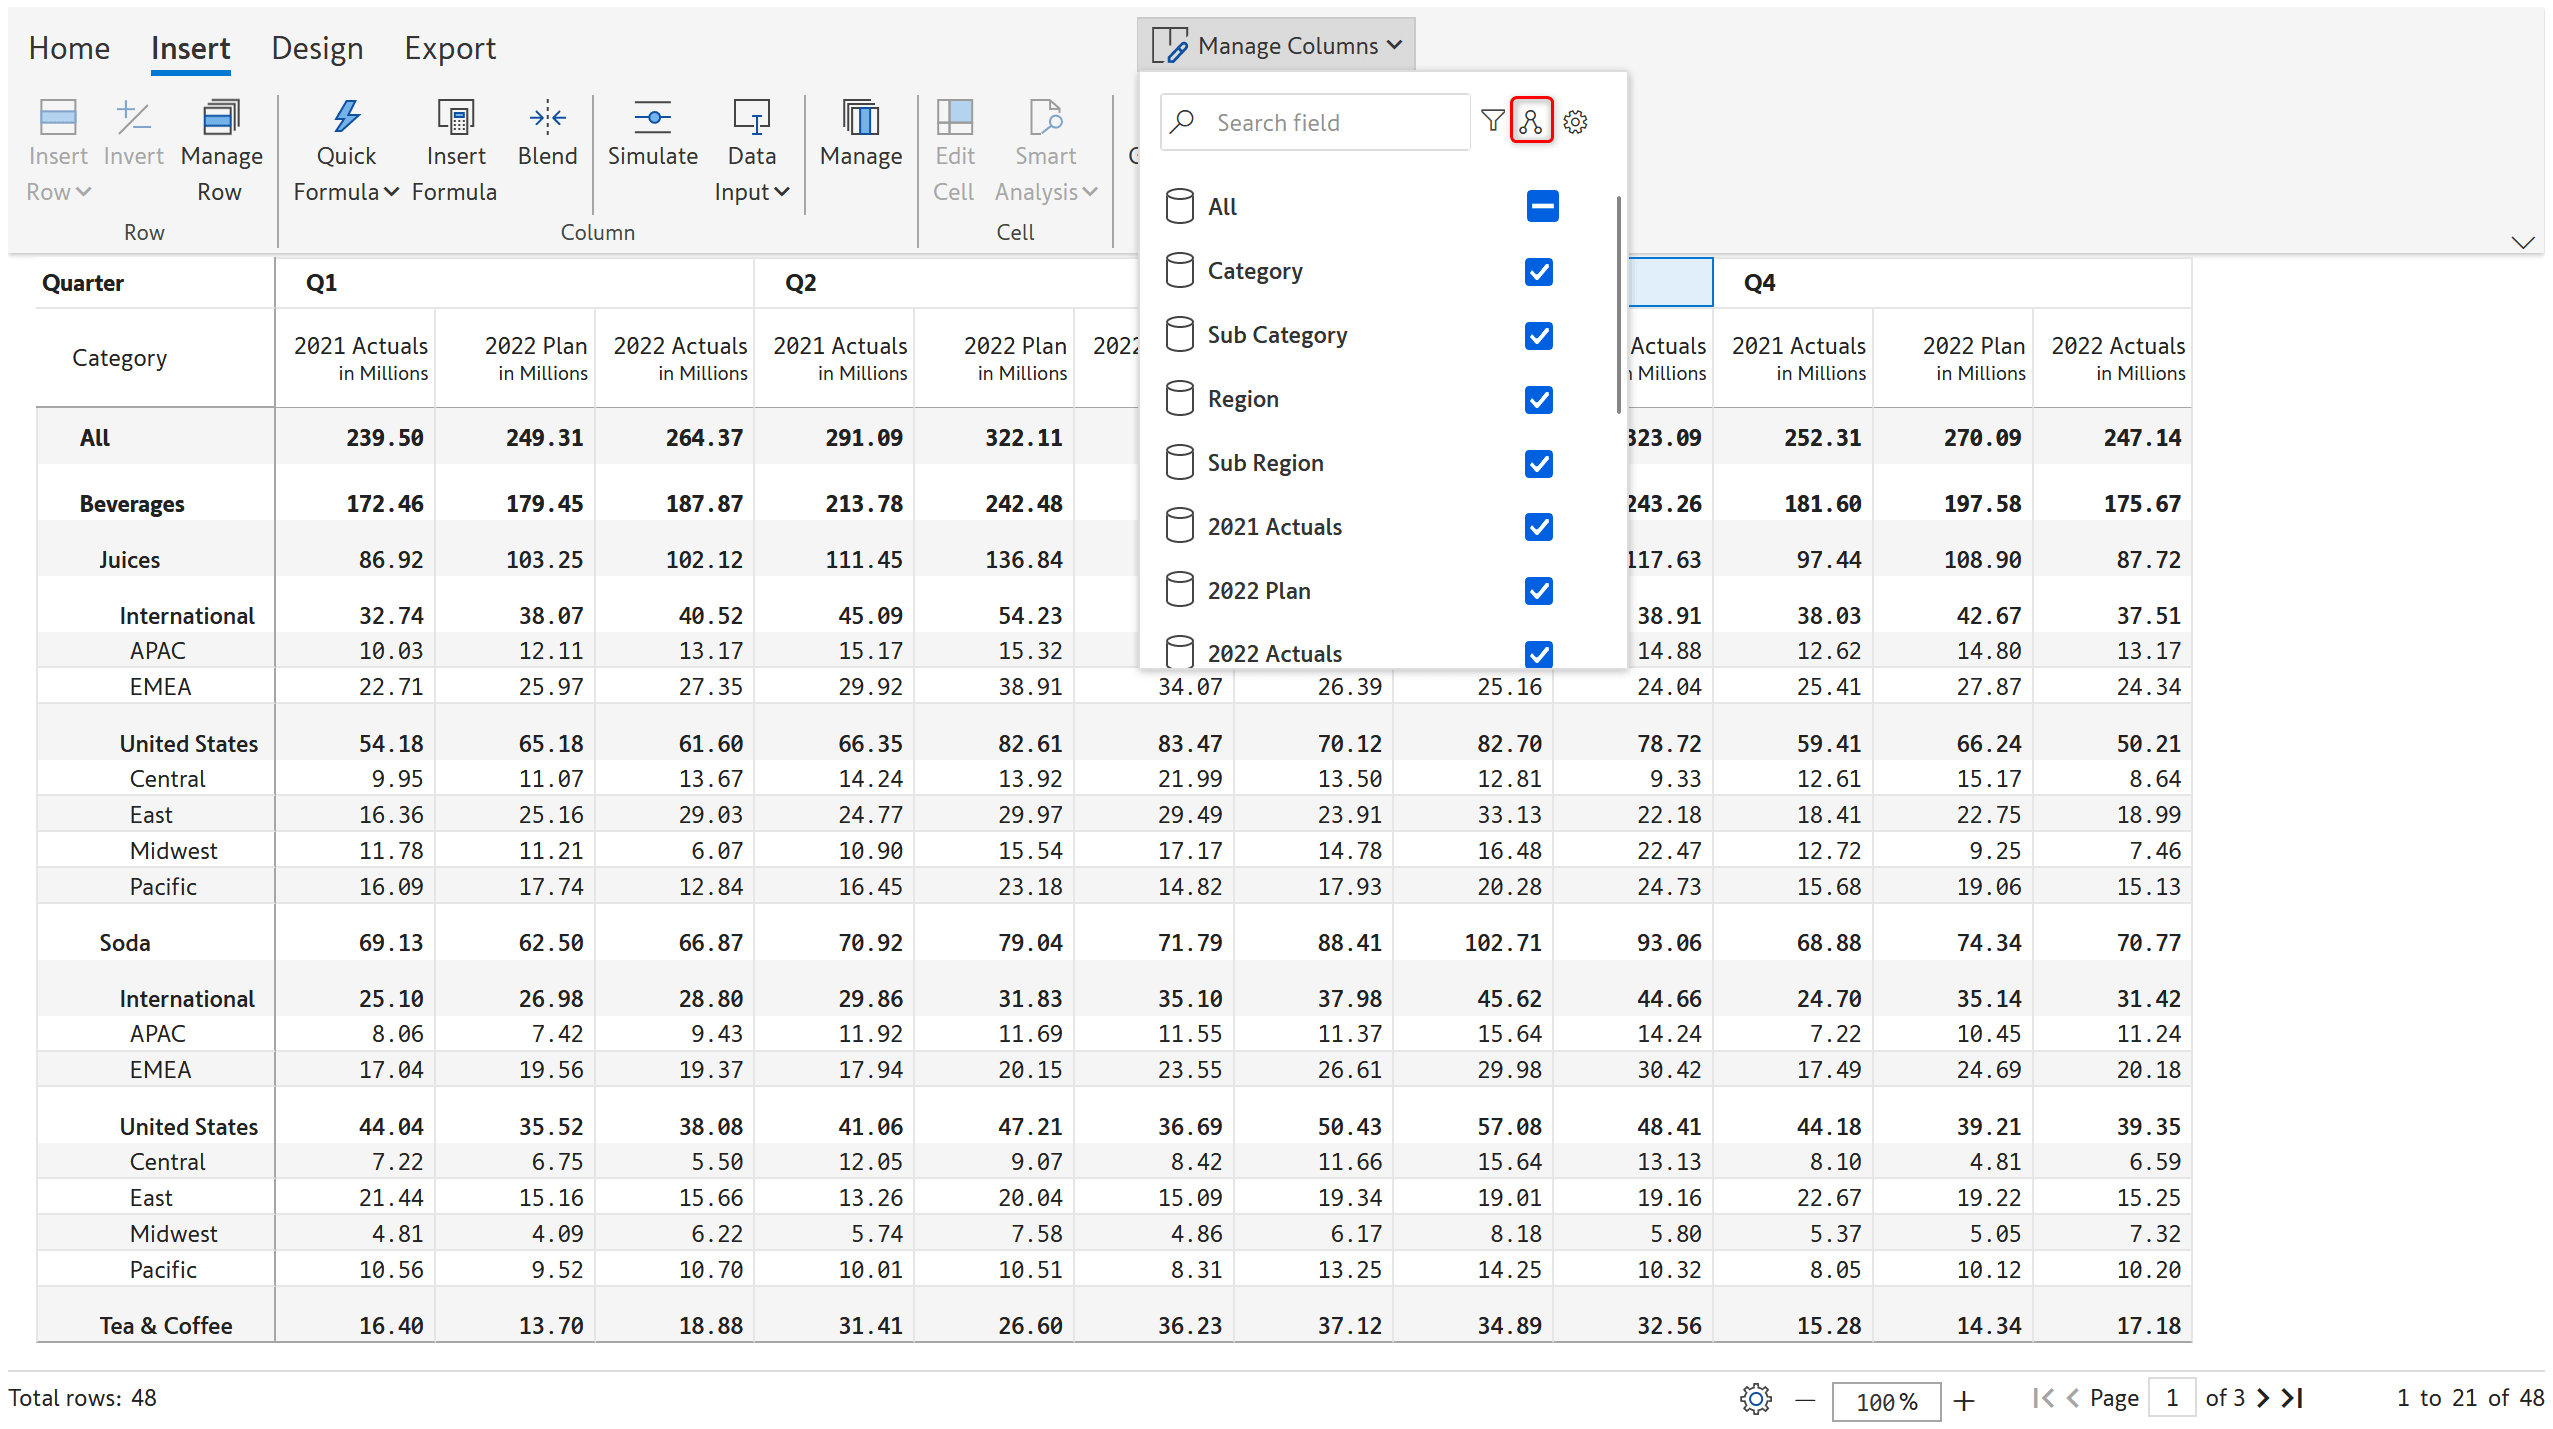
13. Column as measure
Set column as measure icon has been added between filter and settings icon in the manage columns dropdown.
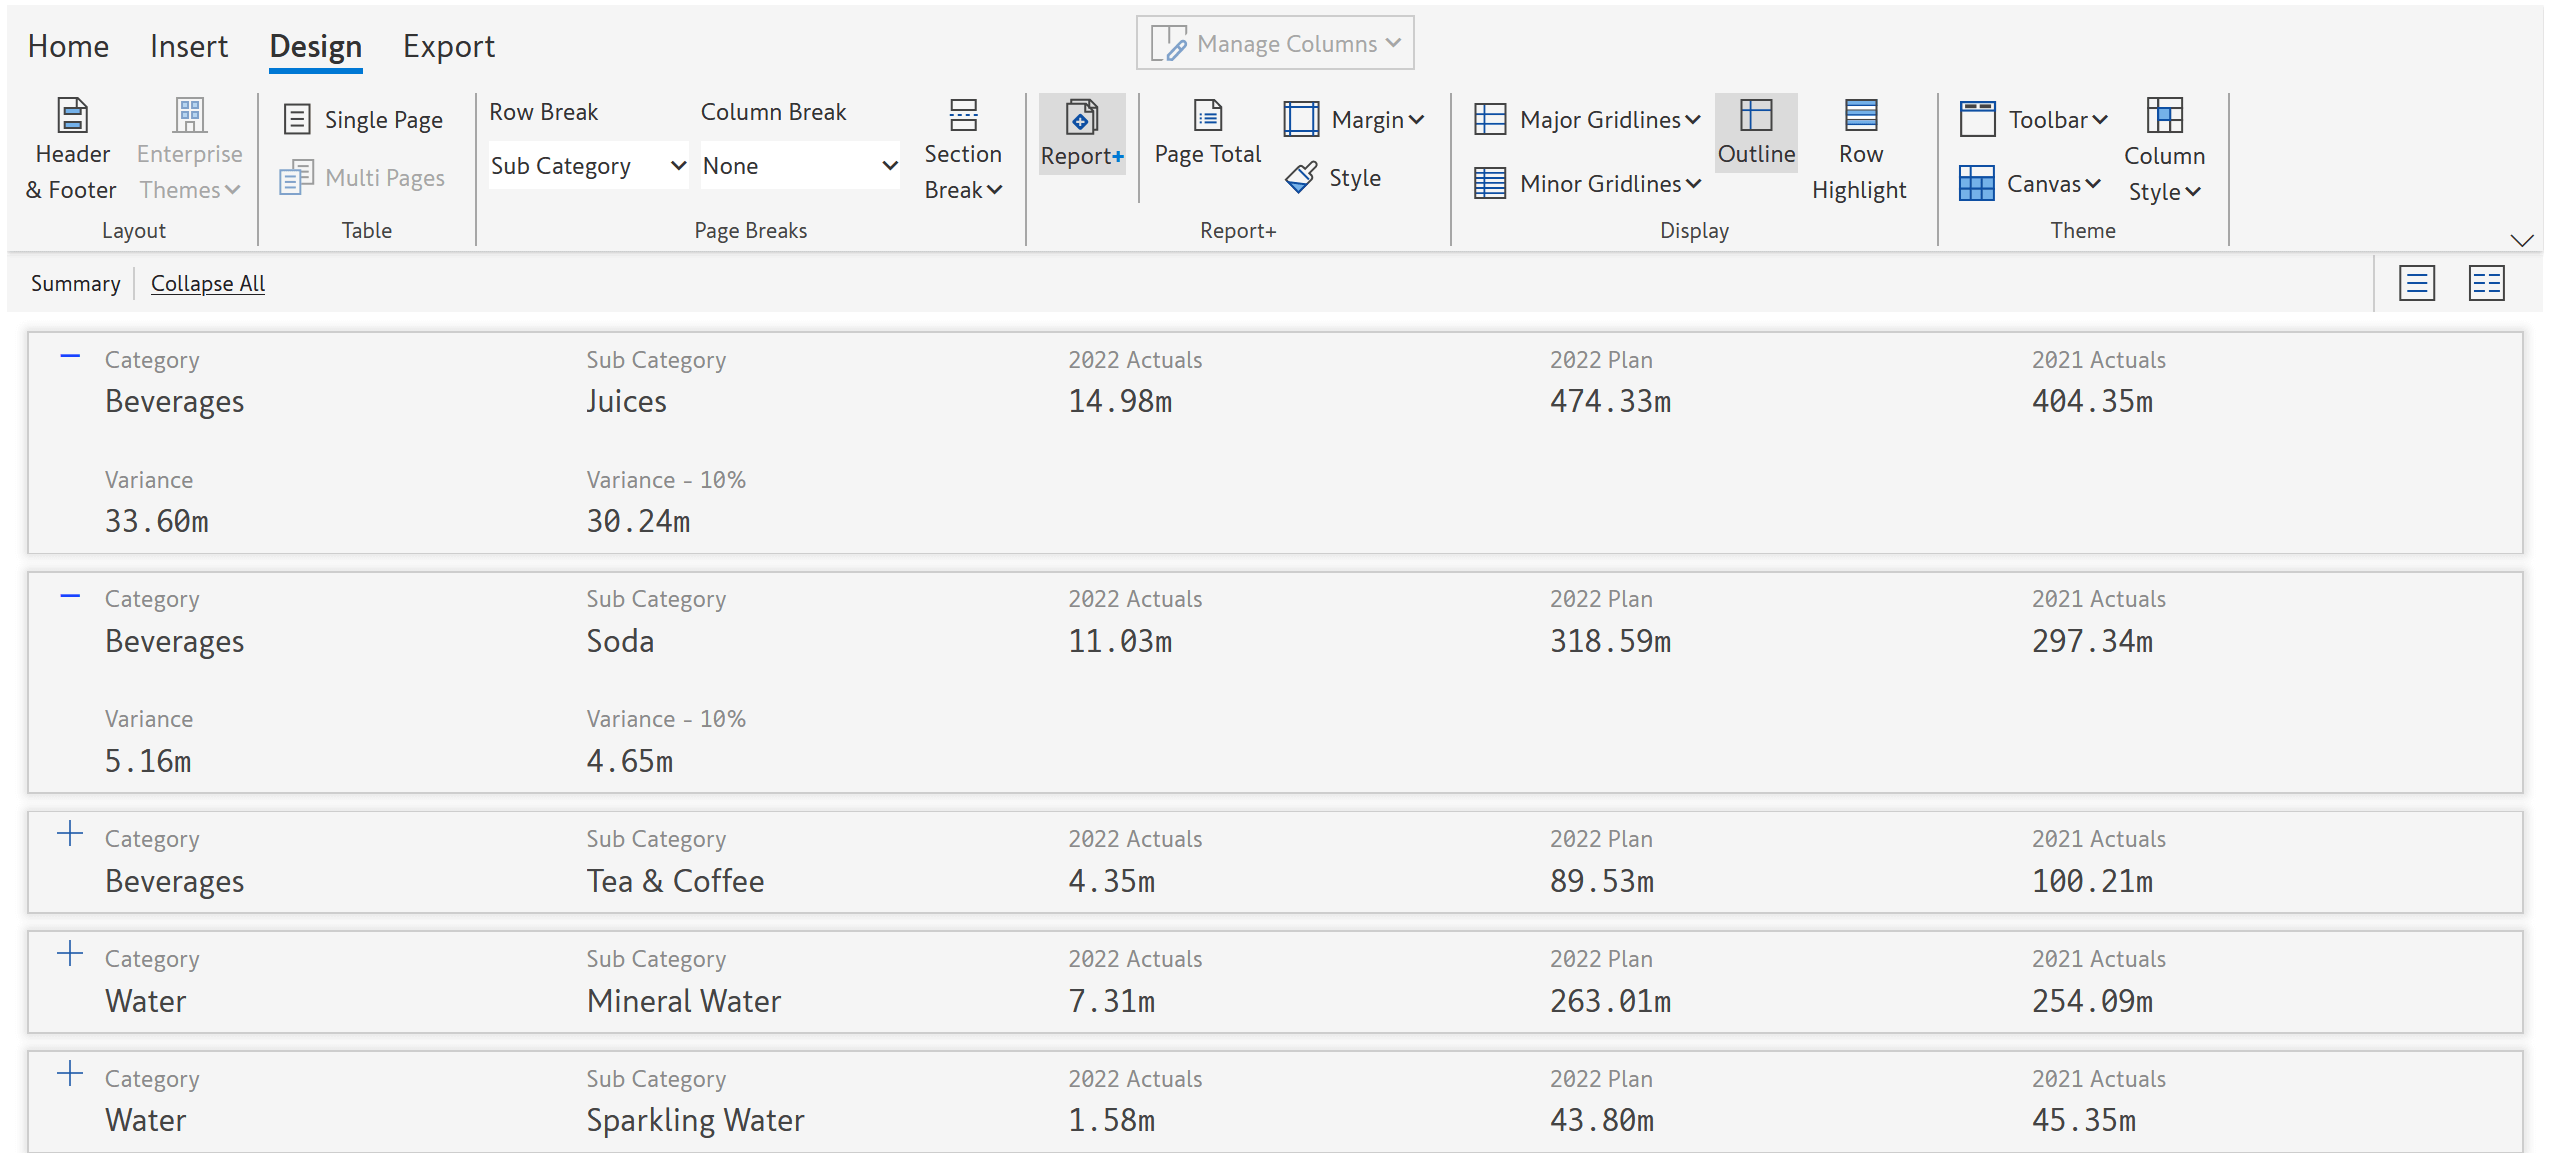
14. Report plus
Expanded summary page option displays all types of columns (data input, simulate, quick formula, smart analysis, blend).
Settings icon position for header and table header has been improved.
Hide/ unhide toggle for table header & footer has been added.
Icons for show table header, show header, show table footer and show Footer have been added.
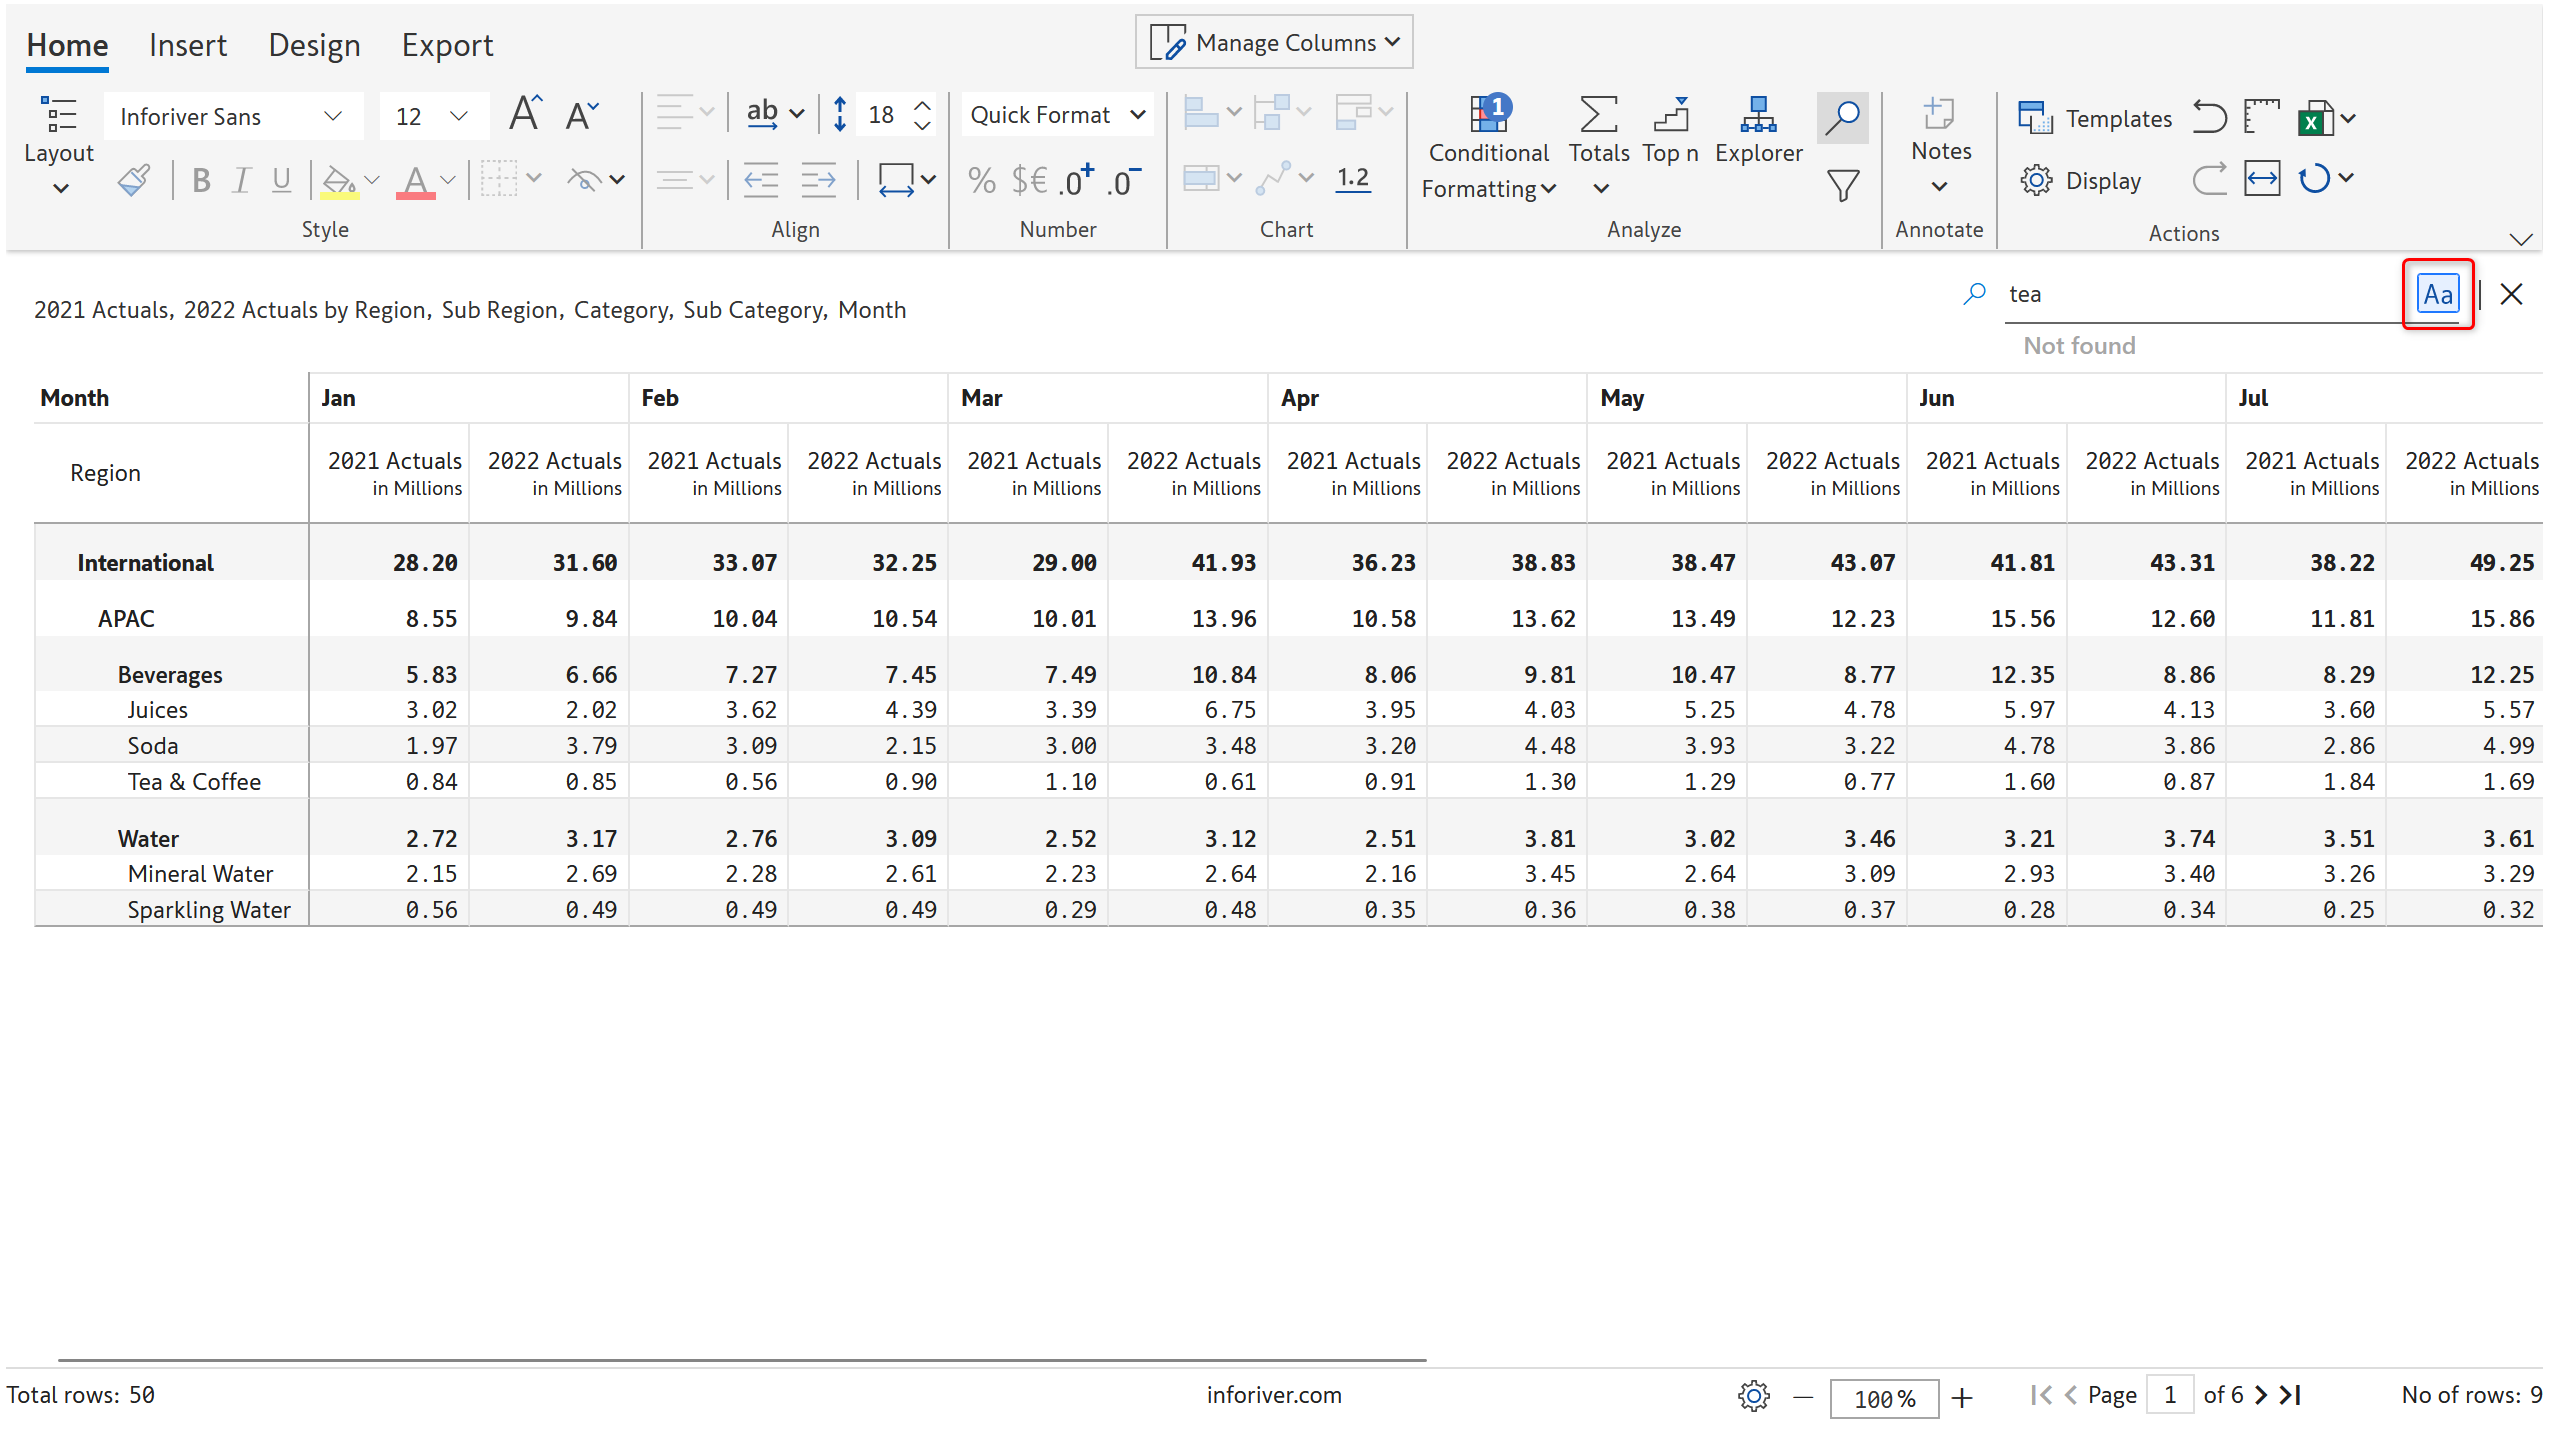
15. Search
Option to enable match case while searching has been introduced.
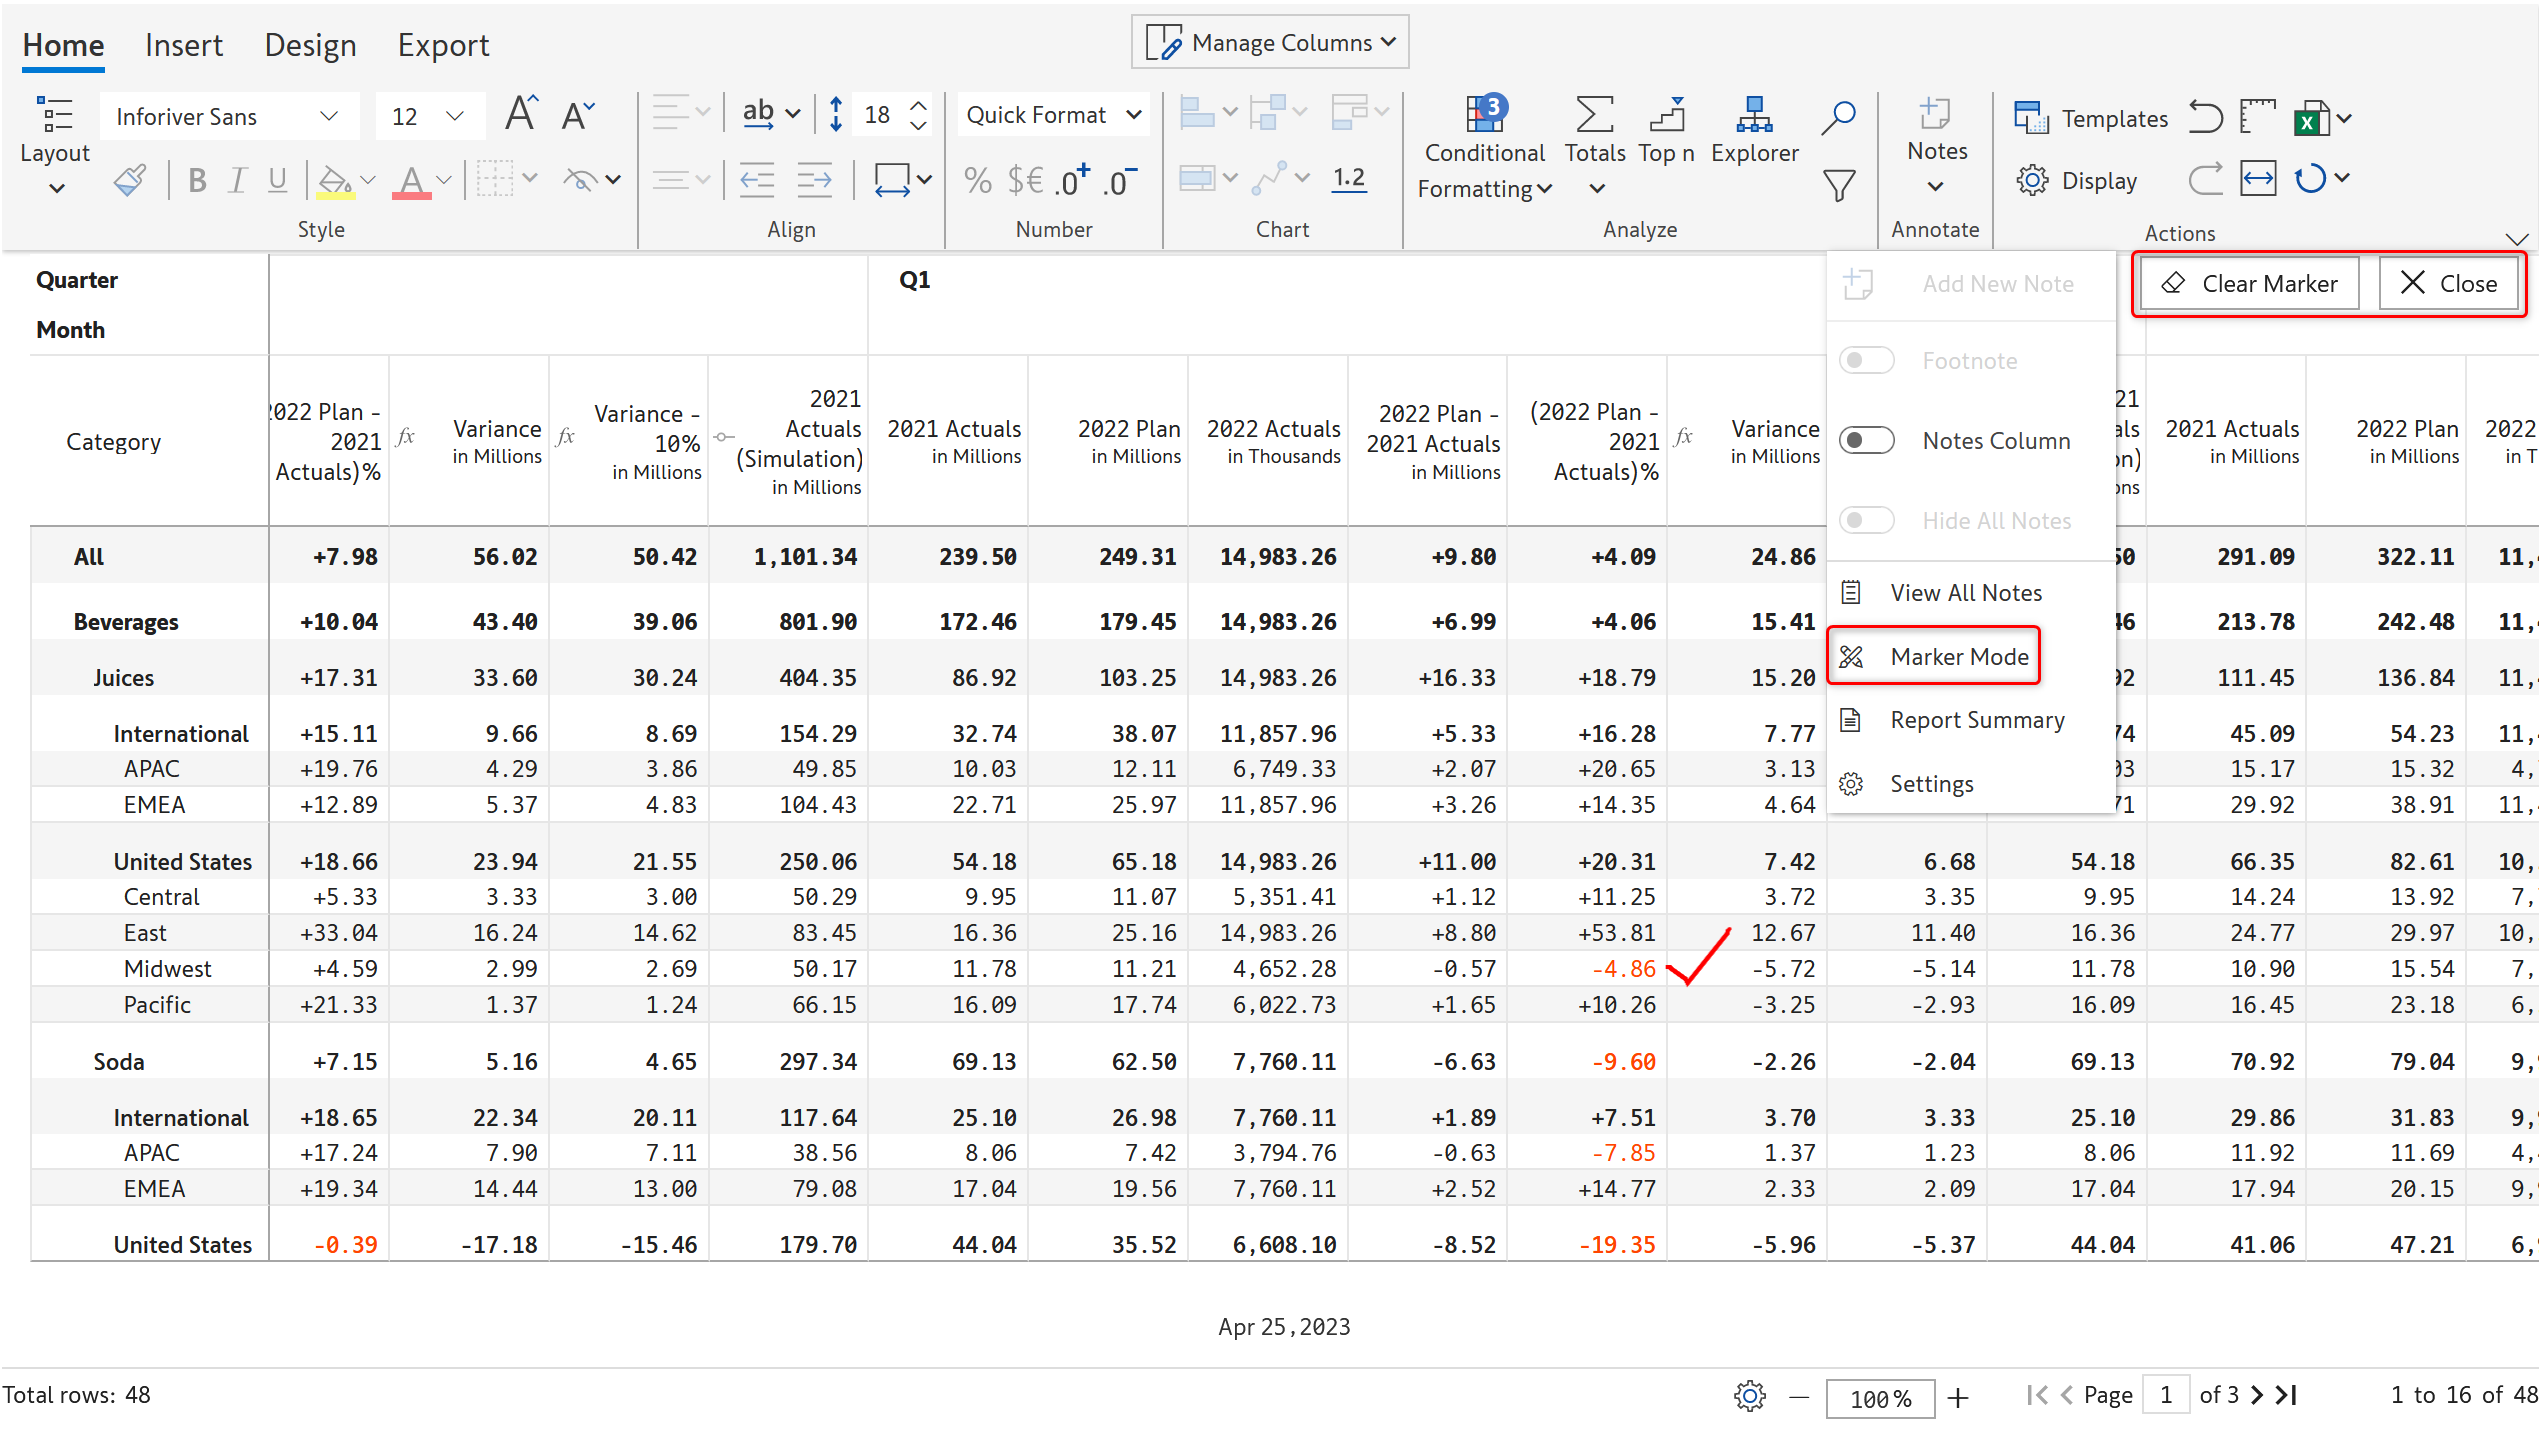
16. Marker mode
Marker mode has been redesigned to improve usability.
17. IBCS templates
Option to increase ‘Others’ row height (when using Top N) in case of IBCS templates to comply with IBCS standards has been introduced.
18. Link icons for URLs
Link icons will be displayed when URL links are added as a dimension in rows.
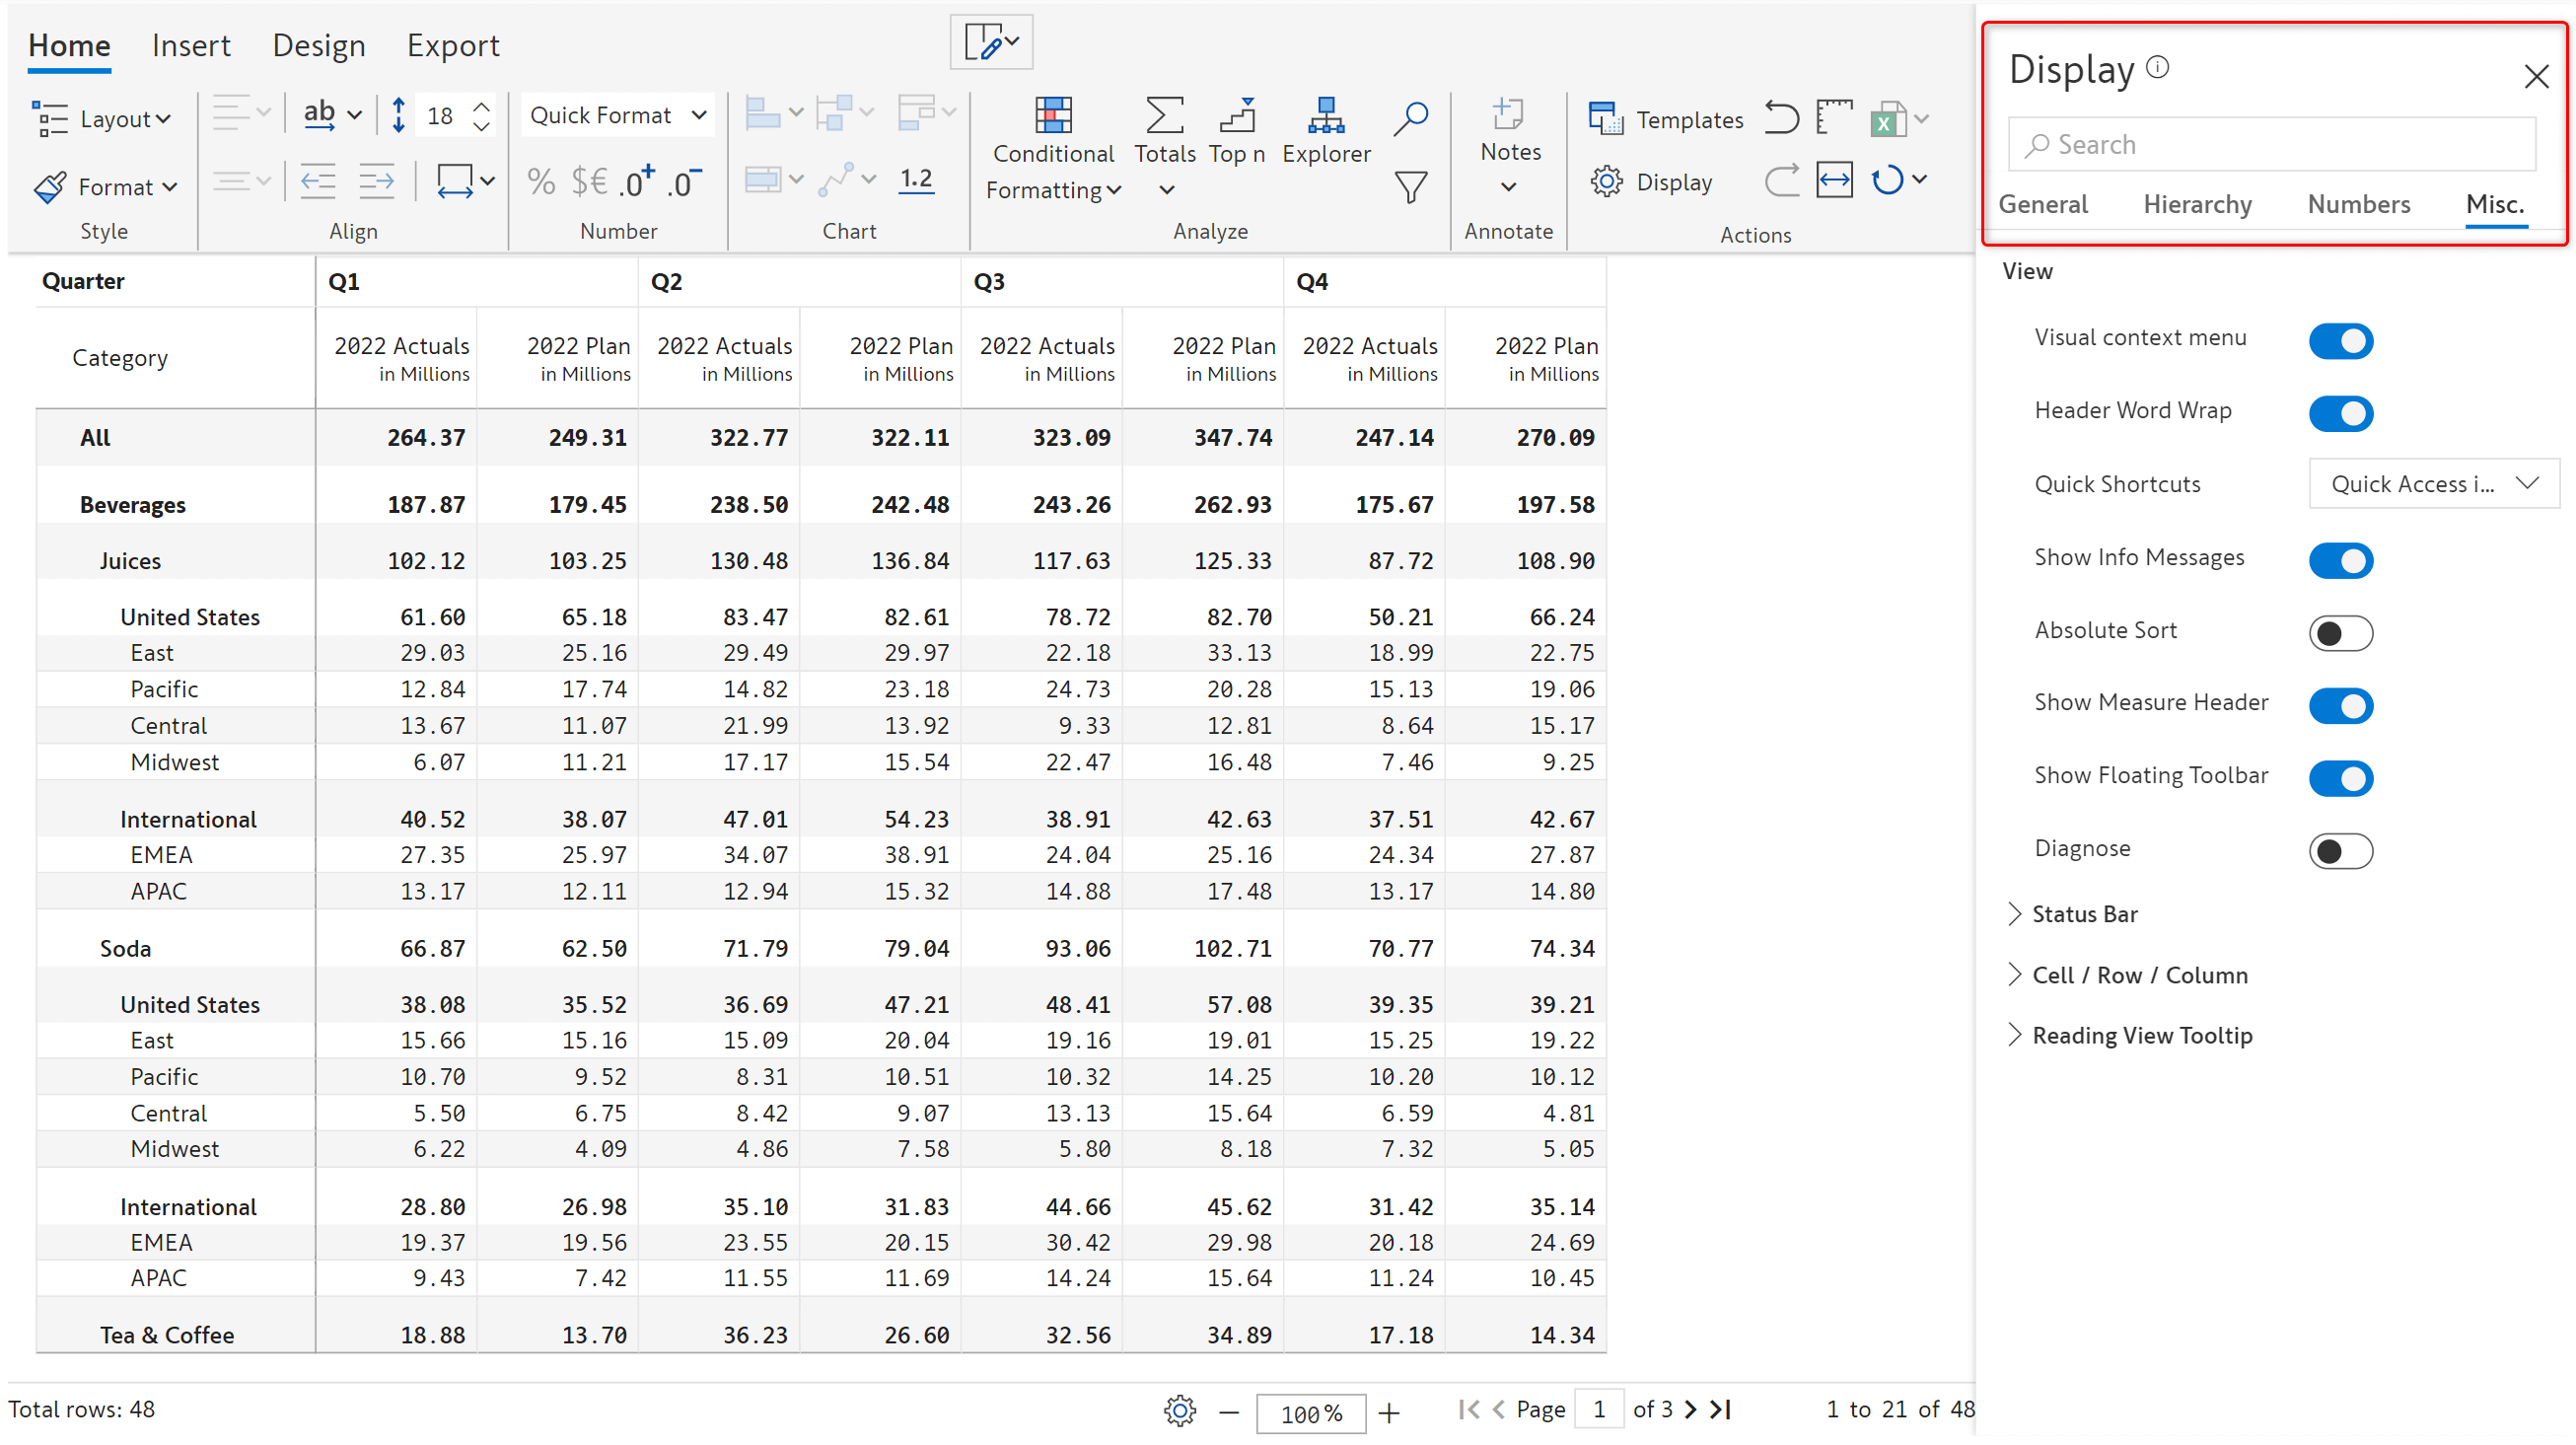
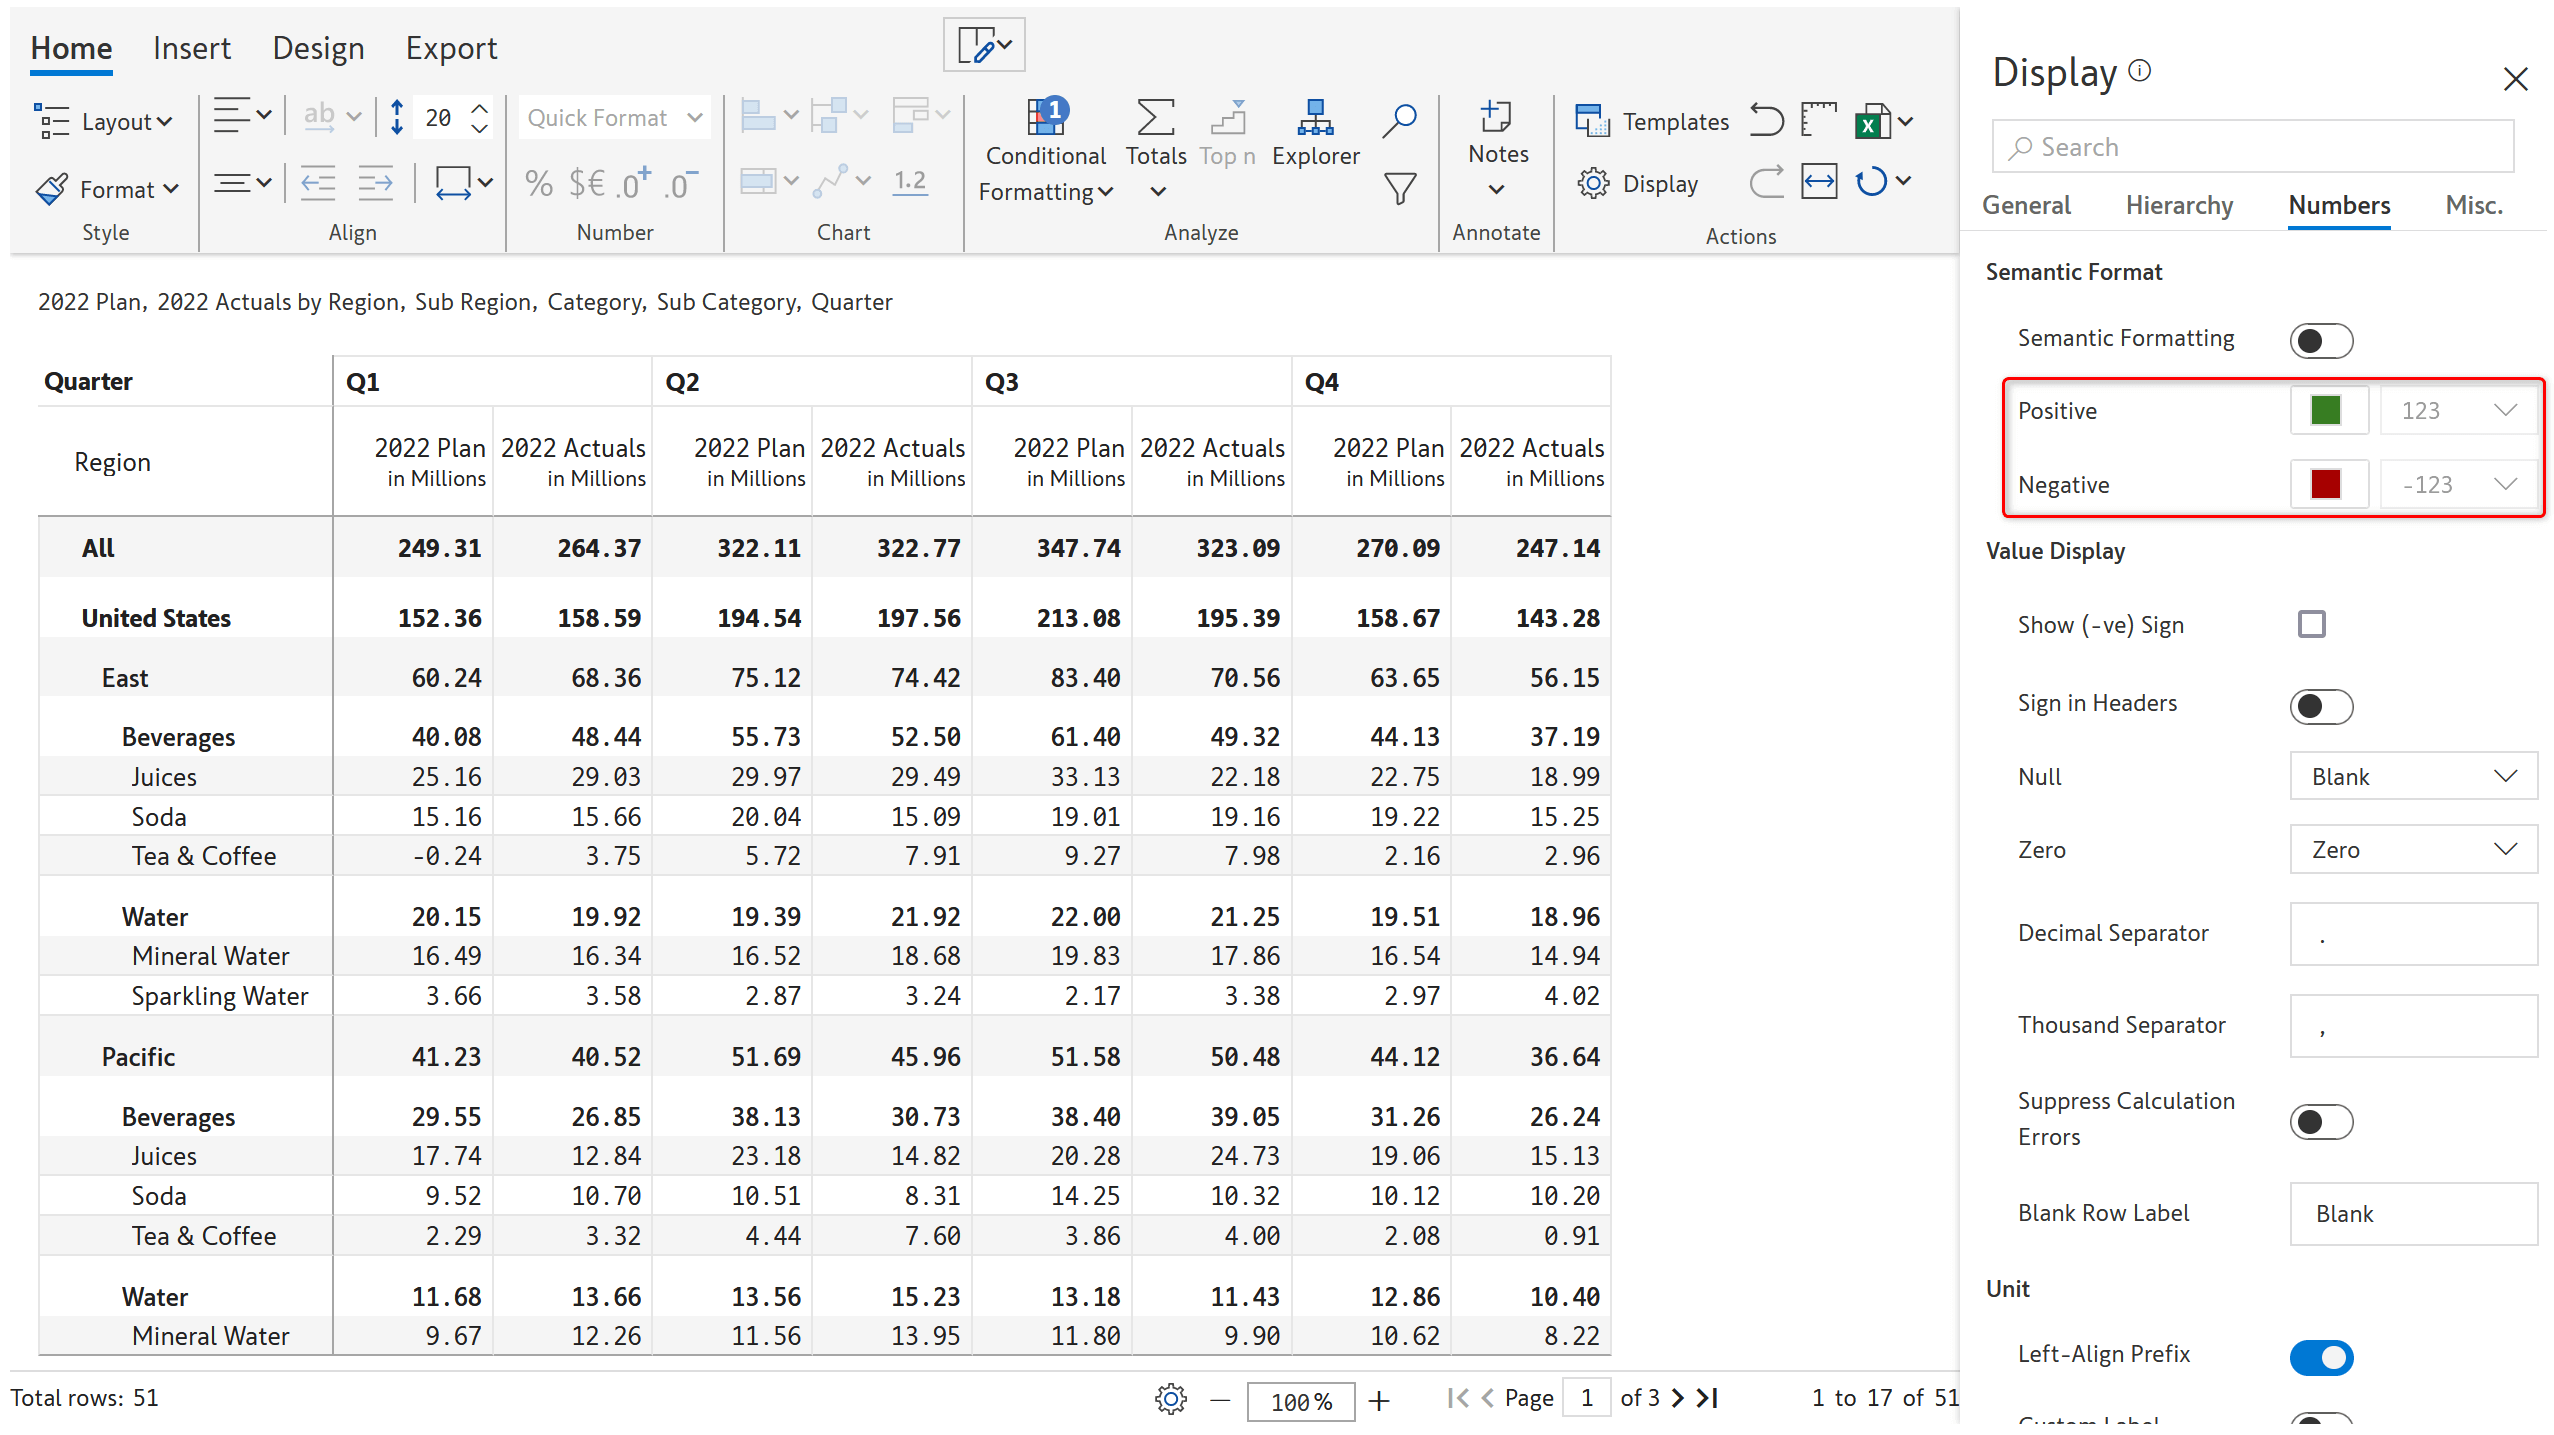
19. Display settings
Tabs have been reorganised into General, Hierarchy, Numbers and Misc for improved discoverability.
Colors for +/- simulation values can be customized from the Numbers tab.
Clicking on "i" icon in toast messages now highlights corresponding property in Display tab.
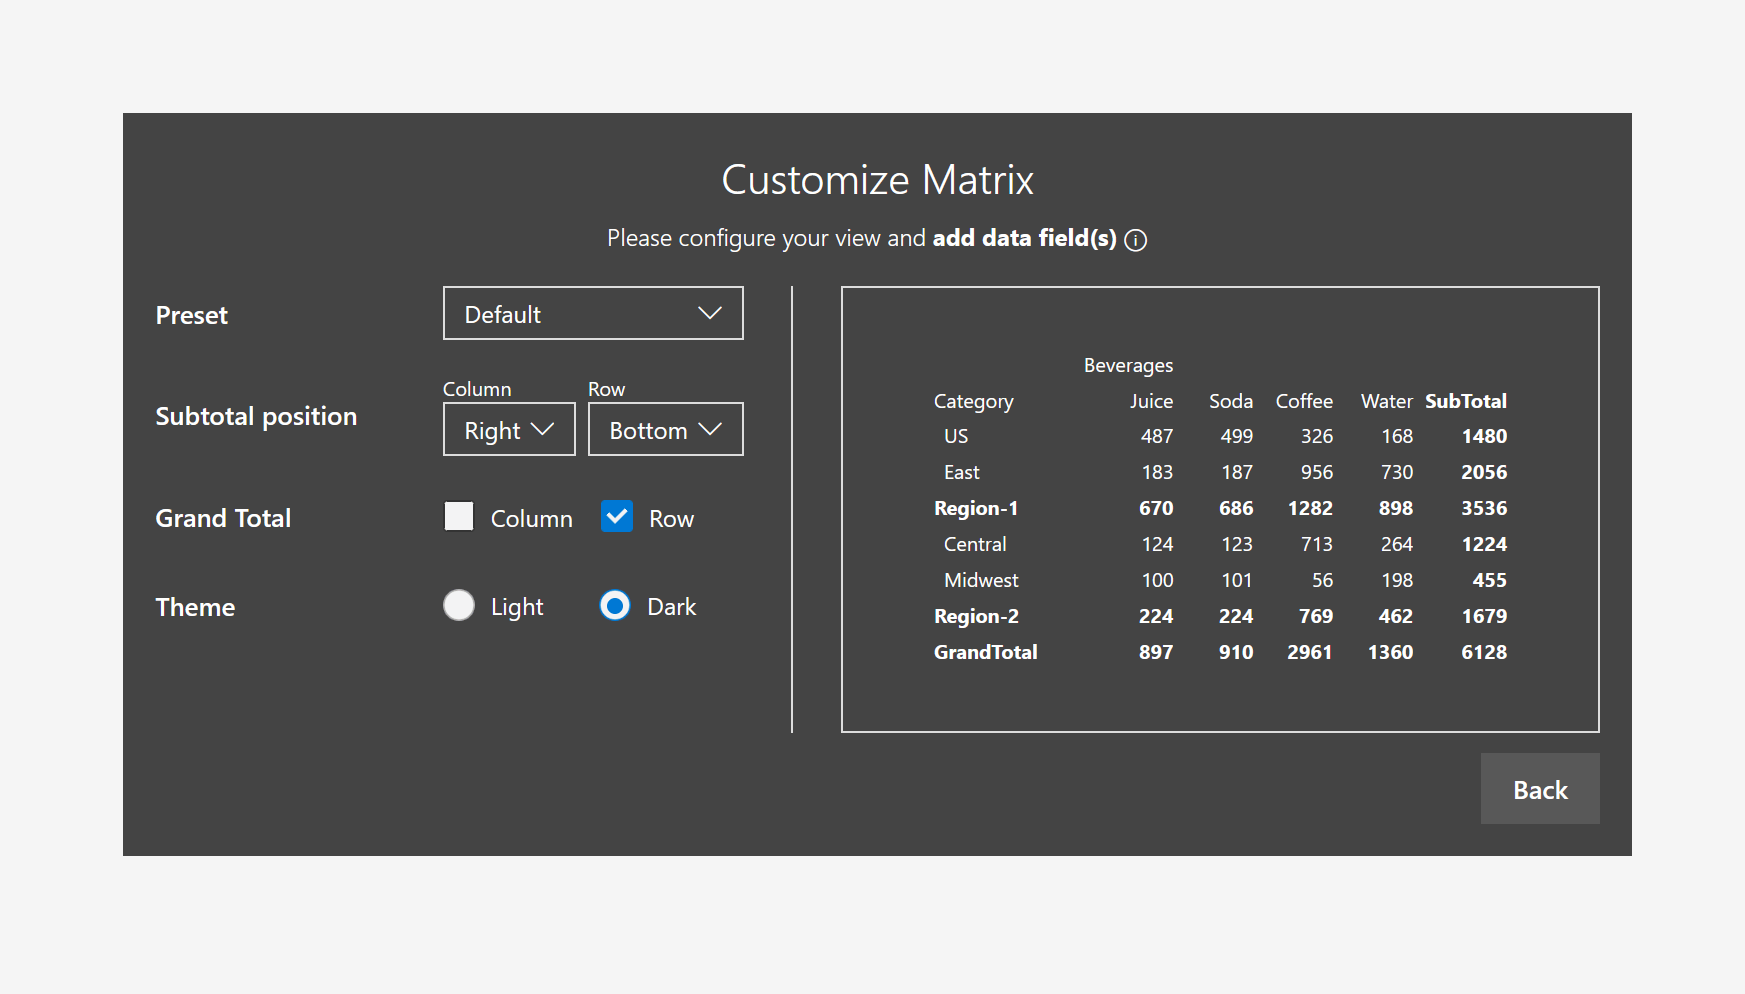
20. Landing page
Fully responsive preview has been introduced in the launch wizard.
Bug fixes
Updated measure names will reflect in the formula engine and in rows.
Editing cells in reading mode is not allowed anymore.
Issue with Distribute fixed.
Values on rows can be locked for a calculated row.
After applying column breakdown with set version you can set measure values on simulation, and if simulation is edited, it wouldn’t throw a console error.
Column filter issue has been fixed.
Console error when enabling column breakdown in set version when using performance template is fixed.
'Export generating error' when exporting as Excel with the show as a new column option in Conditional Formatting rating rule is enabled has been fixed.
'Error generating pdf' issue when exporting to PDF with values on columns, conditional formatting and section break has been fixed.
The console error when adding data input columns has been fixed.
The issue when adding an option in select, multi-select and date columns has been fixed.
Console error issue when clicking on auto wrap or copy to all rows with section break and multi-select column has been fixed.
Issue with exporting header column notes to PDF/Excel has been fixed.
Export to Excel issue where after applying header border in all sides, the default header was missing in the Excel file has been fixed.
Export to Excel issue when Conditional formatting - classification rule is applied has been fixed.
Issue when exporting report to PDF/Excel with empty rows in waterfall charts has been fixed.
'Error generating excel' issue when exporting report with a single row dimension to Excel has been fixed.
Export to PDF issue when a pin chart is added after enabling set column as a measure has been fixed.
Export to PDF issue after removing the dimension in Power BI column for scale band sparkline has been fixed.
Export to PDF issue where the 2nd preset in the Simple tab and 1st preset in the Combo tab are used and the variance icon is of custom color has been fixed.
Console error when exporting a report to PDF with variance icon changed has been fixed.
Inforiver Premium 2.0 is already available in the website and is expected to be available in Microsoft Appsource by the second week of May 2023.
We'd love to hear your ideas for Inforiver – be it a cool new feature or an improvement on existing features. Visit the Inforiver Community to share your ideas, vote on other submissions, and interact with other users.
Inforiver helps enterprises consolidate planning, reporting & analytics on a single platform (Power BI). The no-code, self-service award-winning platform has been recognized as the industry’s best and is adopted by many Fortune 100 firms.
Inforiver is a product of Lumel, the #1 Power BI AppSource Partner. The firm serves over 3,000 customers worldwide through its portfolio of products offered under the brands Inforiver, EDITable, ValQ, and xViz.