Upcoming webinar on 'Inforiver Charts : The fastest way to deliver stories in Power BI', Aug 29th , Monday, 10.30 AM CST. Register Now
Upcoming webinar on 'Inforiver Charts : The fastest way to deliver stories in Power BI', Aug 29th , Monday, 10.30 AM CST. Register Now
Inforiver, offering the fastest way to build Power BI table / matrix reports, is now certified by International Business Communication Standards (IBCS). The product delivers the simplicity, flexibility and power of Excel spreadsheets right within Microsoft Power BI. It supports a wide variety of use cases including reporting, visualizations, analysis, audit, forecasting & simulations, scheduling, collaboration and writeback.
With its business-responsive design, Inforiver makes it possible to create IBCS compliant business, management, variance, and performance reports in a single click. Users can simply select a template and assign the data to build a report. They can do this instantly without any programming, scripting or configuration assistance.
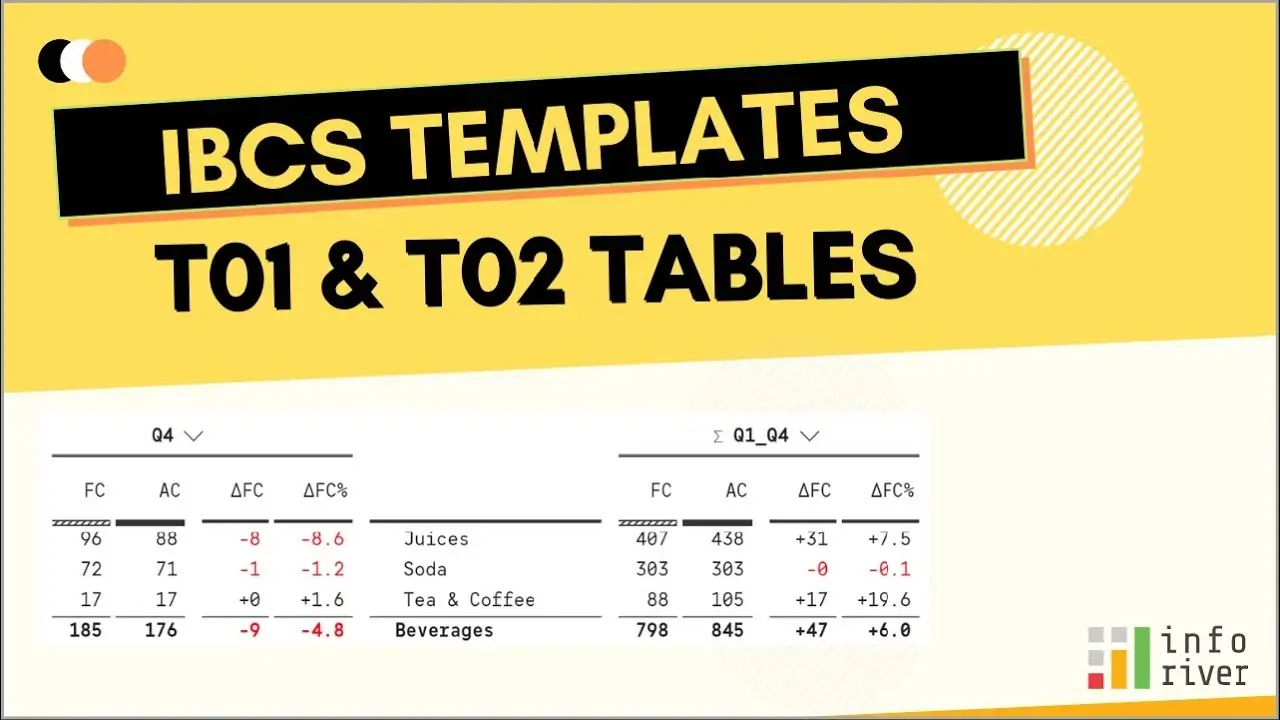
Currently the product offers five (5) IBCS templates that can jumpstart your Power BI report development.
• Advanced pivot analysis
• Expand/Collapse-enabled row & column hierarchies
• Row & column reordering for visually managing hierarchies
• Header & footer customization
• Integrated inline, footer & column-based commenting and annotations
• Top ‘N’ + others analysis in minimal clicks
• Advanced conditional formatting (including subtotals) with dynamic data selection
• Support for ragged/unbalanced hierarchies
• Totals & subtotals management with split subtotals & grouped subtotals
• Multiple formatting options for themes, appearance, toolbar, and interactivity customizations
• … and more
• Ability to support multiple charting options such as waterfall, line, area, integrated variance, small multiples/trellis
• Persistent highlighting (e.g., difference markers, trend arrows, etc.) and dynamic highlighting (e.g., to measure the difference between two bars on the fly)
• Scale band functionality and dynamic scaling of charts
• Extensive axis label formatting and placement
• Runtime dynamic deviation
• Pixel perfect formatted export to PDF (including pagination) and numeric view export to Excel
… and more
Try out Inforiver for FREE today
Note: Inforiver Charts has been renamed to Inforiver Analytics+. Learn more

Inforiver helps enterprises consolidate planning, reporting & analytics on a single platform (Power BI). The no-code, self-service award-winning platform has been recognized as the industry’s best and is adopted by many Fortune 100 firms.
Inforiver is a product of Lumel, the #1 Power BI AppSource Partner. The firm serves over 3,000 customers worldwide through its portfolio of products offered under the brands Inforiver, EDITable, ValQ, and xViz.