Inforiver

Upcoming webinar on 'Inforiver Charts : The fastest way to deliver stories in Power BI', Aug 29th , Monday, 10.30 AM CST.    Register Now

Inforiver March 2022 Update  

by Inforiver | Mar 29, 2022 | ,

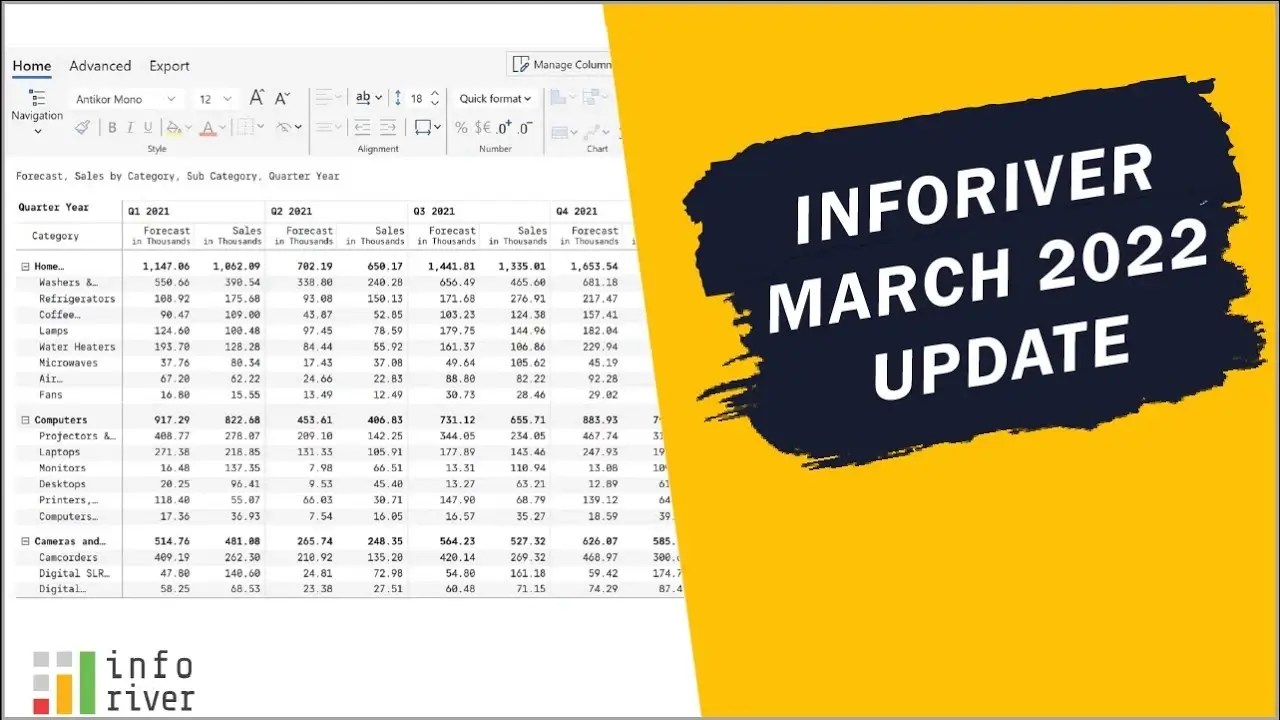
Welcome to the Inforiver March 2022 update. We are thrilled to announce several new features and key enhancements (for all the editions) most anticipated by our Inforiver community!  

Here is a video summarizing the key updates. 

Inforiver March 2022 Update  

New Features & Enhancements 

Audit Log 

  • Timestamps for changes  
  • Listing by chronological order 
  • Filter by cell/row/column 

Auto Fit 

  • Preview option in focus mode to understand fit in smaller screen  
  • Auto fit one or more selected columns 

Blend Measure 

  • Auto populate on selecting 2 measures 
  • Blend measures horizontally 
  • Add padding between the 2 measures 
  • Icon in column header to denote blended measures  

Bullet Chart 

  • Conditional Bar – bar color is based on positive/negative variance 
  • Fill pattern (Solid, Outlined and Hatched) for Integrated Bullet chart 
  • Comparison bands for Stephen Few’s Quantitative Bullet visual 
  • Select specific members from a category e.g., only Q1 and Q2 for the last 3 years 
  • Option to sort measures – Ascending or Descending 
  • Align labels – Left, Center or Right 

New Charts 

Stacked Bar 

  • Dumbbell and Range Plot – for drawing attention to the qualitative difference between 2 groups 
  • Dot Plot – for visualizing the difference between 3 groups  
  • Arrow Plot – for indicating the direction of change between 2 groups in time

New Formula Bar  

  • Excel-like cell highlighting 
  • New reference .COLUMN to select columns within a hierarchy measure 
  • Dynamic example in formula bar 

Calculated Row 

  • Template row for lowest child level of balanced hierarchy 
  • Insert Smart analysis based on calculated row 
  • Refer row totals inside calculated rows 

Data Bar 

  • Enhanced color picker – select min and max colors for gradient 
  • Align data bar to the left or right 

Display Settings 

  • Search for specific properties. Tags have been added for ease of use; typing invert shows related results such as sign in headers. 
  • Option to show/hide measure header 
  • Row/Column/Rows & Column Word wrap option 
  • Option to turn off edit cell indicator 
  • Set padding for row totals 
  • Custom/Alias name for scaling titles

Simulations 

  • Apply simulation from parent to child 
  • Simulate multiple leaf cells in the same column simultaneously 

Formatting 

  • Support for multiple cell selection, control click and range selection
  • Underline option for cell, row, column, measure/column/row/column group header 
  • Rounded corner support for borders 
  • Copy formatting from one column header to another

Reset Changes 

  • Reset Format, Notes or All changes 
  • Formatting can be cleared for selected columns

Charts Enhancements 

  • X Axis with tick marks on top of charts which is responsive to resizing 
  • Bar Charts - Data Label Flip, Reference Line, Reference Band and Bar Padding  

Stepped Layout 

  • Expand to specific level  
  • Option to turn off single child rows 
  • Configure single child row as Parent only, Single child as parent etc. 

Sparkline Enhancements 

  • Customize Null Display – connect over nulls, consider null as 0 or skip the nulls 
  • Appearance customizations – Stroke width, Area Color, Line Color, Max, Min, and Label Color 
  • Padding for win/loss columns 
  • Baseline Chart – Set axis as Median, Average, Standard deviation etc. and visualize the trend relative to it 
  • Scale bands to indicate distribution of values 
  • Create sparkline for a subset of the columns 

Responsive toolbar 

  • For smaller sizes, the toolbar switches to minimal mode which can be pinned or enabled on hover 

Rows & Columns 

  • Column Pinning – Pin selected columns 
  • Column Filtering – Filter rows based on whether the value is greater, lesser, or equal to specified value 
  • Group rows visually and set position as top or bottom 
  • Hide an Entire Level using show/hide icon 
  • Column Spacing – Create a space between columns 

Header & Footer Customizations 

  • Pixel dimensions for KPI cards 
  • Margins, Split panel, Swap containers and Entire header border  
  • Alignment, Padding and Text formatting 

Important Bug Fixes 

  • Non additive rows (when include in total is off) will not be included in visualizations 
  • Export to Excel gradient color issue has been fixed 
  • Export to Excel/PDF is possible when sparkline average, min and max columns are present 
  • Section breaks for table and stepped navigation is fixed 
  • Smart analysis: Creation of contribution based on already created % contribution column is disabled 

We'd love to hear your ideas for Inforiver – be it a cool new feature or an improvement on existing features. Visit the Inforiver Community to share your ideas, vote on other submissions, and interact with other users. 


Share this on:

Get Inforiver brochure

Maximize your business potential with Inforiver's paginated reporting, data entry, planning & budgeting capabilities
Download now
Inforiver
About Inforiver!
Inforiver is the fastest way to do everything in Power BI. It enables citizen developer productivity and unleashes true self-service with our intuitive and interactive no-code data app suite for Microsoft Power BI. The product is developed by Lumel Technologies Inc, who are #1 Power BI Visuals AppSource Partner serving over 3,000+ customers worldwide with their xViz, Inforiver, and ValQ offerings.
Other Products
Inforiver Logo
IBCS Certified
Power BI certified

About Inforiver!

Inforiver is the fastest way to do everything in Power BI. It enables citizen developer productivity and unleashes true self-service with our intuitive and interactive no-code data app suite for Microsoft Power BI. The product is developed by Lumel Technologies Inc, who are #1 Power BI Visuals AppSource Partner serving over 3,000+ customers worldwide with their xViz, Inforiver, and ValQ offerings.

Headquarters
5920 Windhaven Pkwy, #130
Plano TX 75093
ValQ
xViz
BI Hub
linkedin facebook pinterest youtube rss twitter instagram facebook-blank rss-blank linkedin-blank pinterest youtube twitter instagram