Upcoming webinar on 'Inforiver Charts : The fastest way to deliver stories in Power BI', Aug 29th , Monday, 10.30 AM CST. Register Now
Upcoming webinar on 'Inforiver Charts : The fastest way to deliver stories in Power BI', Aug 29th , Monday, 10.30 AM CST. Register Now
Welcome to the Inforiver Enterprise 2.5 release update. We are thrilled to announce several new features and key enhancements to writeback, forecasting, access management, data input - most anticipated by our Inforiver community! Key enhancements in this 2.5 release are listed below. Feel free to jump to any specific section!
1. Writeback
2. Data Input
3. Forecasts
4. Snapshots
5. Audit
6. Collaboration
7. Admin Console
8. Ease of use
9. Appearance and Display
10. Filter/Slicer Context
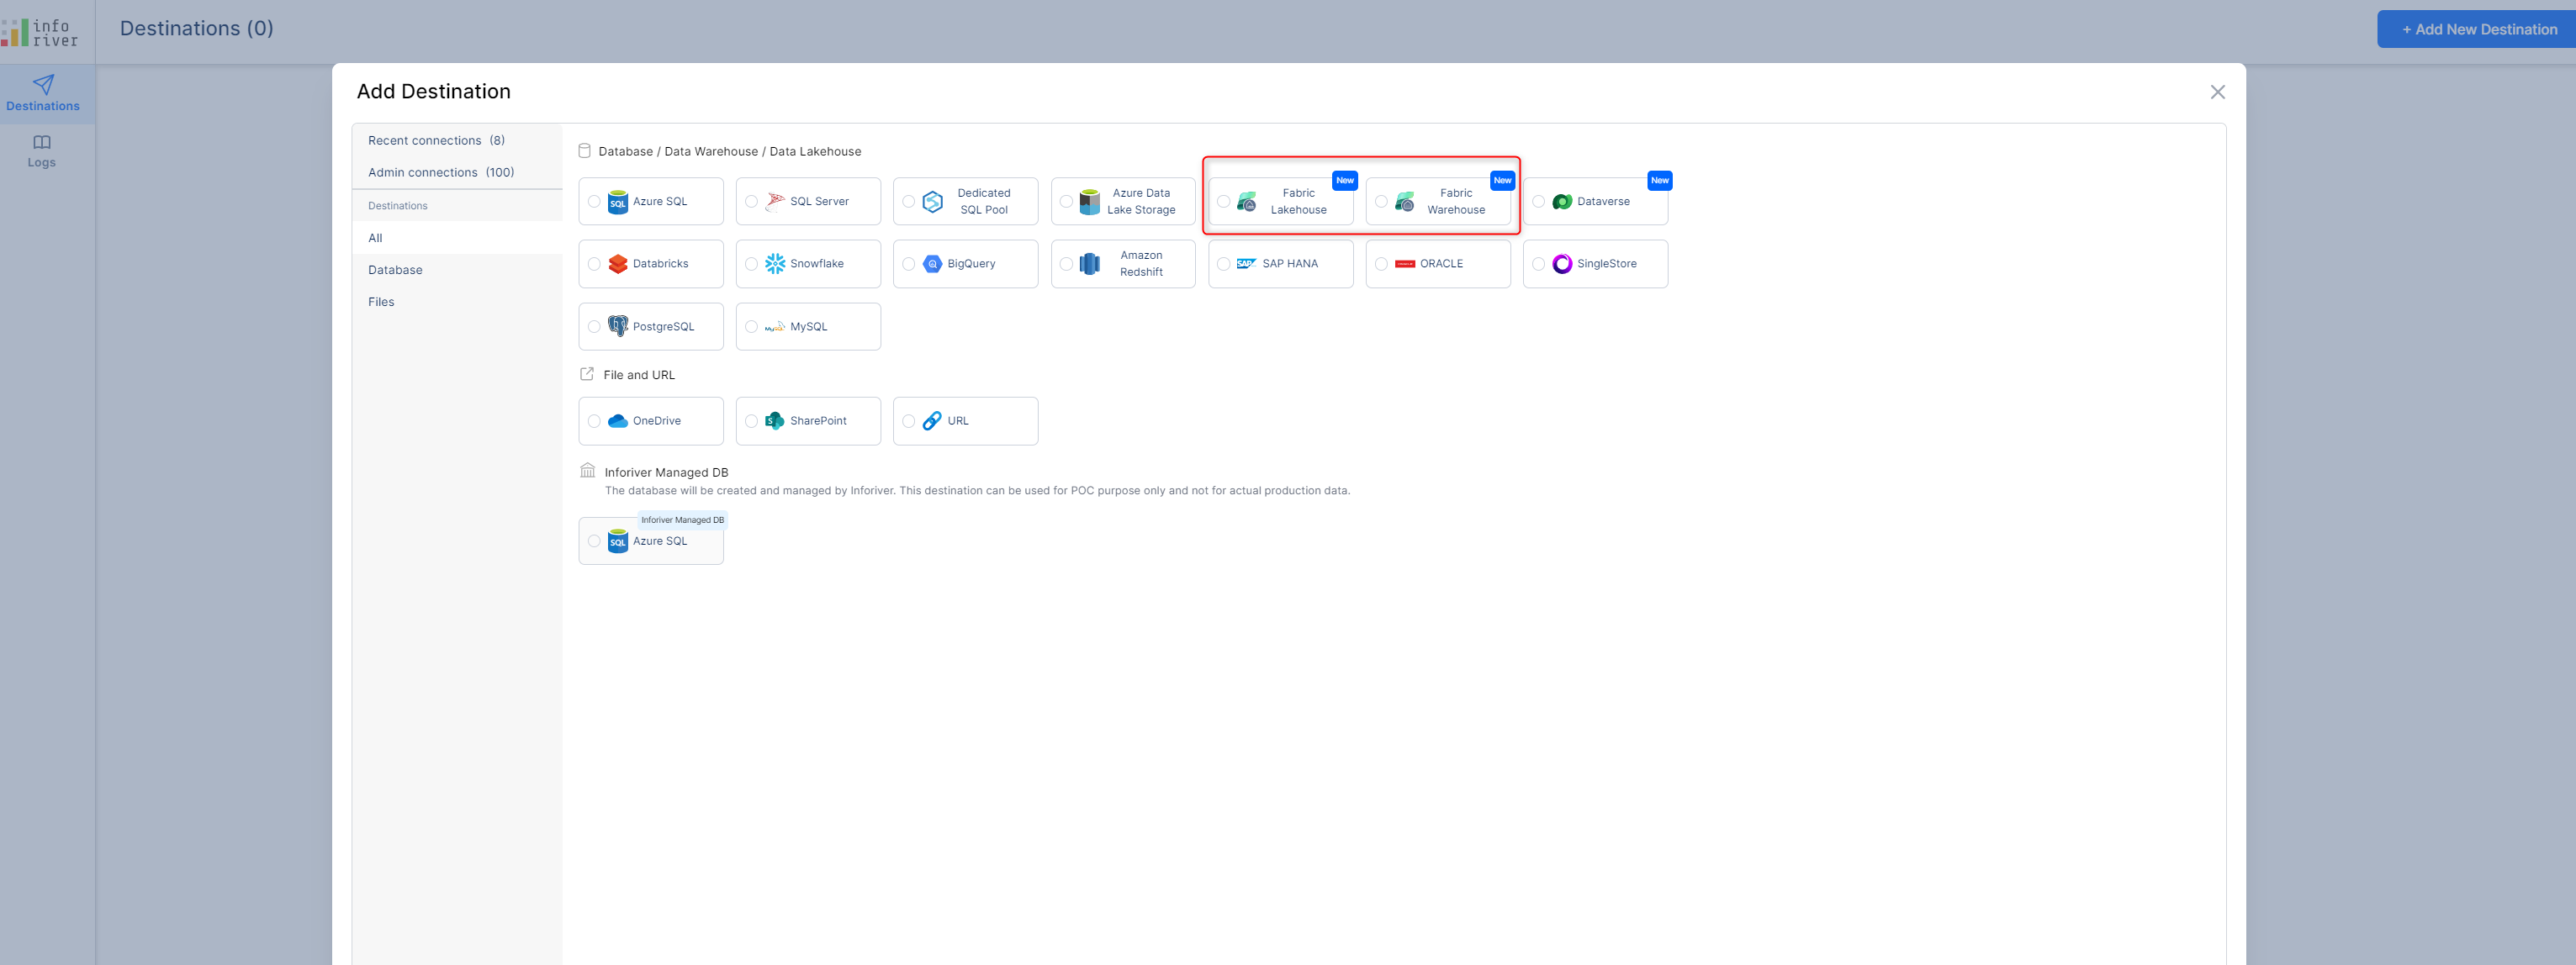
1.1. New writeback destinations – Fabric, Dataverse
Inforiver 2.5. supports fabric as a writeback destination. You can now writeback your data to Fabric Lakehouse and Warehouse destinations. Dataverse has also been included as a writeback destination.
1.2. Customer managed destinations
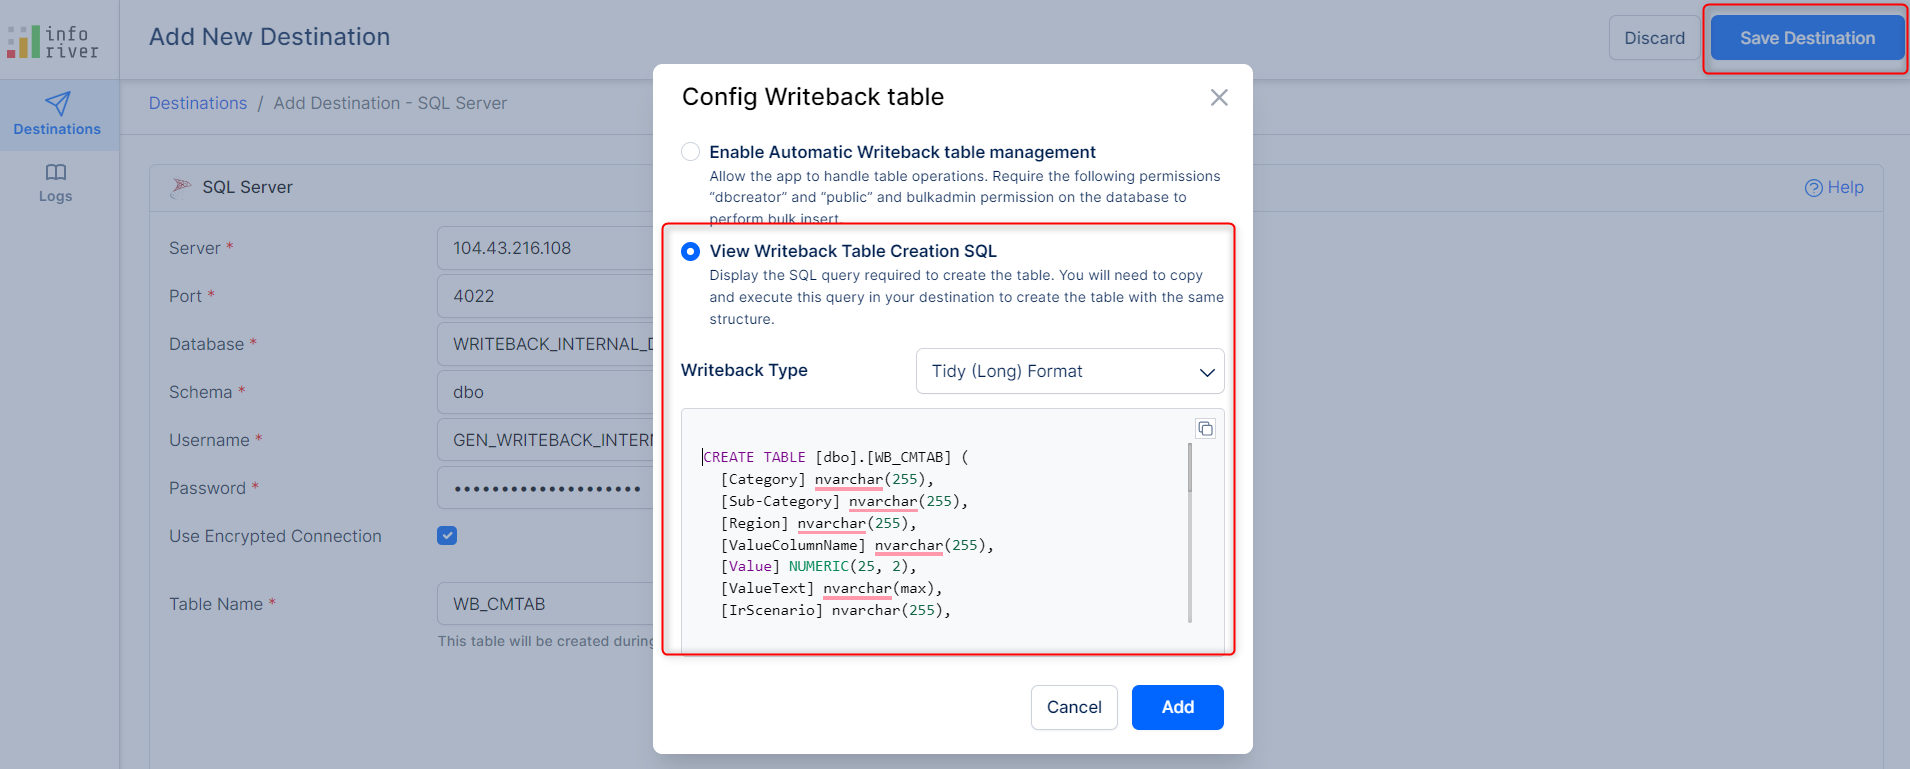
Inforiver now allows you to regulate create permissions on the destination. Create permission was previously mandatory. While adding a new writeback destination, you can either give Inforiver sanction to automatically create the table, alternatively Inforiver will provide the scripts which you can execute against the database.
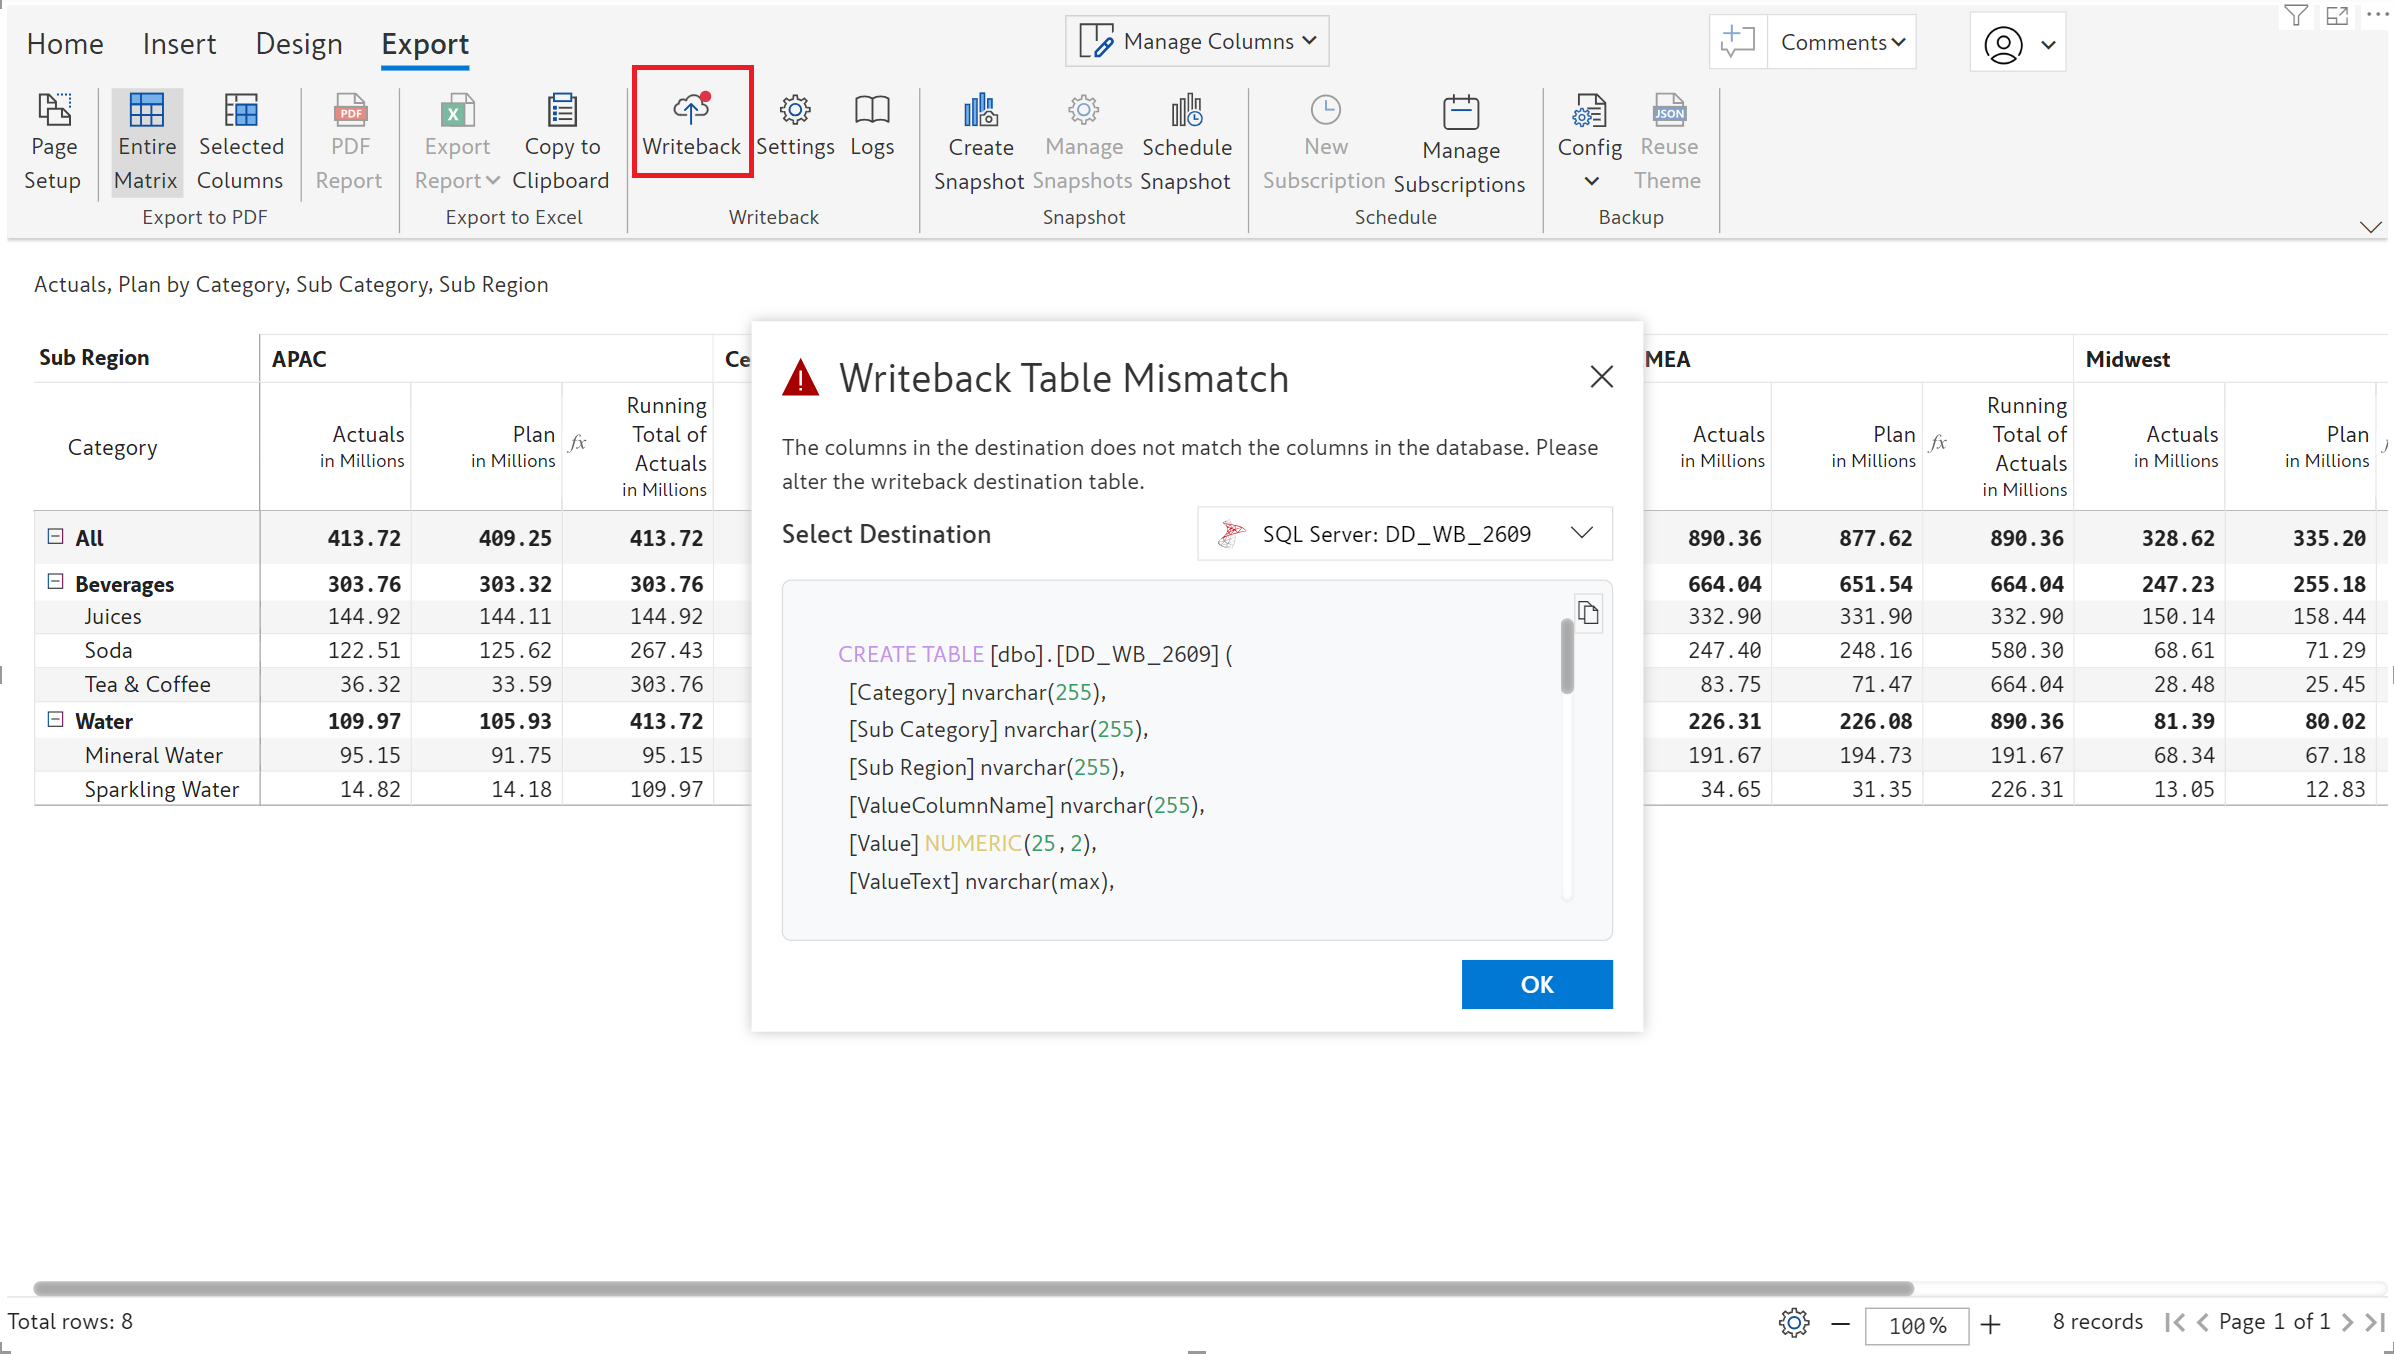
If there is a mismatch between the table structure expected by Inforiver and the destination table structure, a notification will be displayed during writeback.
1.3. Writeback filtered data
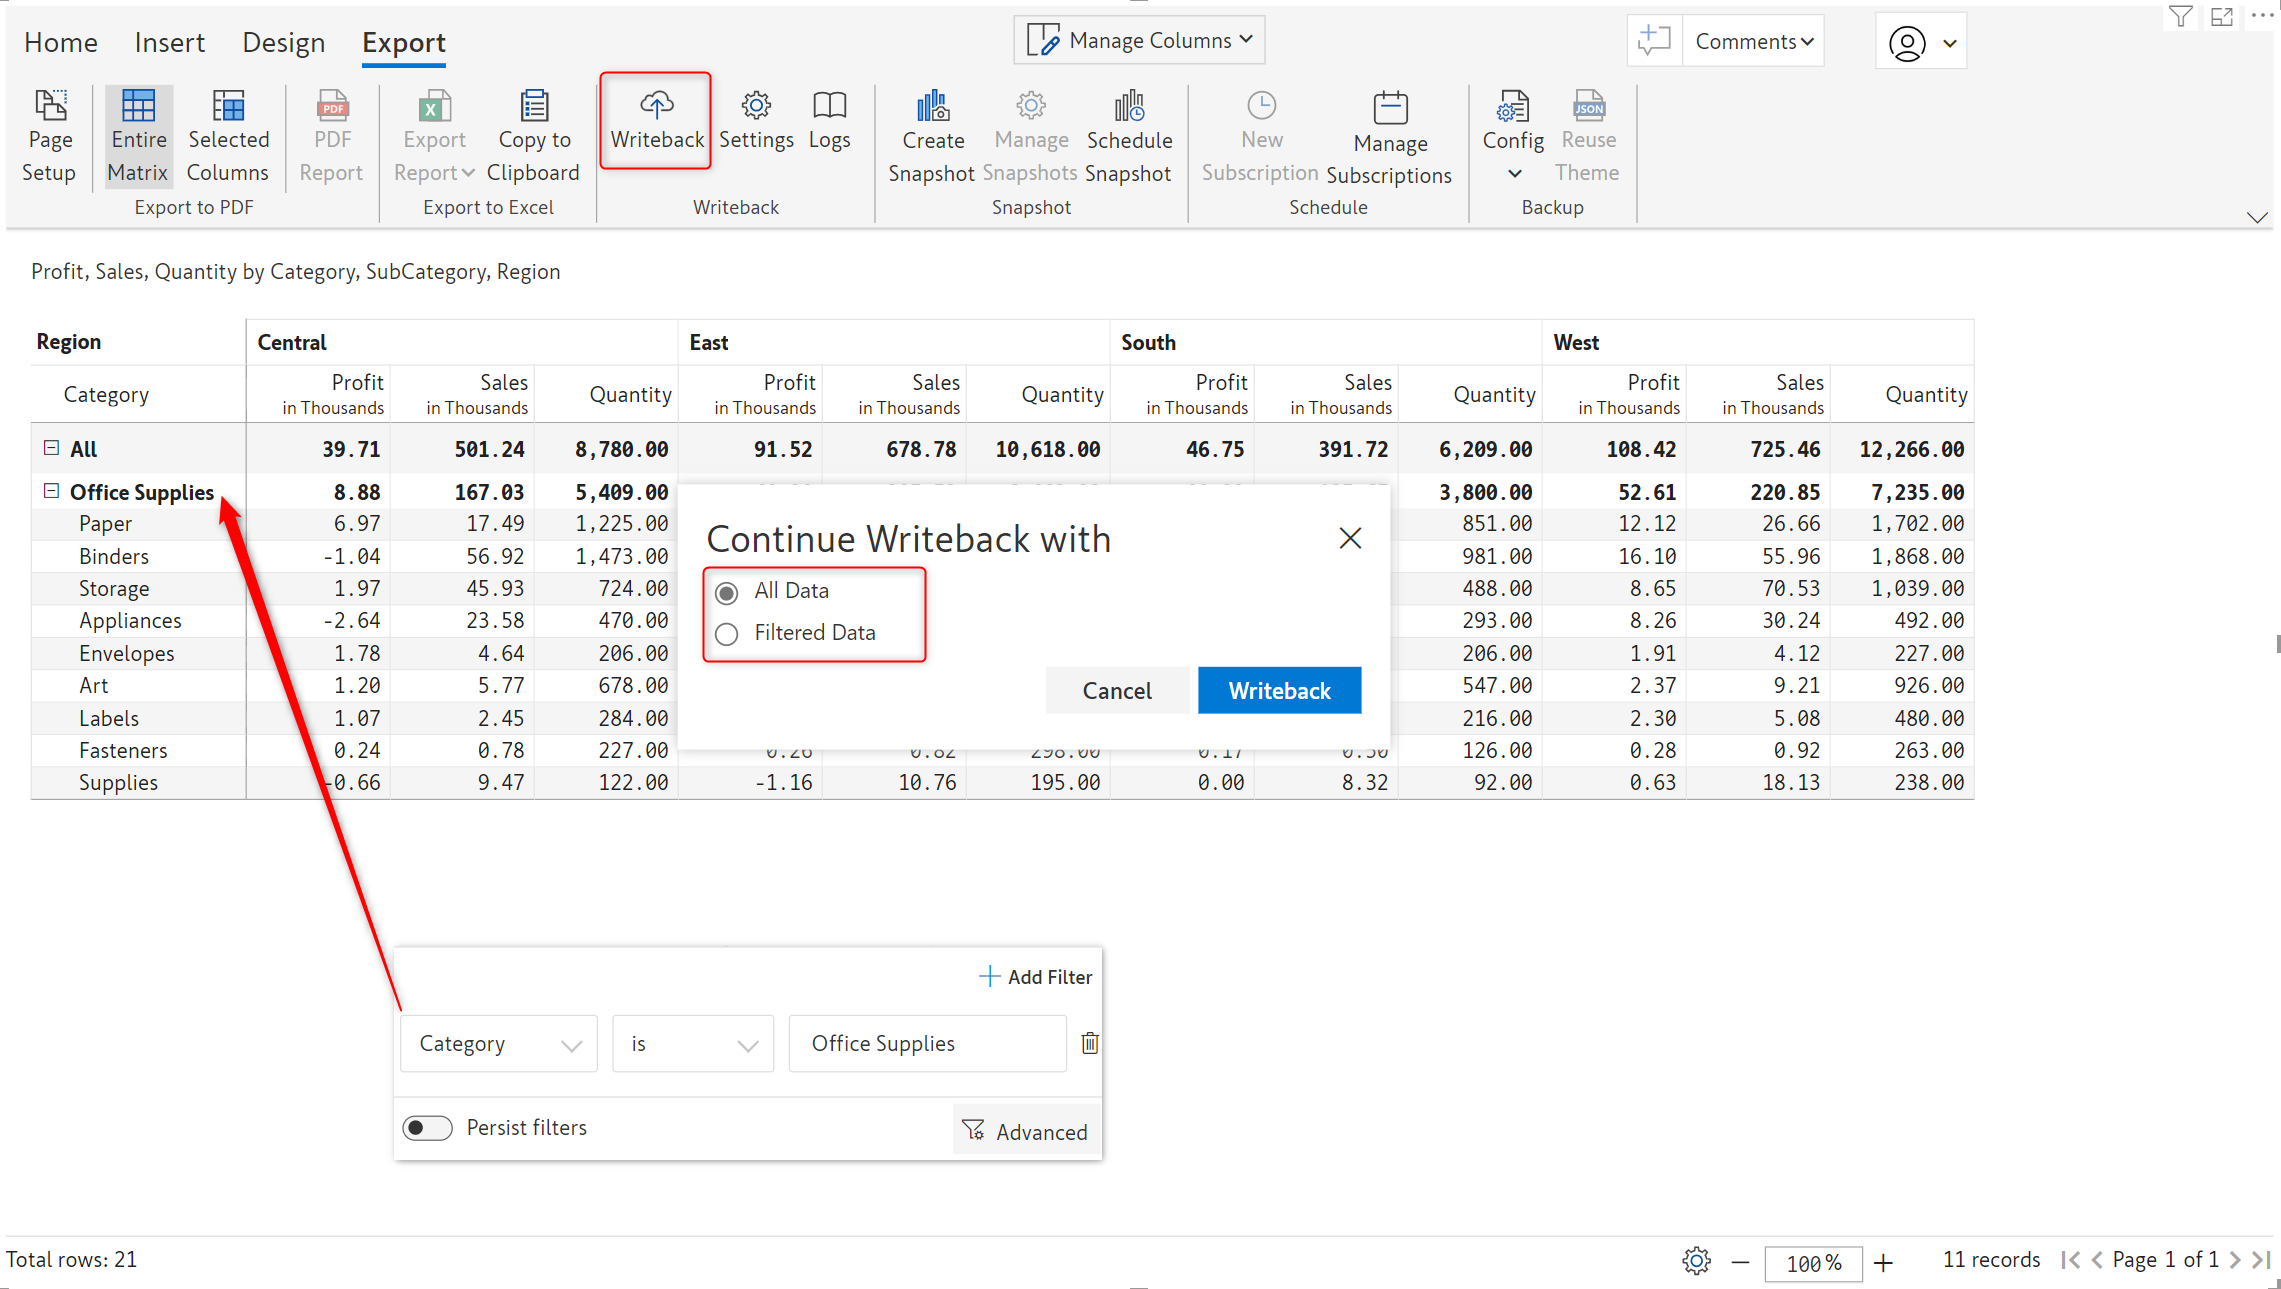
The 2.5. release brings you the much-awaited feature to retain Inforiver visual filters during writeback. While executing a writeback, Inforiver will prompt you to choose whether to writeback all the data or only filtered data.
1.4. Constraints on empty fields
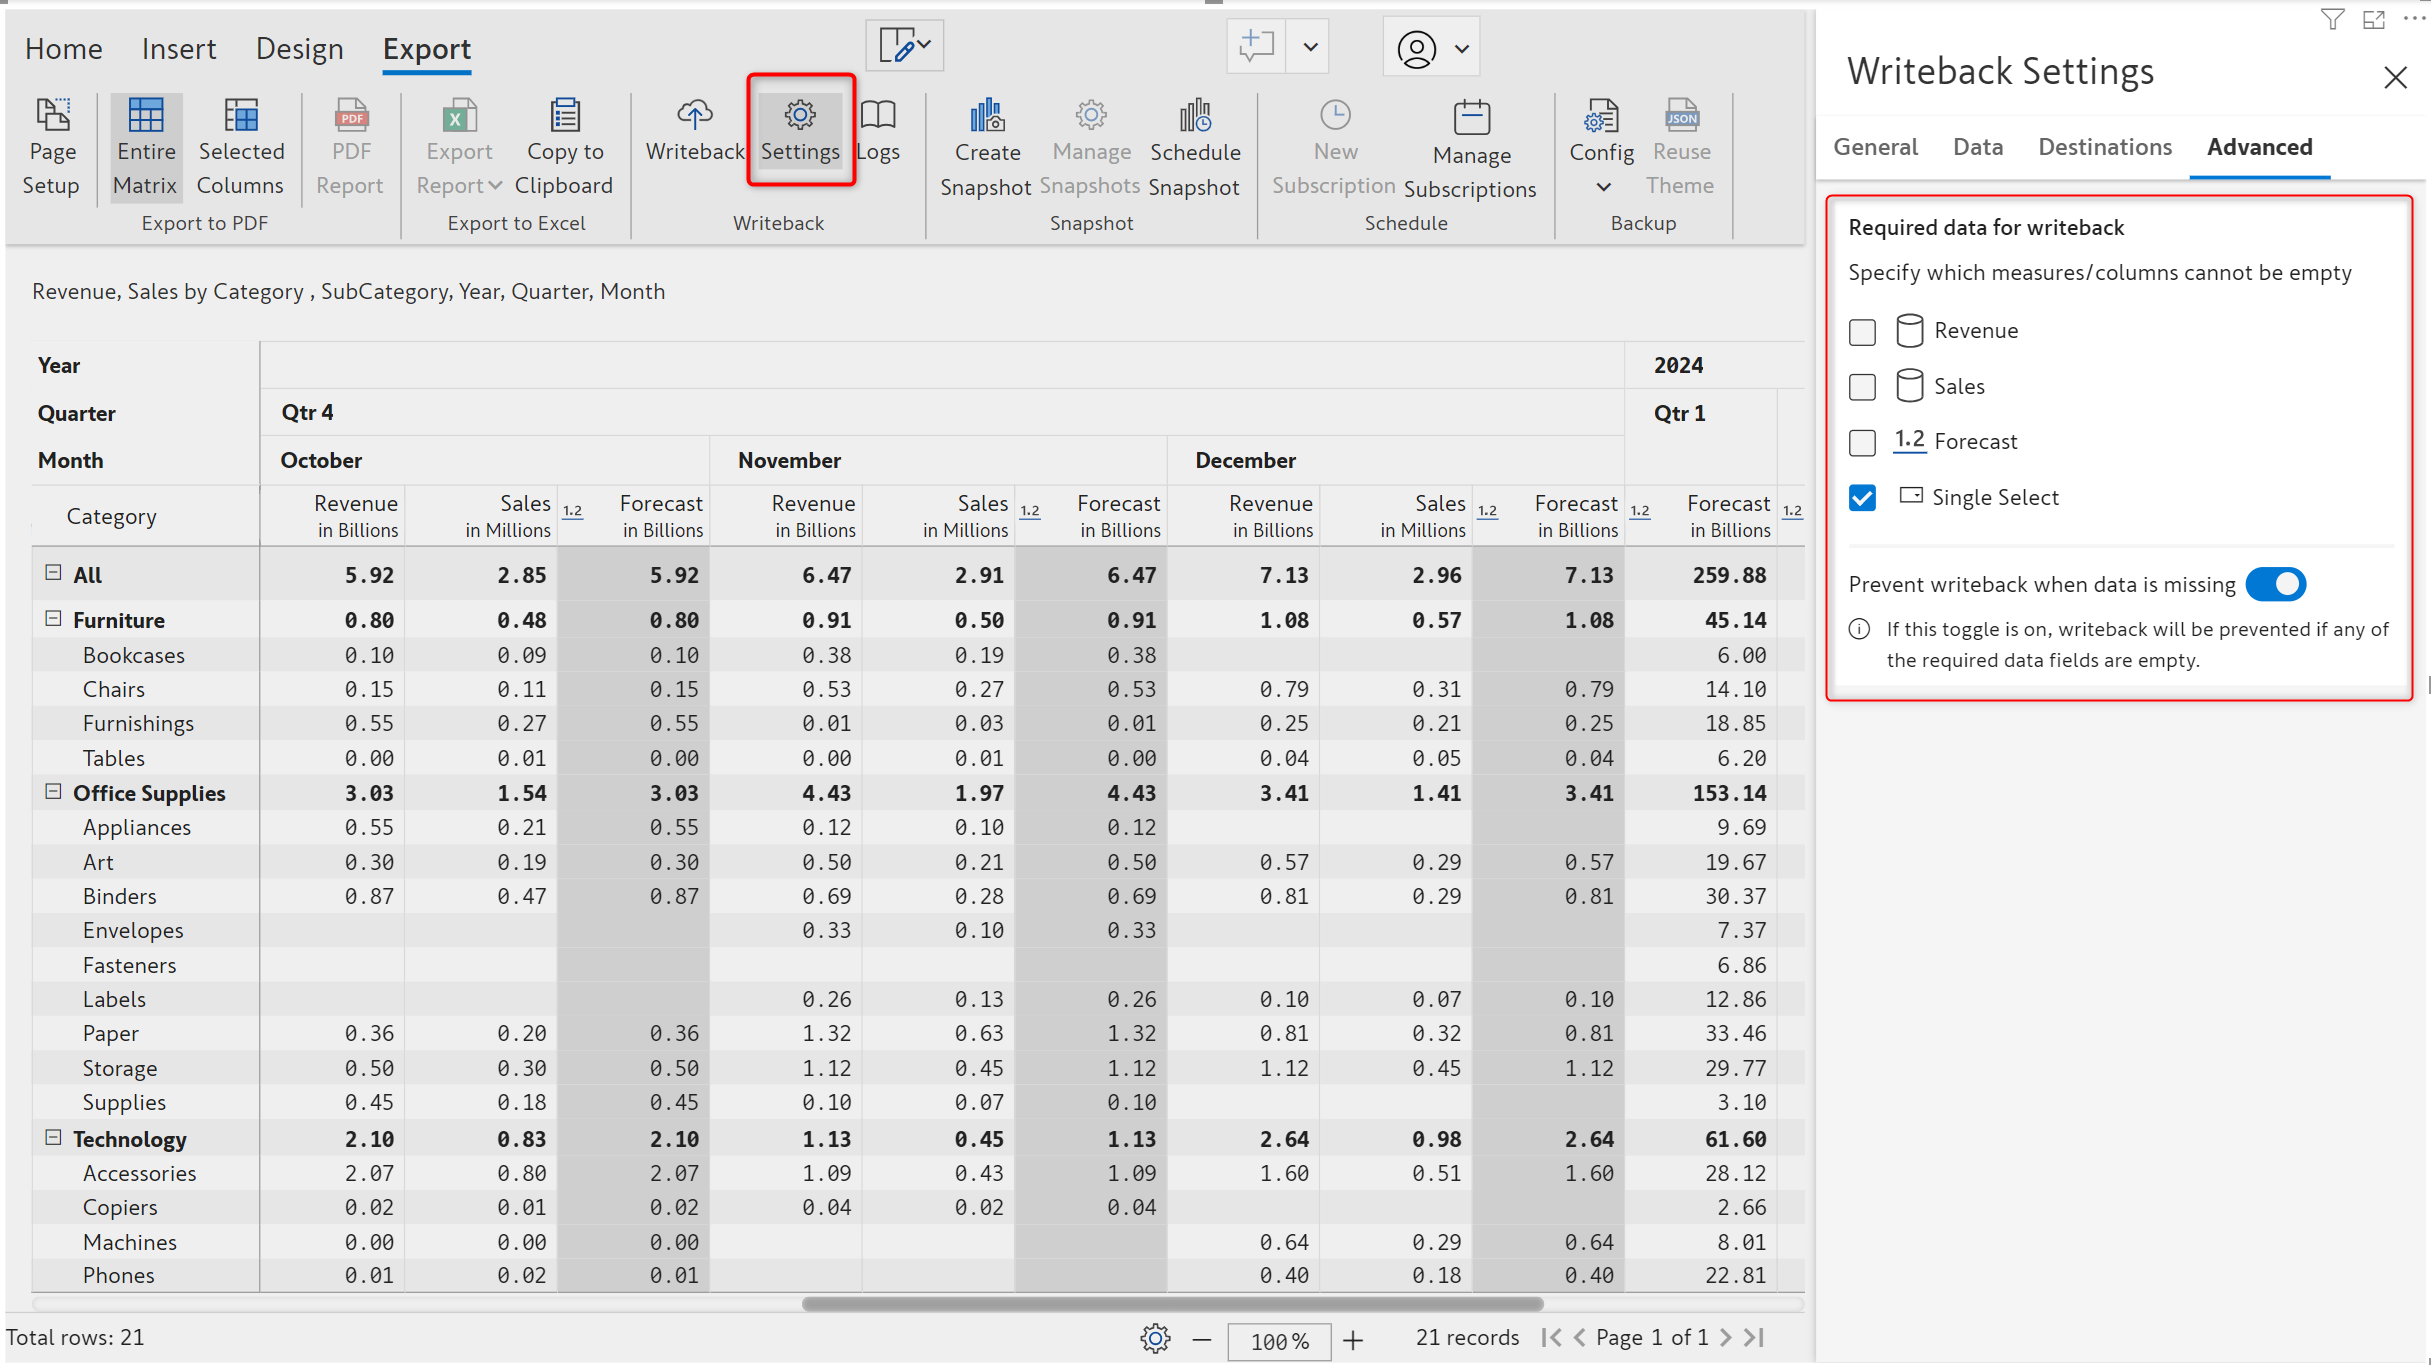
With Inforiver 2.5, you can enforce null checks and prevent empty fields from being written back to the destination database. You can either exclude empty fields from writeback or prevent writeback altogether.
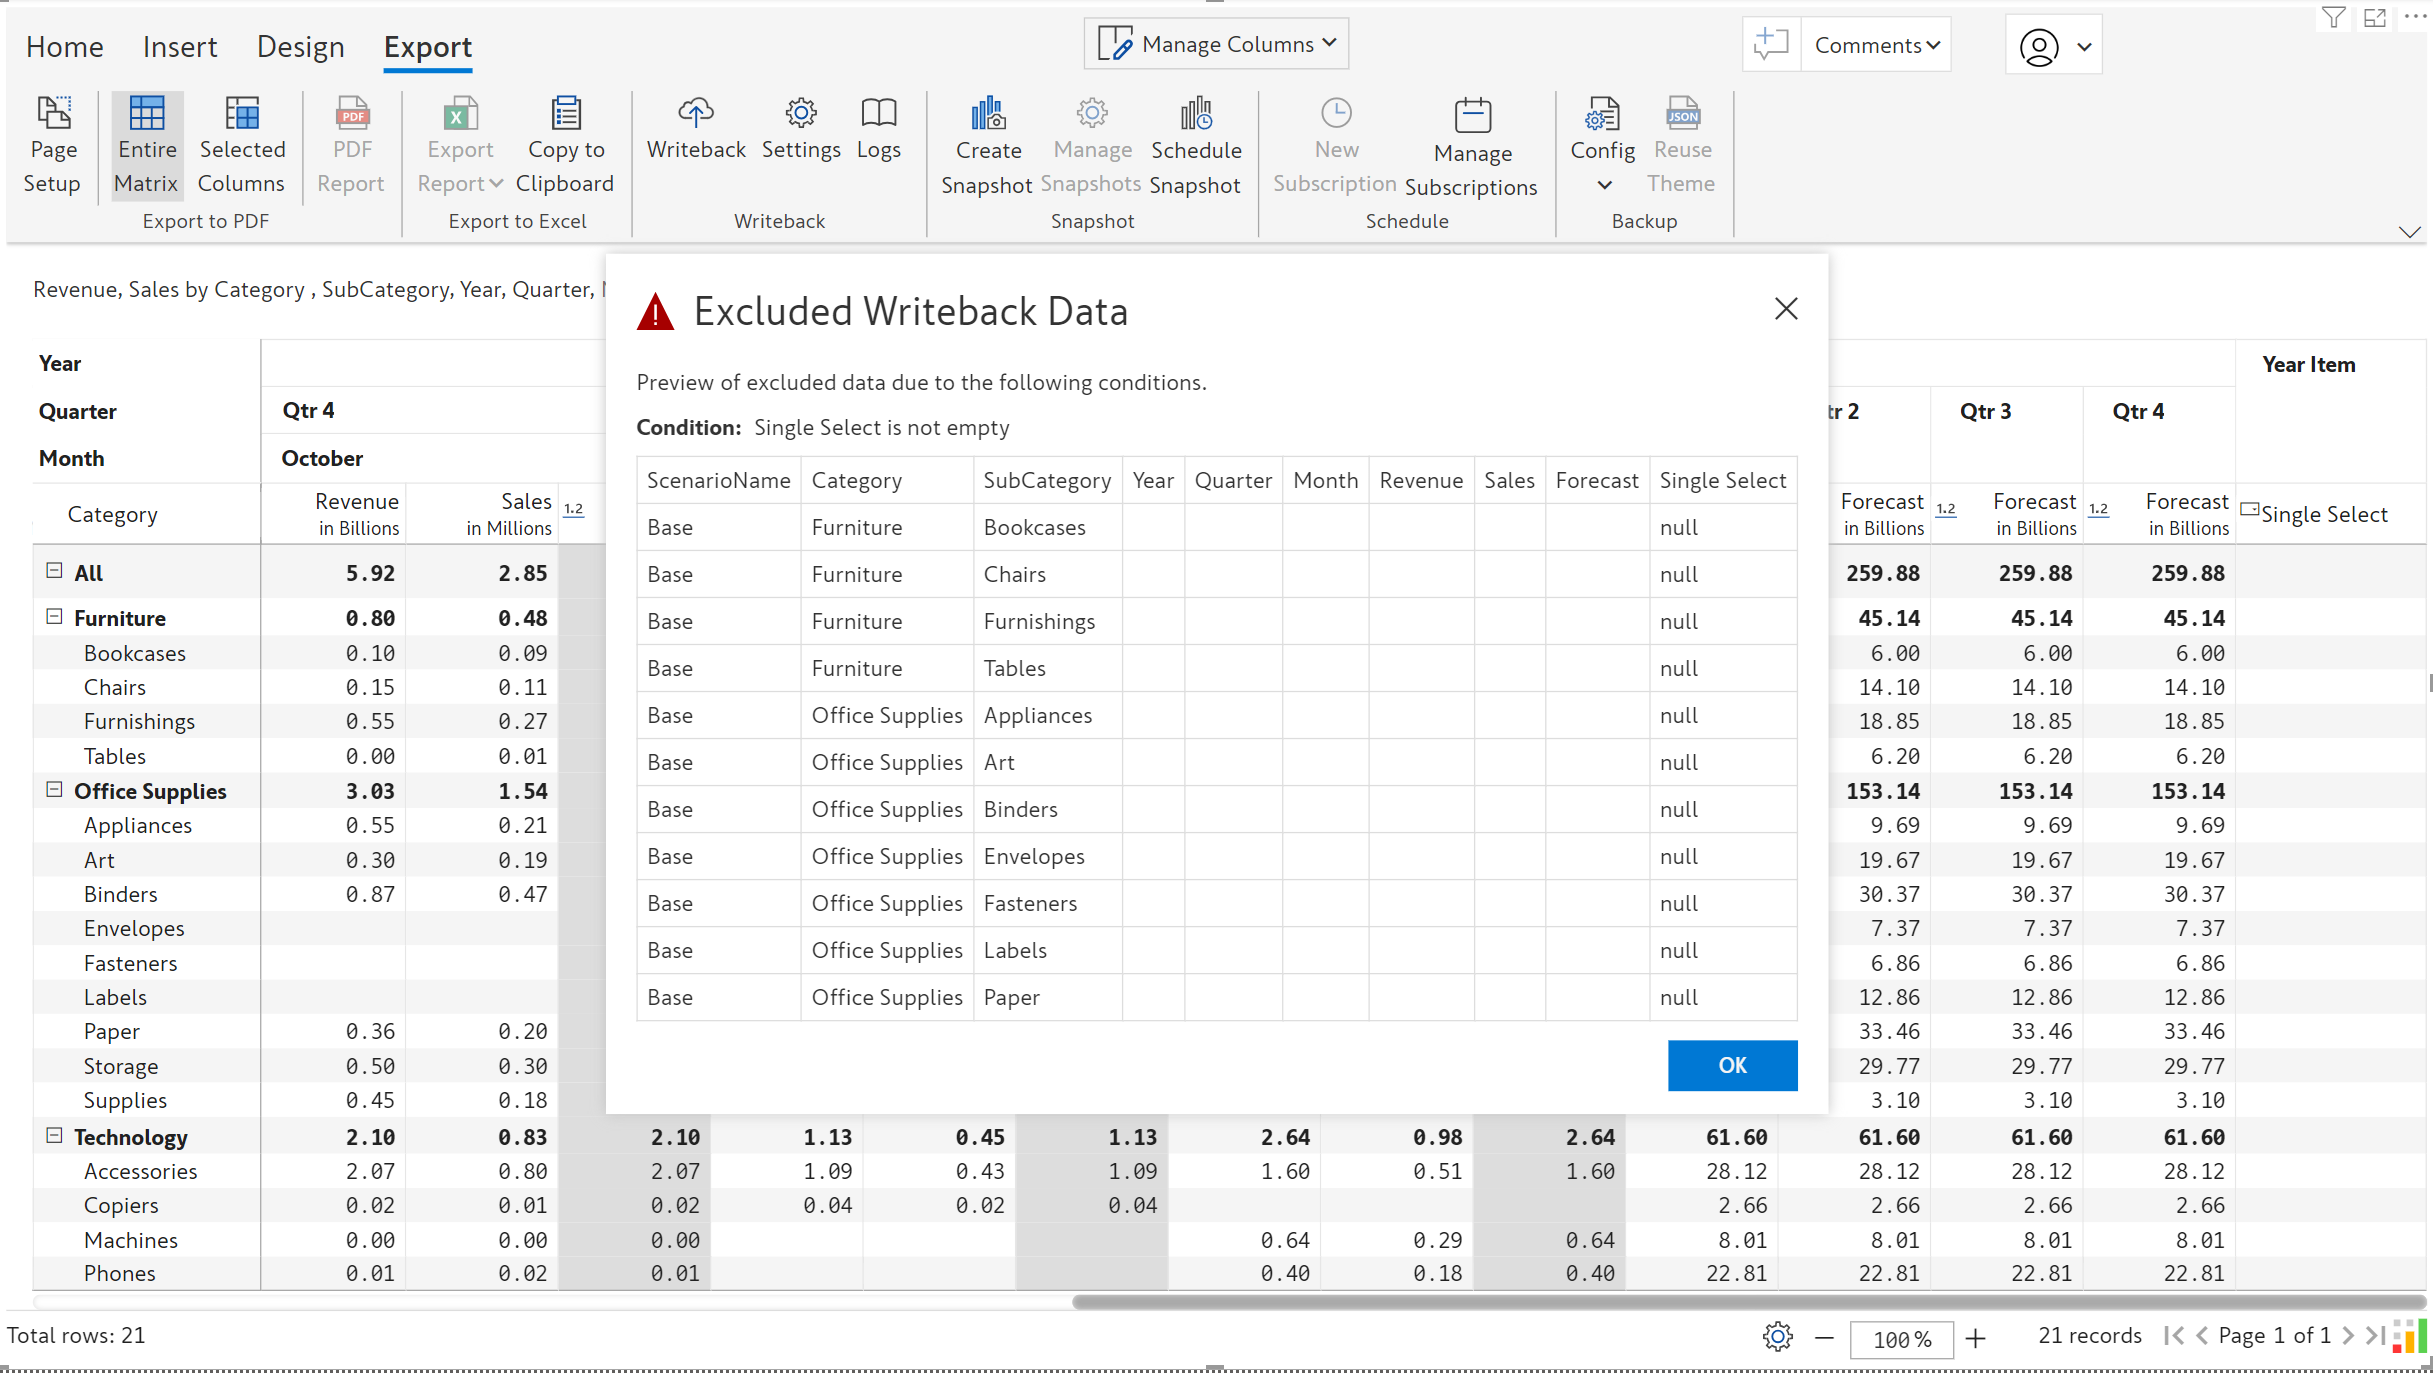
If null fields are detected during writeback, an exception notification is generated by Inforiver that gives details of empty measures/columns.
1.5. Custom filter UI upgrade
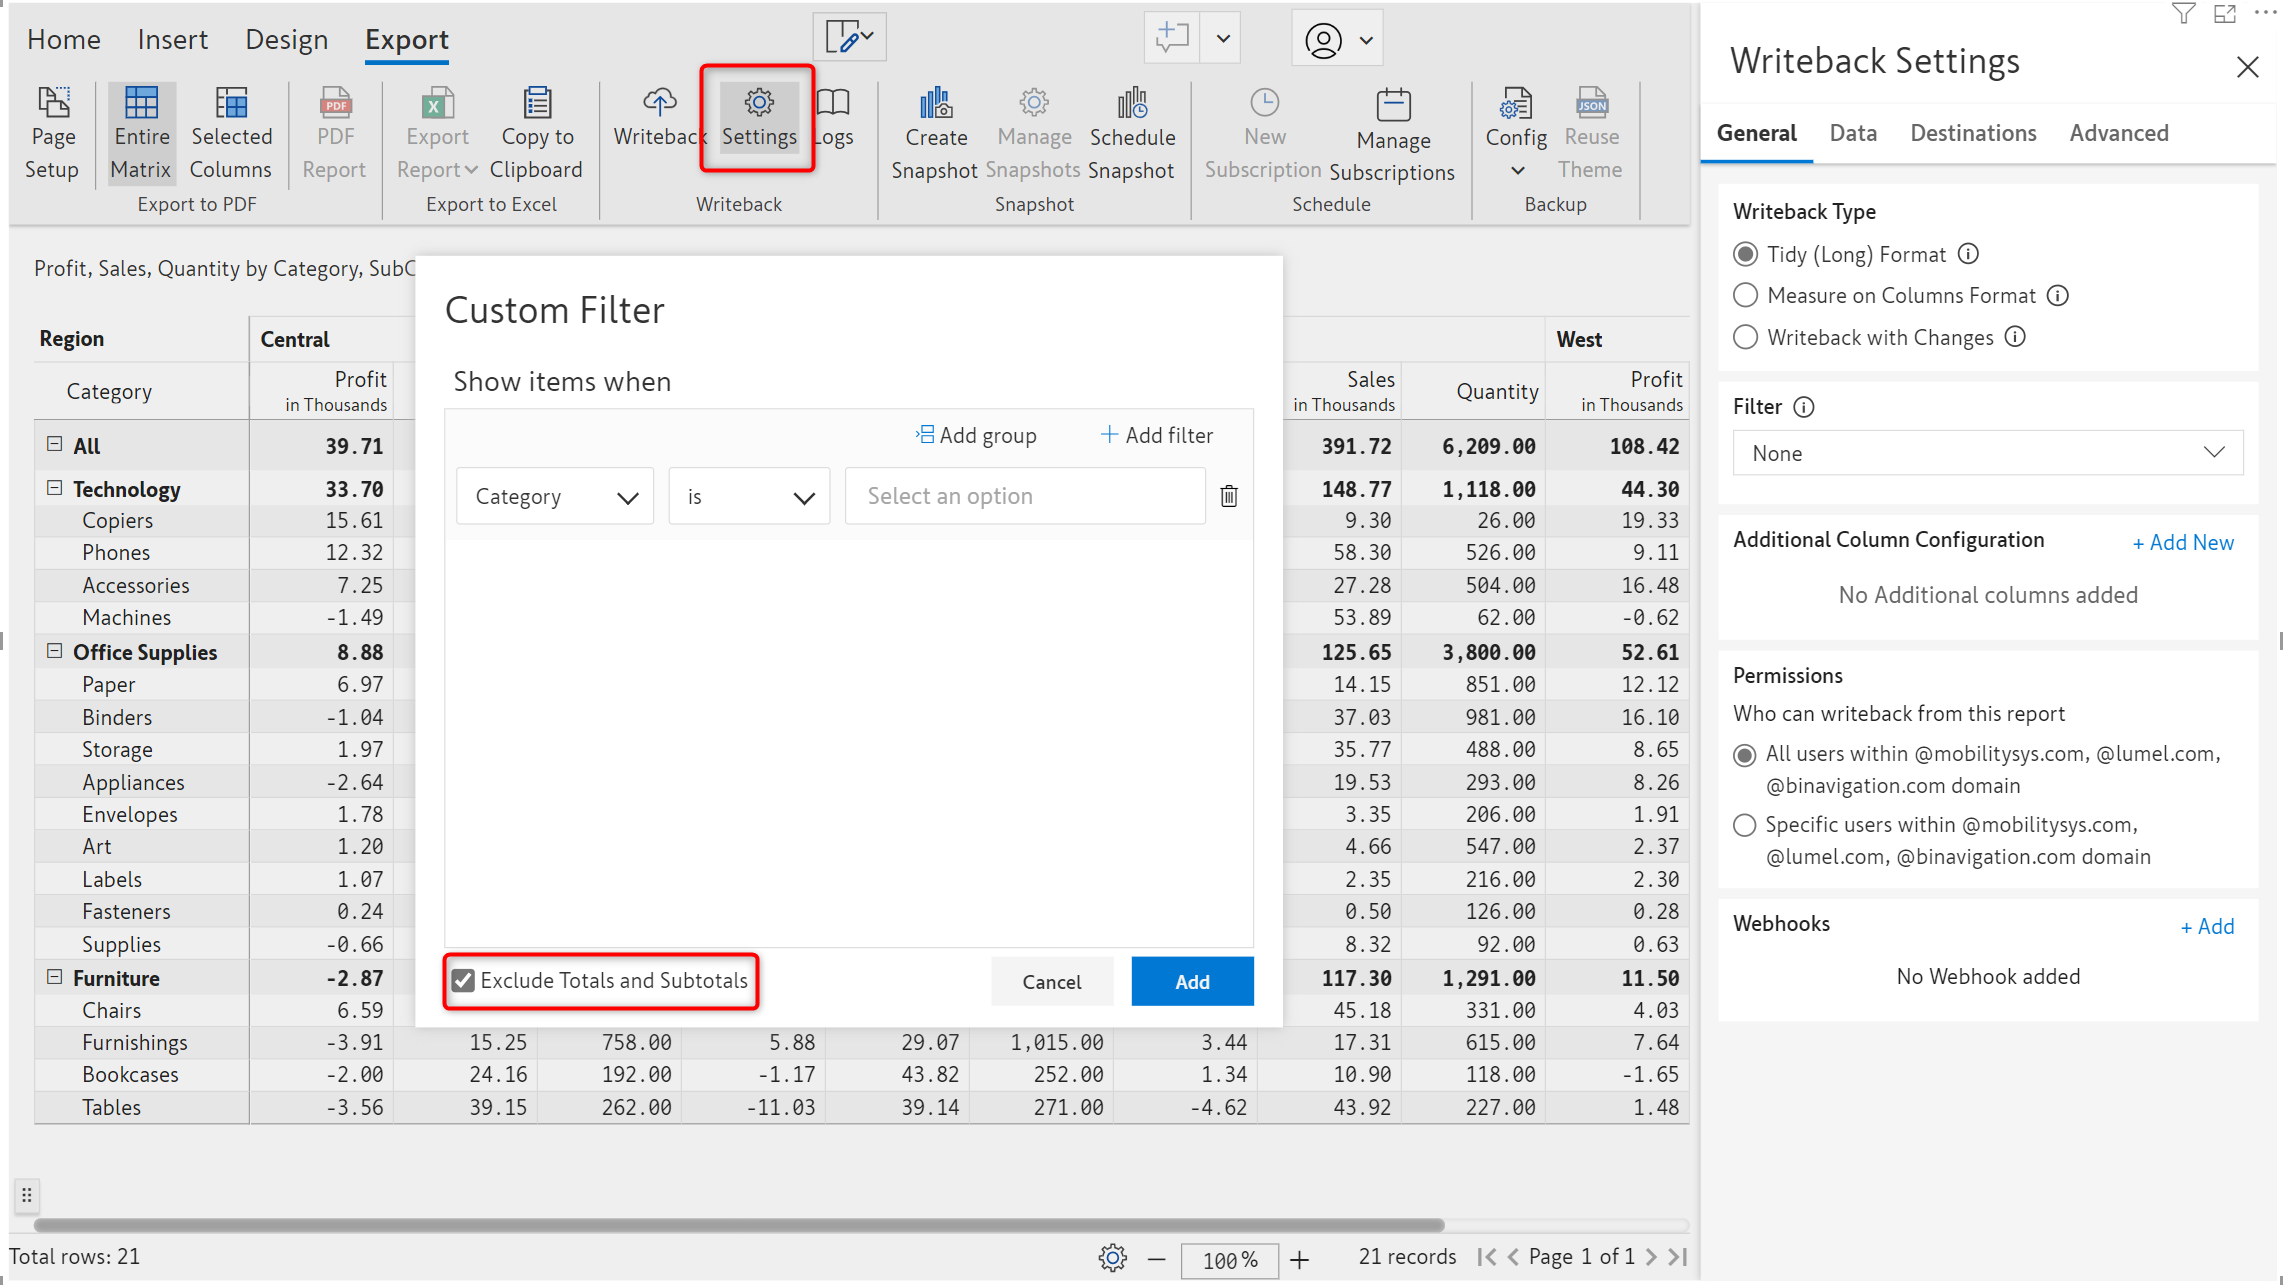
The custom filter option now has a comprehensive UI which enables you to configure filters, create filter groups and exclude totals and subtotals from writeback.
1.6. Writeback performance for Azure SQL and SQL server destinations
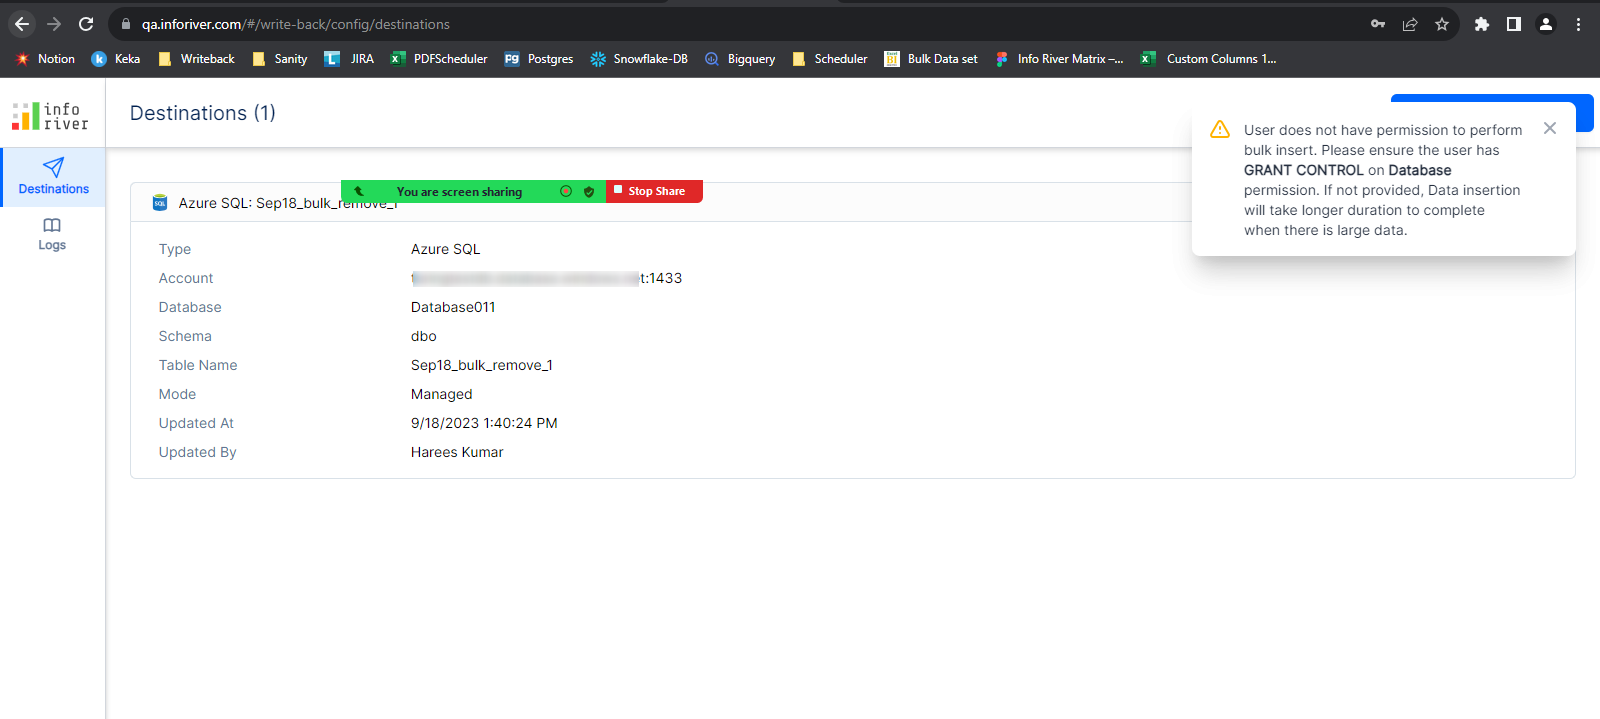
The writeback performance for Azure SQL and SQL server destinations can be significantly improved by providing the database user GRANT CONTROL over the database. This requires assistance from the database administrator. Inforiver will display a warning if the user does not have permissions to perform bulk insert
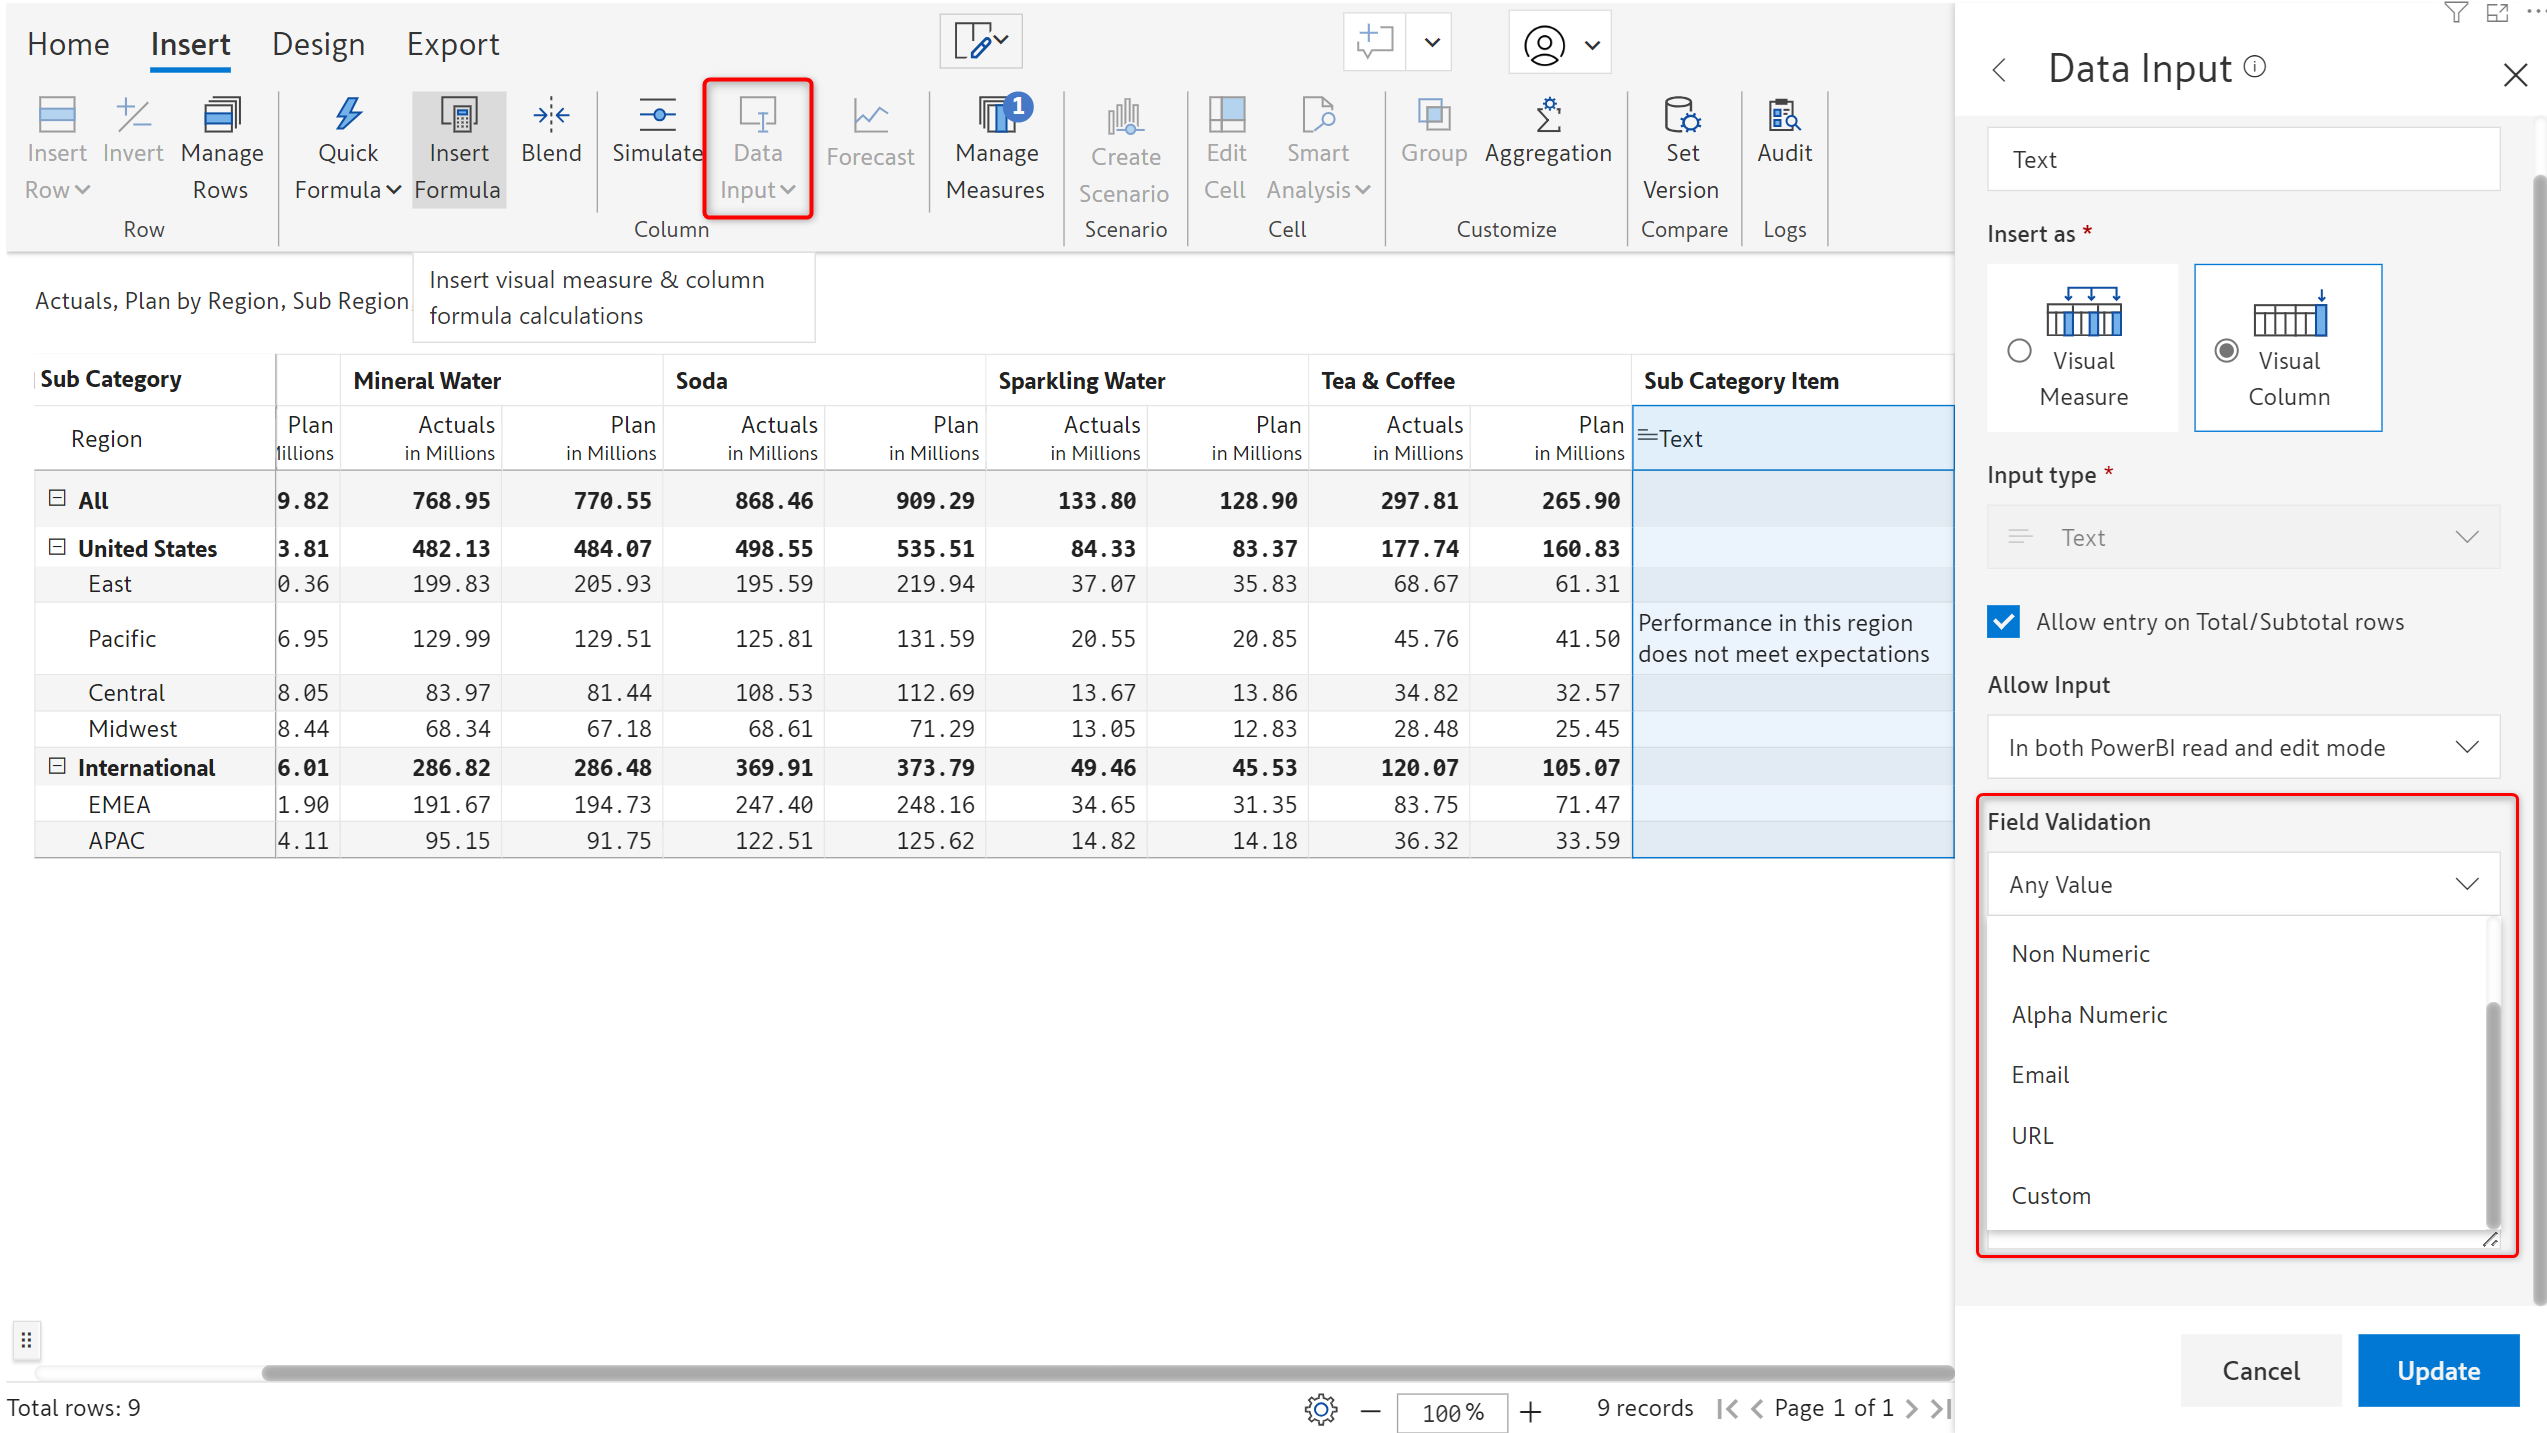
2.1. Data validations for text input fields
Text data input fields are now more robust with built-in data validations. You can perform data type checks for numeric or text data, validate emails and URLs, you can even use regular expressions to verify input data.
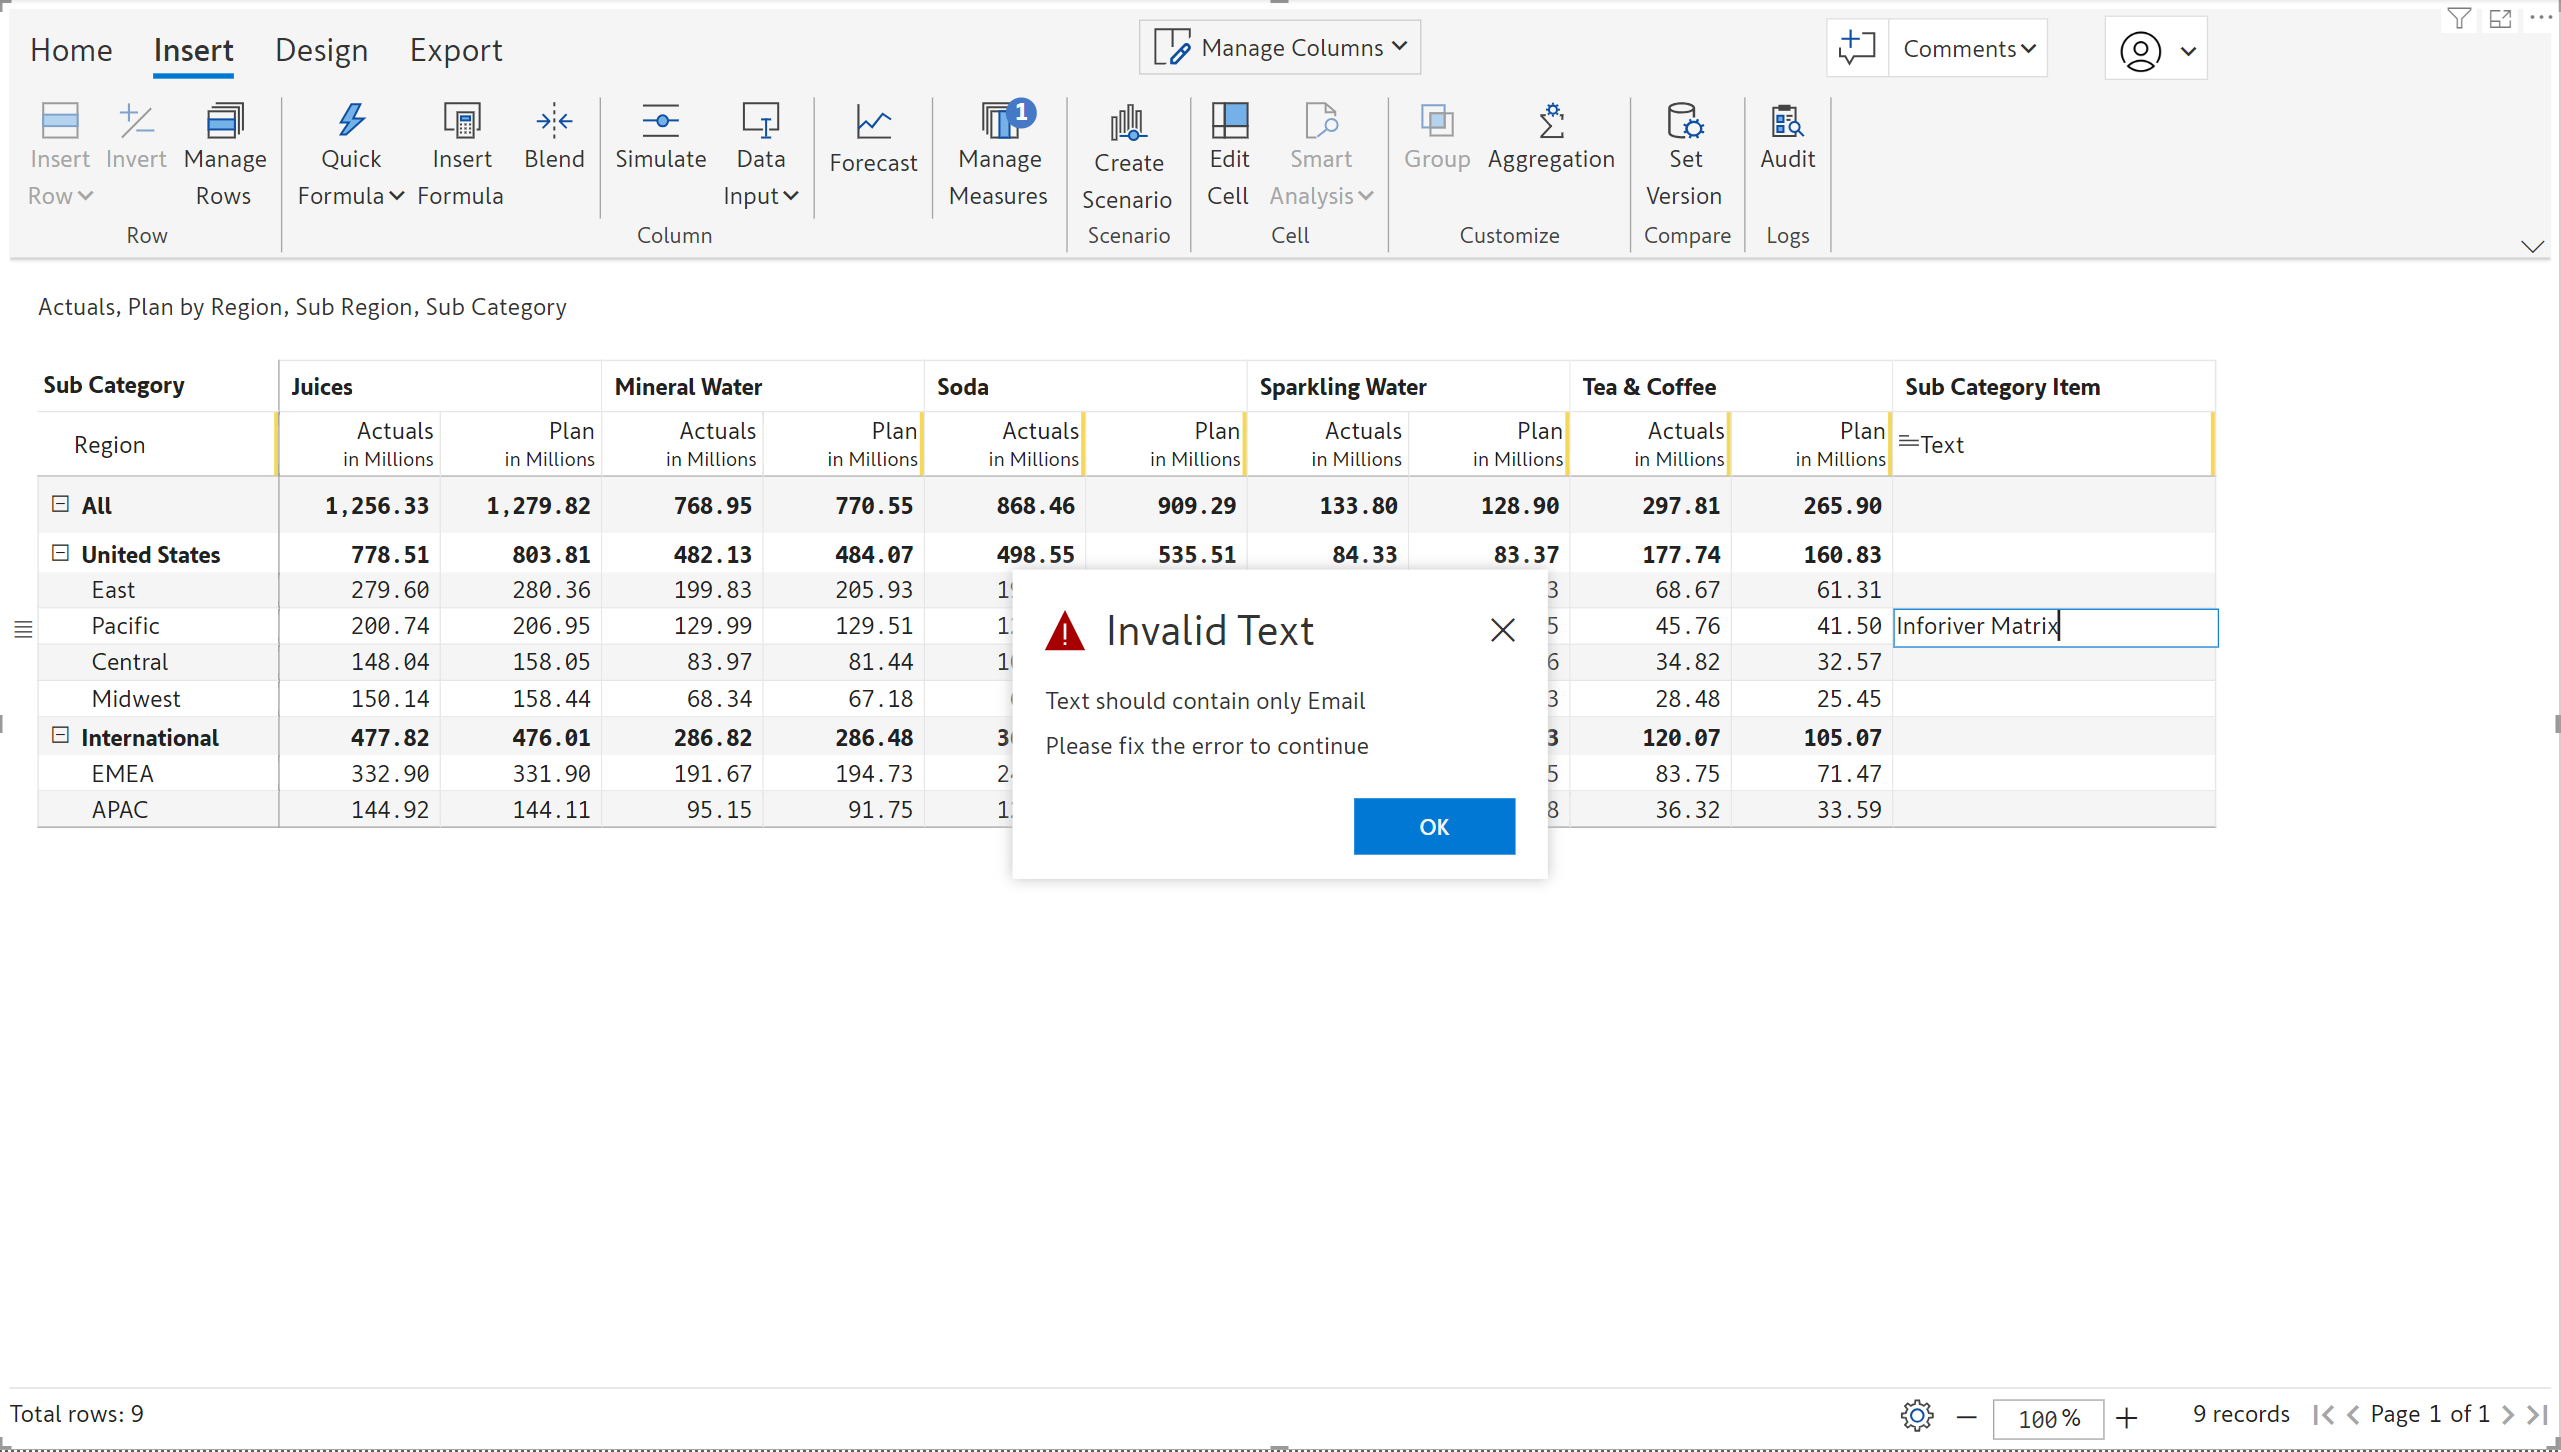
If the data entered does not conform to the validation rule, Inforiver will generate error notifications based on the validation.
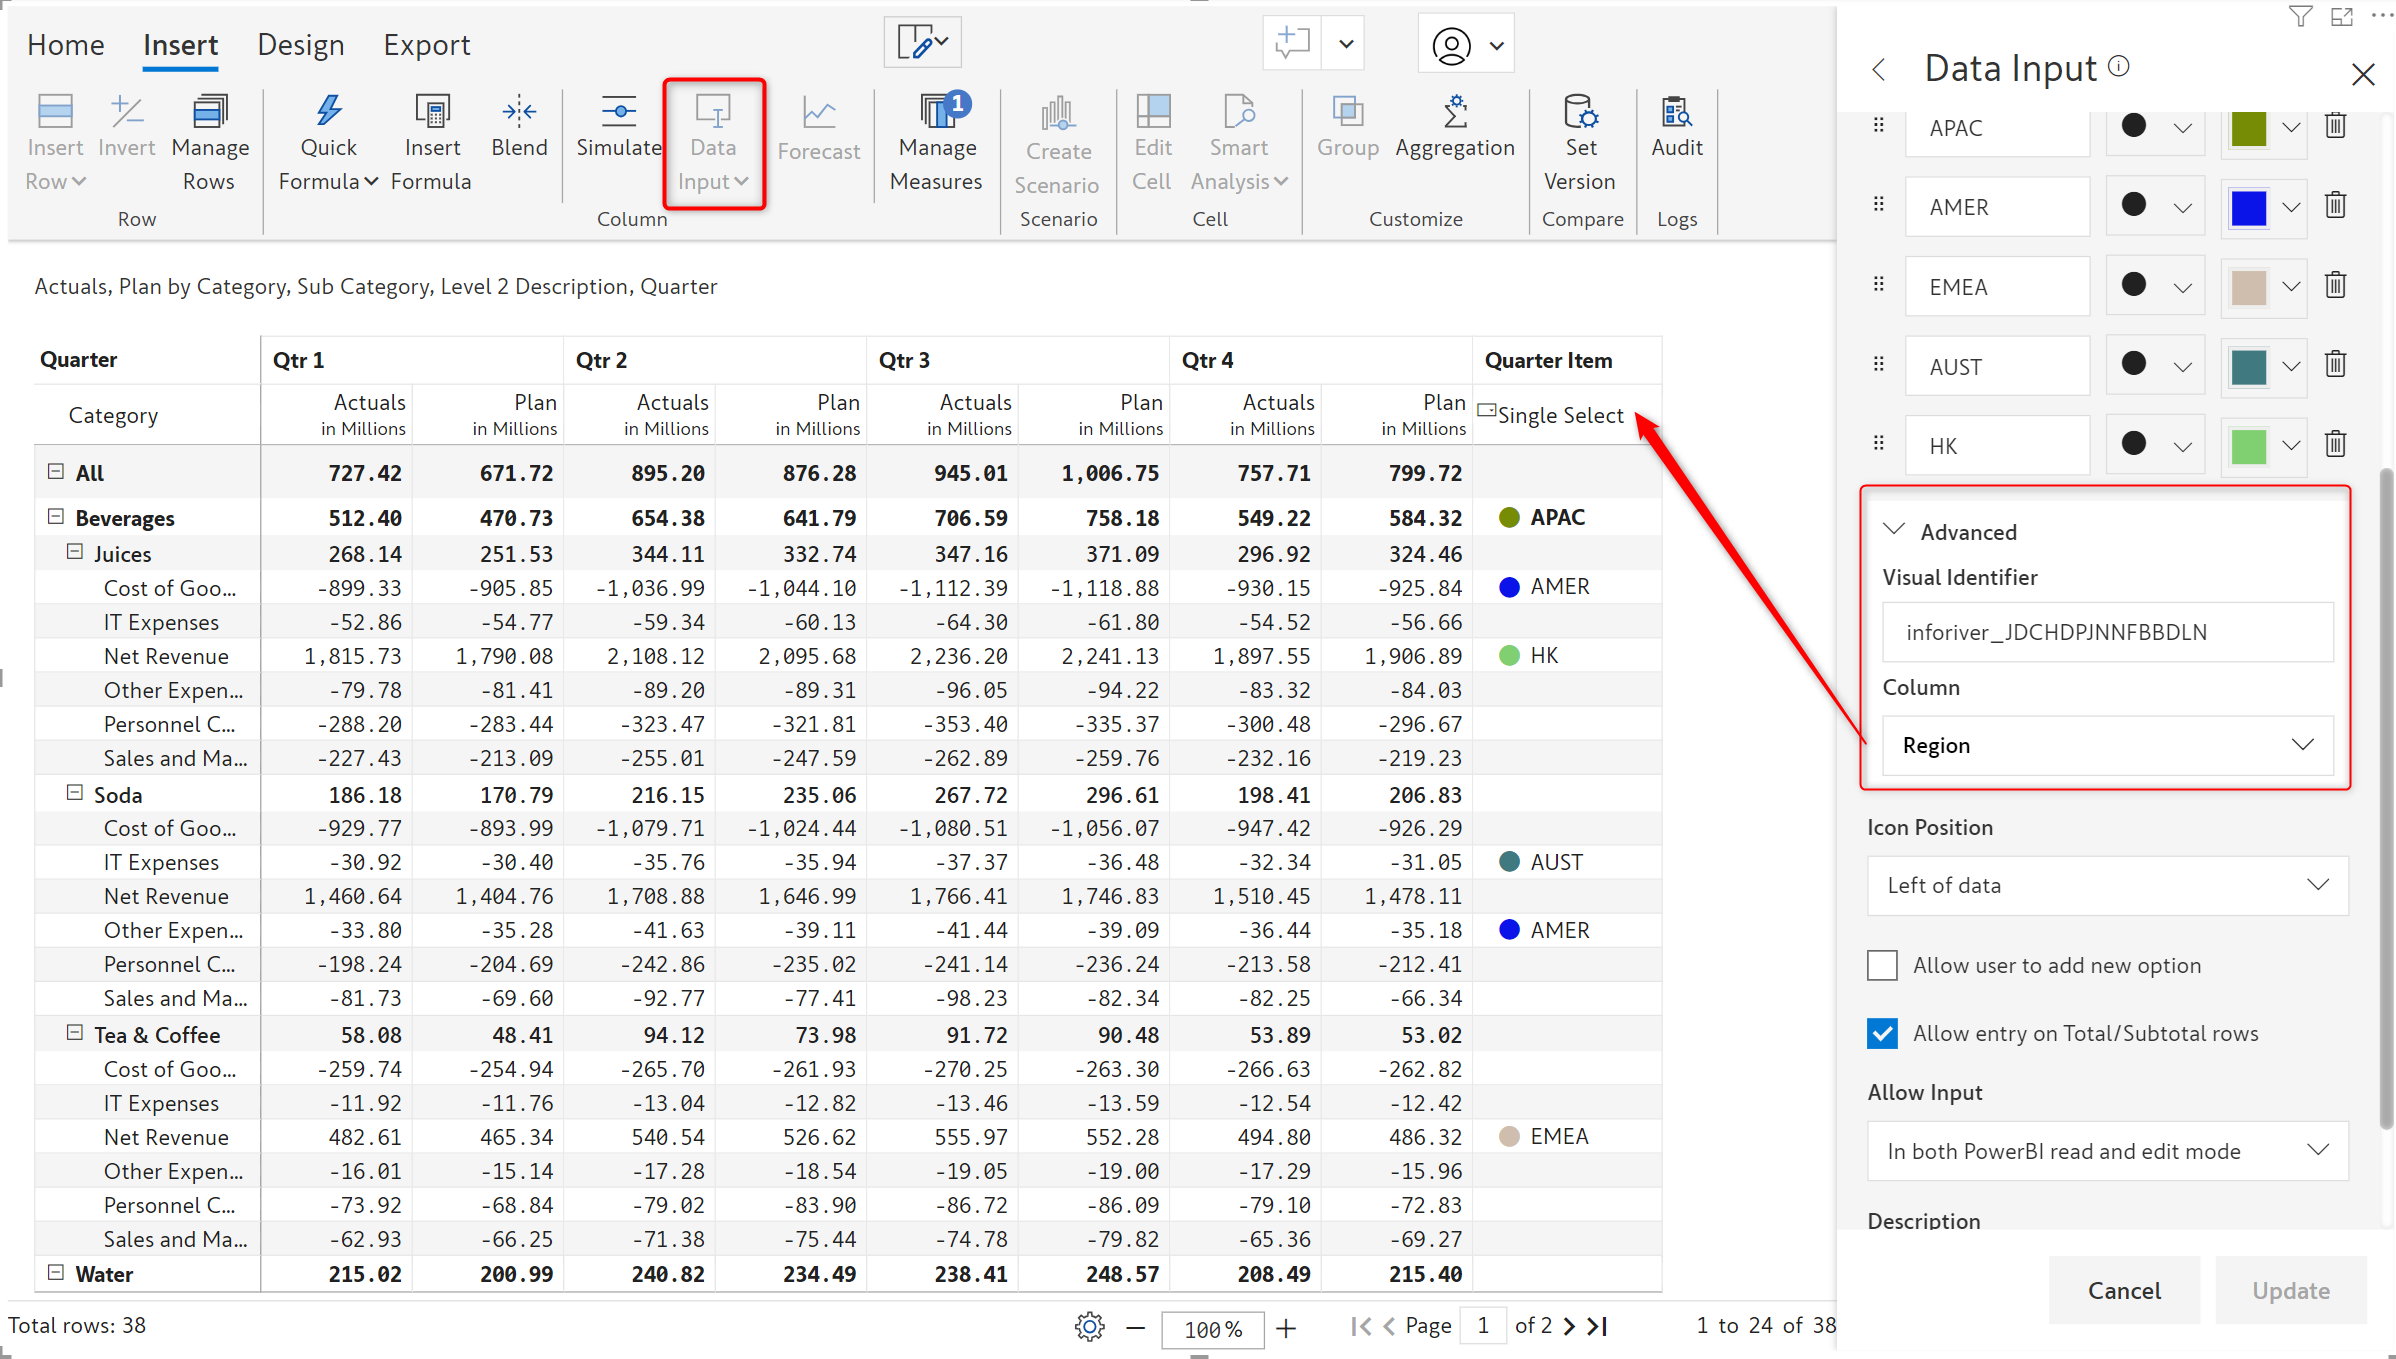
2.2. Dynamic dropdowns from text fields
For single and multi-select data input columns, Inforiver 2.5. makes it possible for you to source the list of values from text columns in the same visual or from different visuals.
2.3. Replicating non-numeric data types
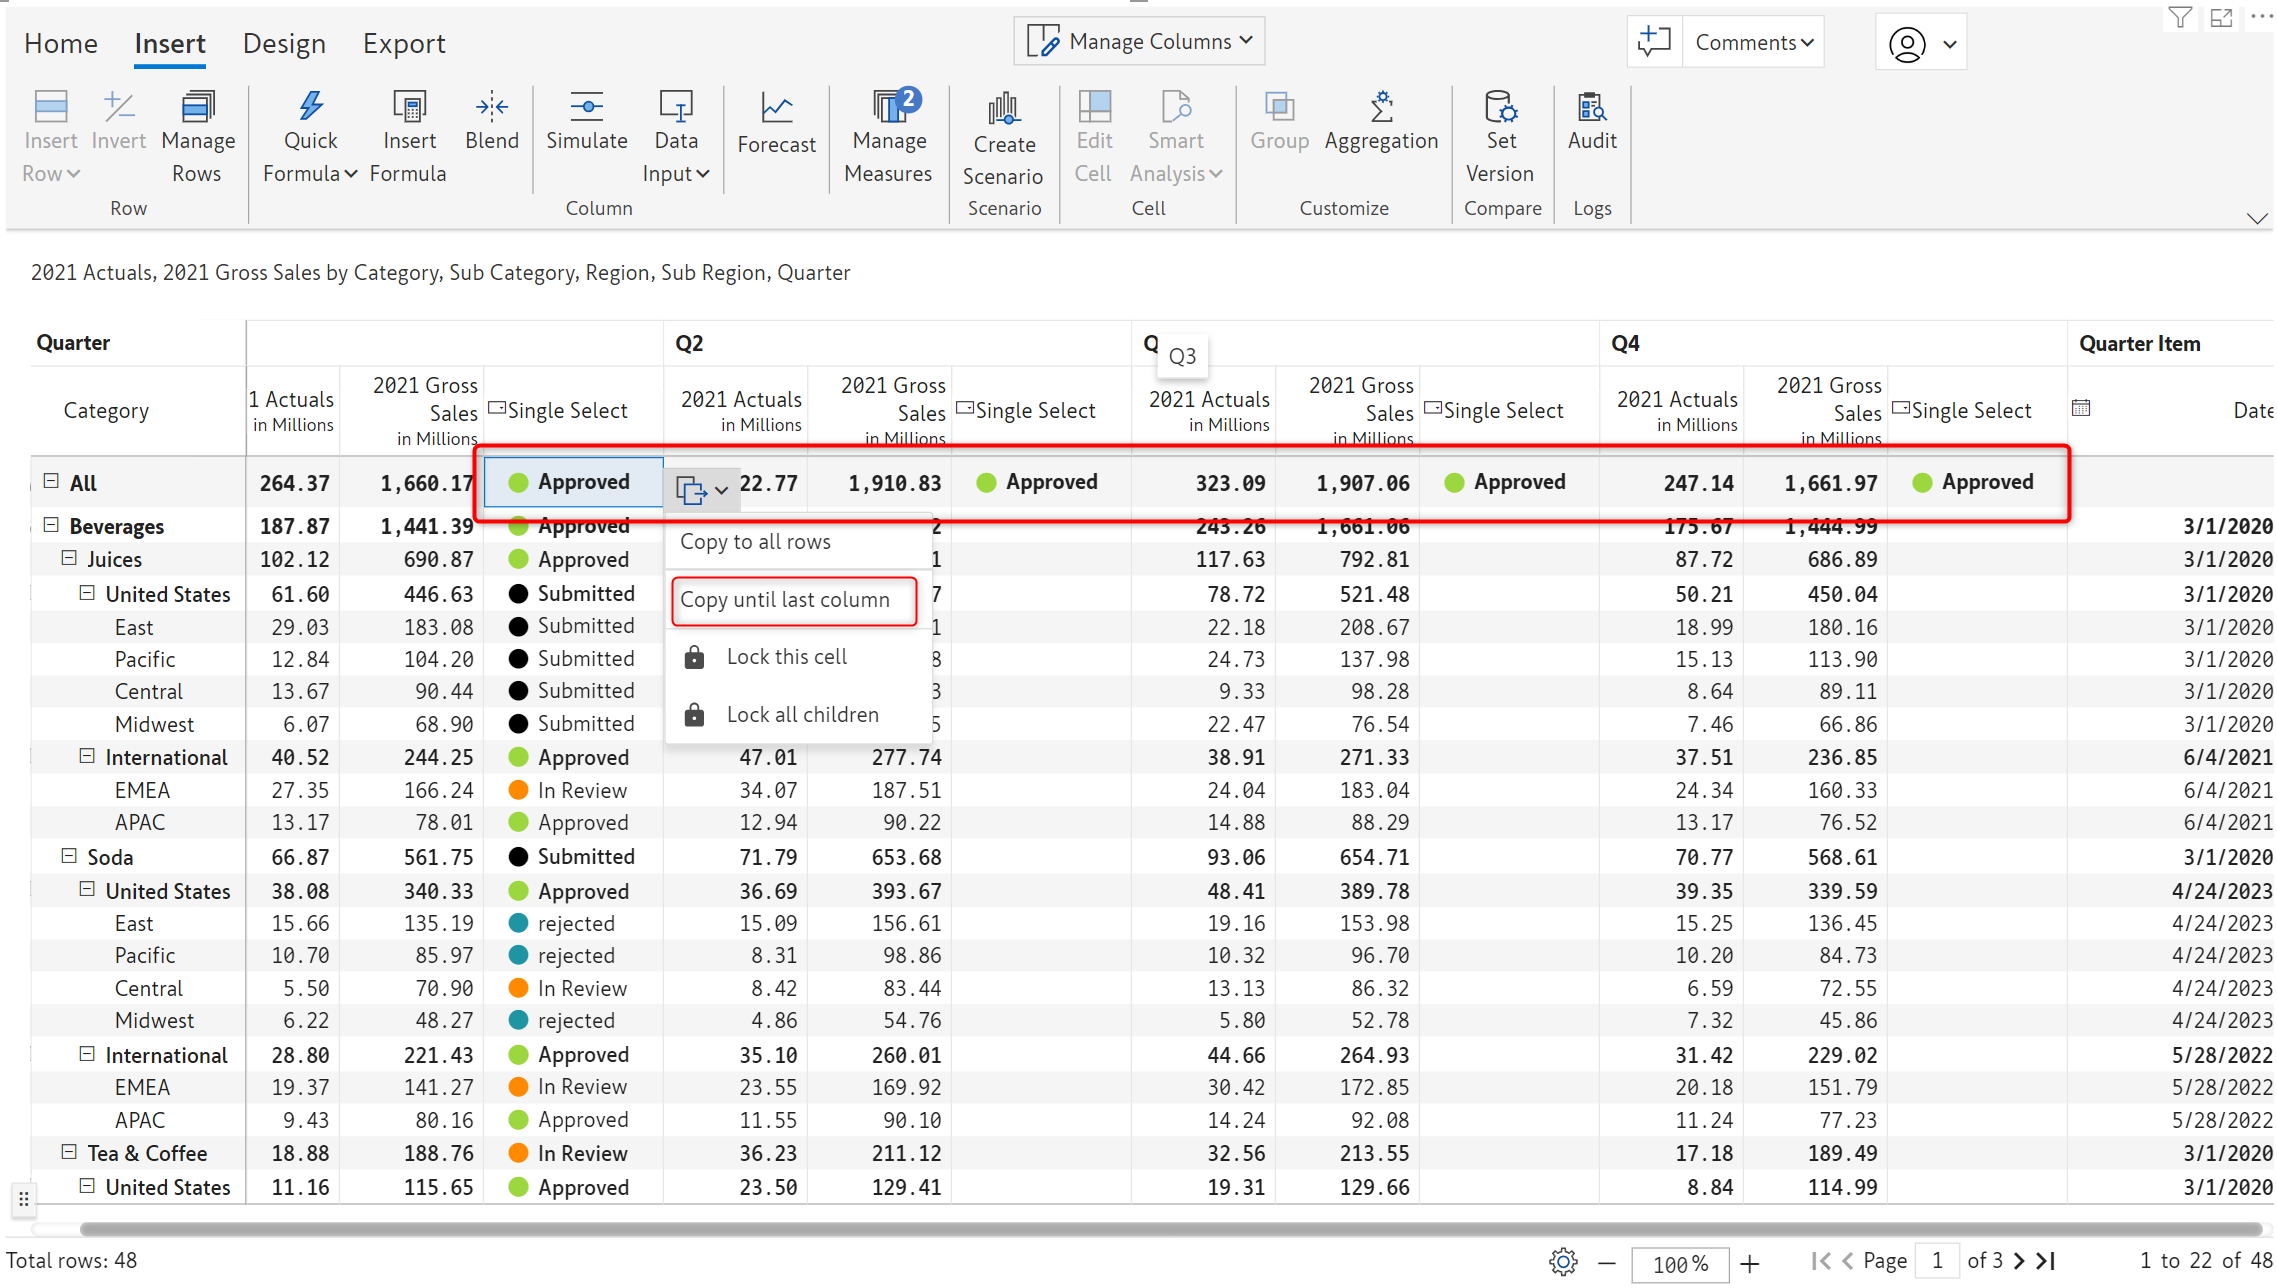
The handy ‘Copy to all rows’ options can be employed to rapidly replicate non-numeric data input values. Values can be auto filled across a given level in a hierarchy or across the entire dataset.
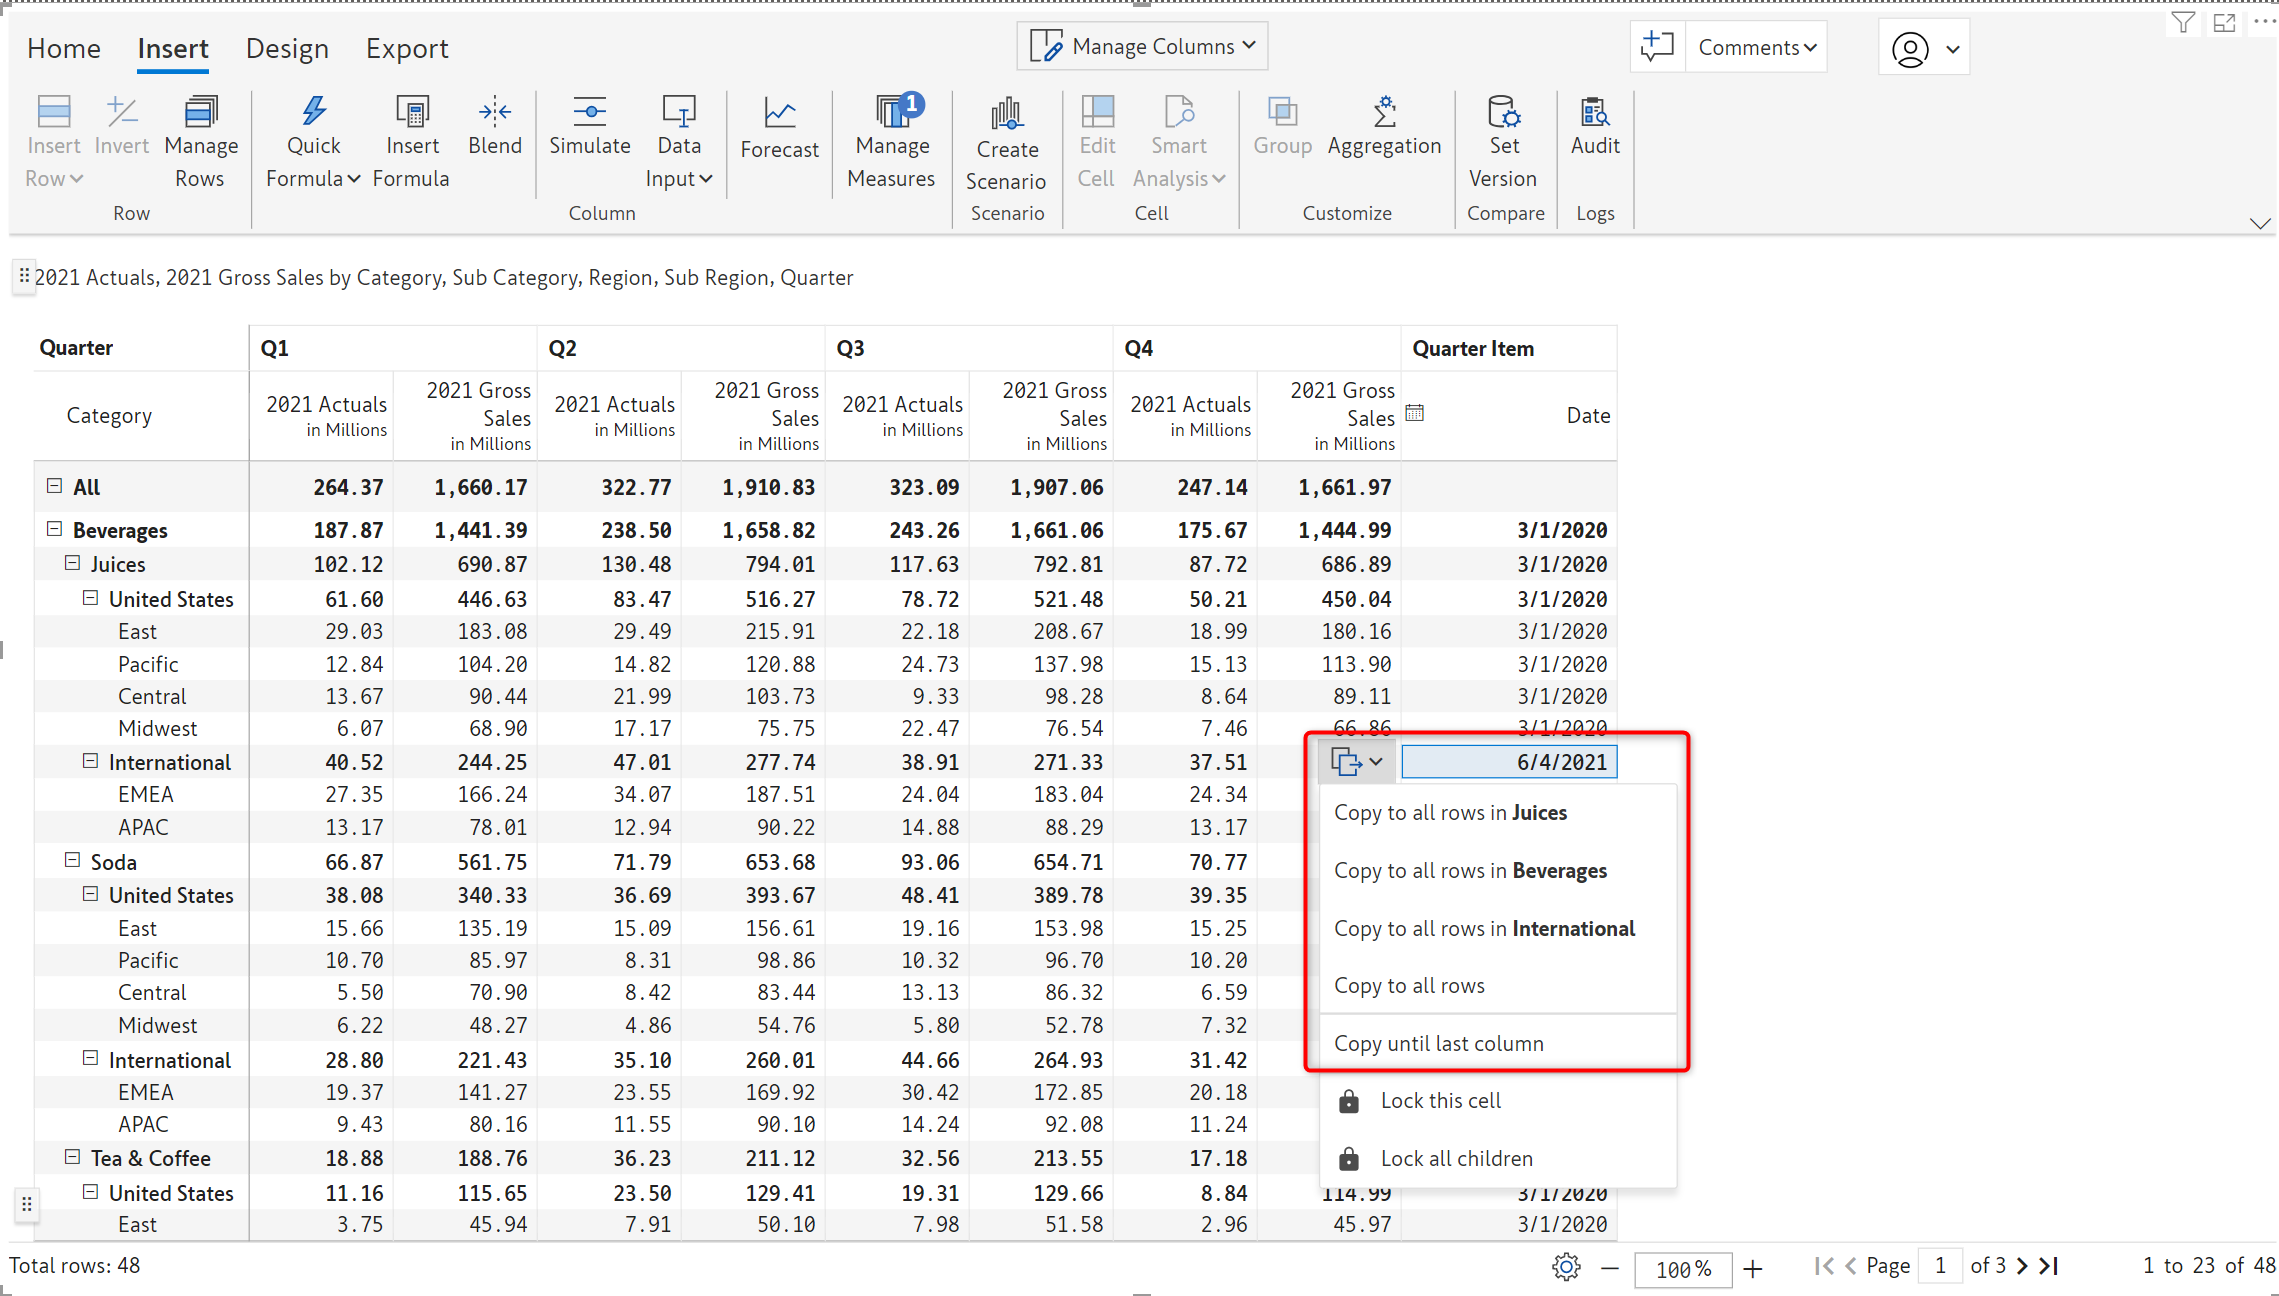
The ‘Copy until last column’ will replicate the values across all the columns for a particular row.
2.4. Control over inserting dynamic items
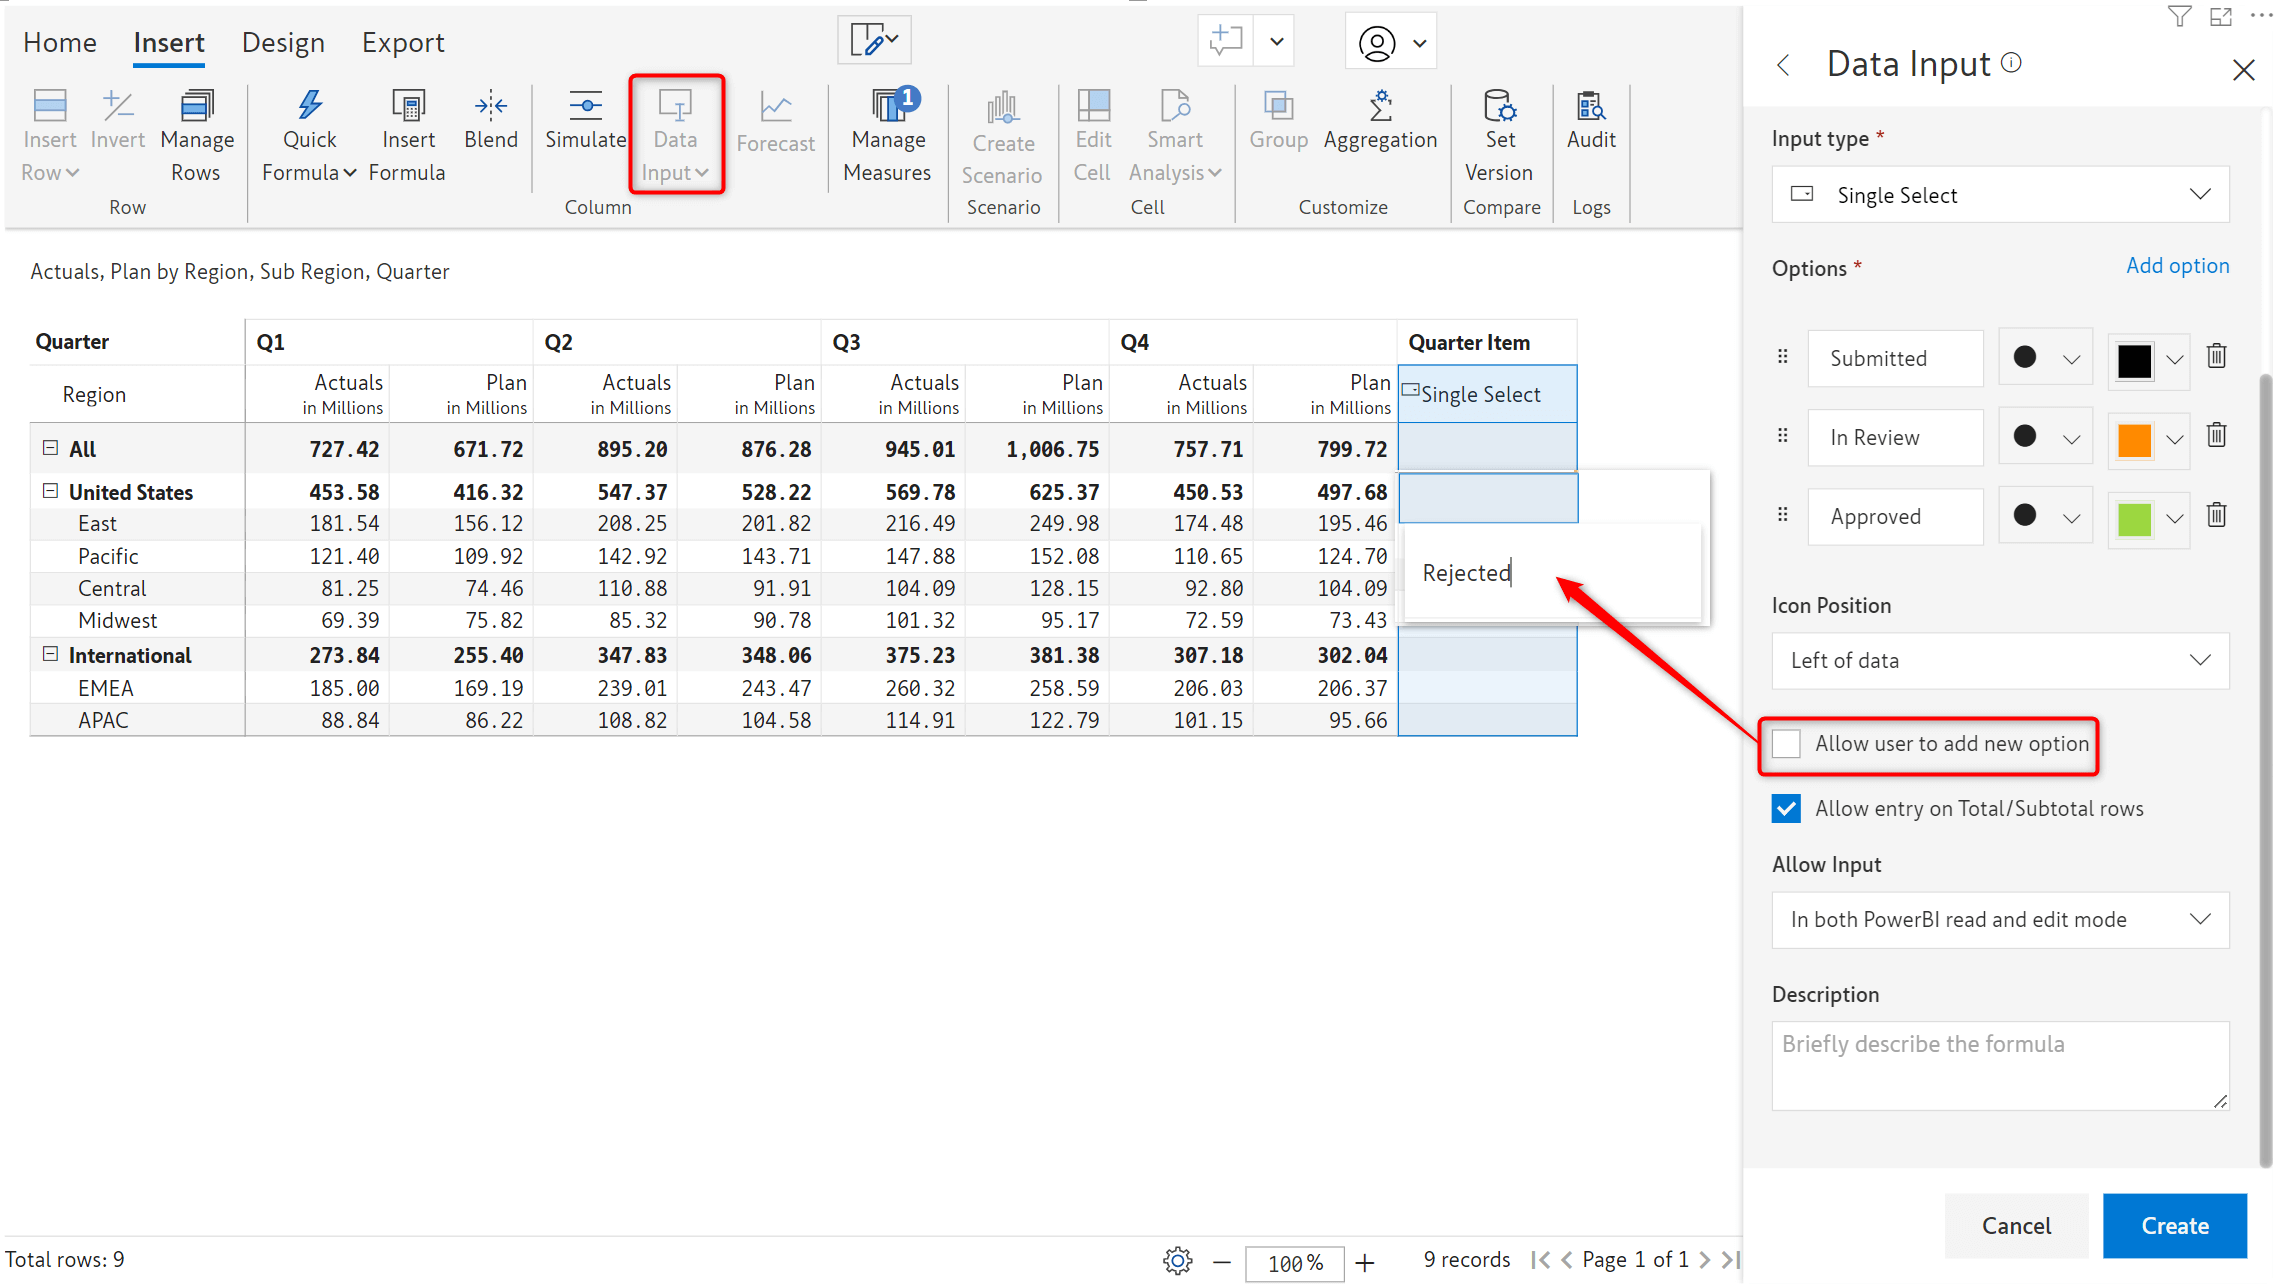
For single and multi-select data input fields, you can restrict users from adding values which are not available in the list. Uncheck the ‘Allow user to add new option’ if you opt to maintain a static list.
2.5. Clone properties for numeric data input fields
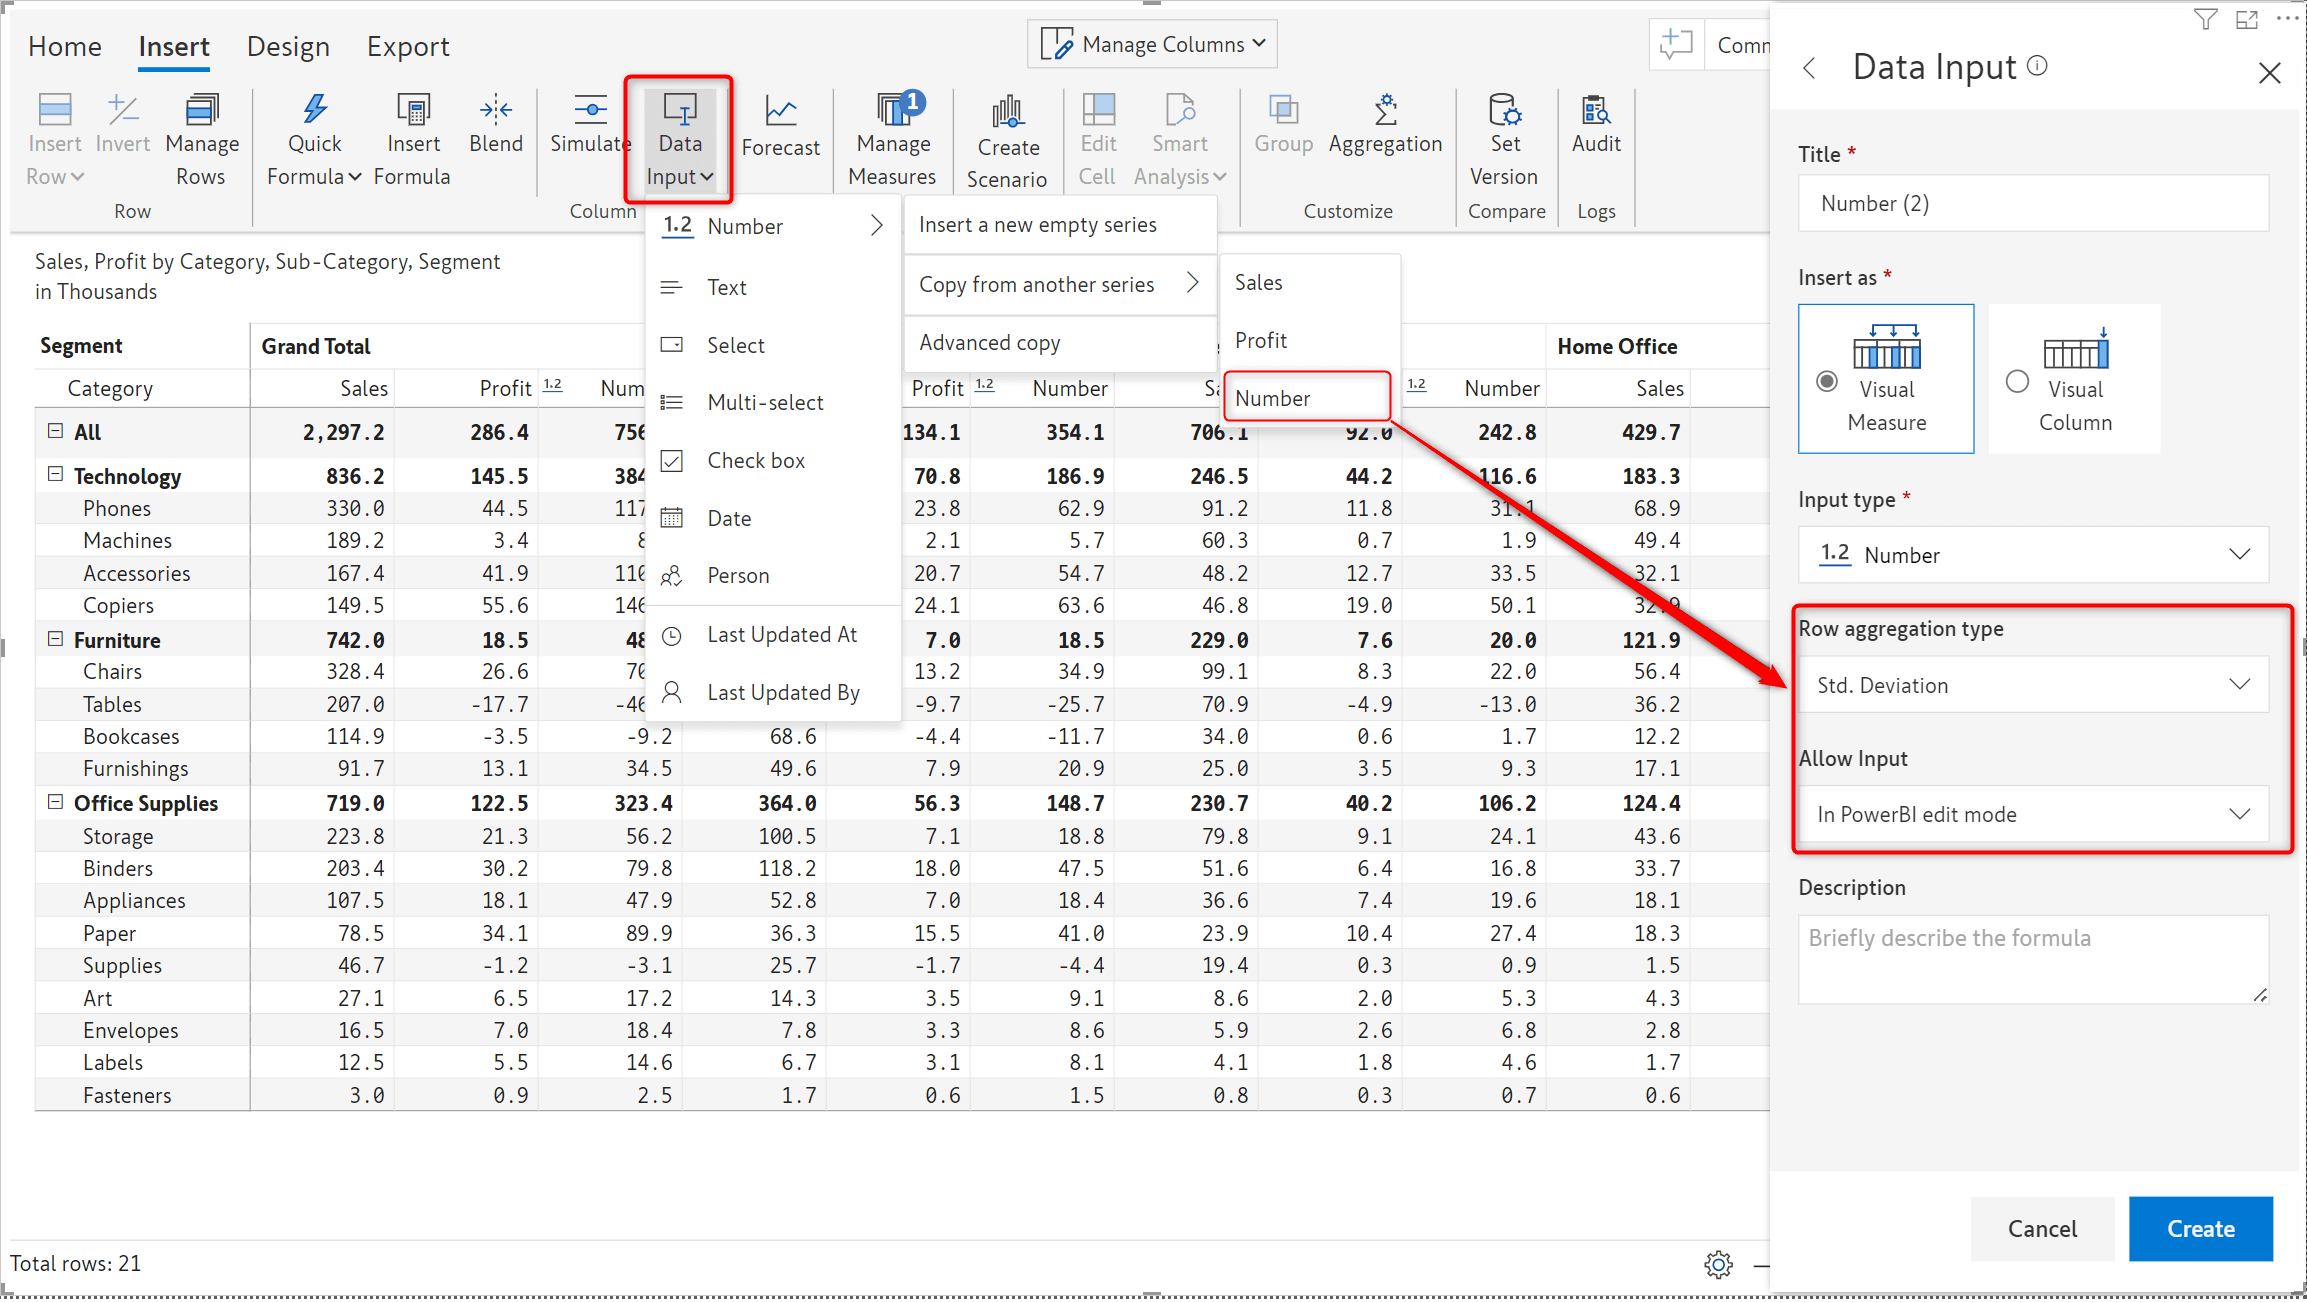
You can now easily clone numeric data input fields. Attributes such as Row aggregation type, Allow Input, Minimum and Maximum are also propagated along with the values when the new measure/column is created.
3.1. Data driven forecasts
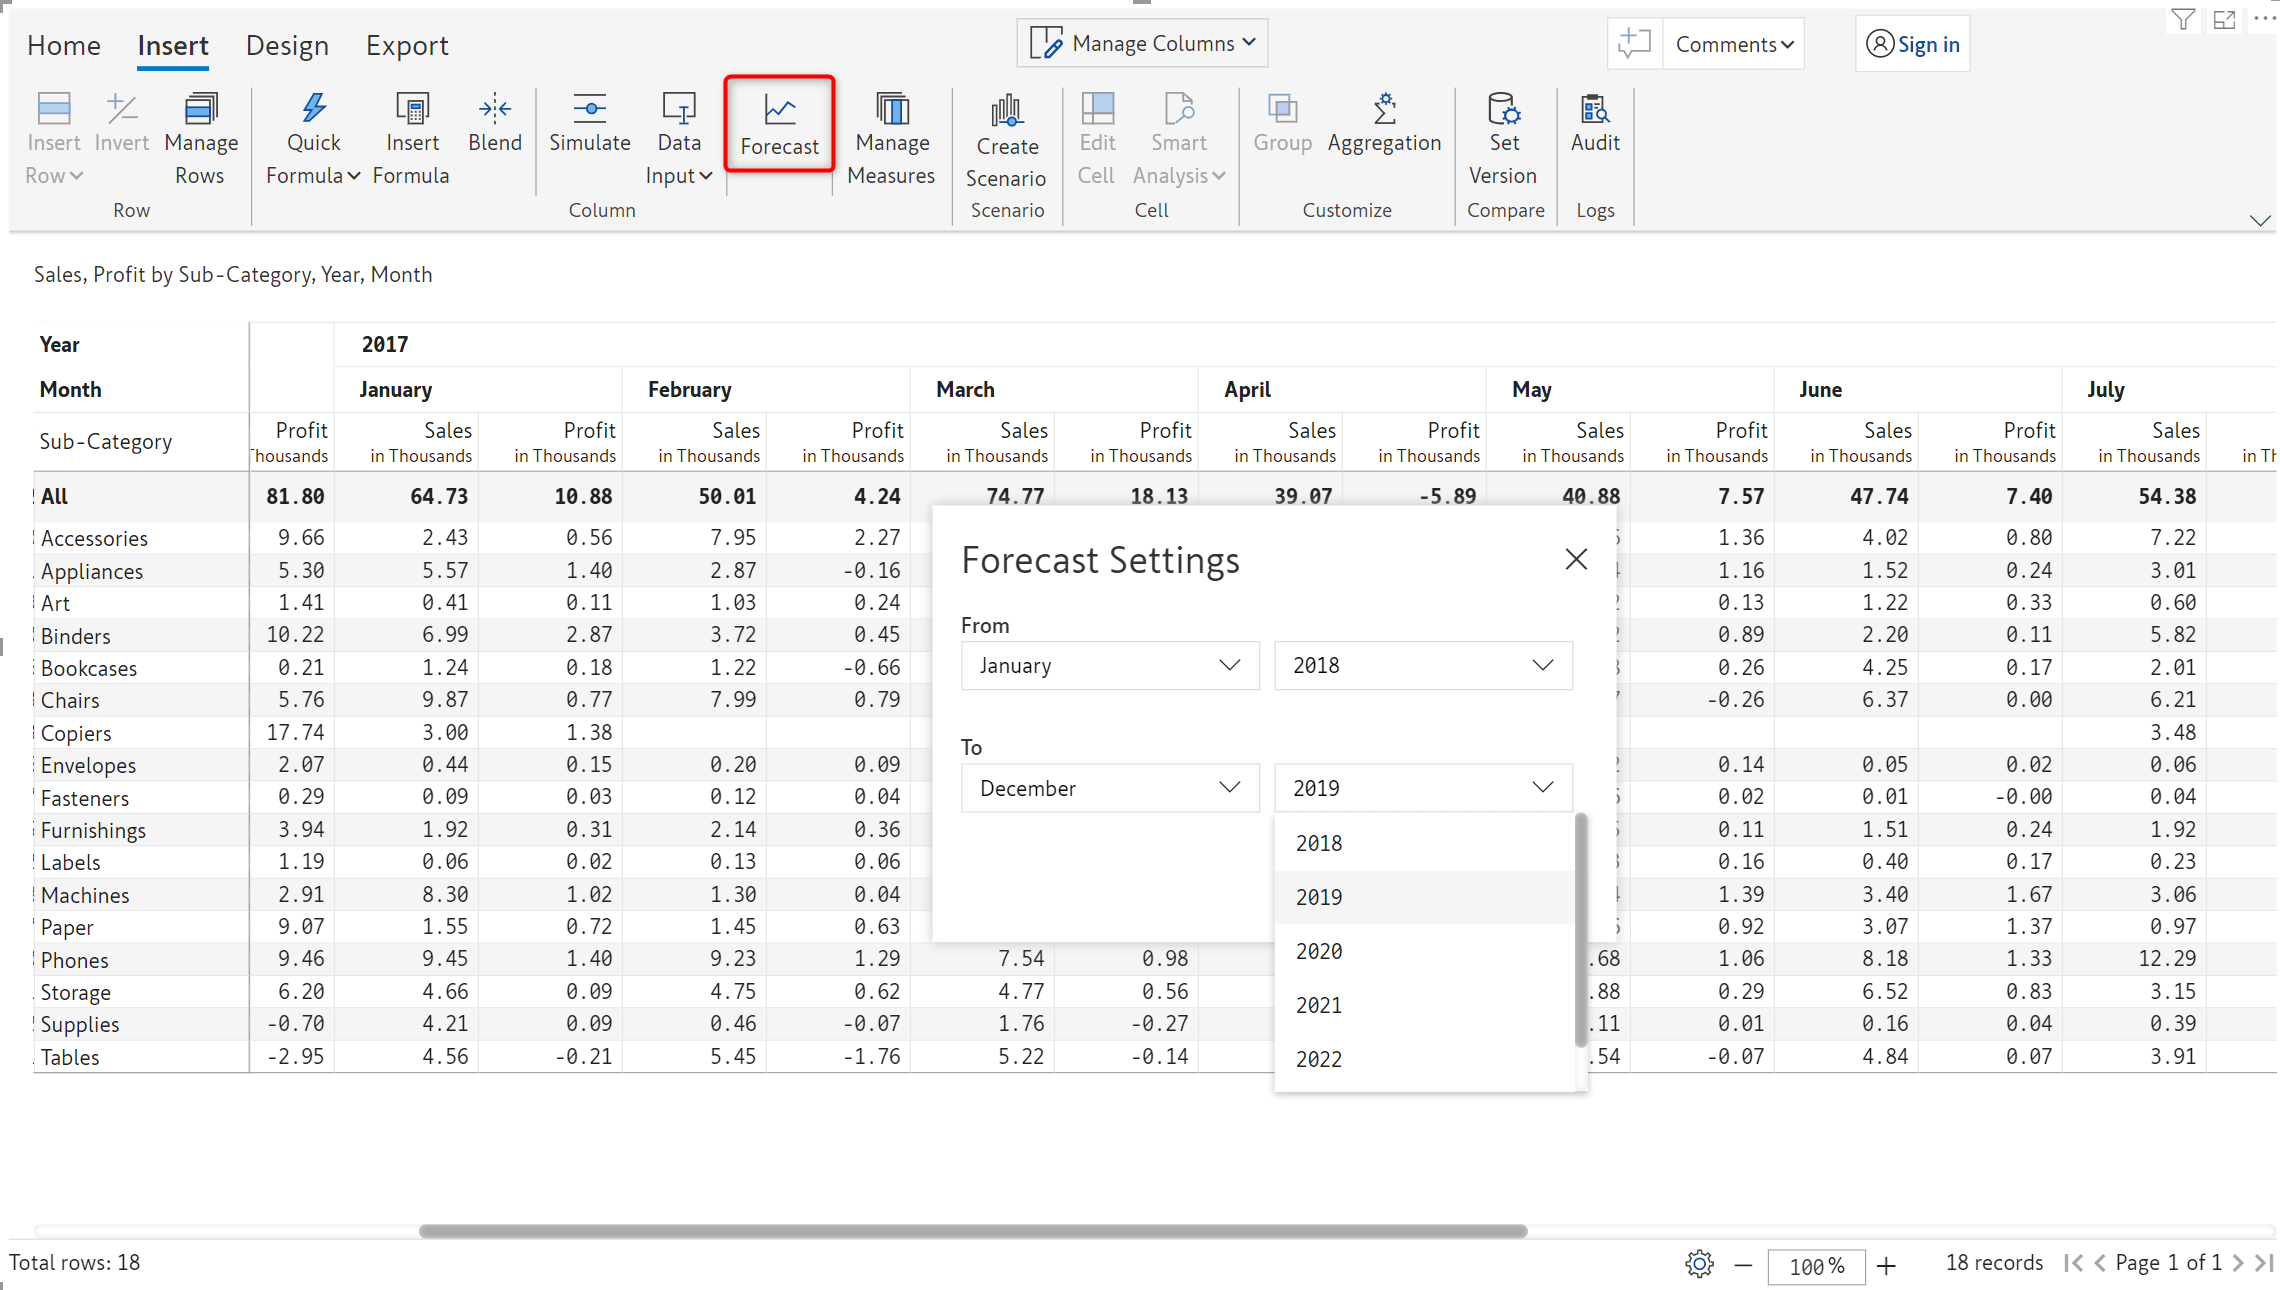
With Inforiver 2.5, the forecast period will be driven by the time frame available in the dataset, rather than current year and month. This enhancement facilitates the creation of forecasts for previous years as well.
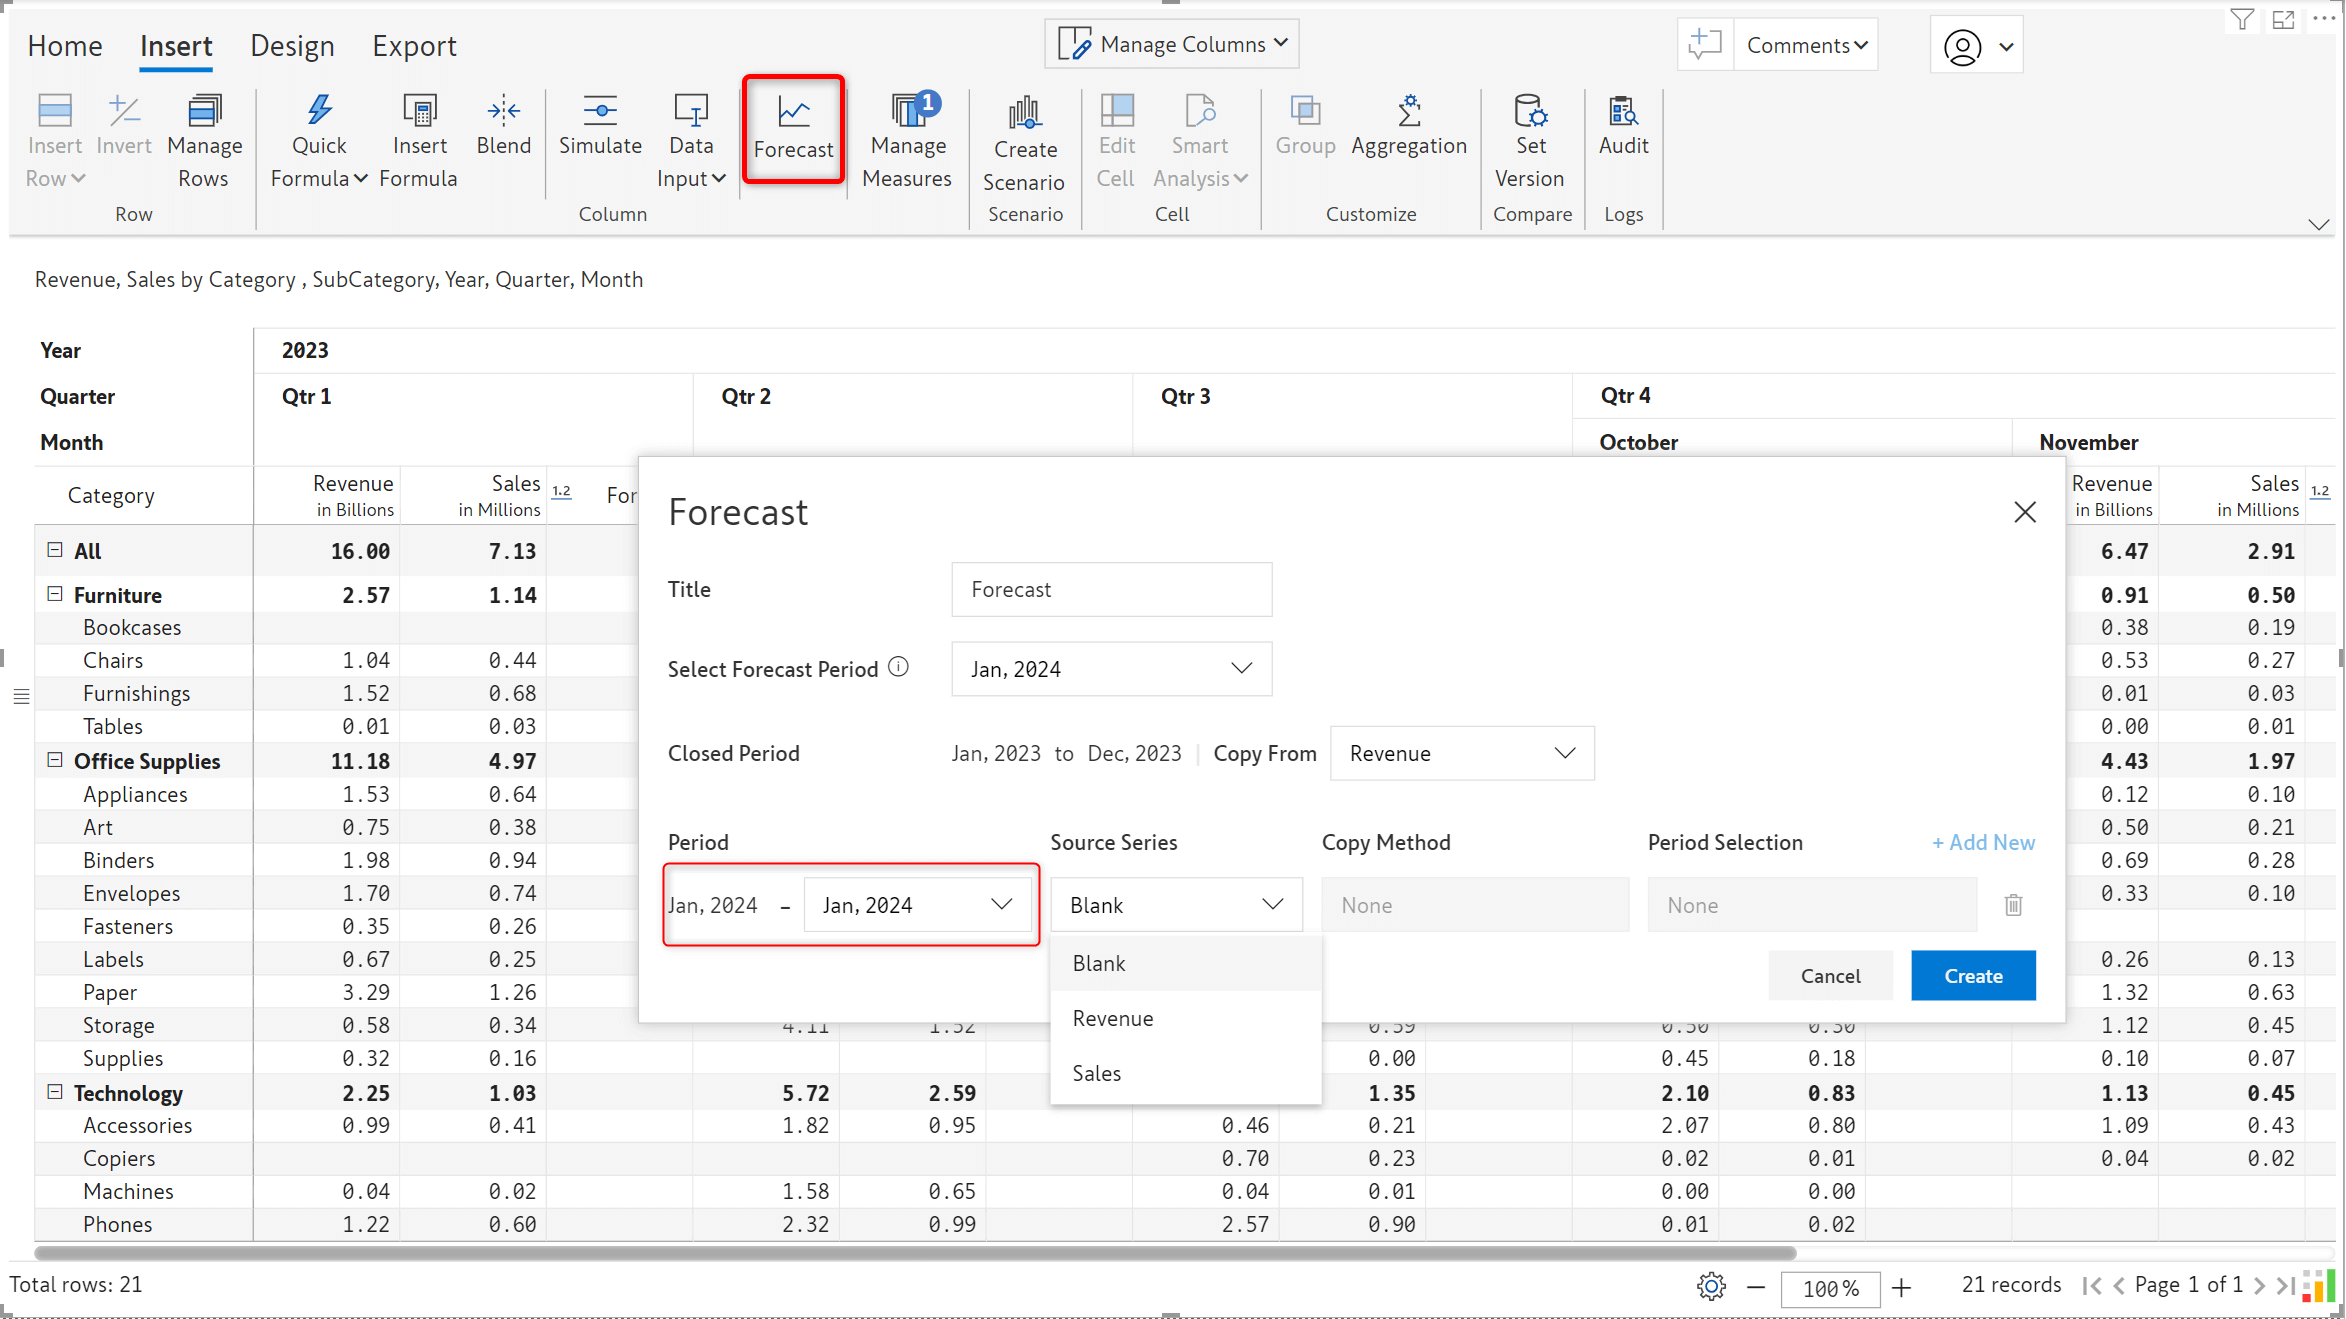
3.2. Month-wise forecasts
Inforiver 2.5 offers the capability to generate month-wise forecasts as well i.e., forecast for one month at a time.
3.3. Aggregation for forecast grand total
Inforiver offers you the flexibility to determine the grand total aggregation for the forecast measure. The forecast grand total can be set to include:
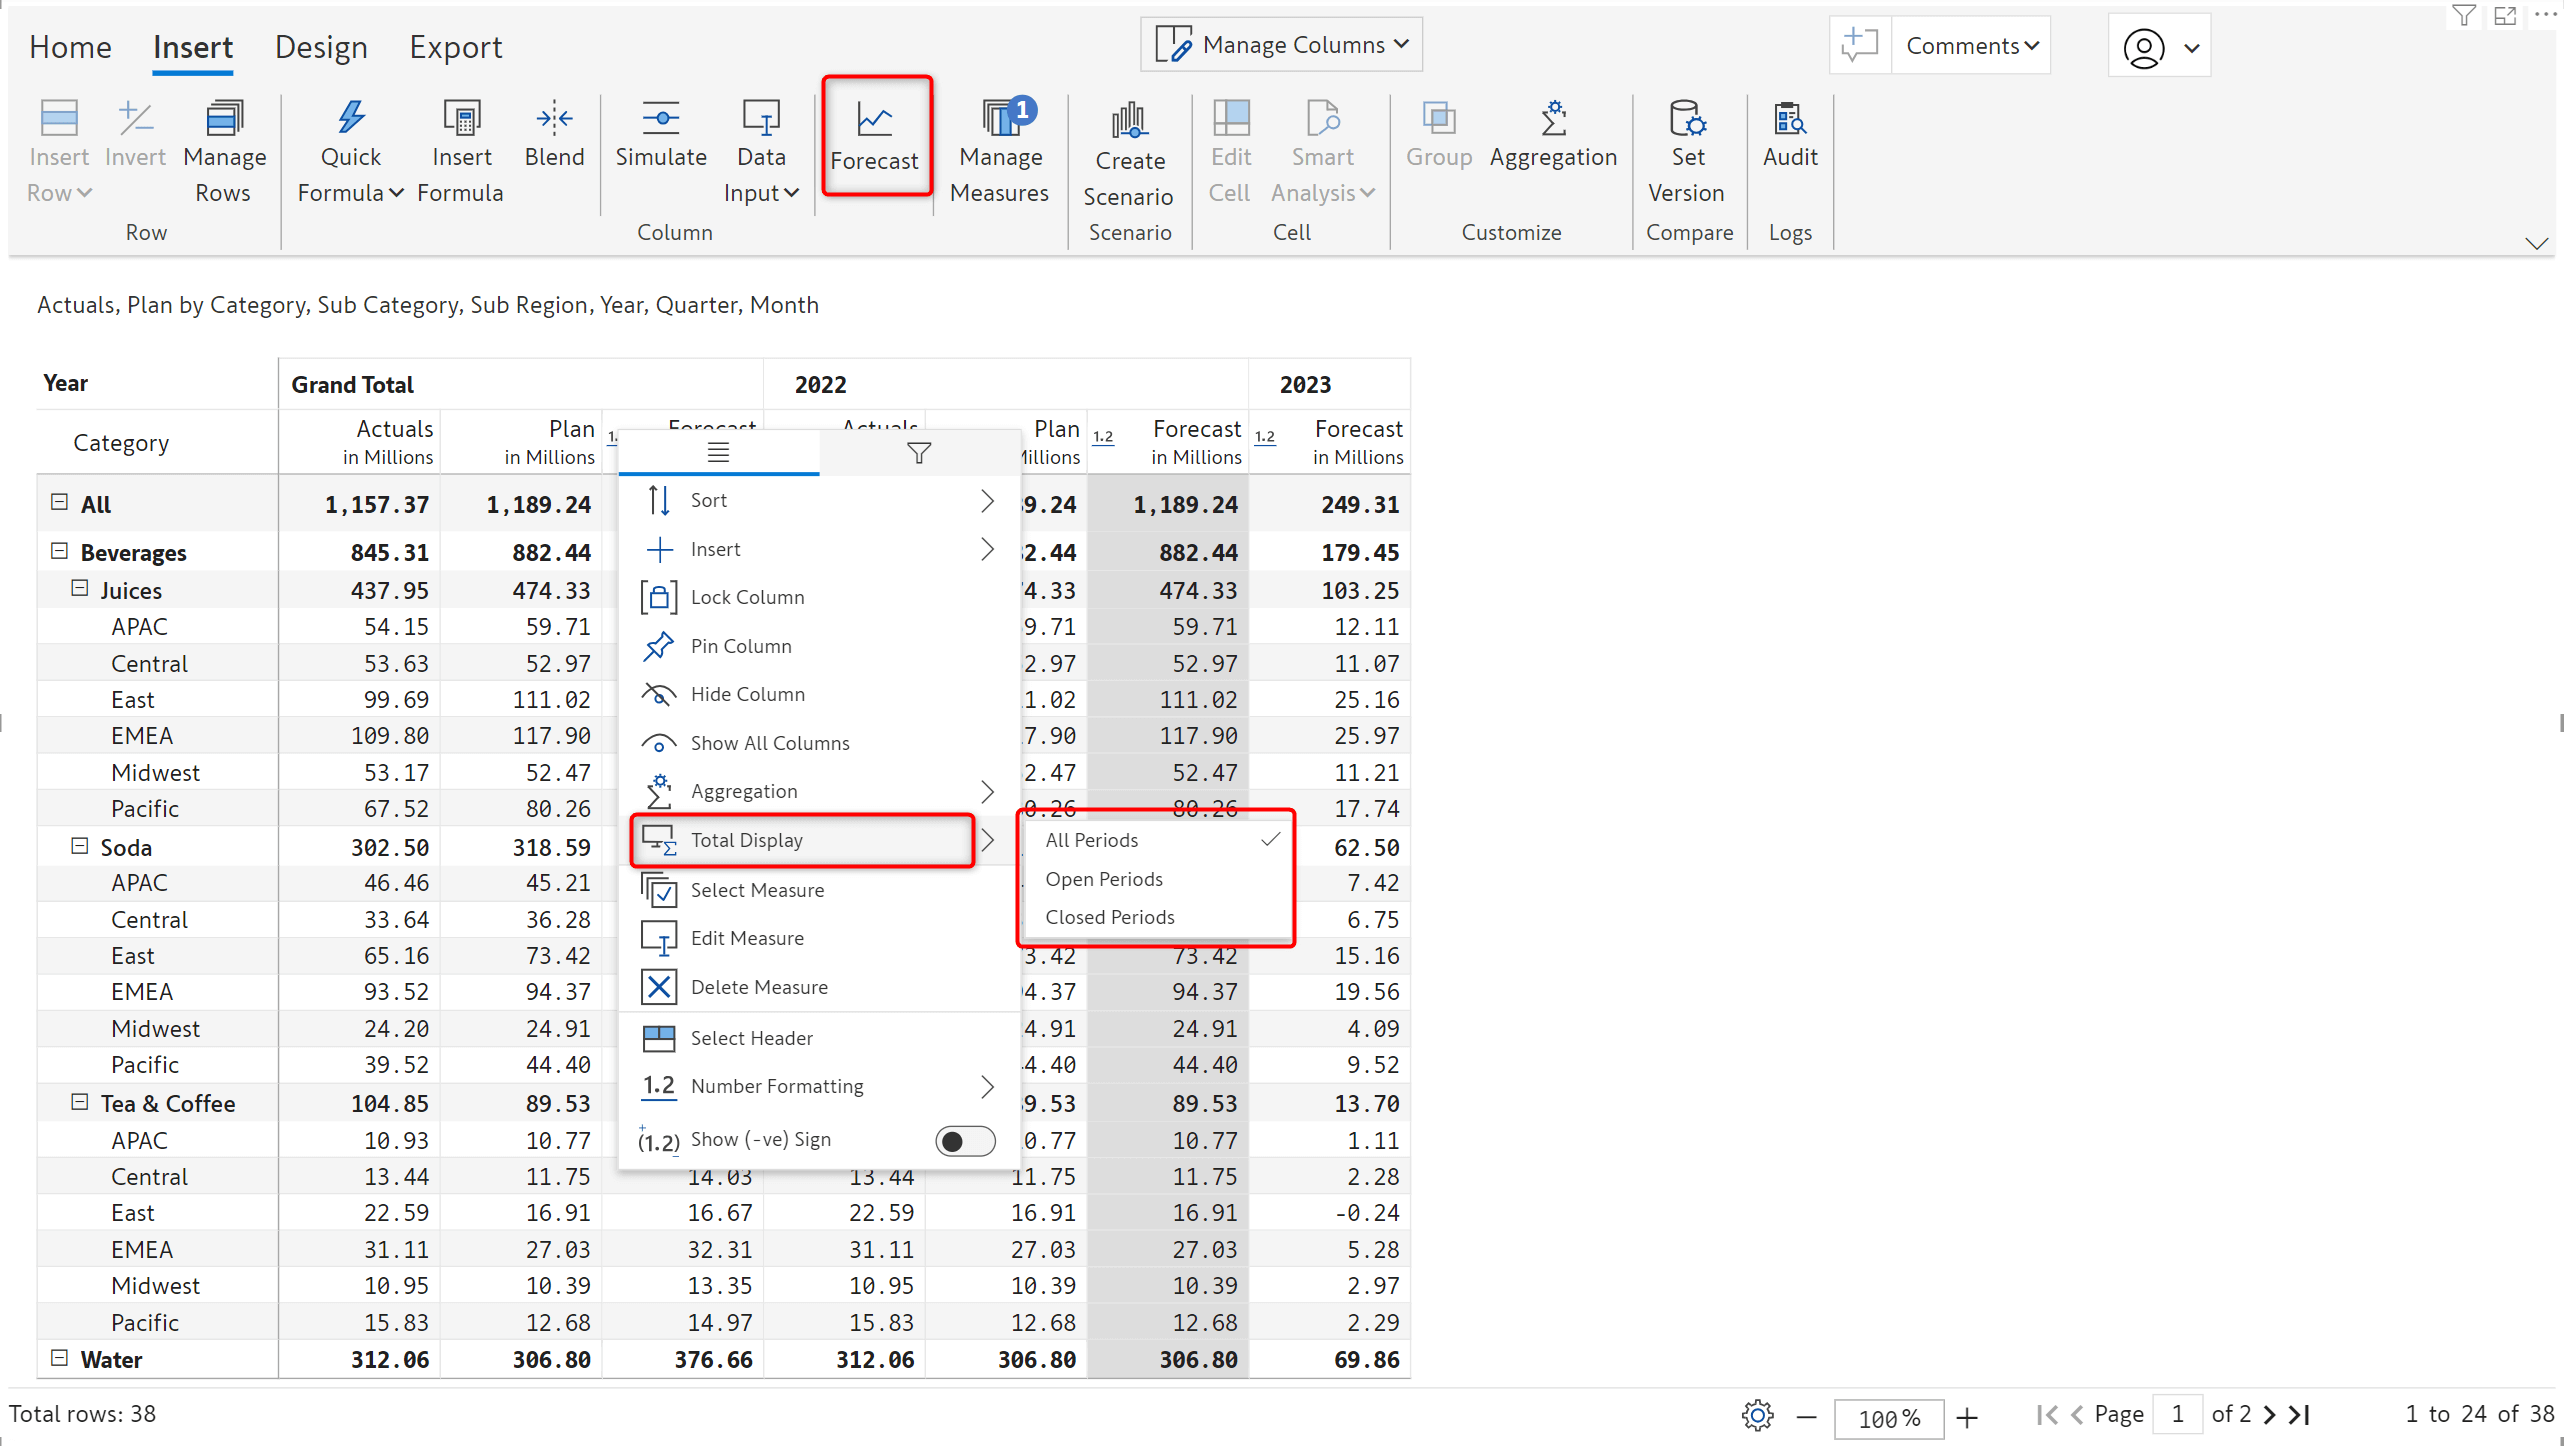
In the image below, the Forecast grand total is derived from the aggregated forecasts for open periods. You can smoothly assign and distribute forecasts for open periods by updating the grand total forecast.
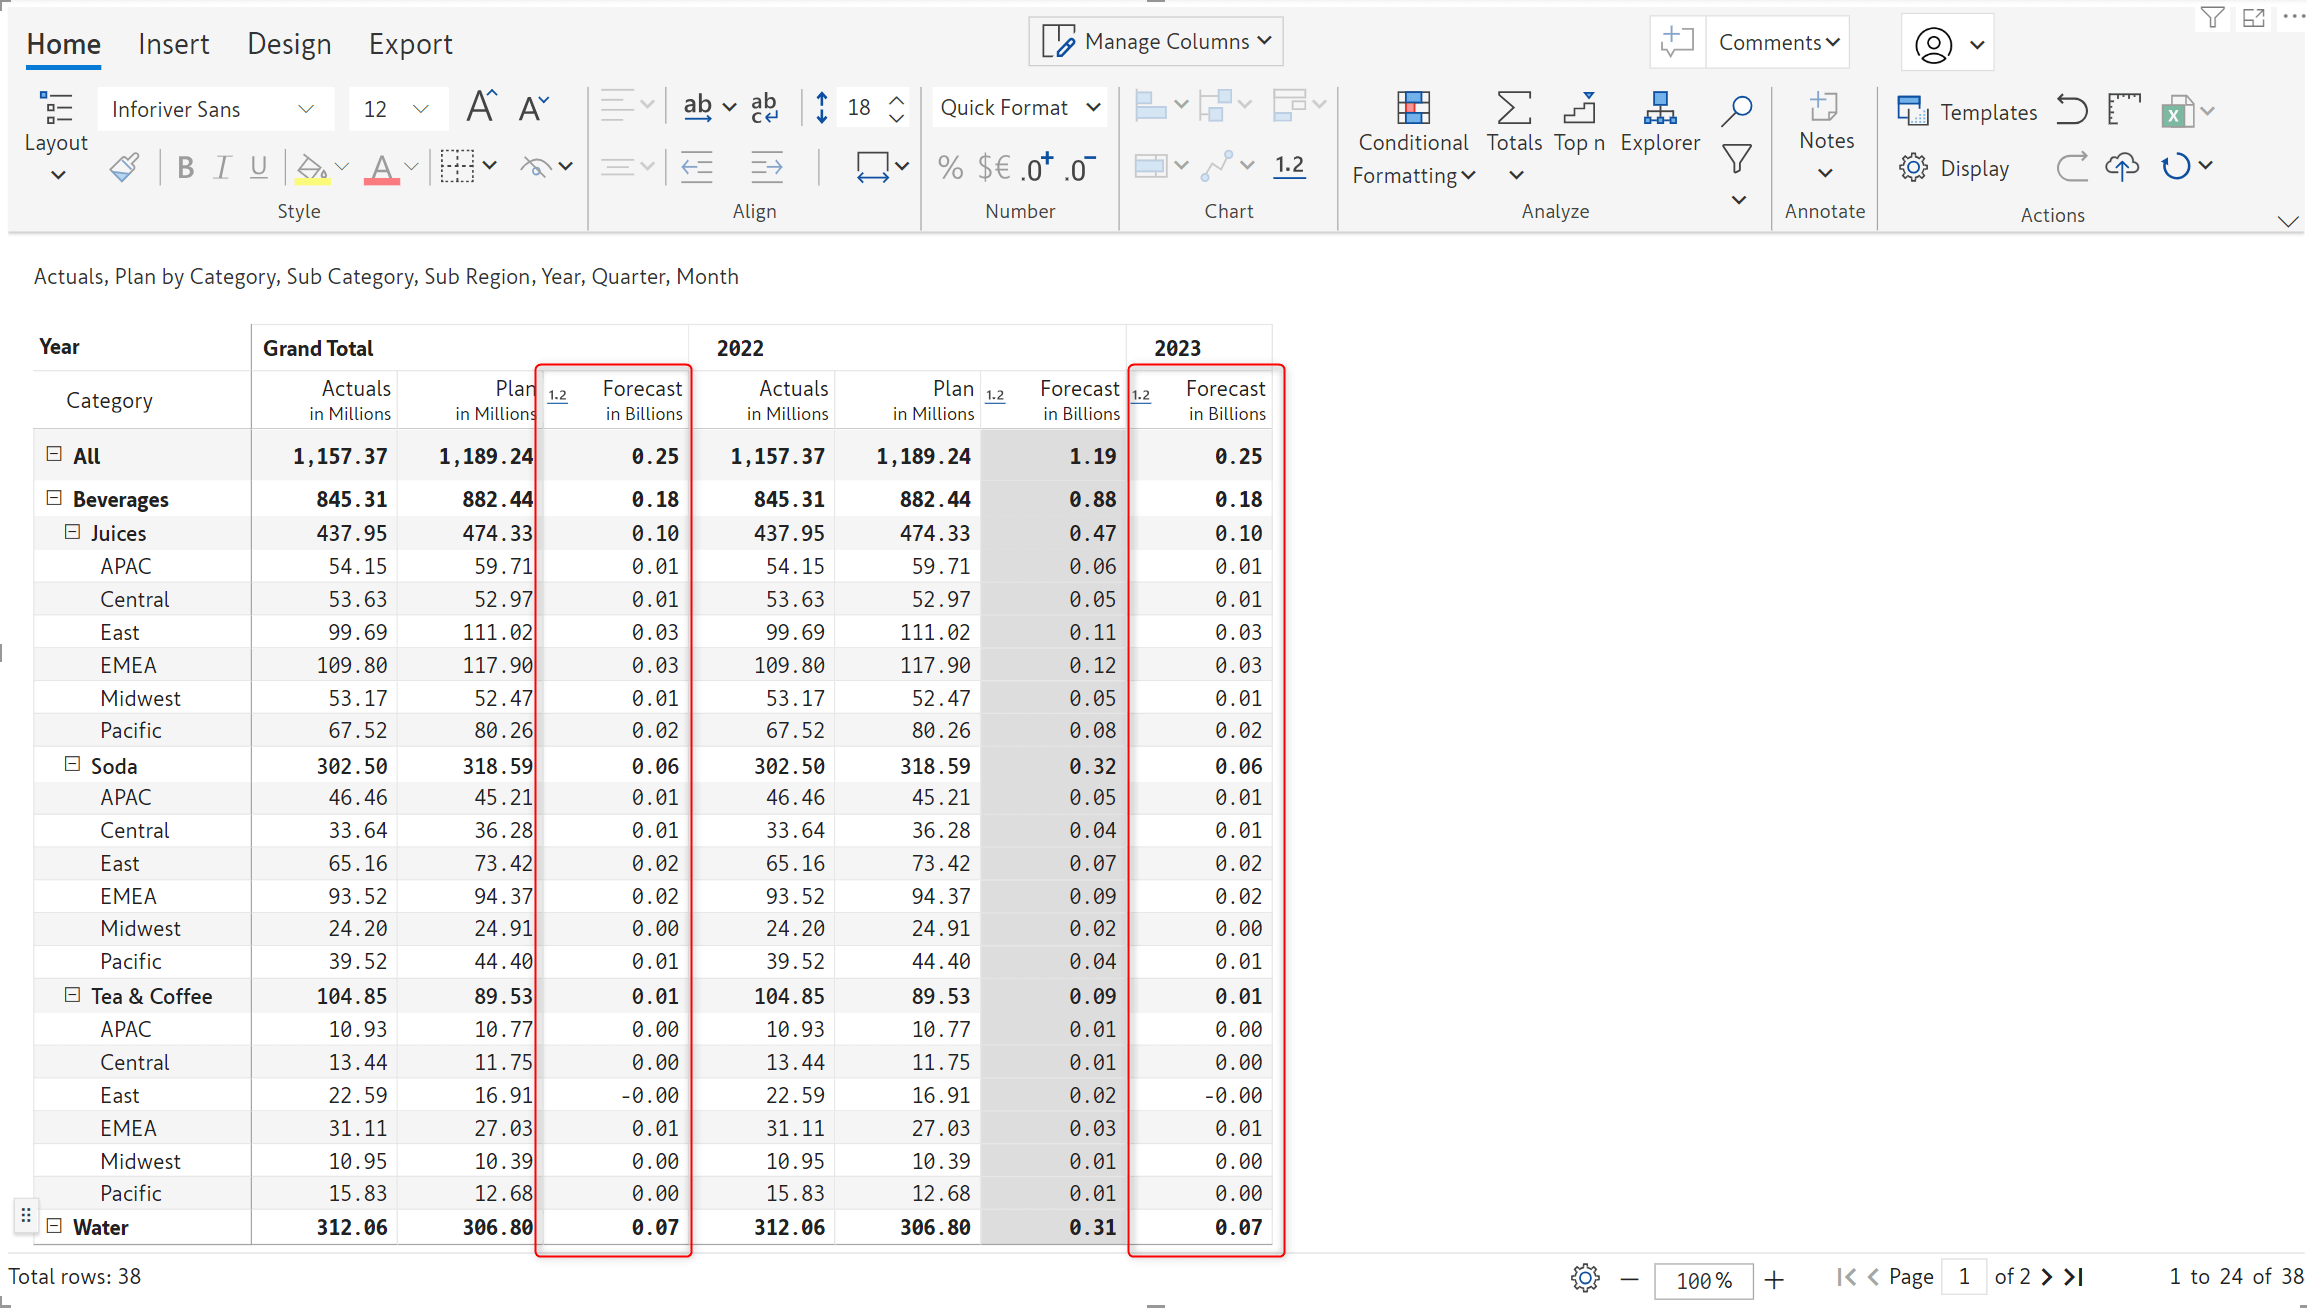
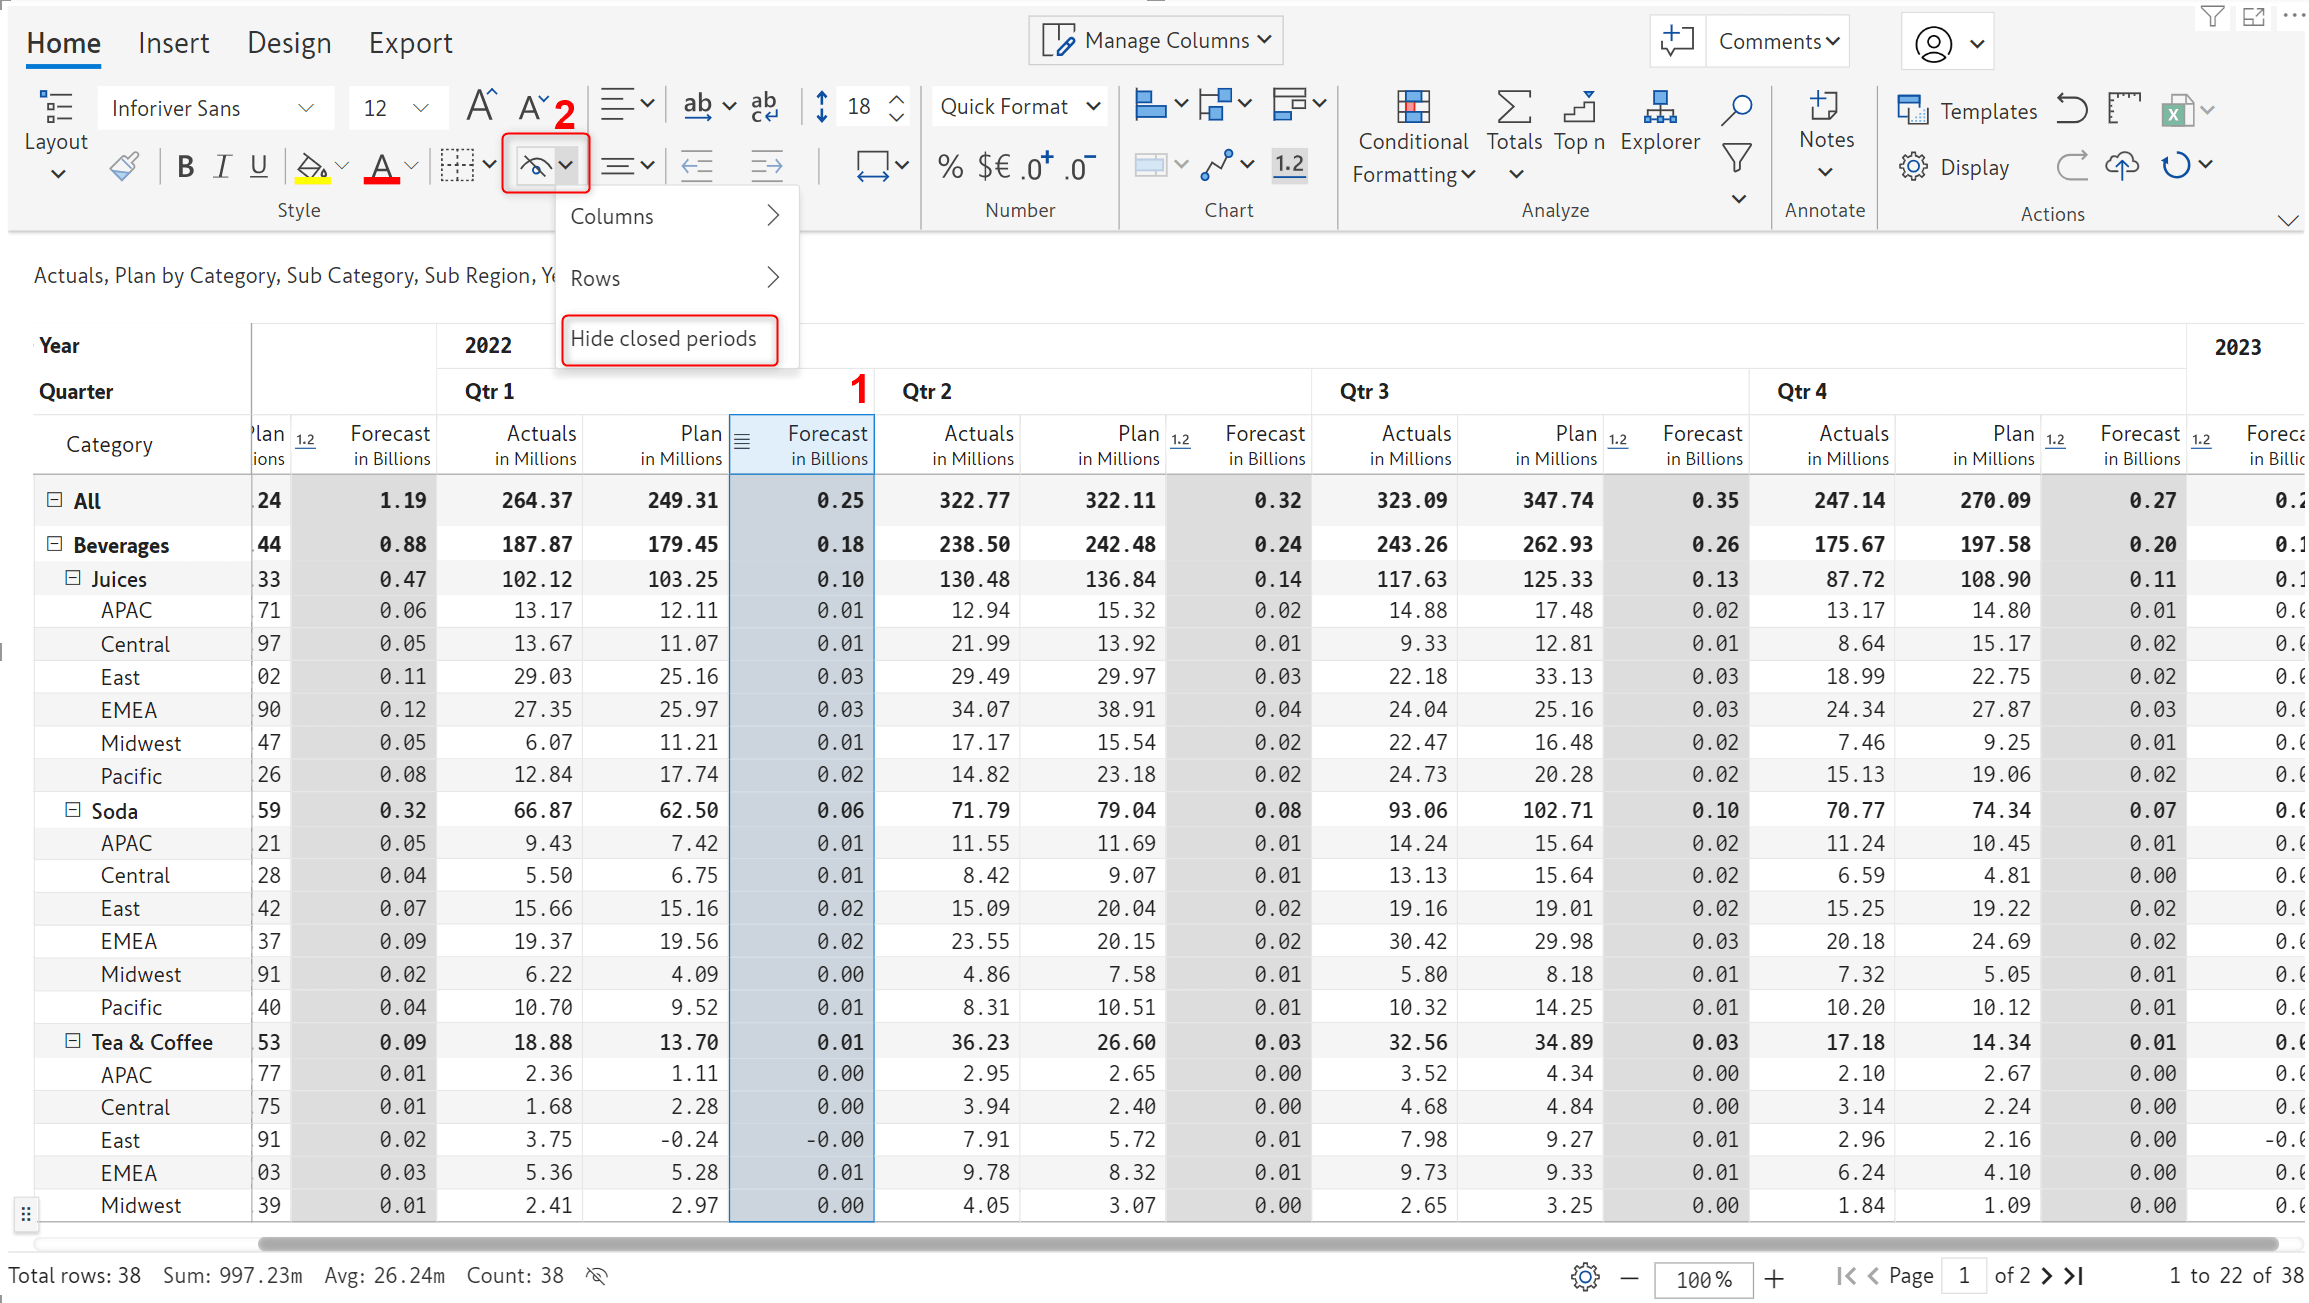
3.4. Show or hide forecasts for closed periods
You can effortlessly mask the forecast for closed periods if they are not required in reports.
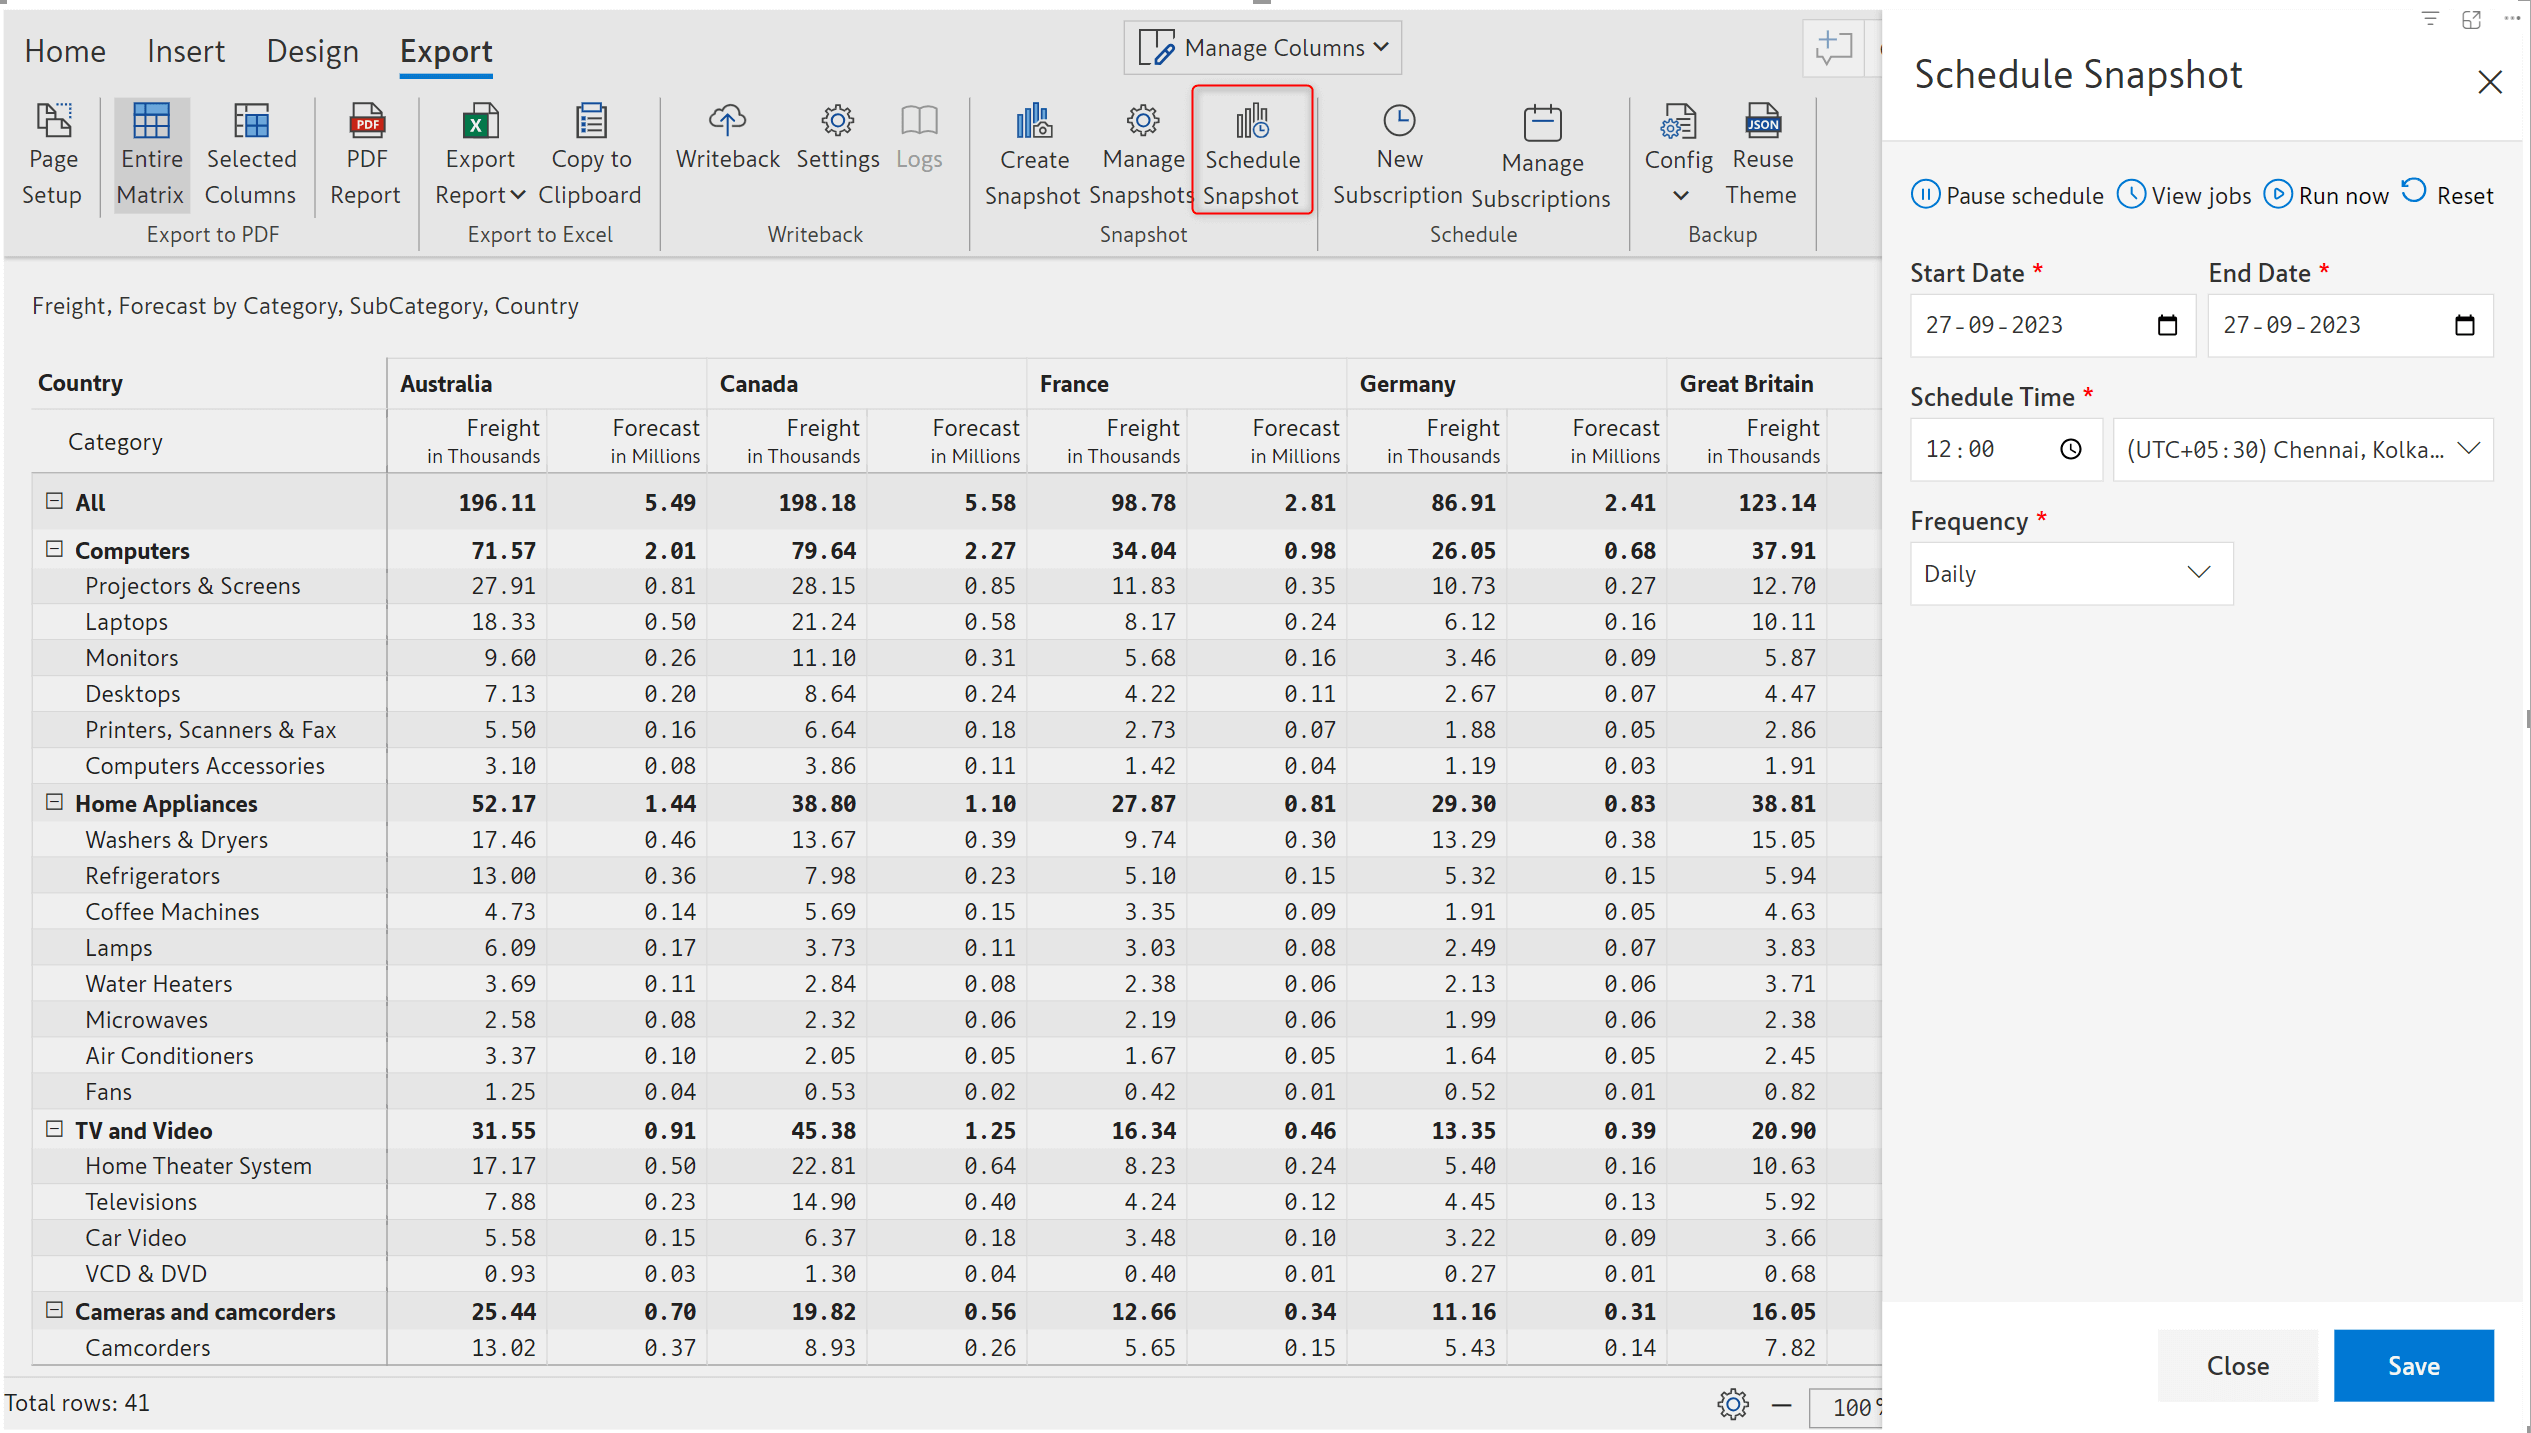
Inforiver’s snapshot feature comes packaged with a fully-fledged scheduler that provides features such as viewing logs, initiating, pausing, and resetting the schedule.
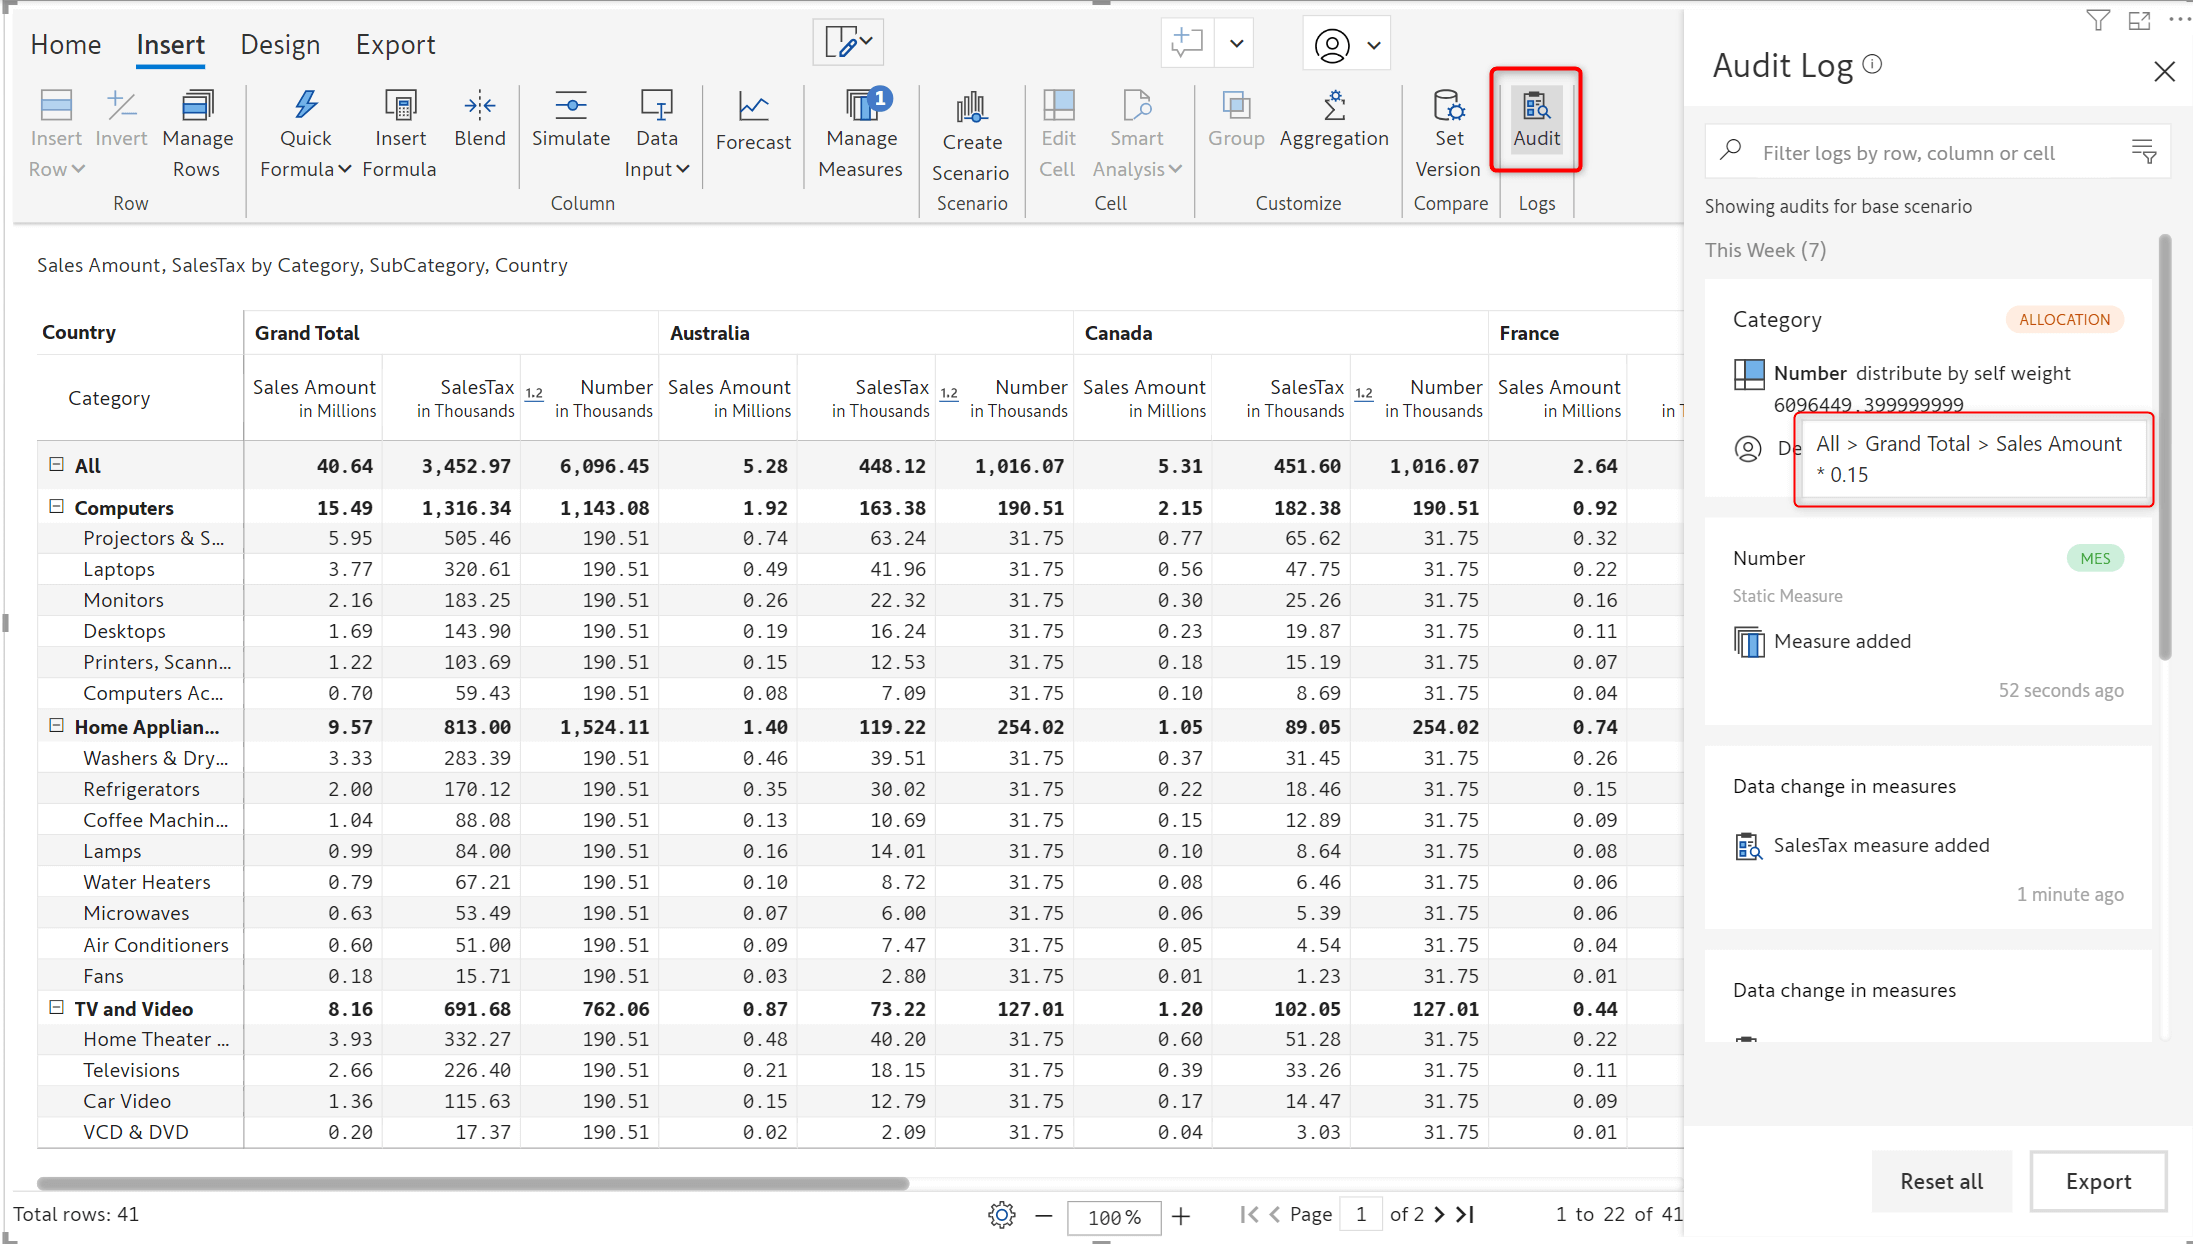
The audit logs have been extended to capture formulae applied in data input cells as well. Hover over the audit log entry to see the formula.
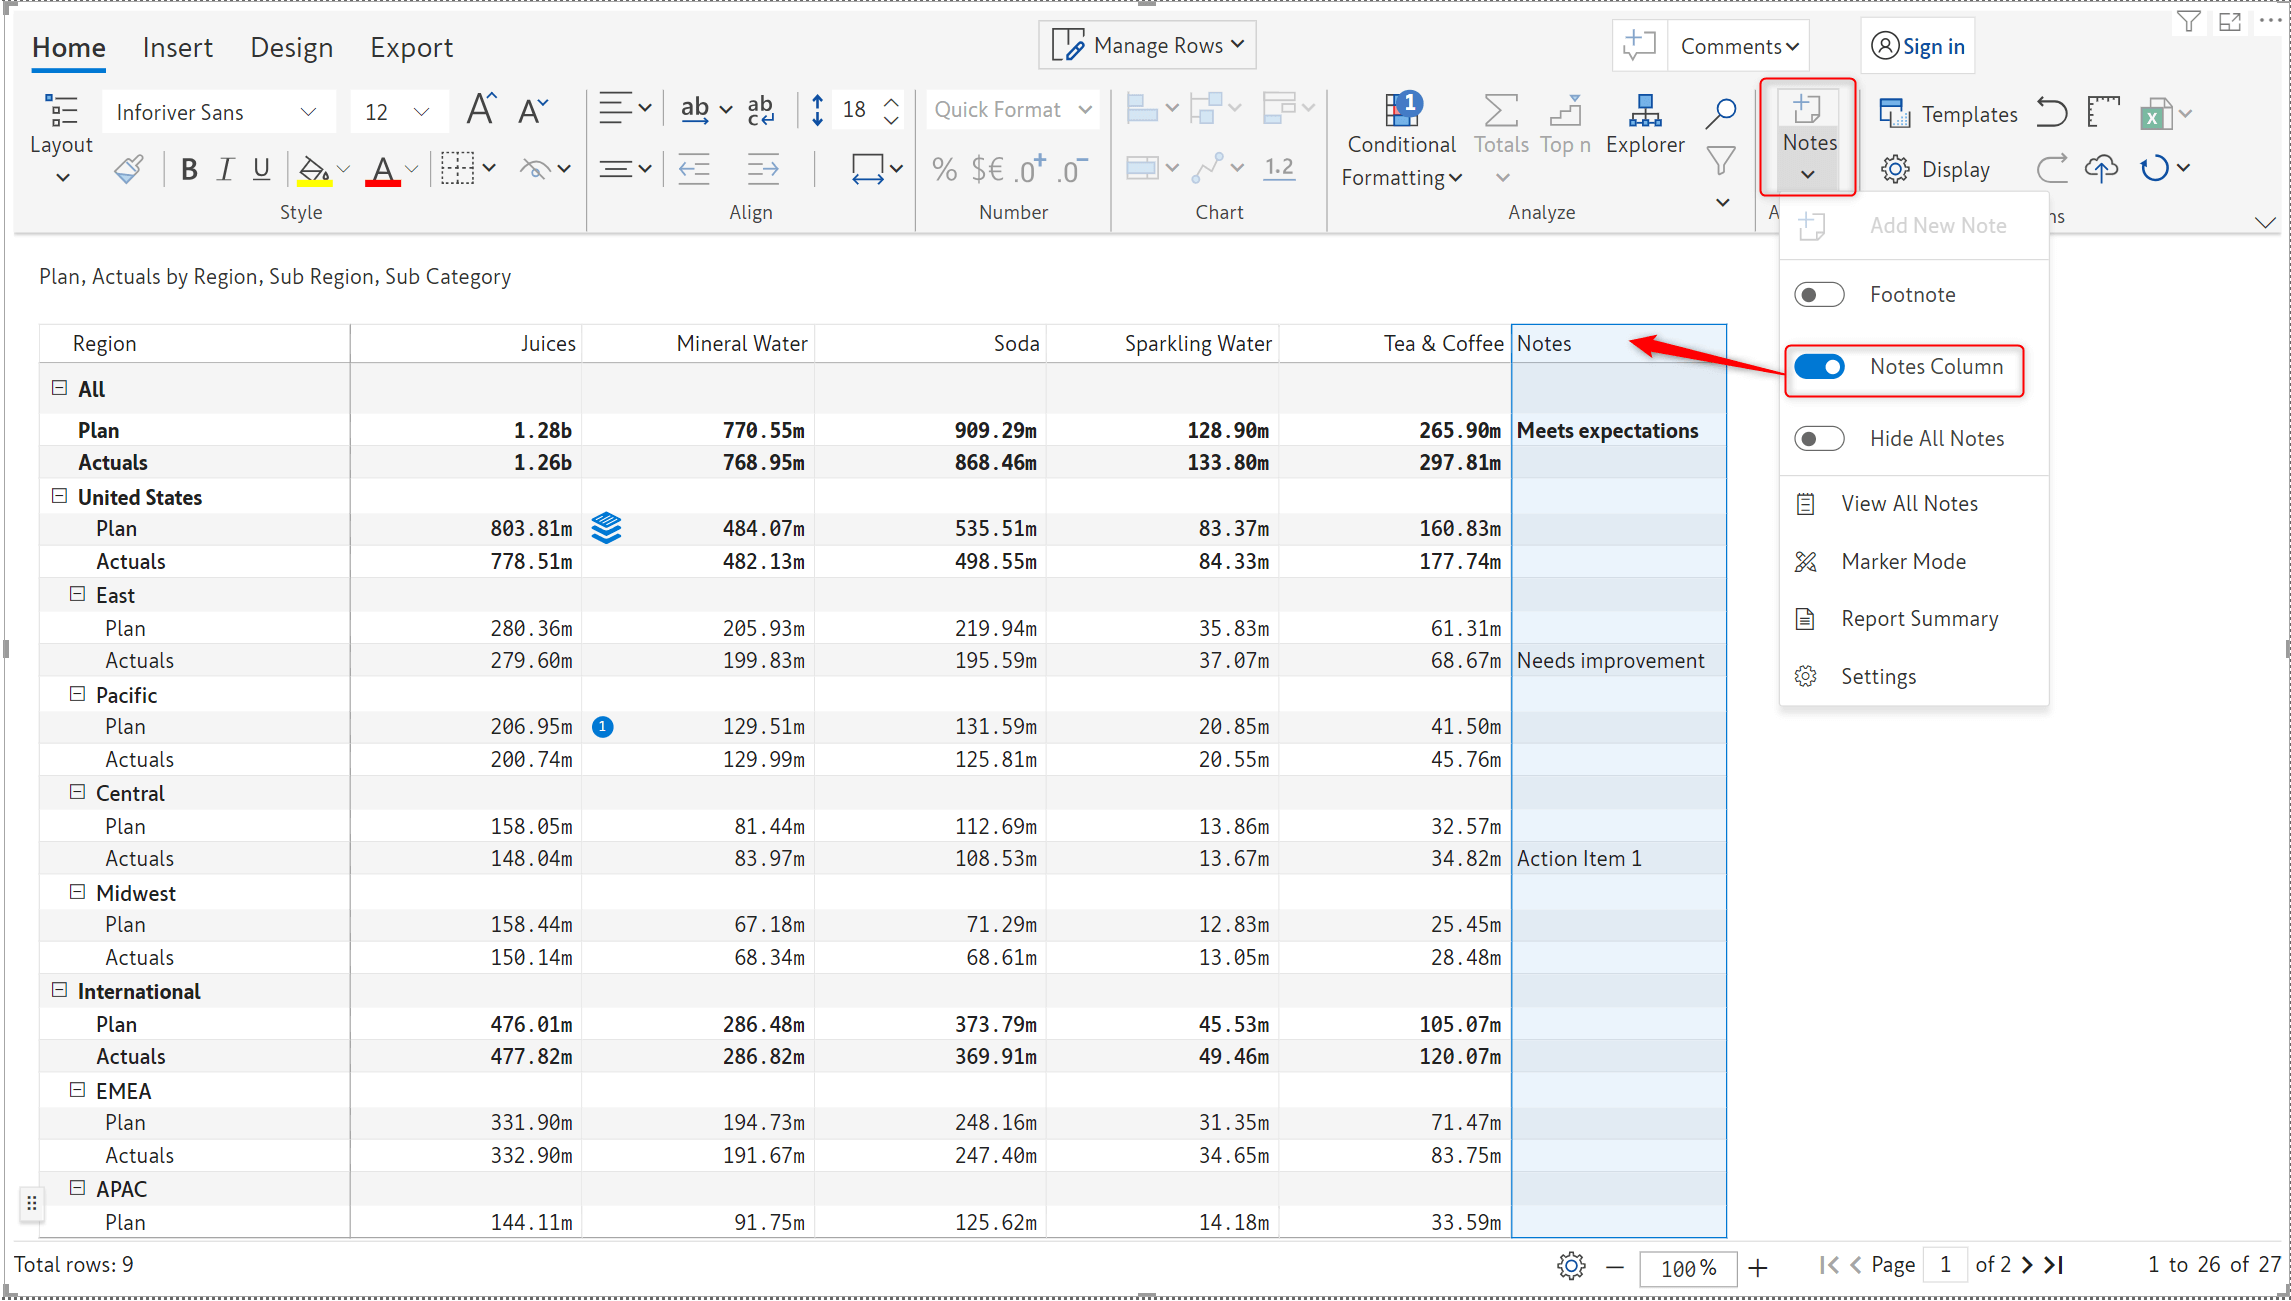
The popular ‘Measure on rows’ layout now supports adding notes column as well. This simplifies coordination and aids in adding more context to your data.
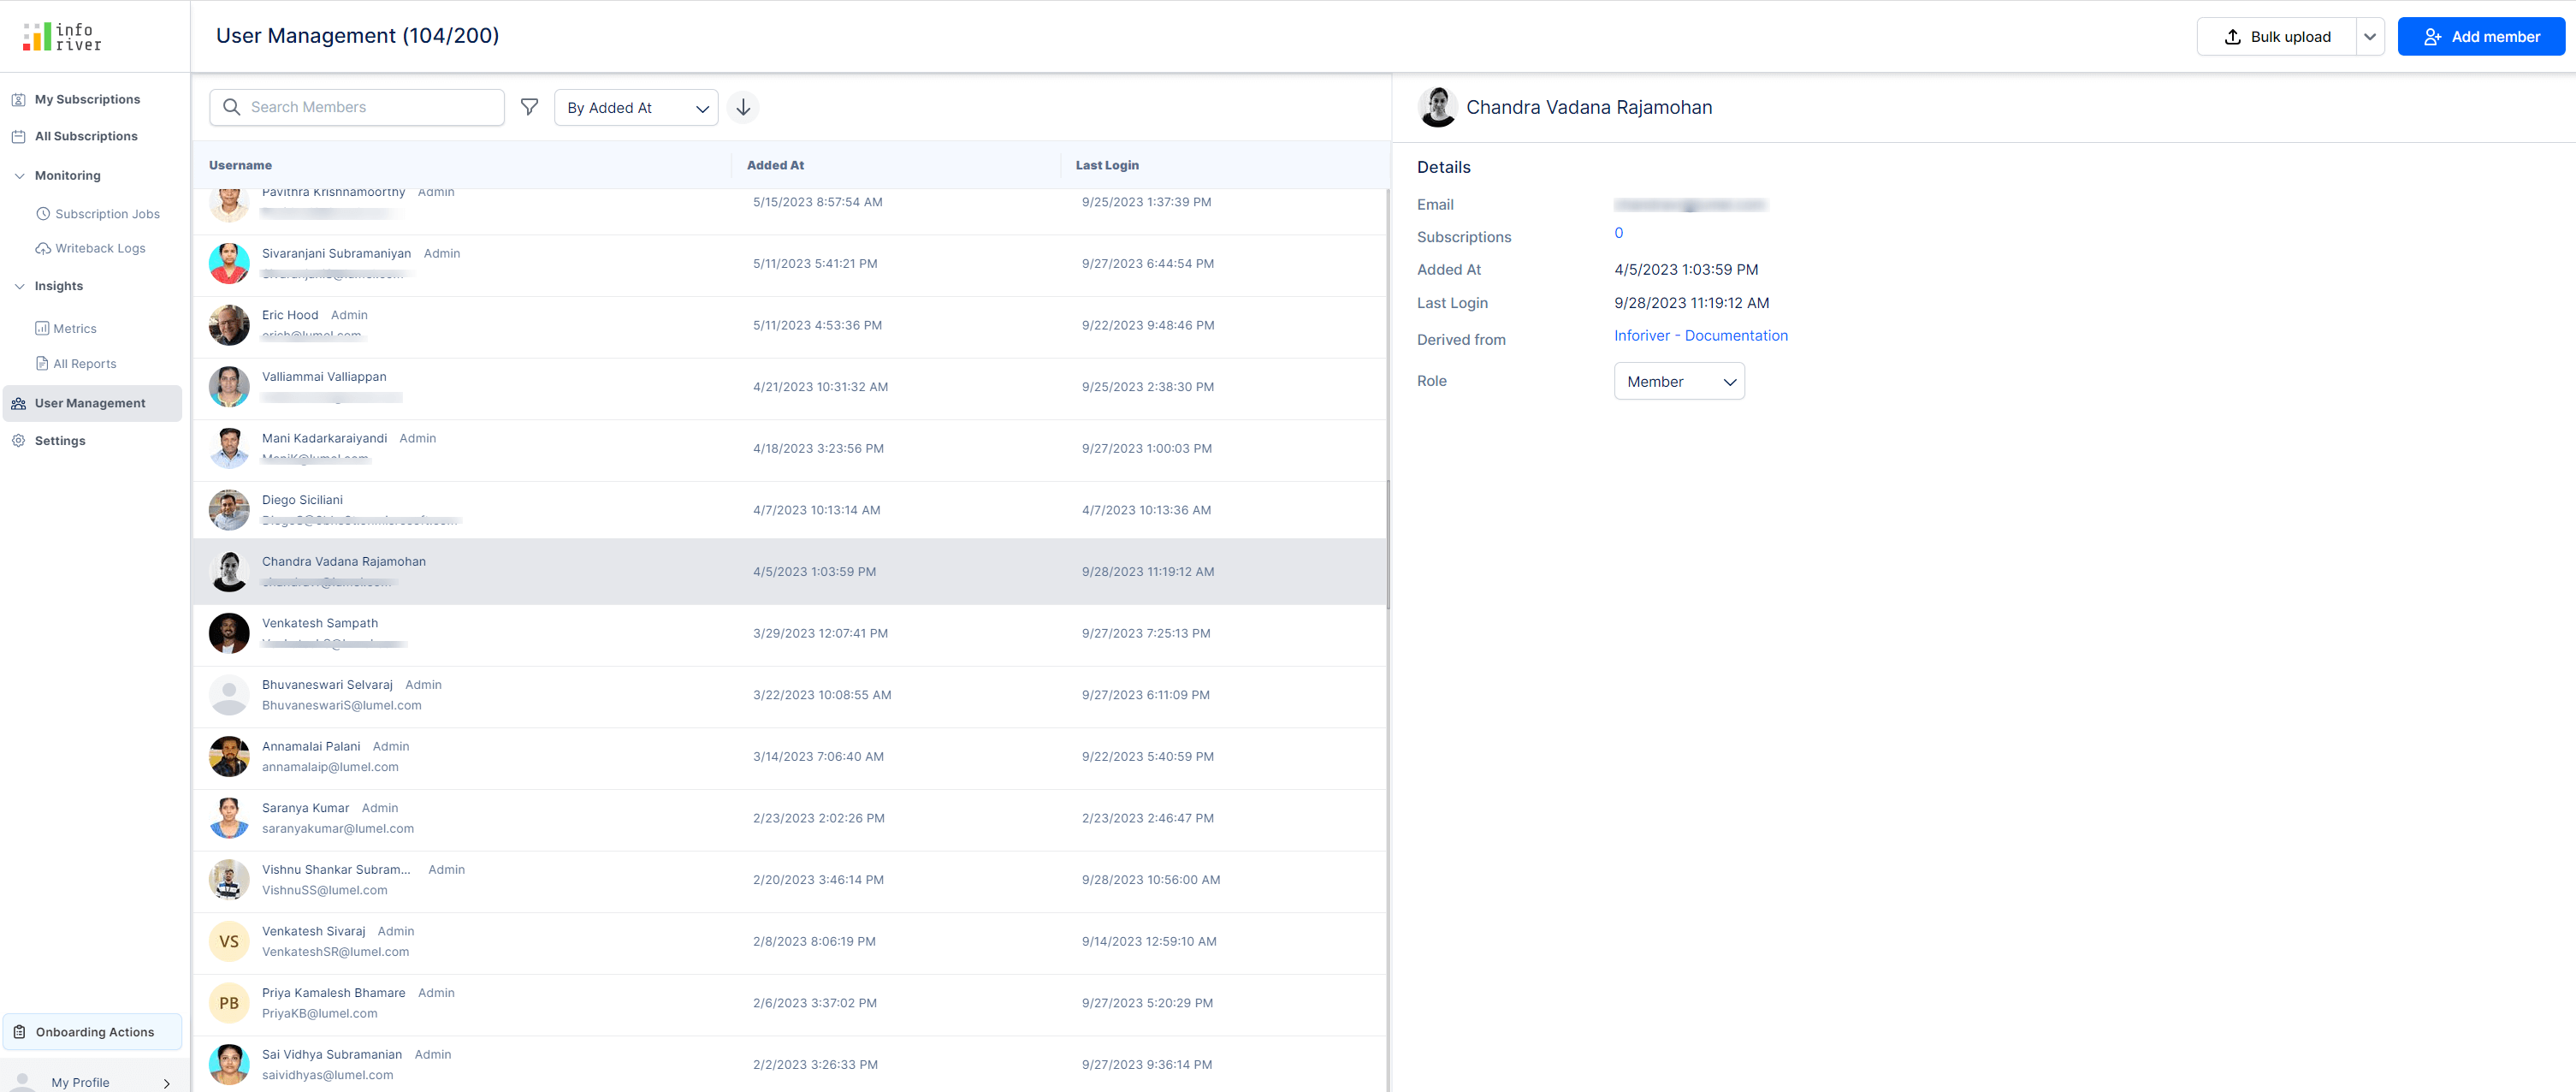
The admin console will now provide additional details for Inforiver users such as role, last login time and time of onboarding. Sorting is also enabled on these fields.
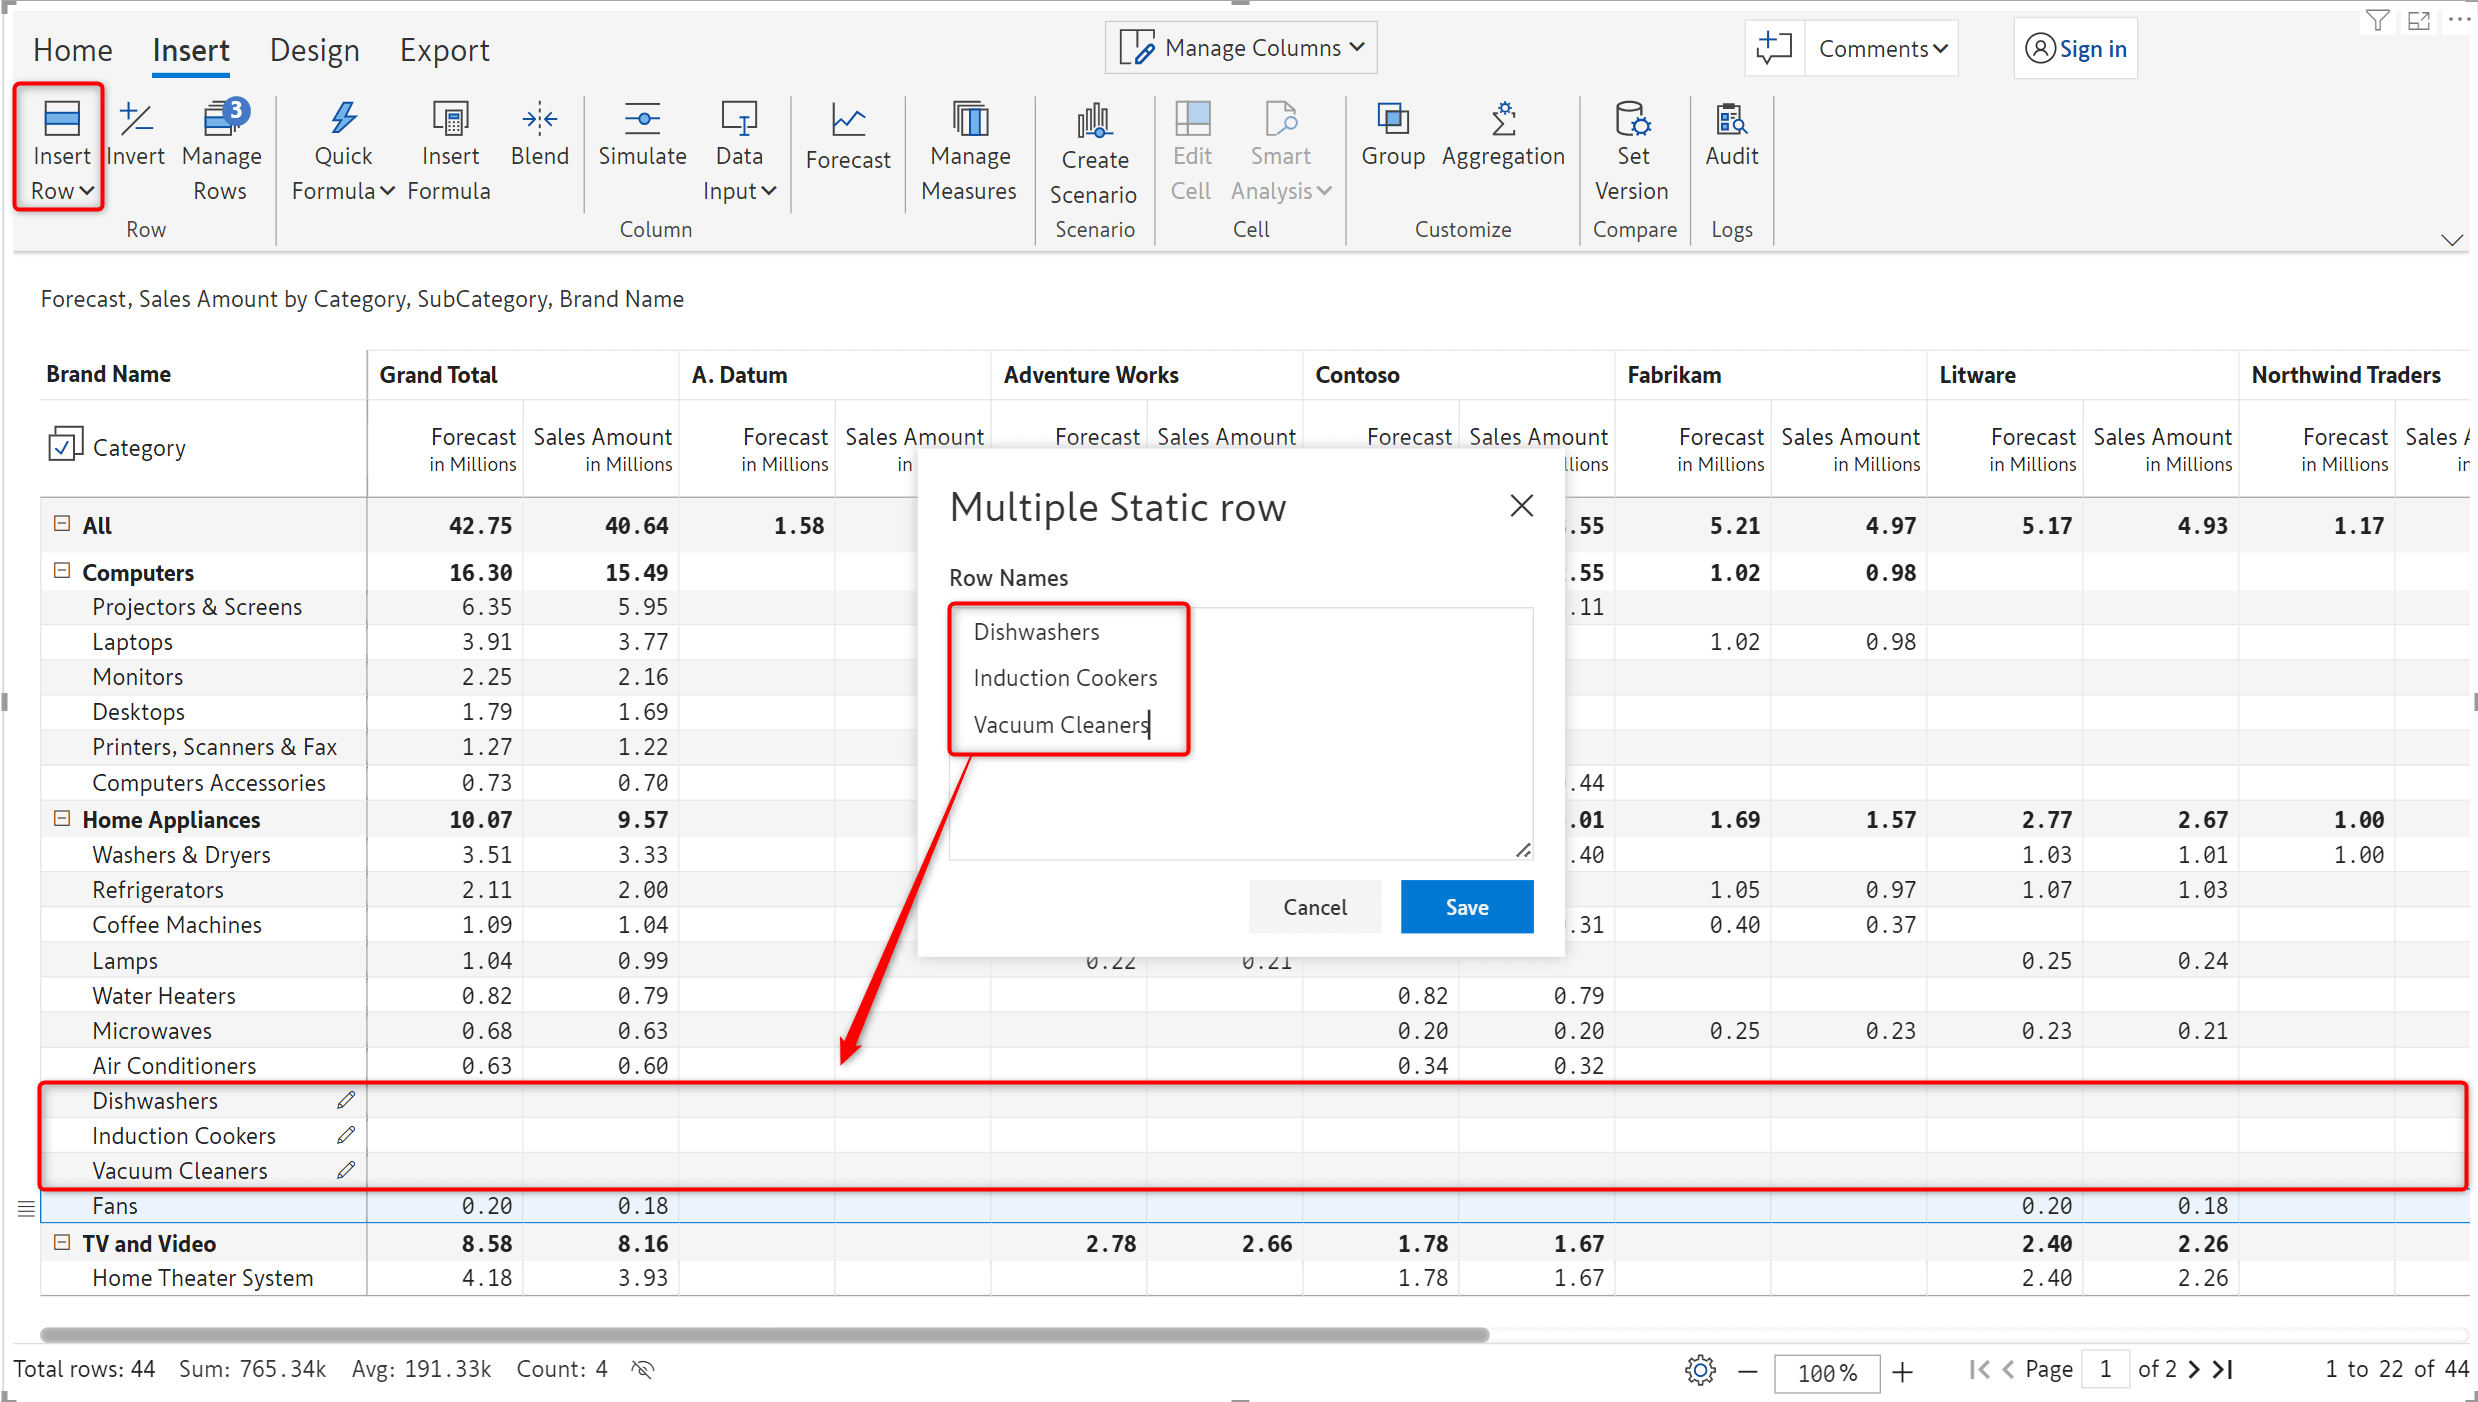
Static rows bulk insert - You can leverage the Multiple Static Row option to smoothly insert multiple rows in a single stroke.
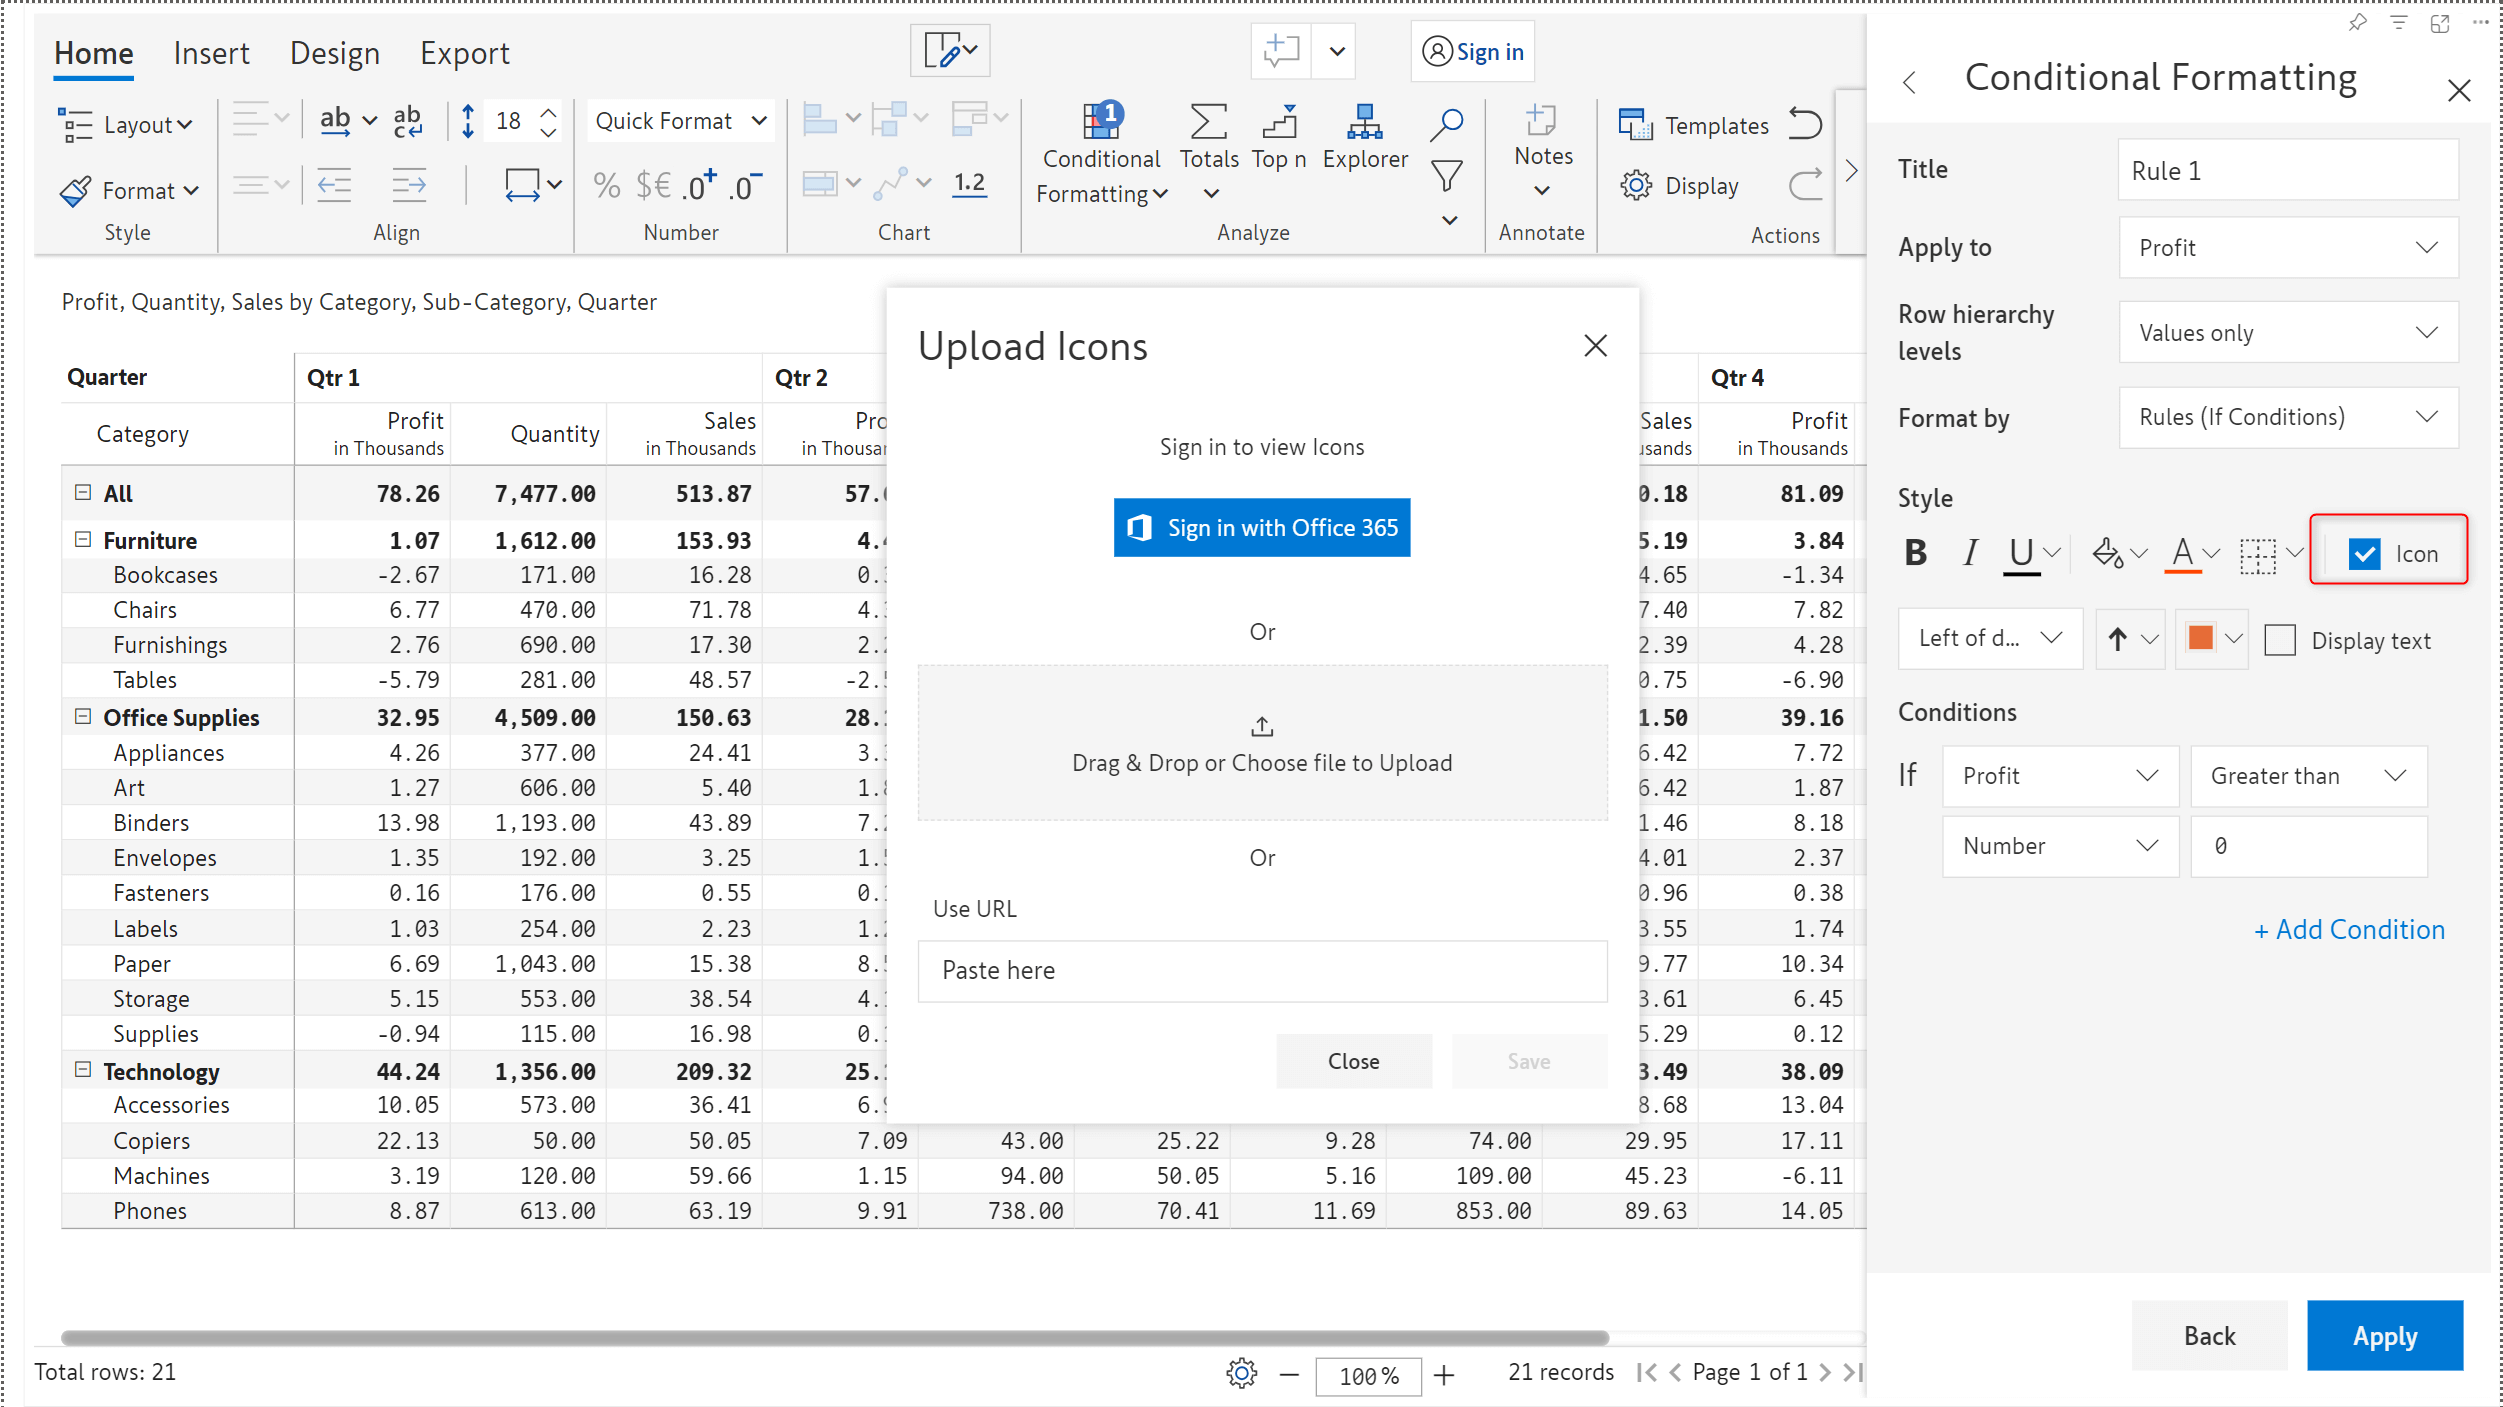
Custom icons for conditional formatting - Custom icons can be uploaded as files or URLs when applying conditional formatting.
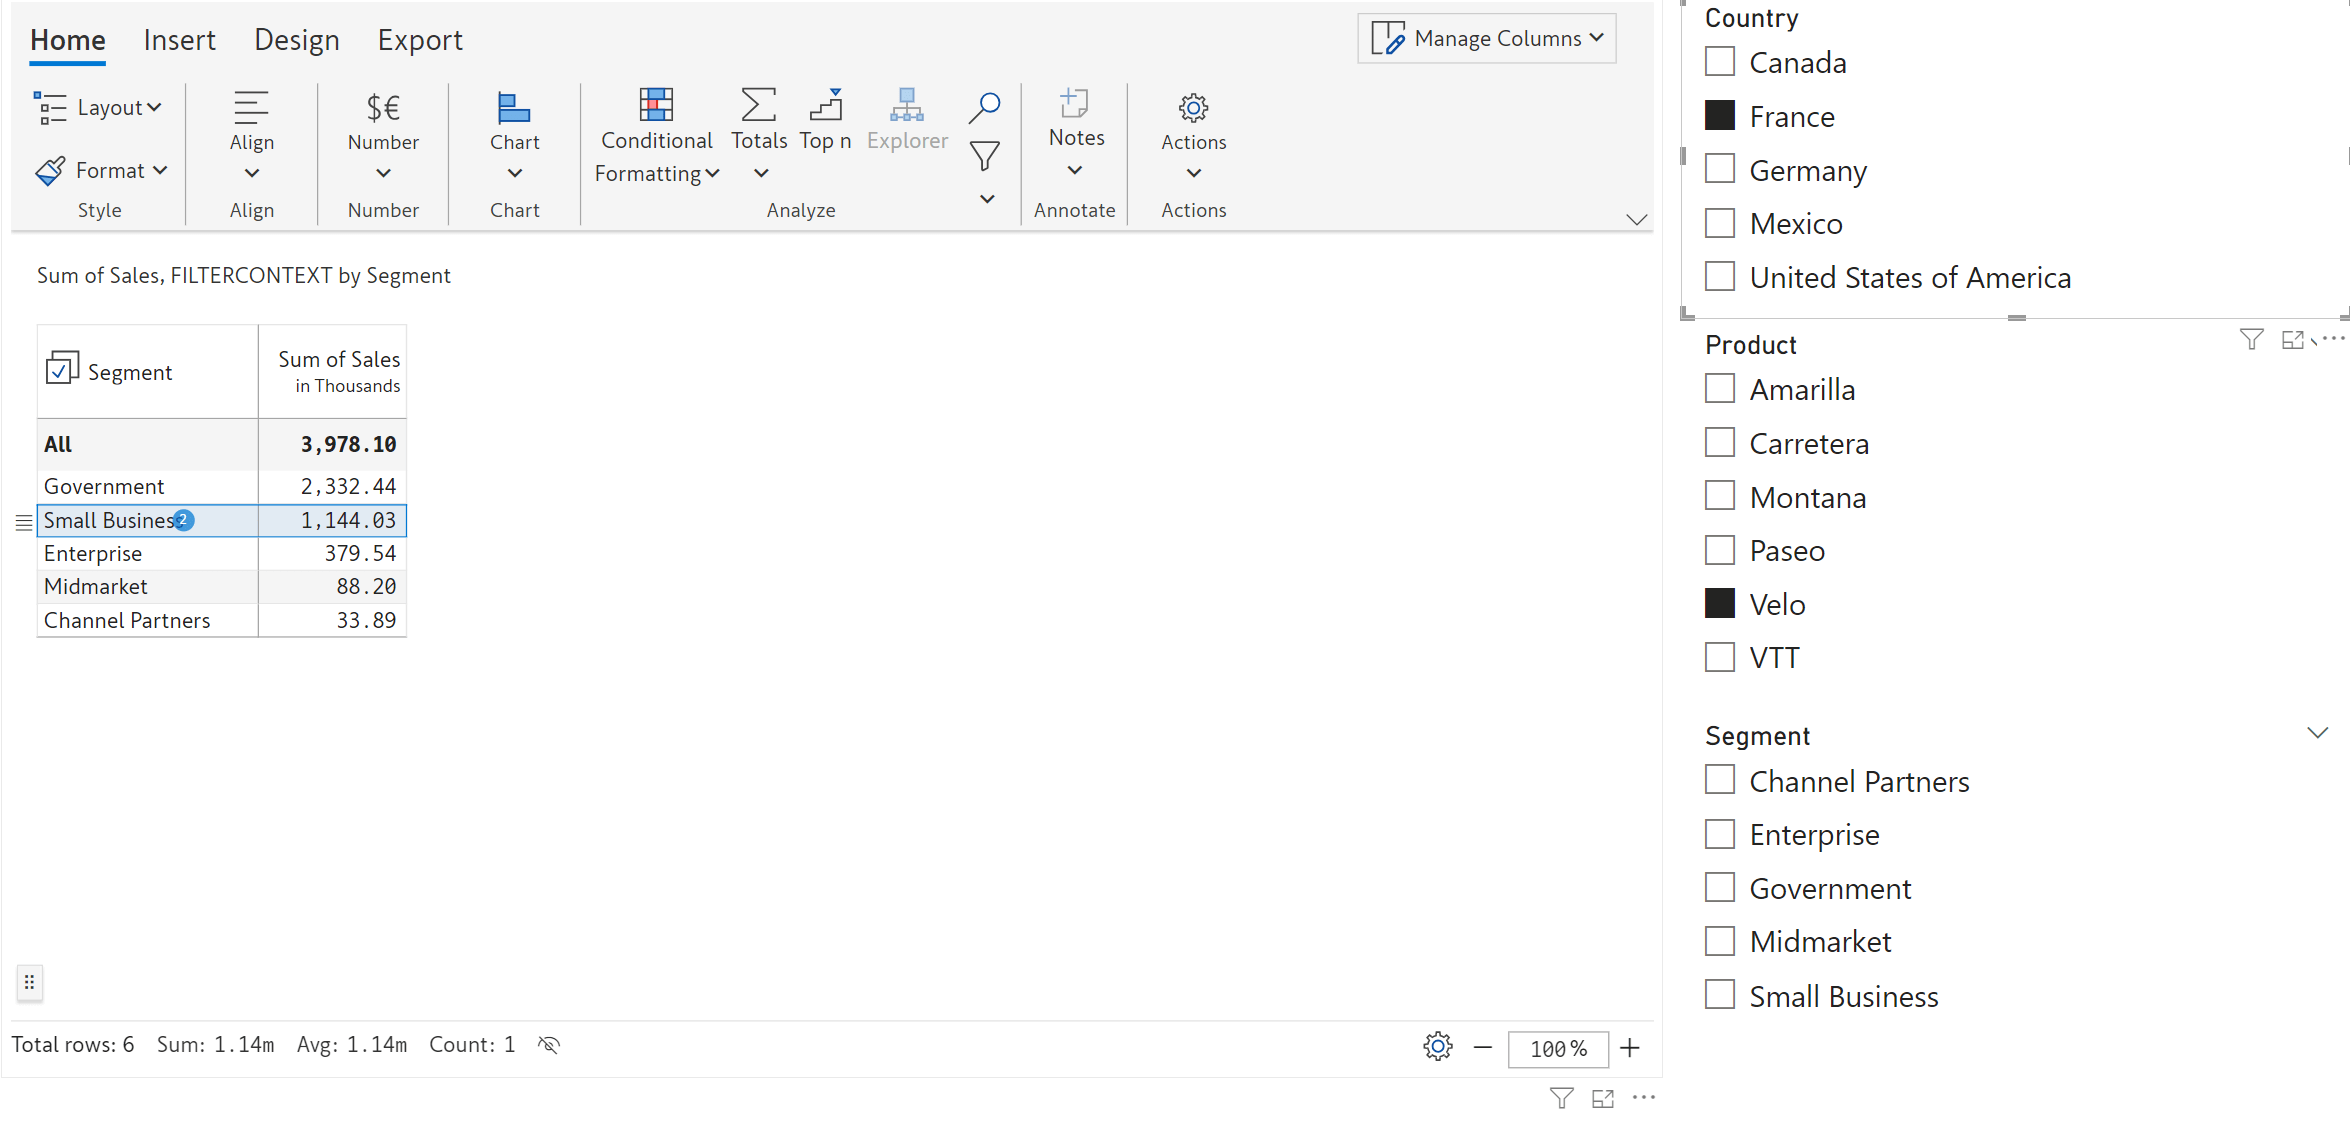
Inforiver notes are now responsive to context changes using filters/slicers! Click here to learn more about this feature.
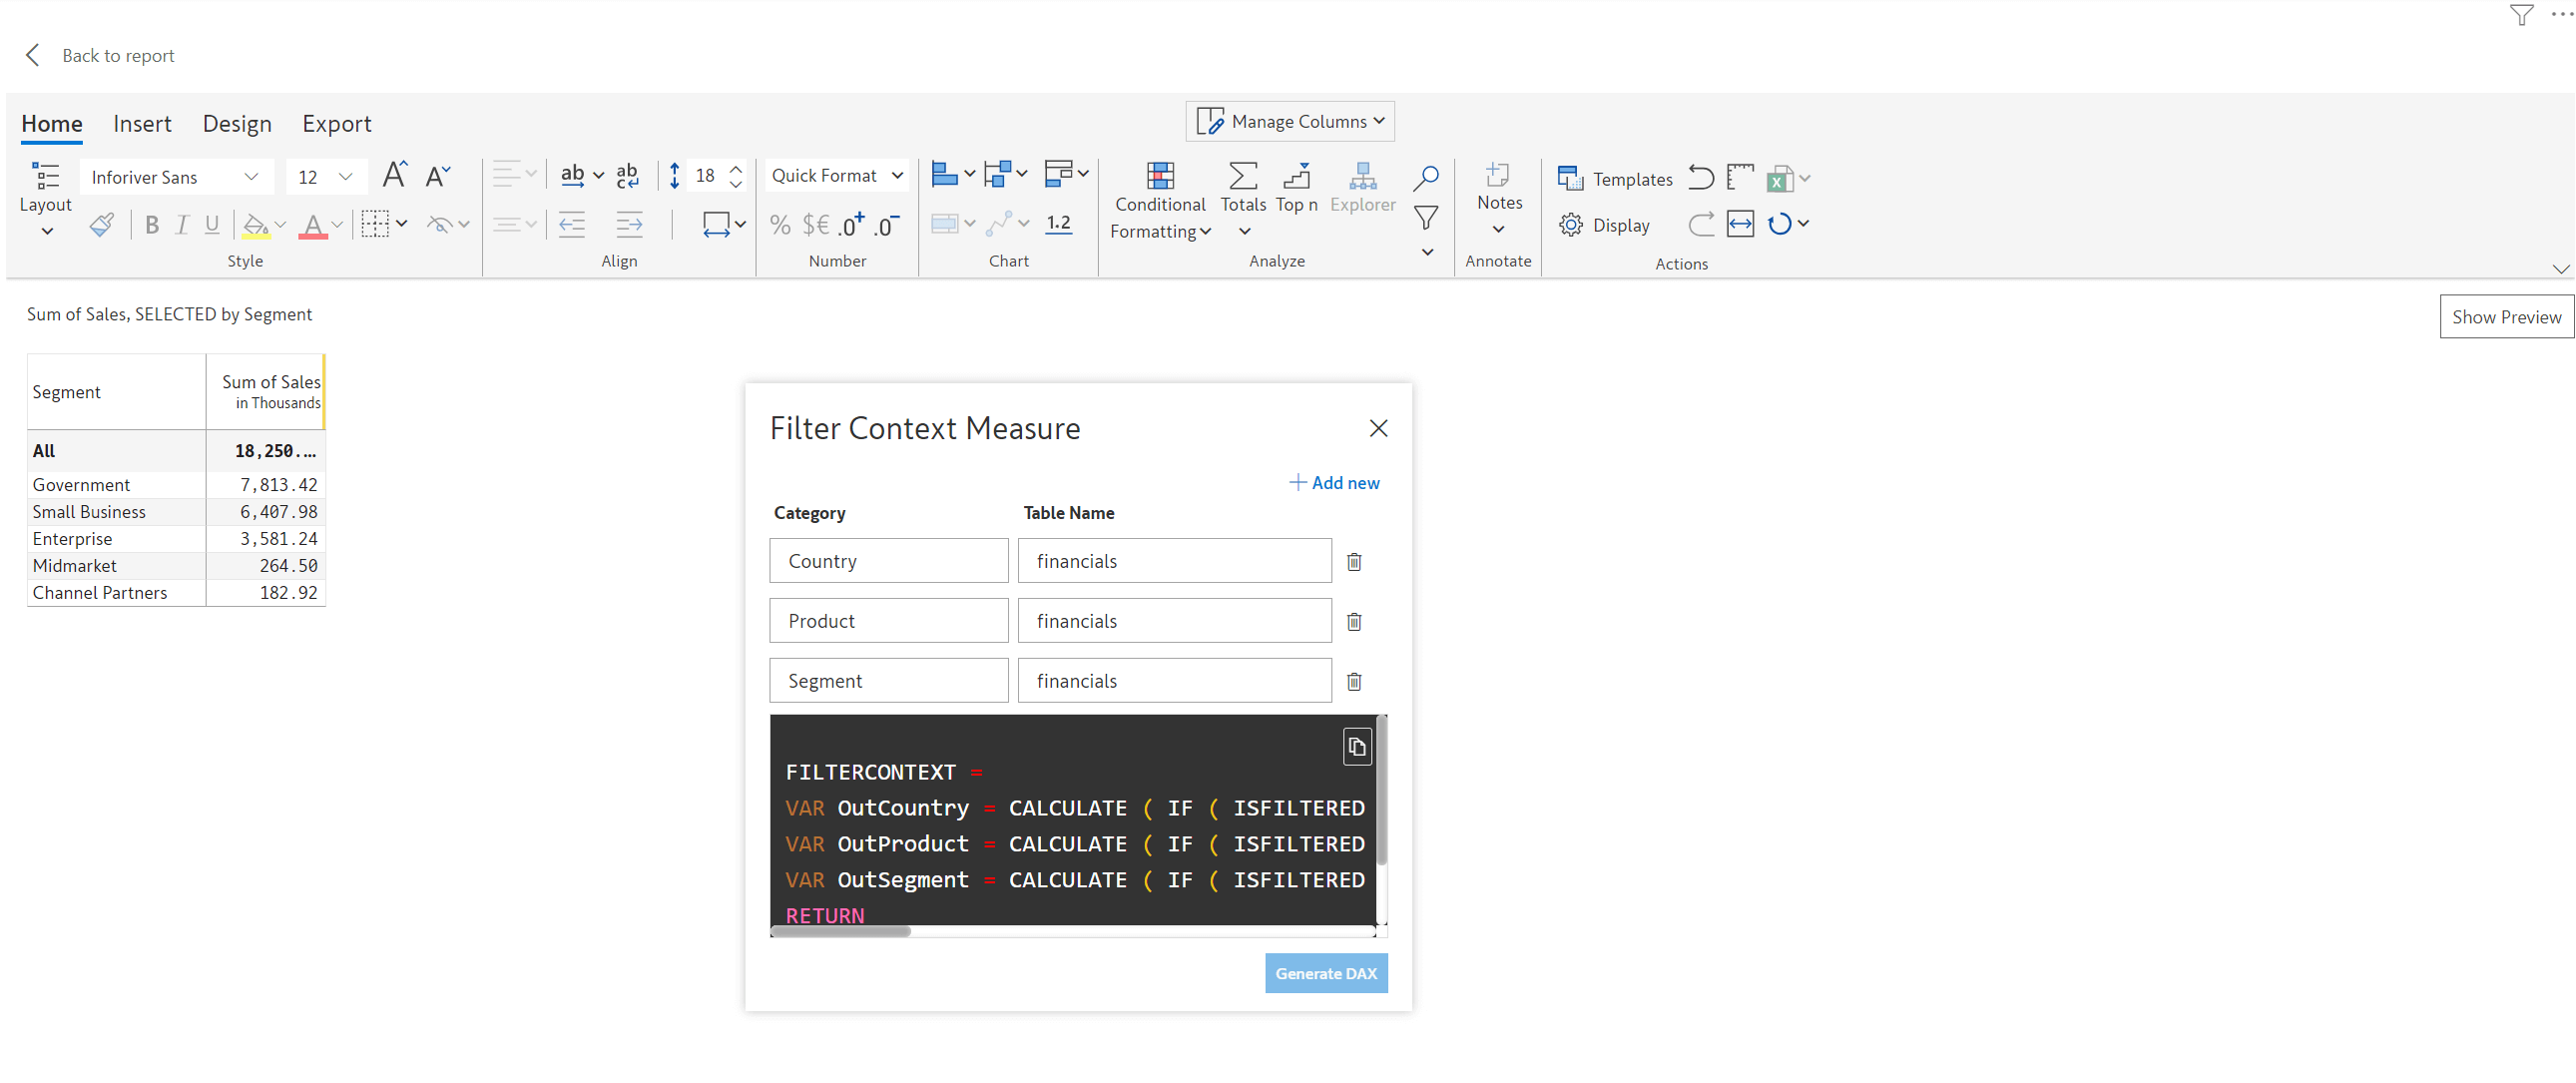
To use this feature, navigate to the Miscellaneous tab in Display settings and click on the Configure link against ‘Filter Context Measure’.
It is a straightforward no-code approach – input the category and table name required for the filter; create a new Measure using the DAX code that is auto-generated by Inforiver.
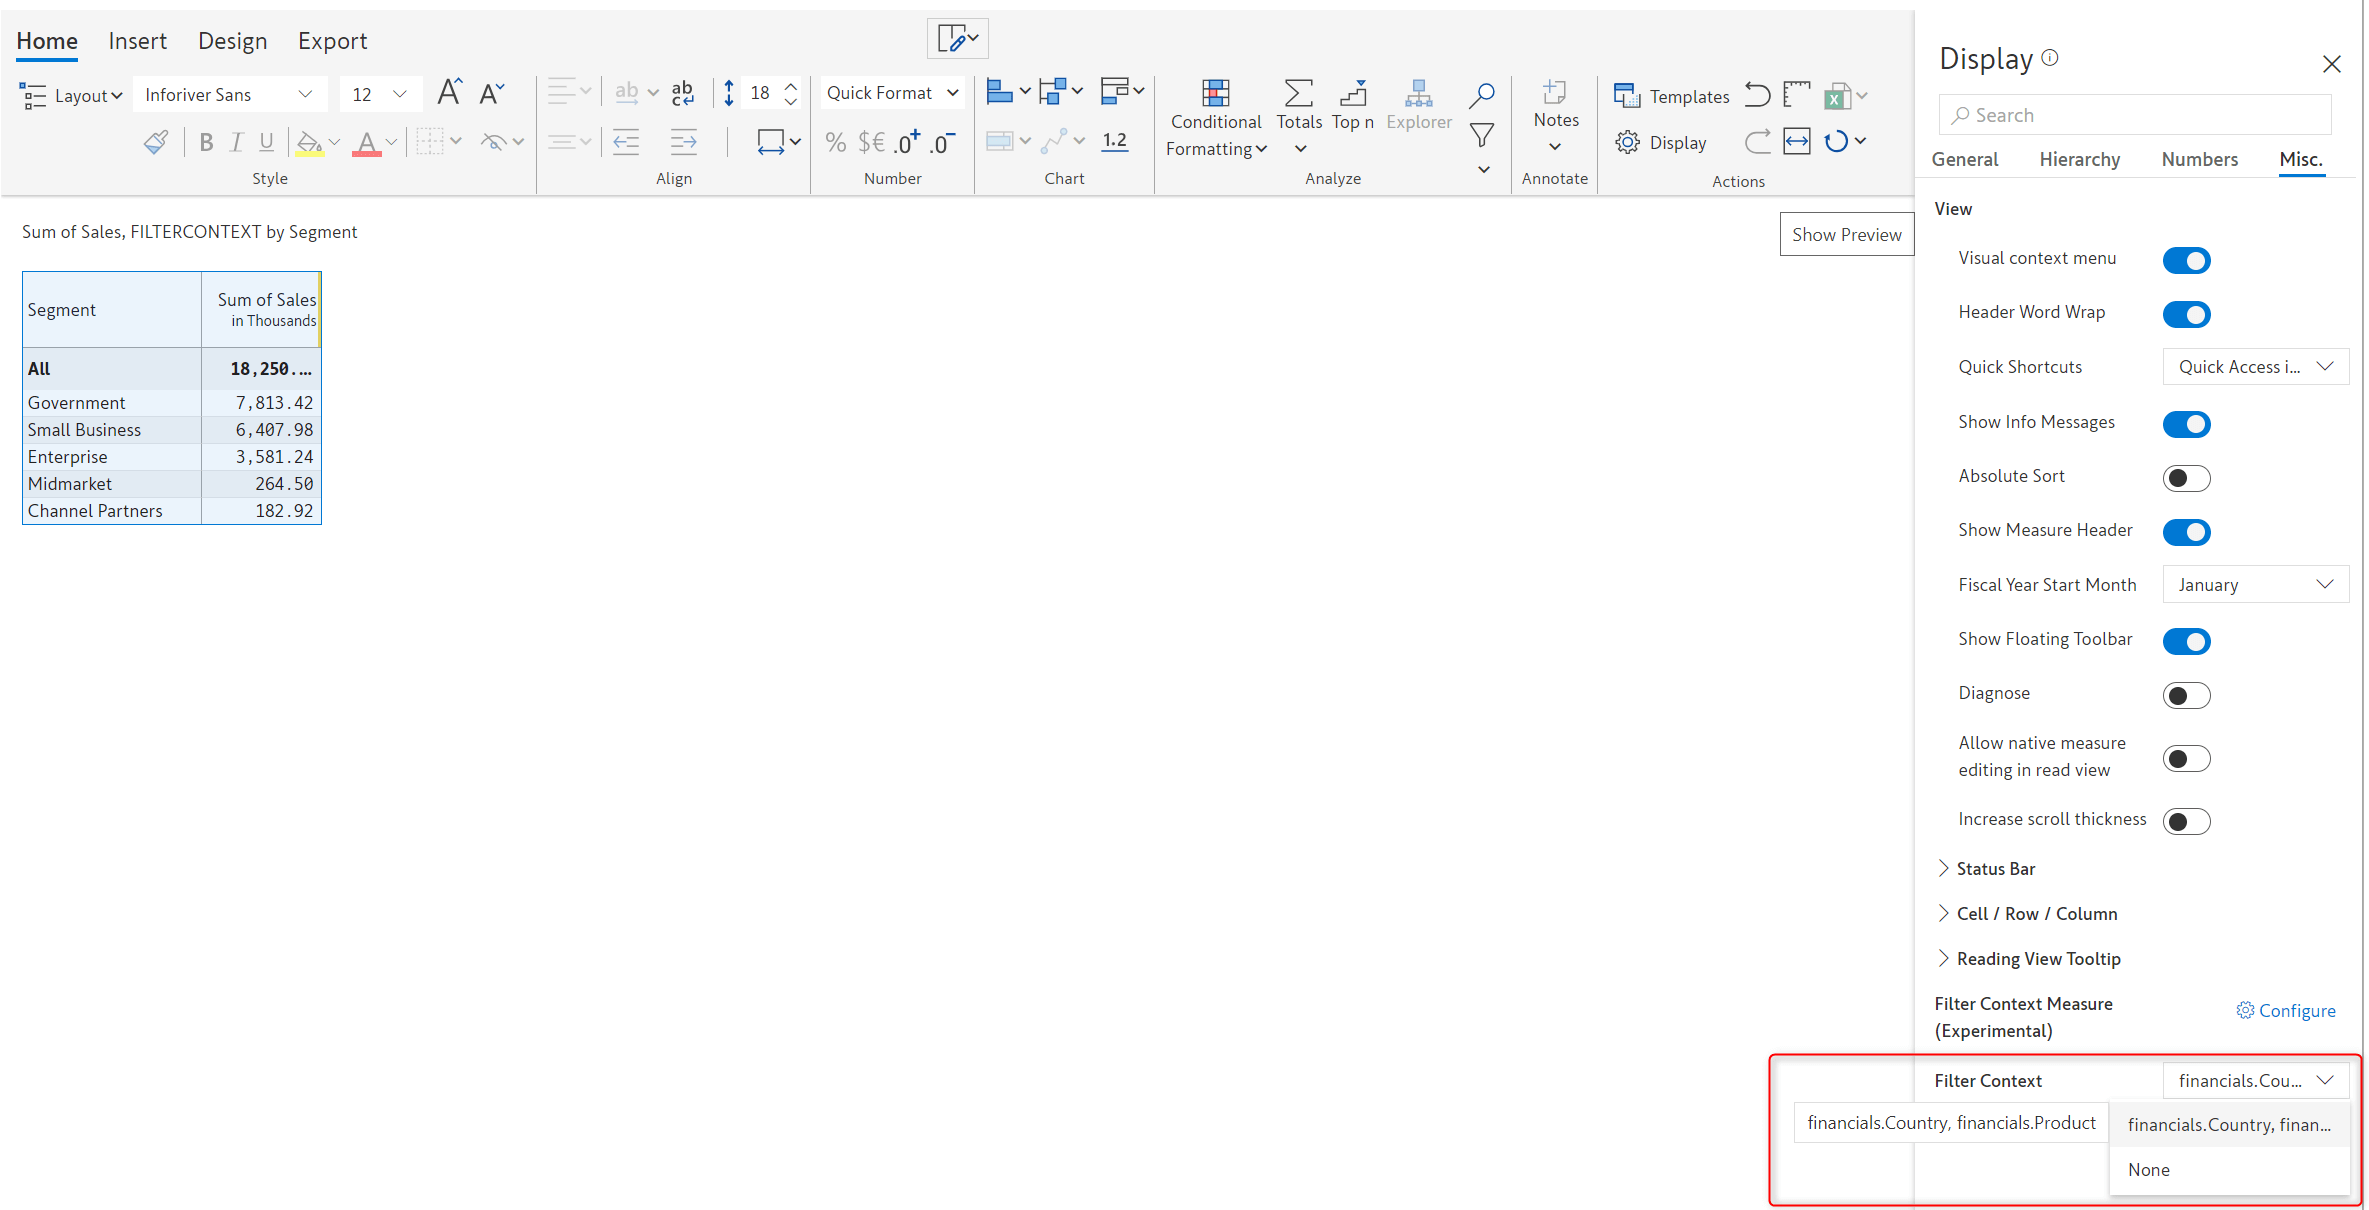
Once the new measure is added as a visual parameter, you will be able to select the category from the filter context dropdown.
After completing the initial setup - the notes added will get updated based on the filter selection.
We'd love to hear your ideas for Inforiver – be it a cool new feature or an improvement on existing features. Visit the Inforiver Community to share your ideas, vote on other submissions, and interact with other users.
Inforiver helps enterprises consolidate planning, reporting & analytics on a single platform (Power BI). The no-code, self-service award-winning platform has been recognized as the industry’s best and is adopted by many Fortune 100 firms.
Inforiver is a product of Lumel, the #1 Power BI AppSource Partner. The firm serves over 3,000 customers worldwide through its portfolio of products offered under the brands Inforiver, EDITable, ValQ, and xViz.