Upcoming webinar on 'Inforiver Charts : The fastest way to deliver stories in Power BI', Aug 29th , Monday, 10.30 AM CST. Register Now
Upcoming webinar on 'Inforiver Charts : The fastest way to deliver stories in Power BI', Aug 29th , Monday, 10.30 AM CST. Register Now
Welcome to the Inforiver Enterprise 2.0 release update. We are thrilled to announce several new features and key enhancements to data input, writeback, performance, security, and UI/UX. This release also introduces support for several key use cases such as scenarios, rolling forecast, rolling comments and delta writeback most anticipated by our Inforiver community!
Key enhancements in this 2.0 release are listed below. Feel free to jump to any specific section for more details.
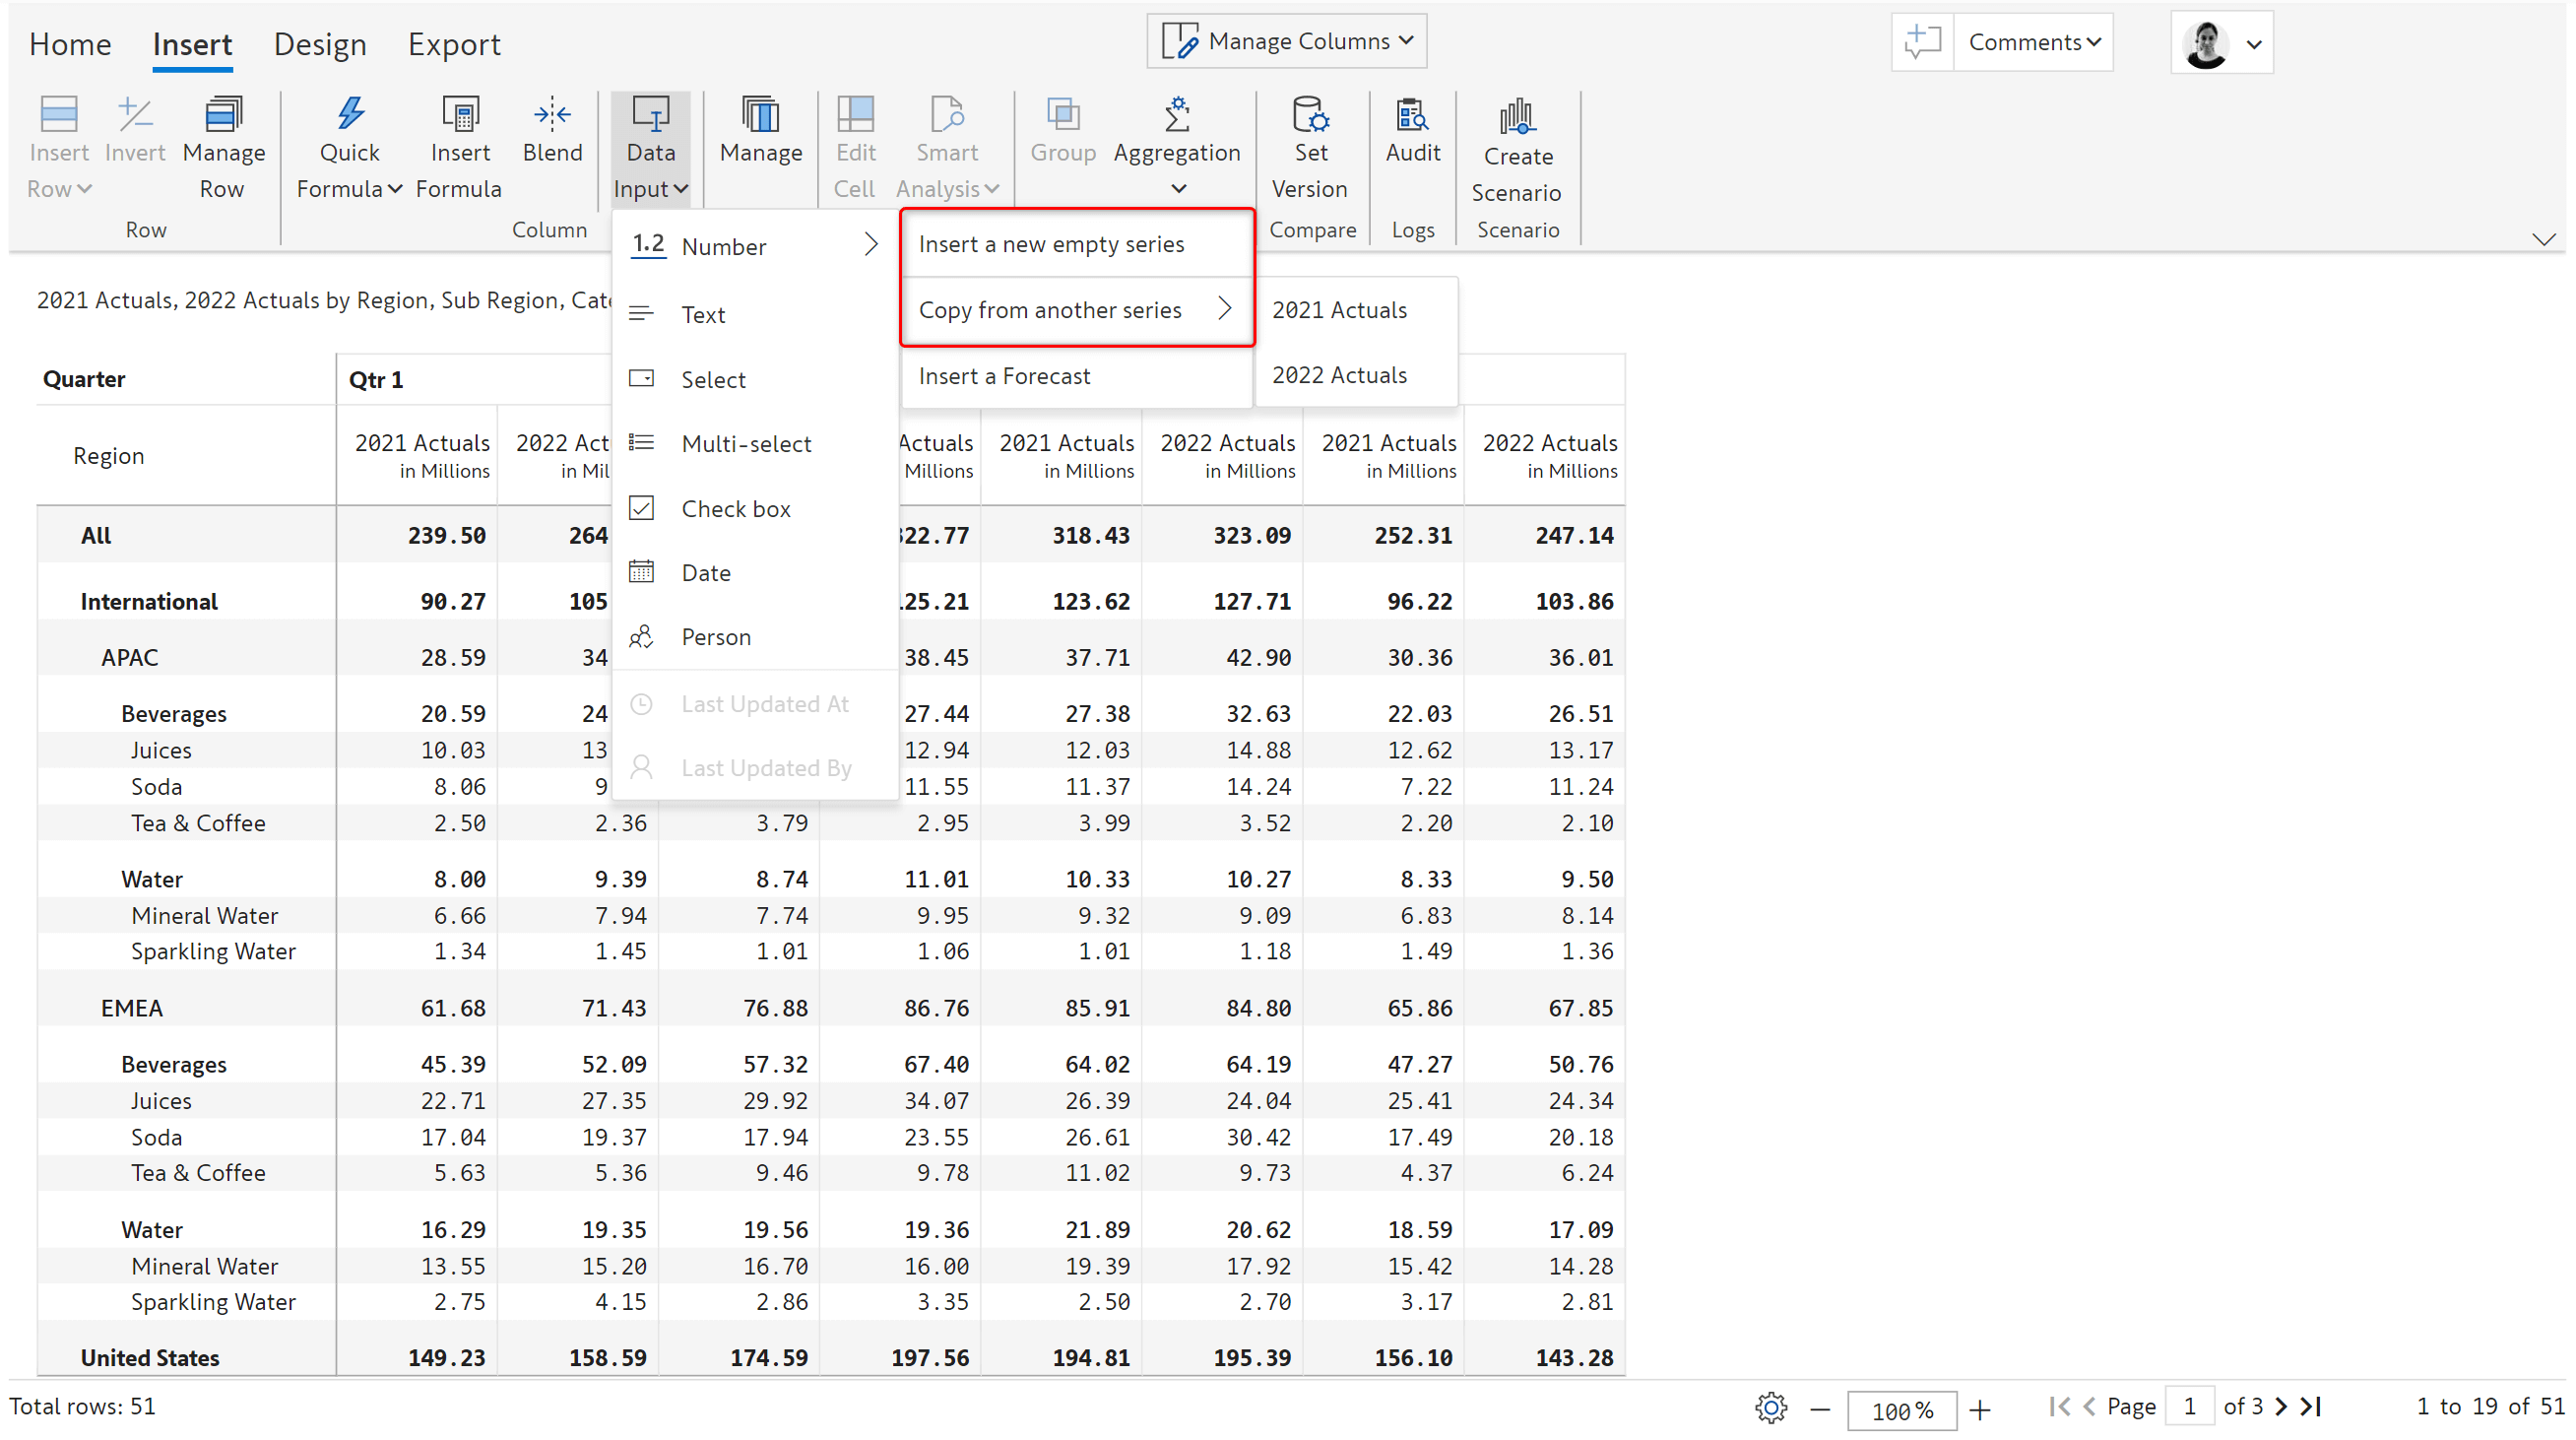
1. Copy series or create blank series
With 2.0, you can easily create budgets and forecasts from scratch or copy from an existing series.
2. Rolling forecast (New use case)
You can now easily generate rolling forecast series using a range of options. You can copy values from multiple measures for different periods or use the average of the previous 3 closing periods etc.
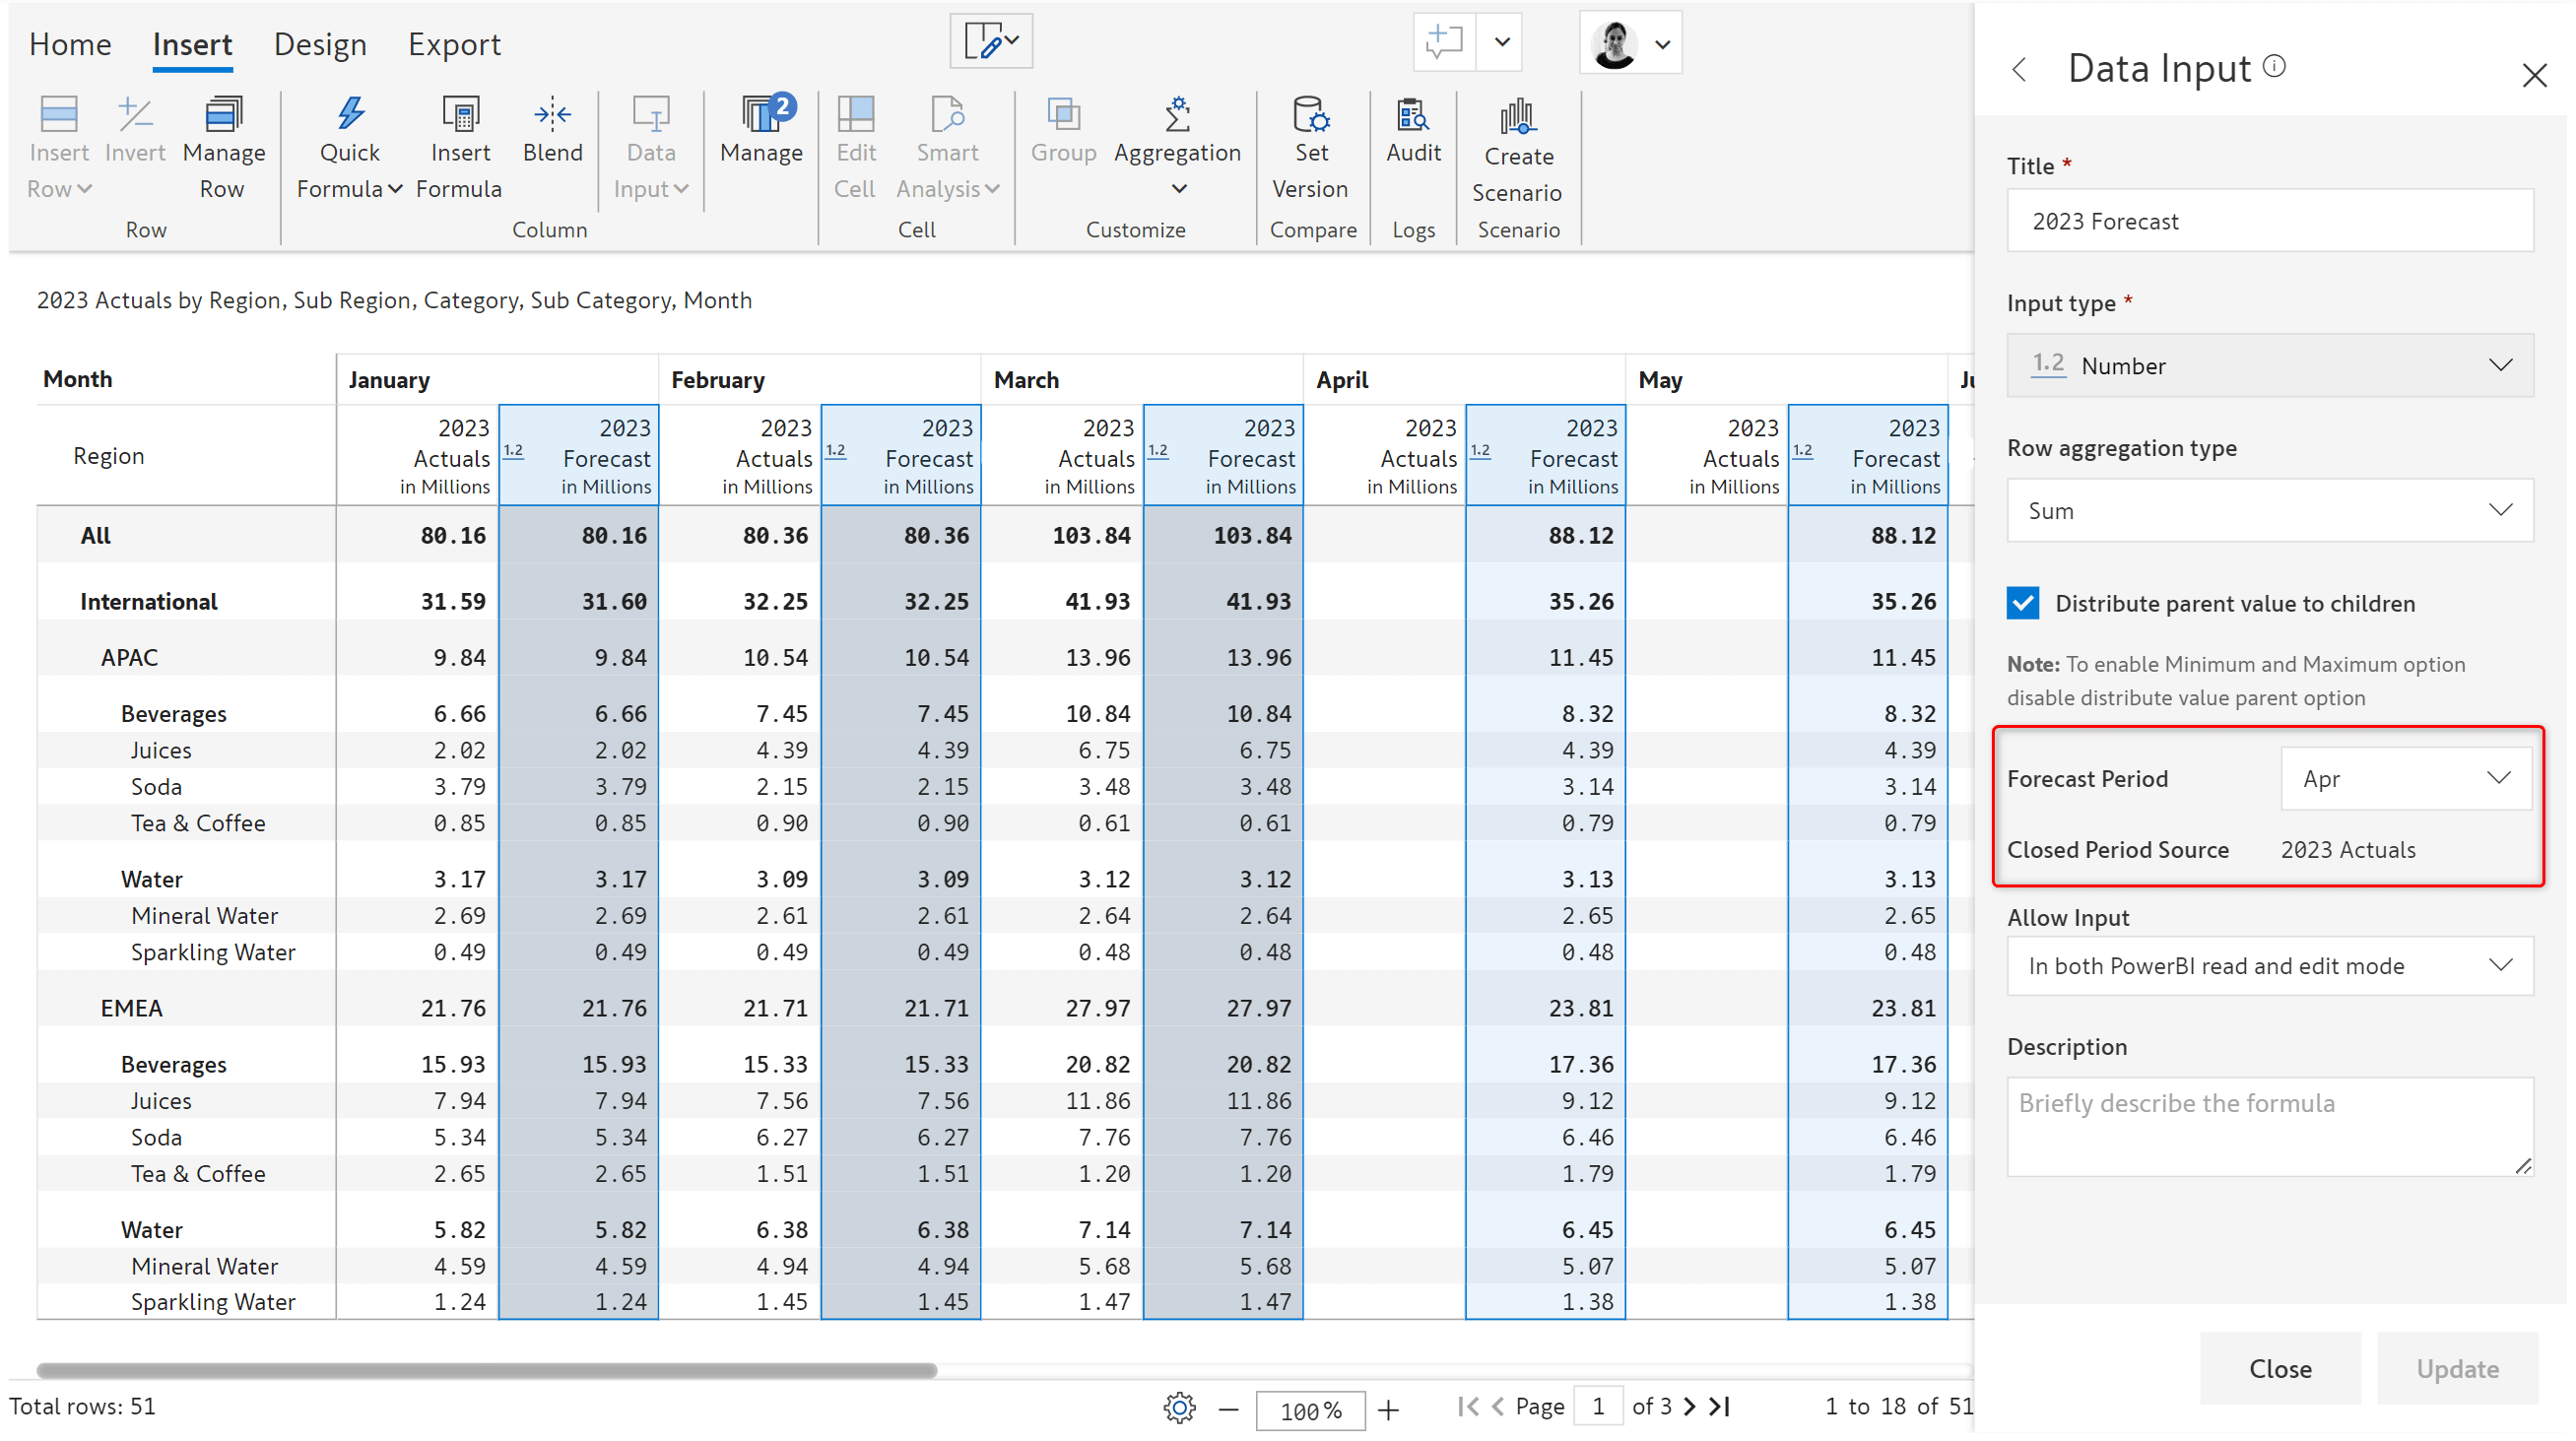
To update the rolling forecast series, you can simply refresh the values of actuals for closed periods.

1. Rollup comments
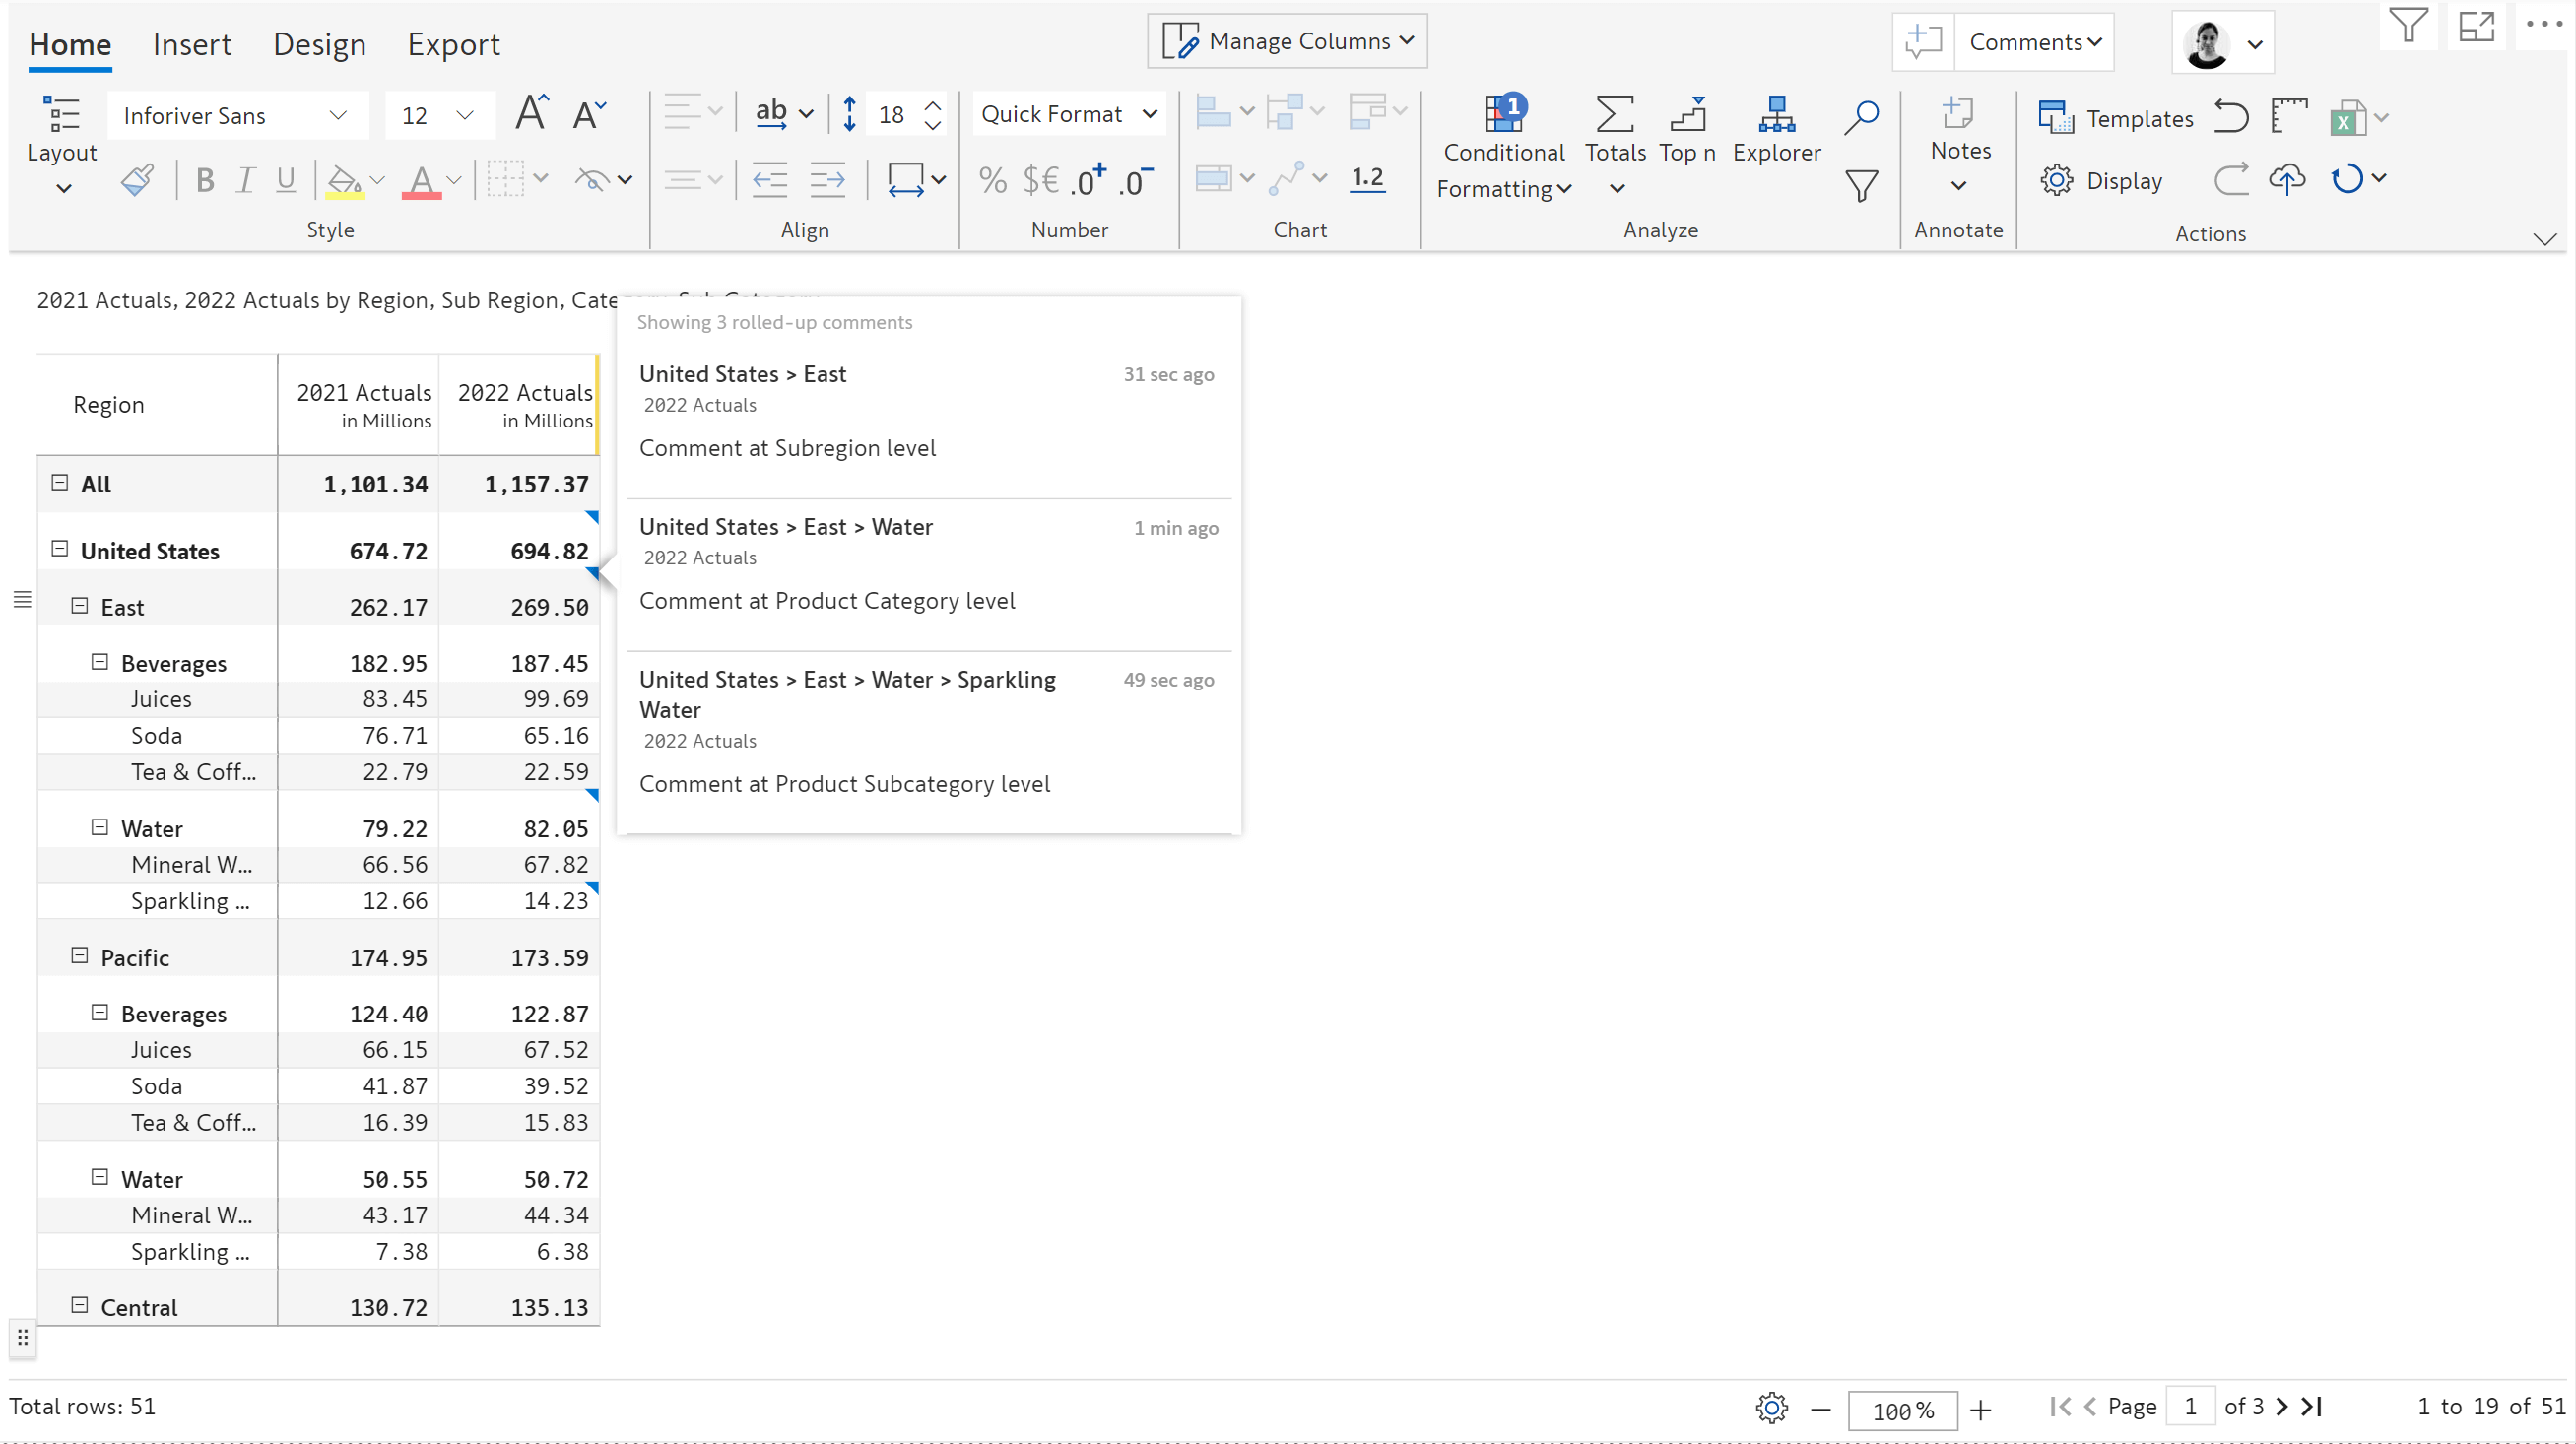
In reports with large number of hierarchies, you can see comments rolled up at the subtotal and grand total level even if the hierarchies are collapsed. This enables executives to see collapsed and summarized reports but still see exception comments rolled up at the parent levels.
2. UI enhancements to comments thread and side panel
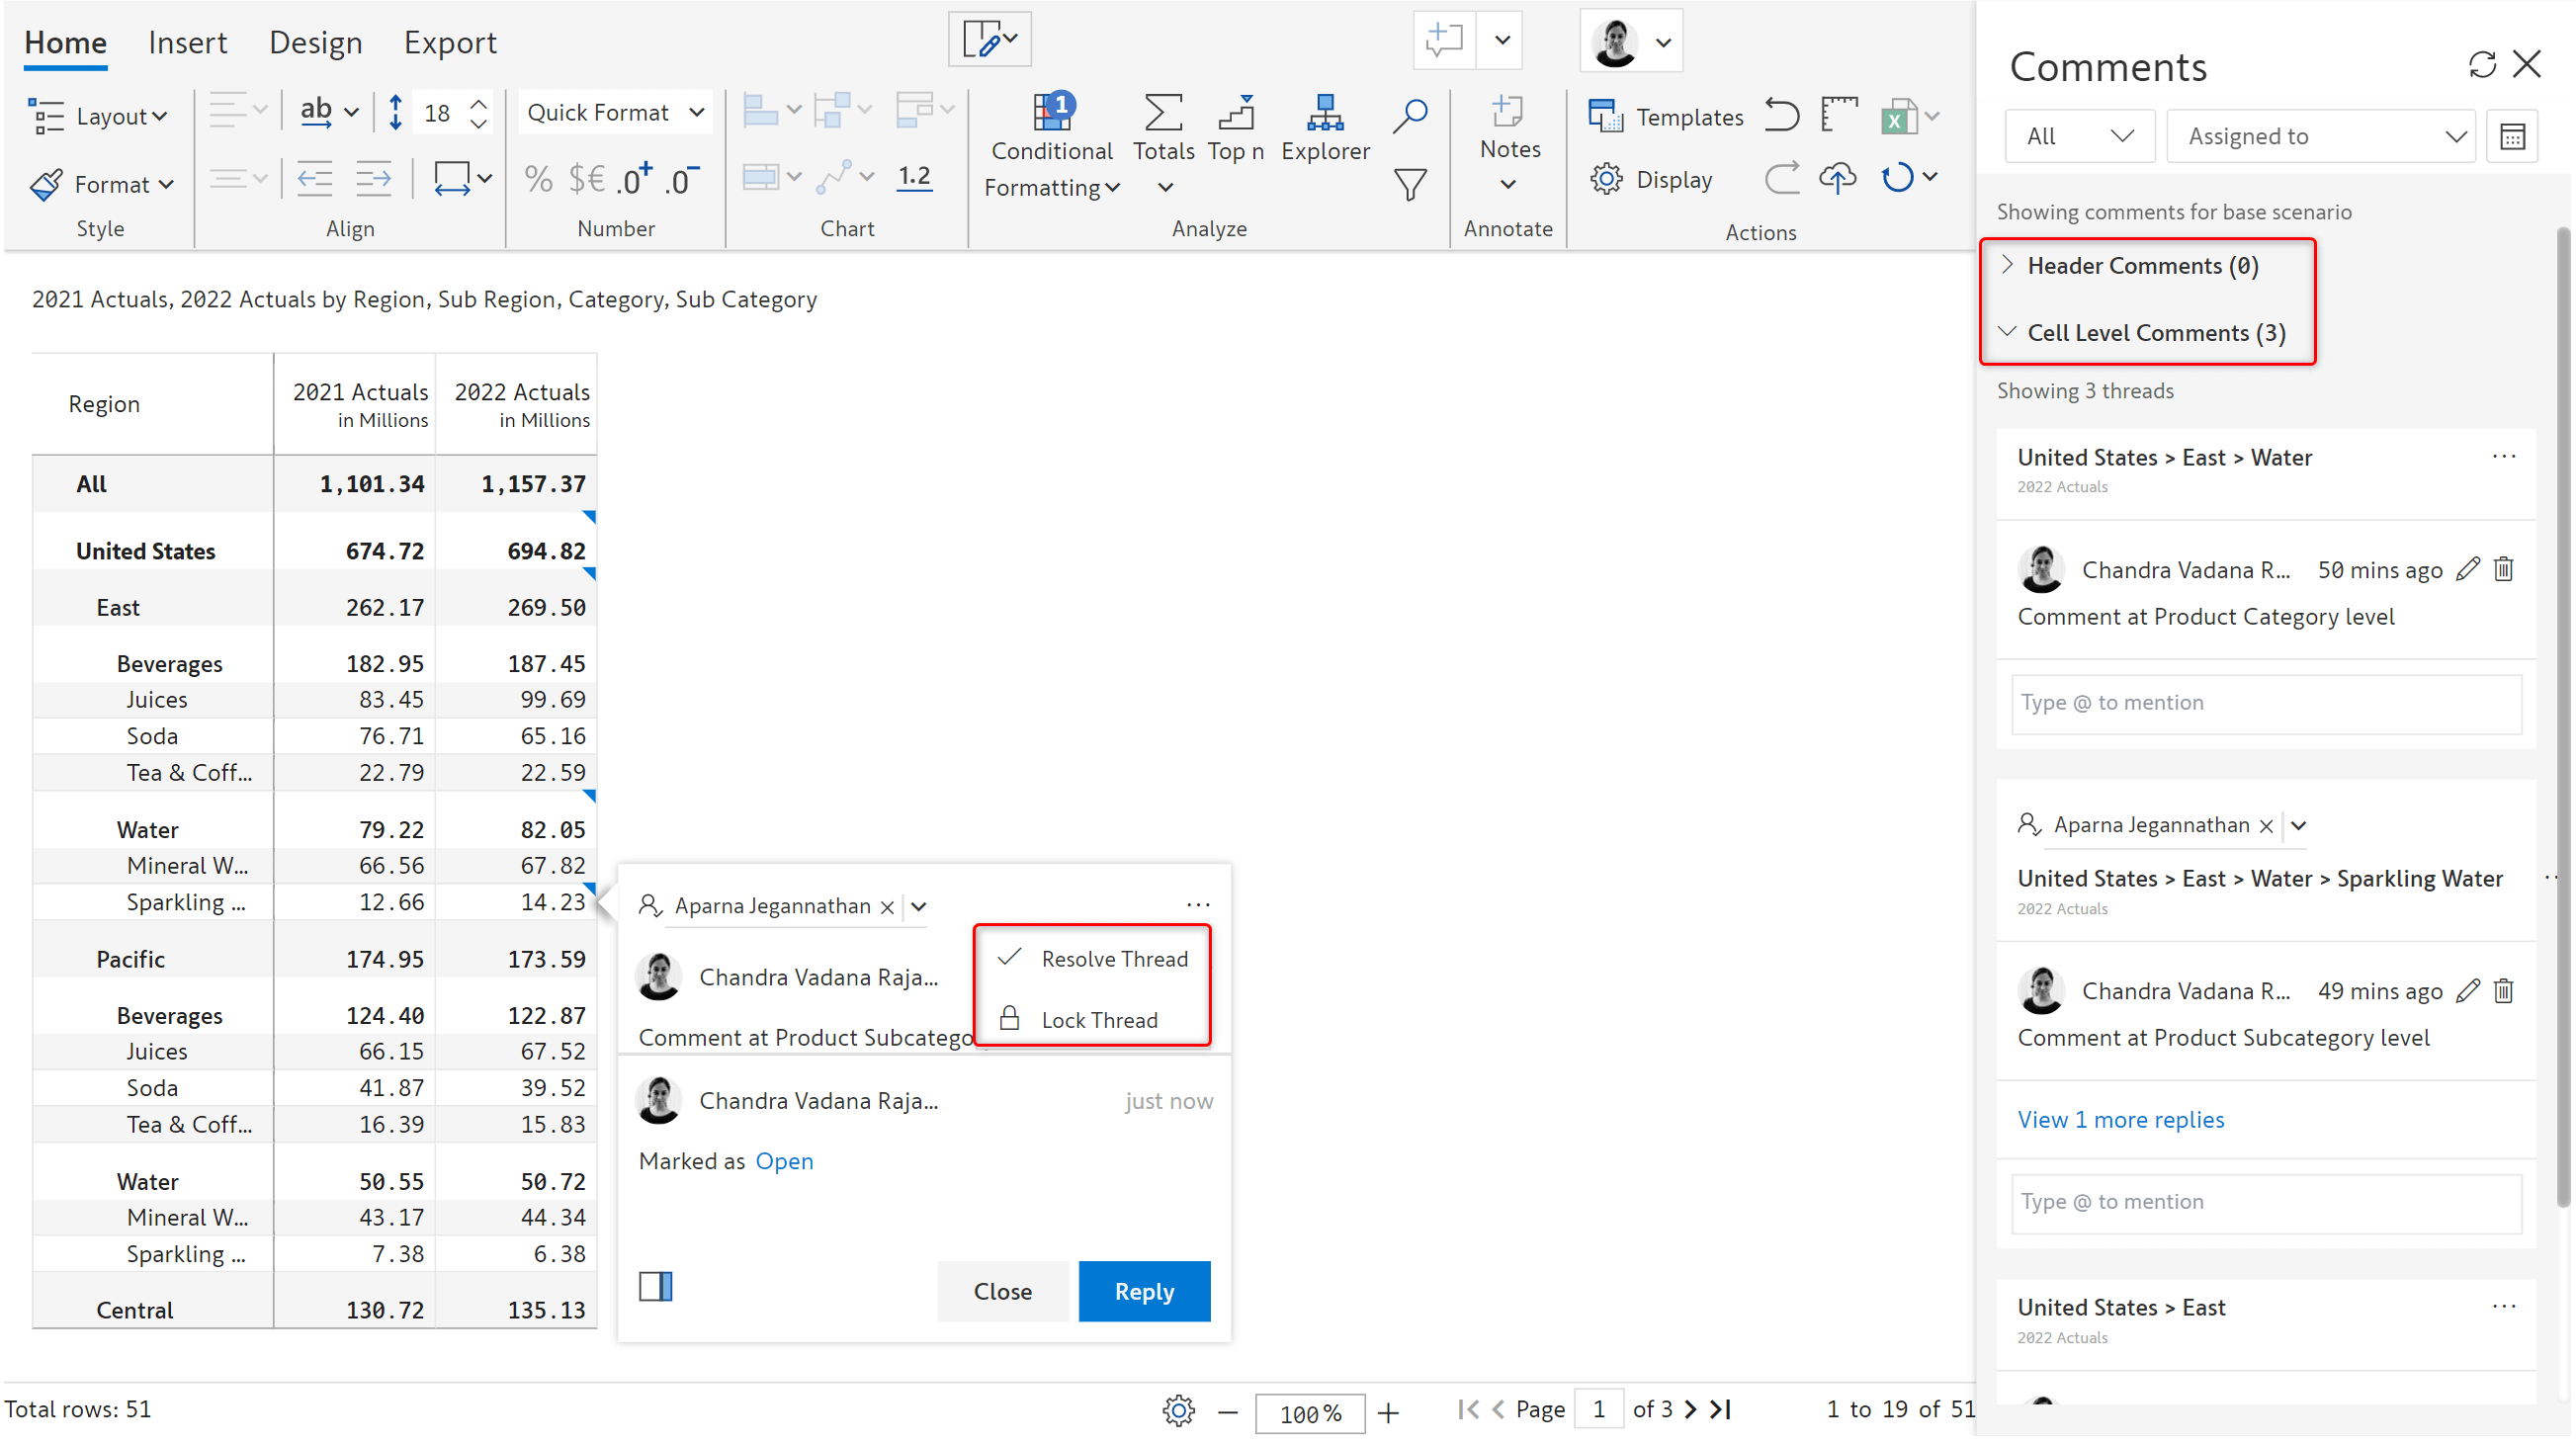
The lock thread option and header & cell level comments sections in the side panel have been modified for improved usability.
1. Scenarios (New use case)
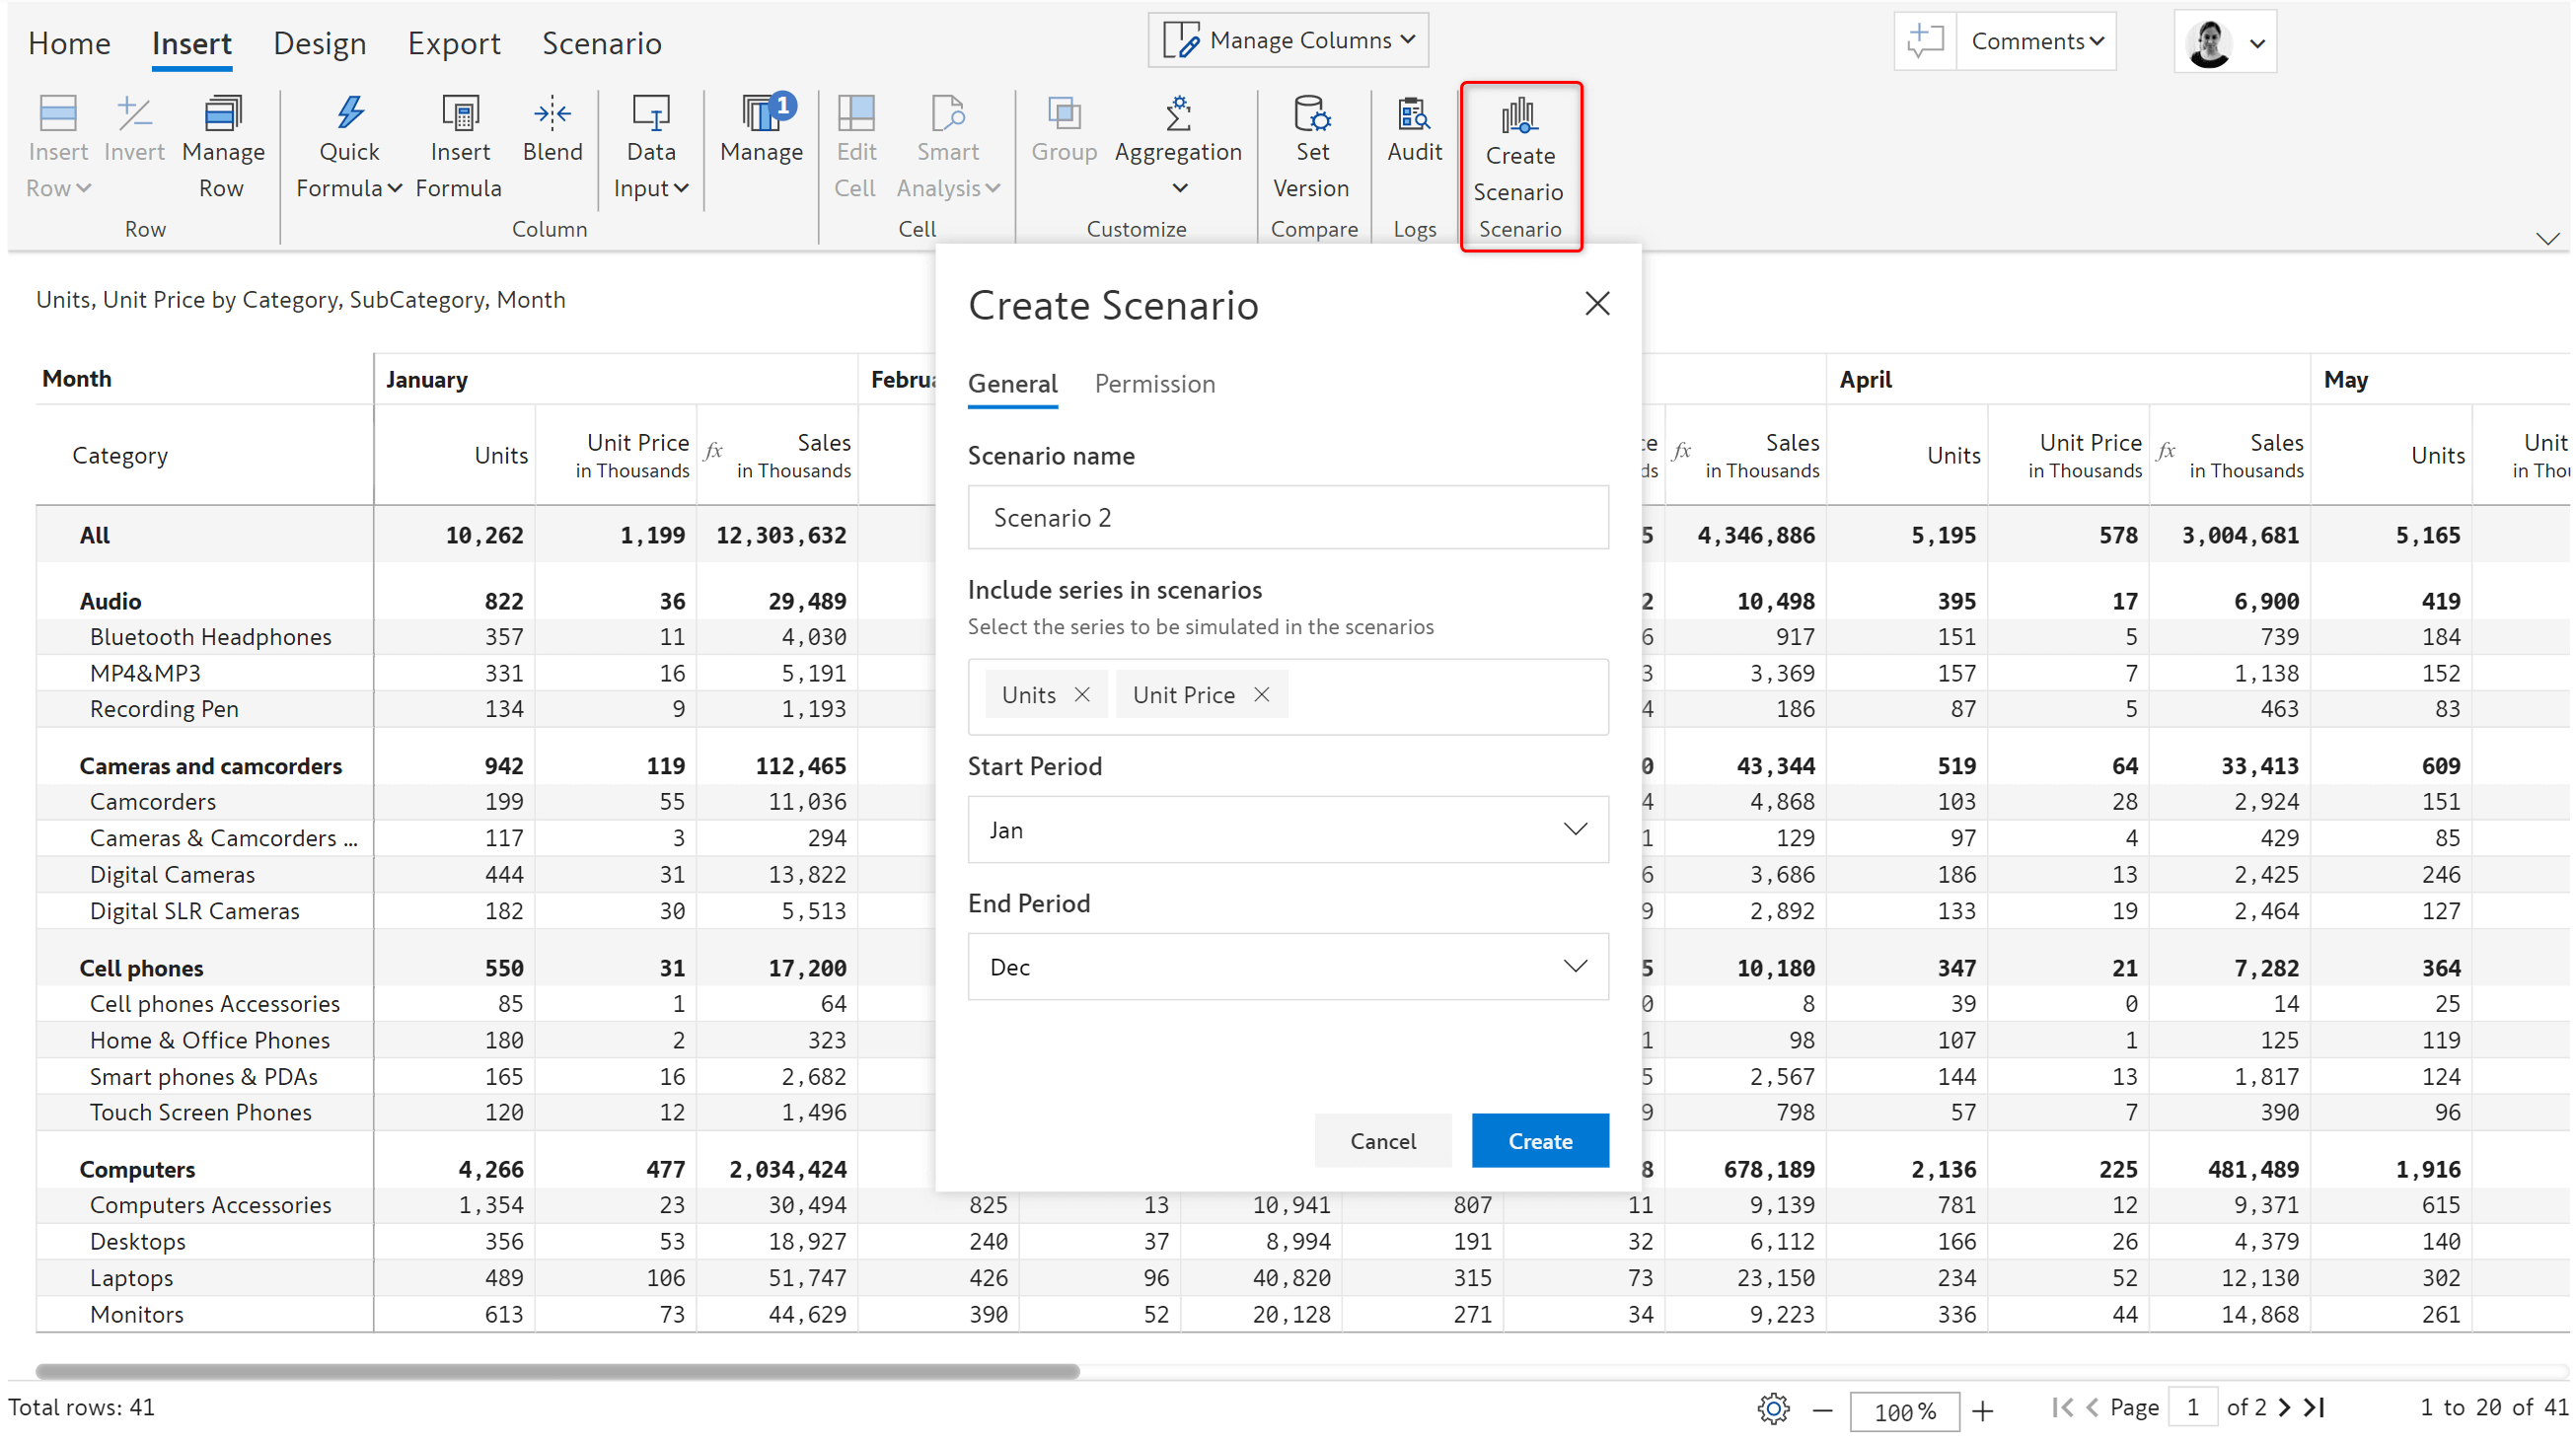
Inforiver Enterprise 2.0 introduces the ability to create new scenarios in edit and read modes based on an existing series for ad-hoc analysis.
In this example, Units and Unit Price are data source measures and the Sales measure is calculated in Inforiver. To modify the values of the input columns and analyze the effect on Sales, you can create a scenario as shown below. You can also define the start and end periods.
Once a scenario is created, you can either simulate or perform allocations on the native measures. Simulations get tracked as shown in the below image. You can also see the scenarios created above the status bar.
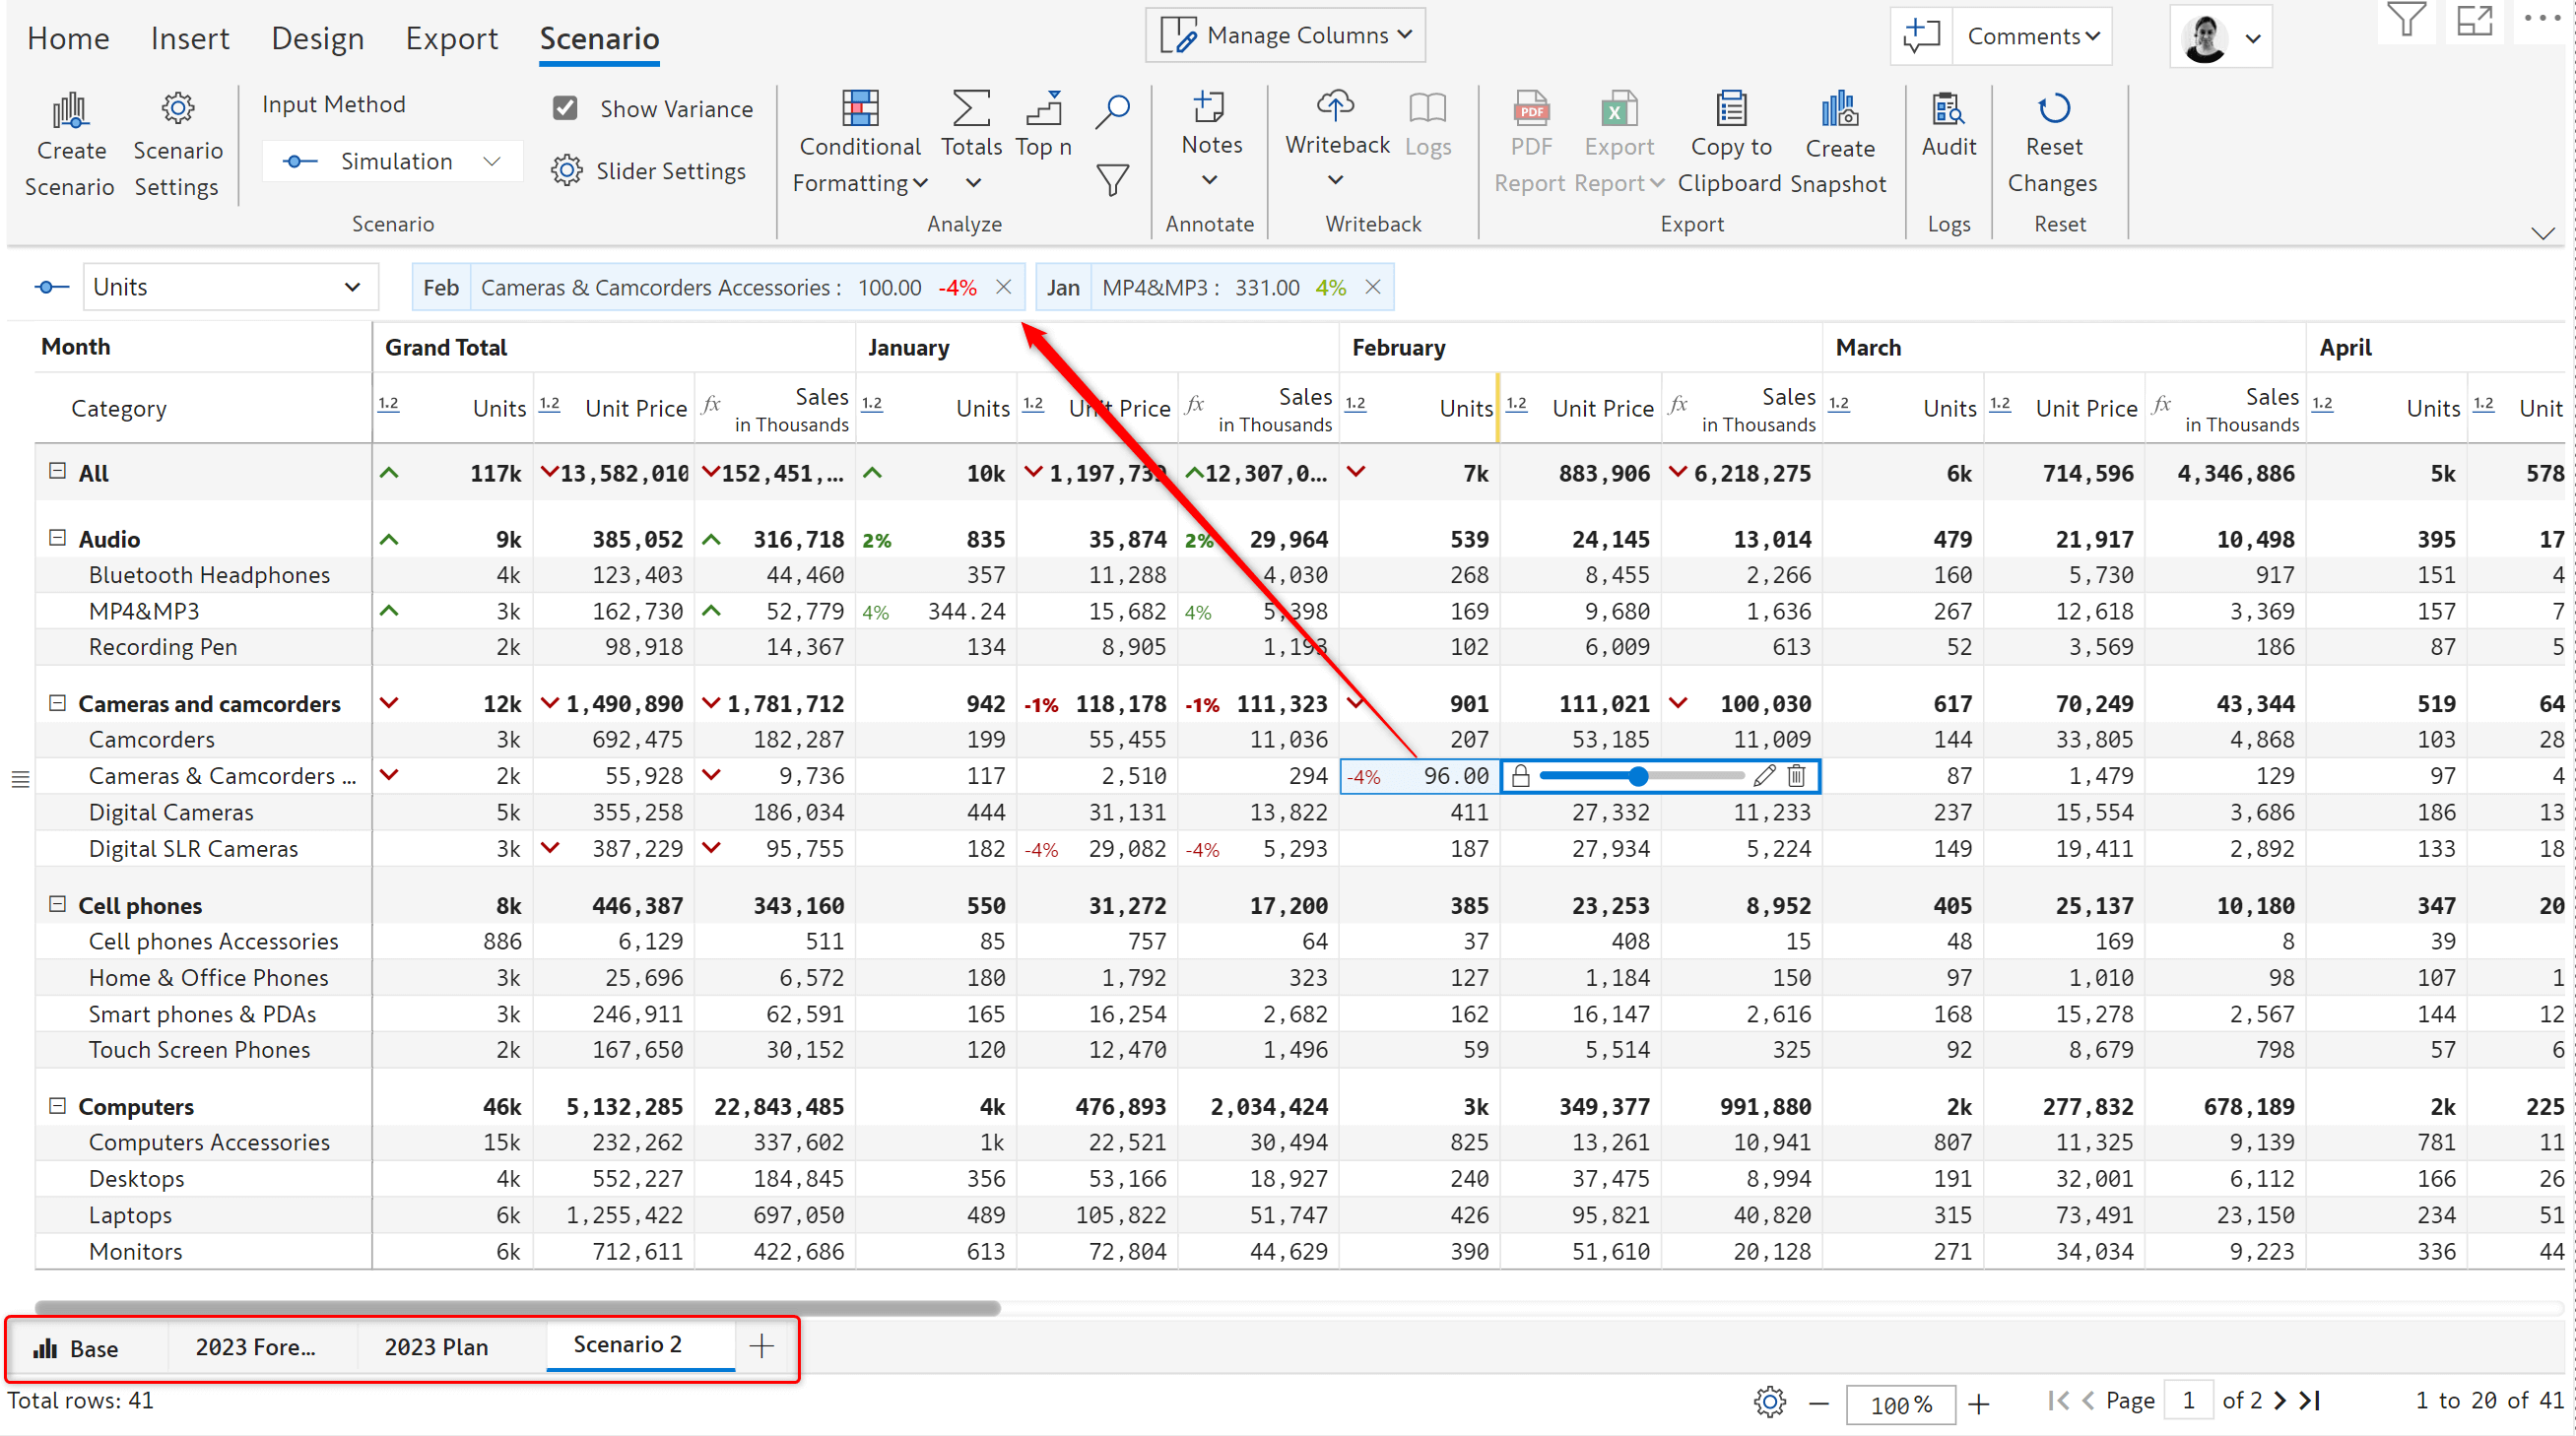
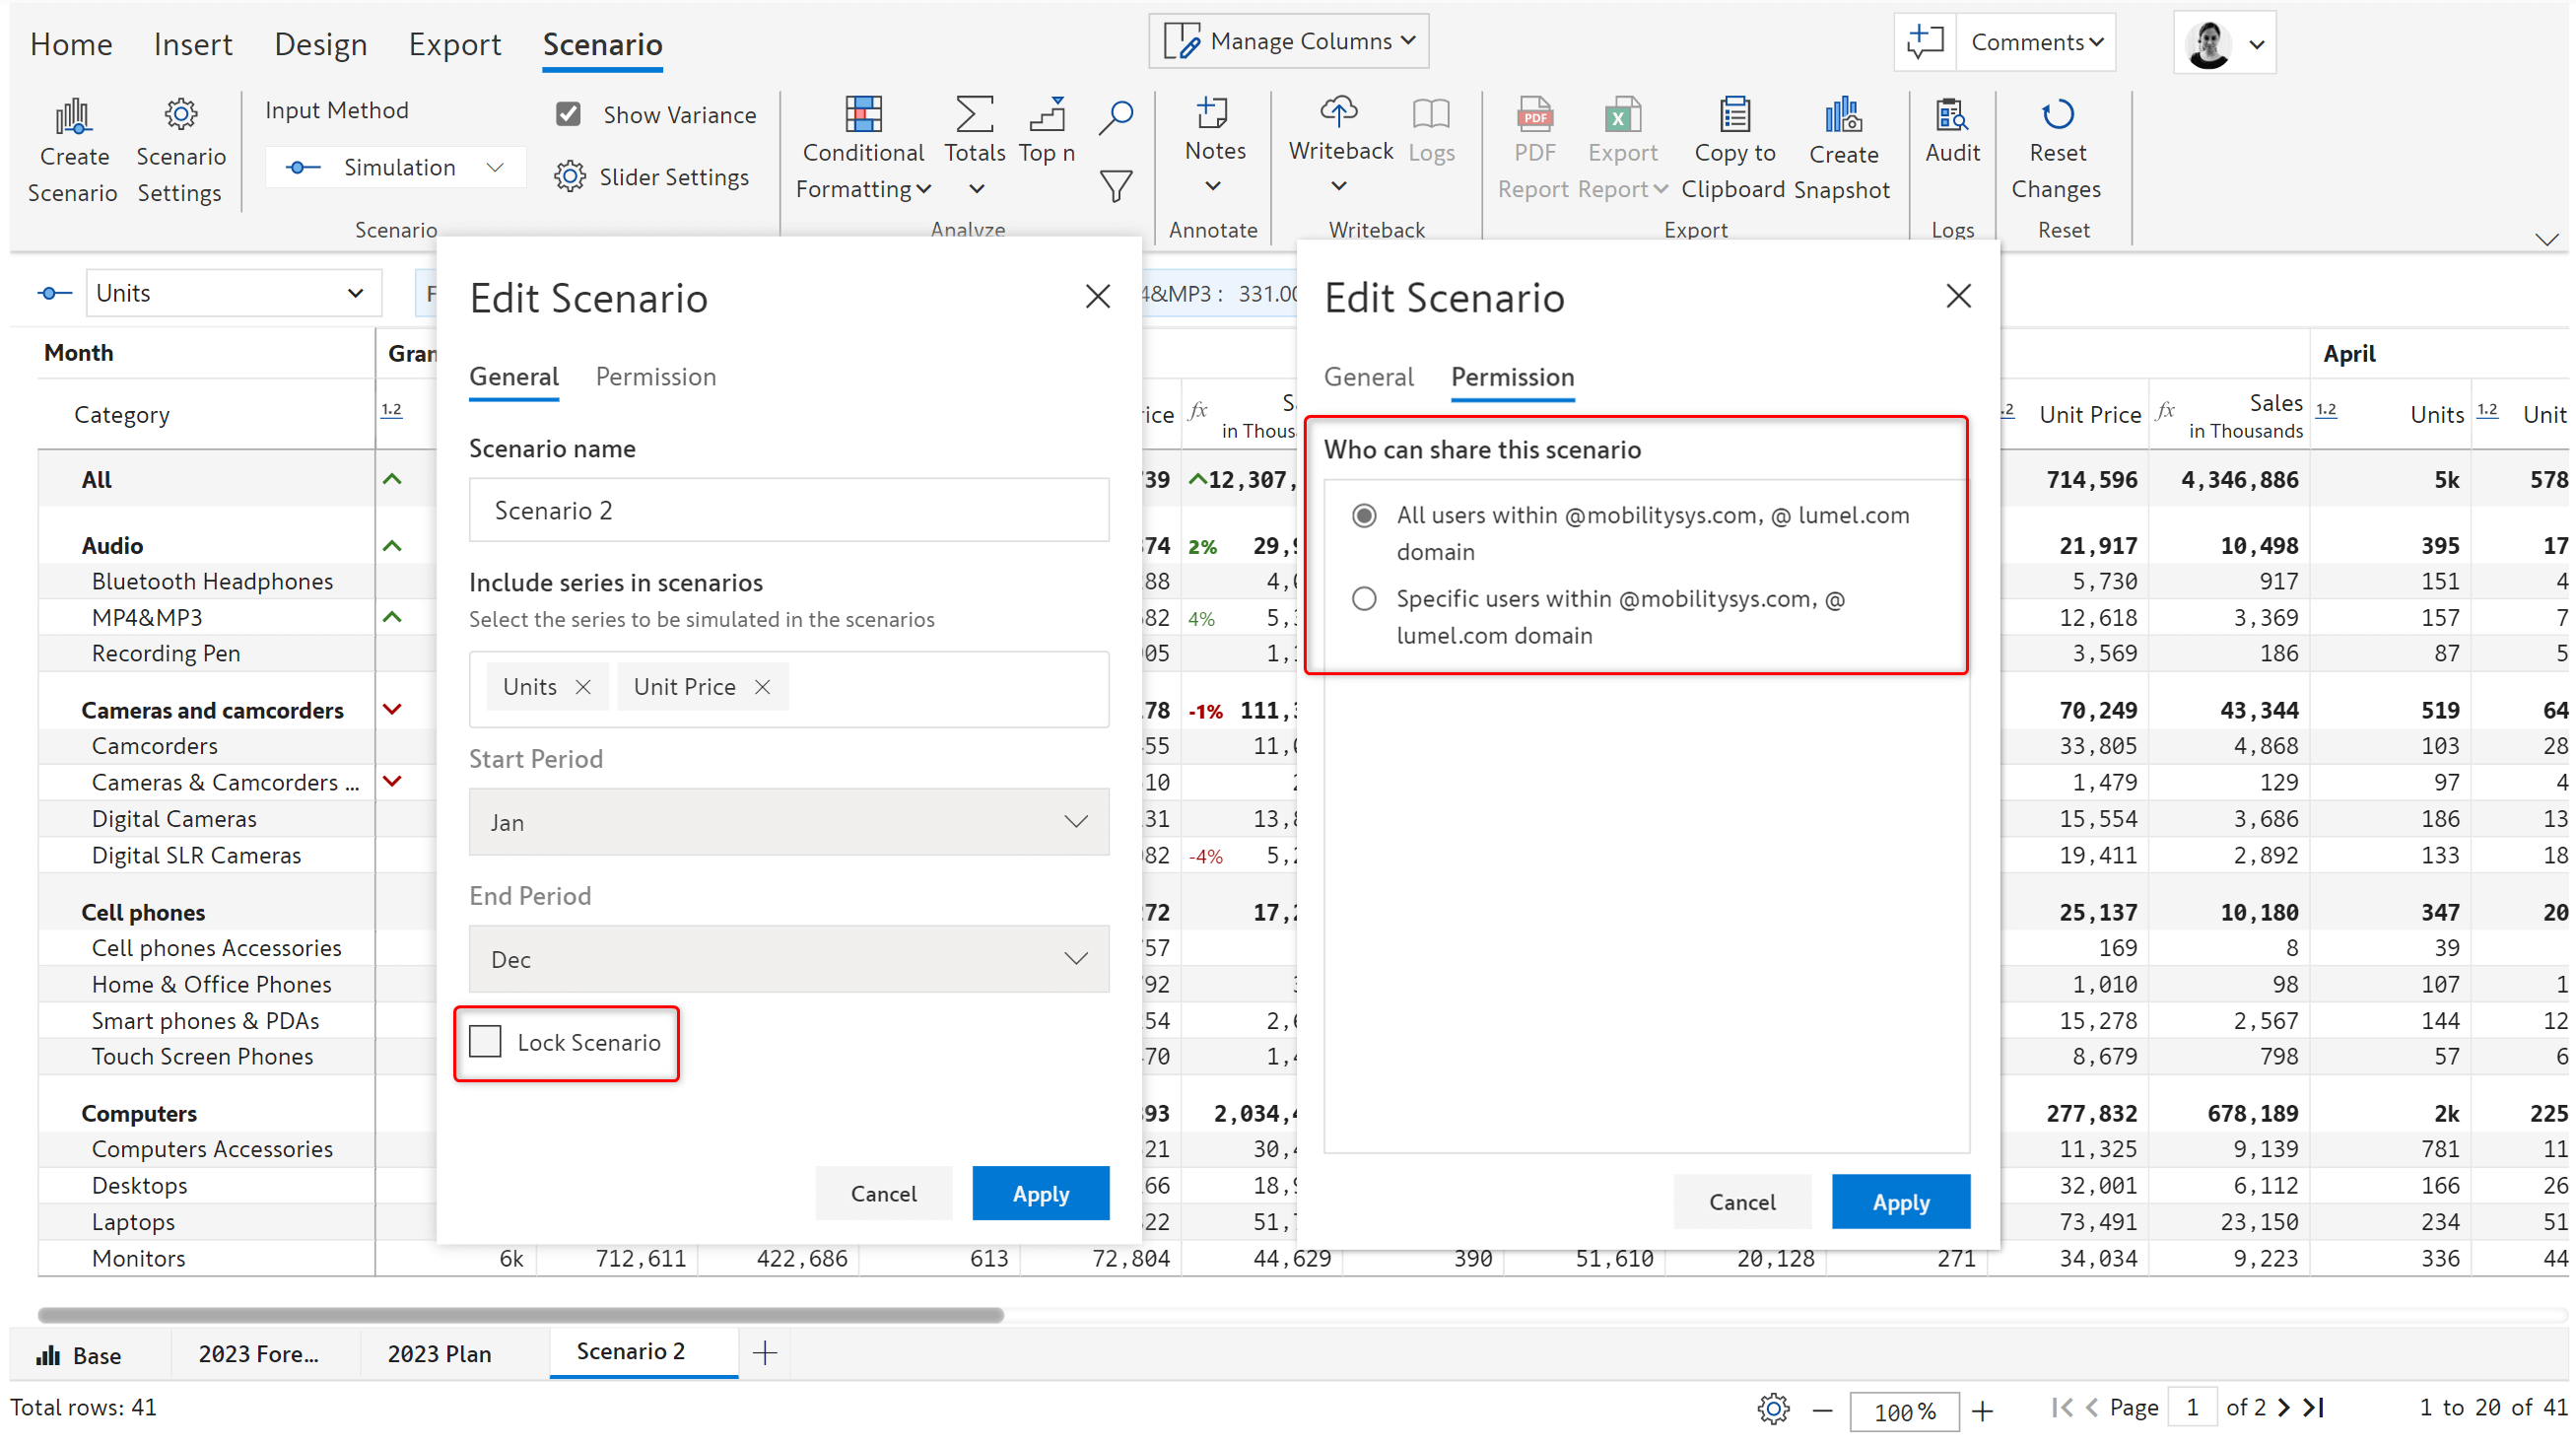
Scenarios are interactive and can be edited unless it’s explicitly locked. They can be created in both reading and edit mode and can be shared with other users.
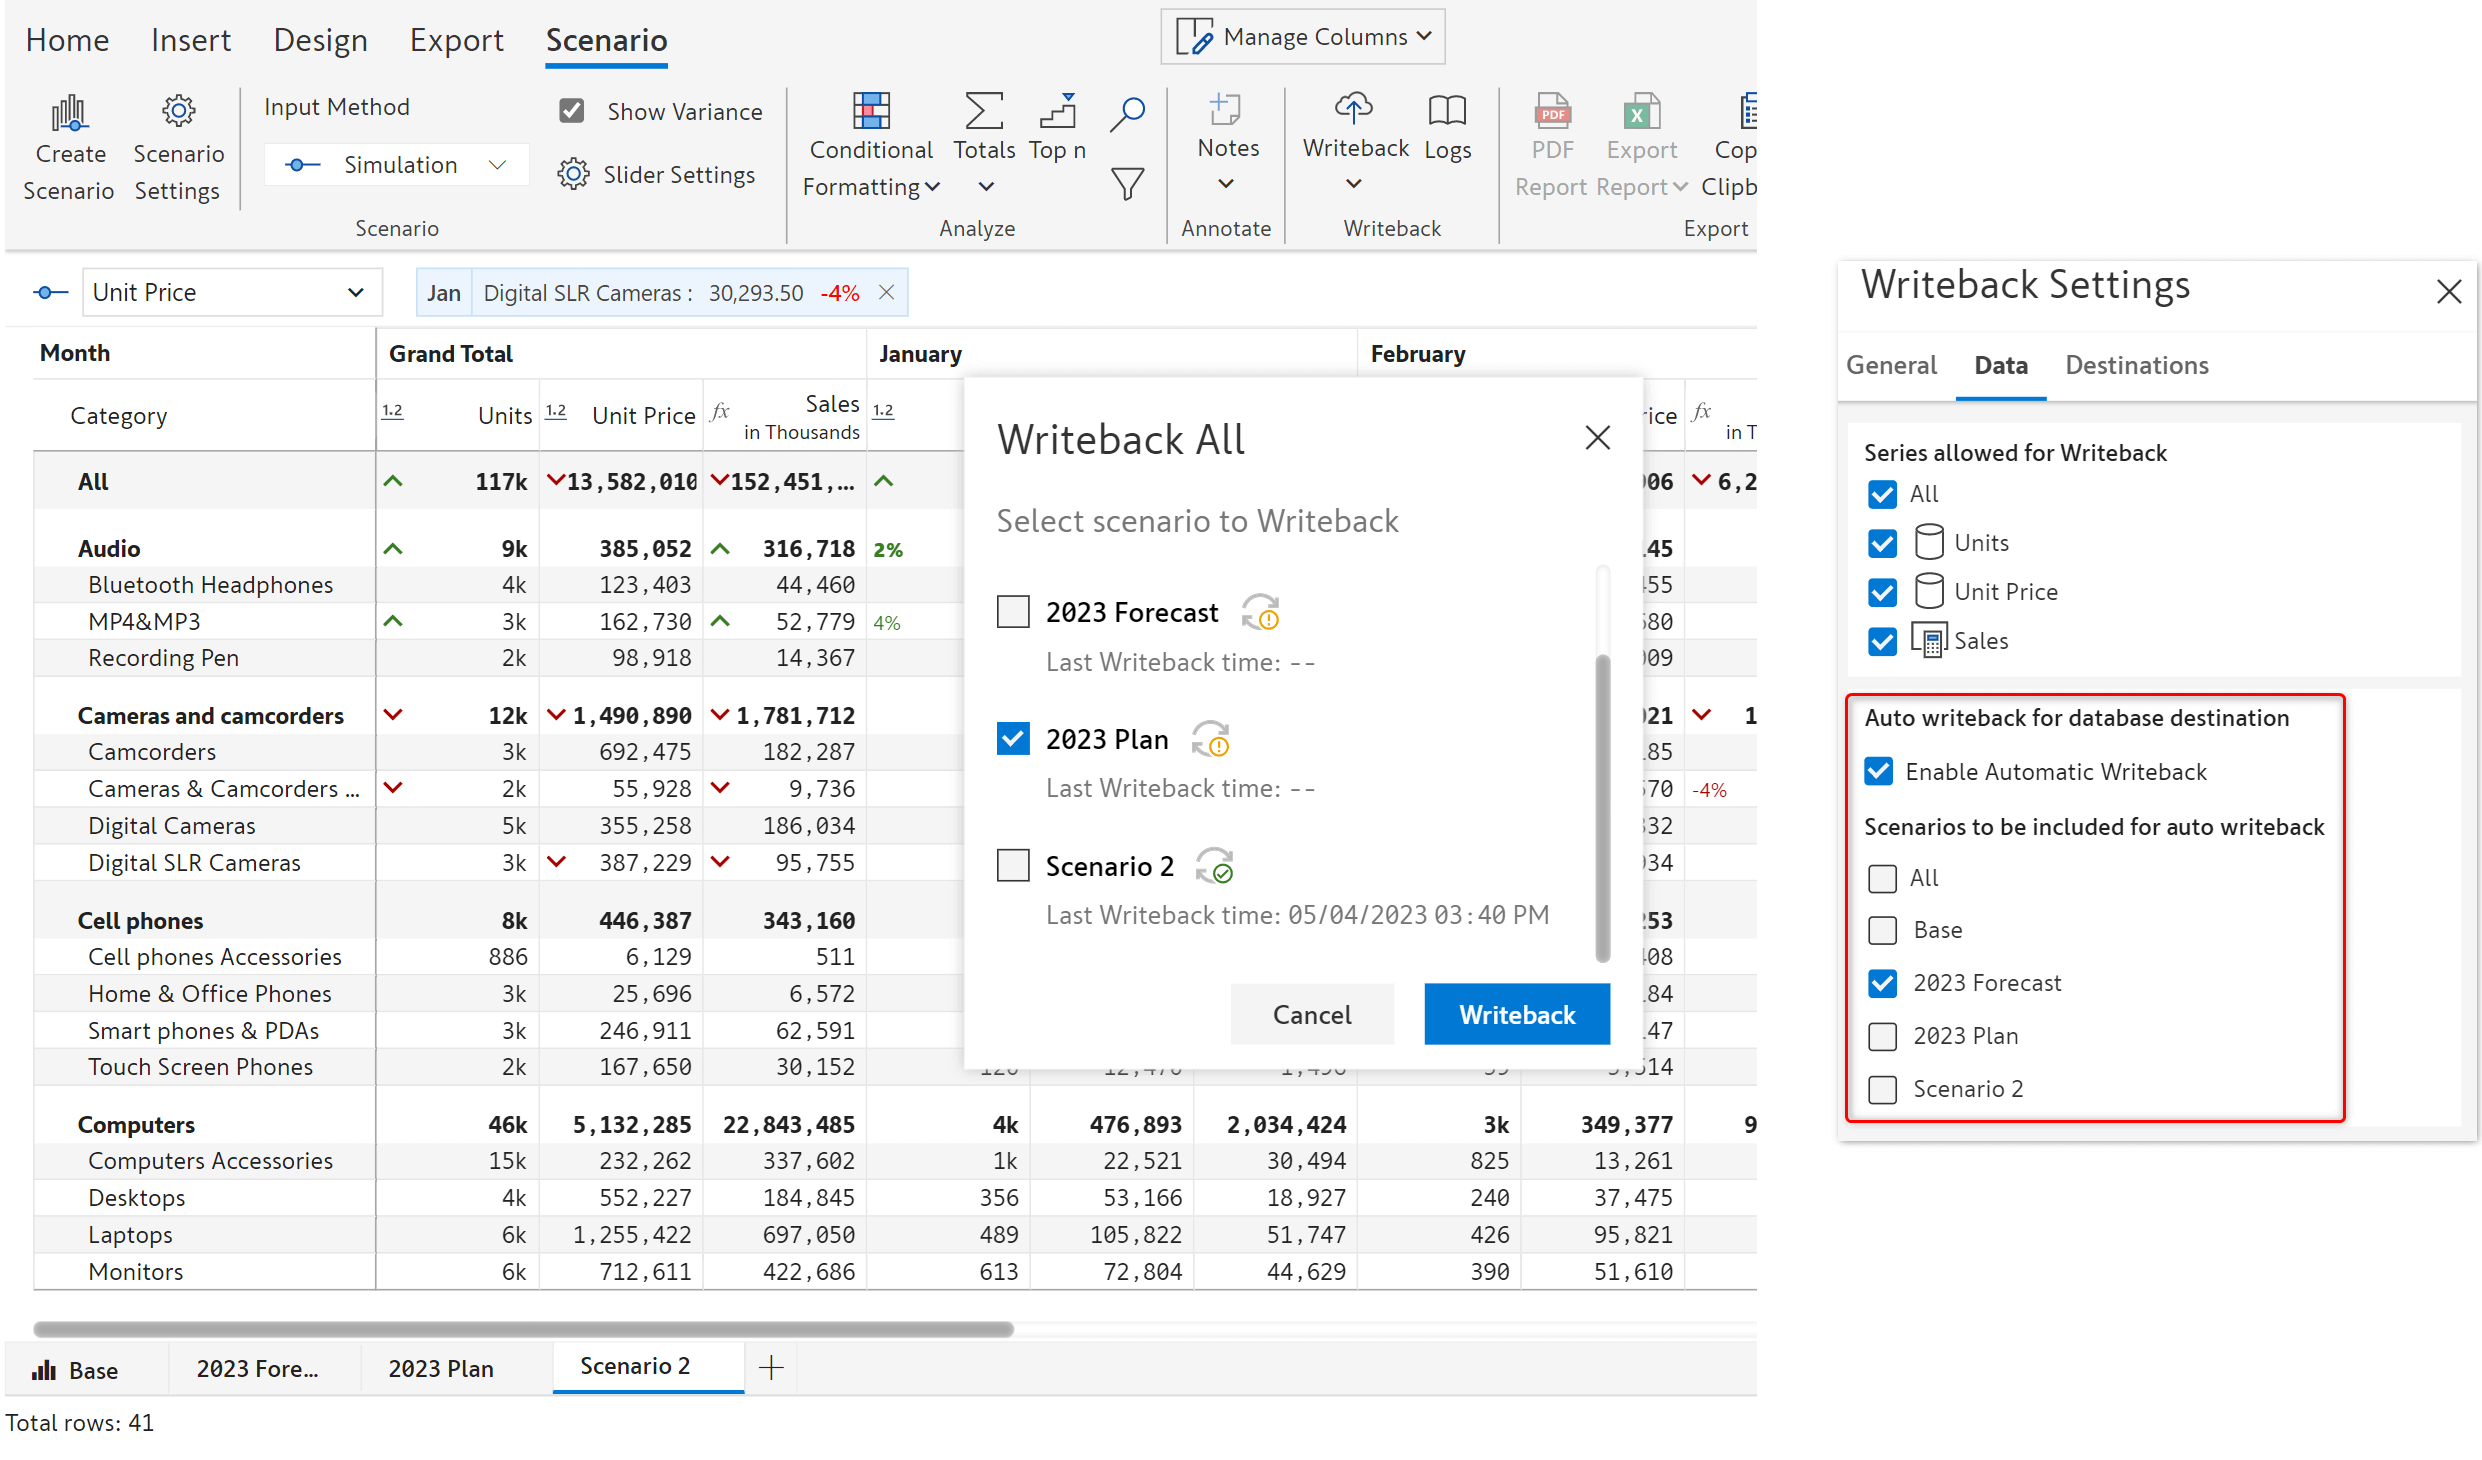
You can writeback all or specific scenarios and enable automatic writeback if required.
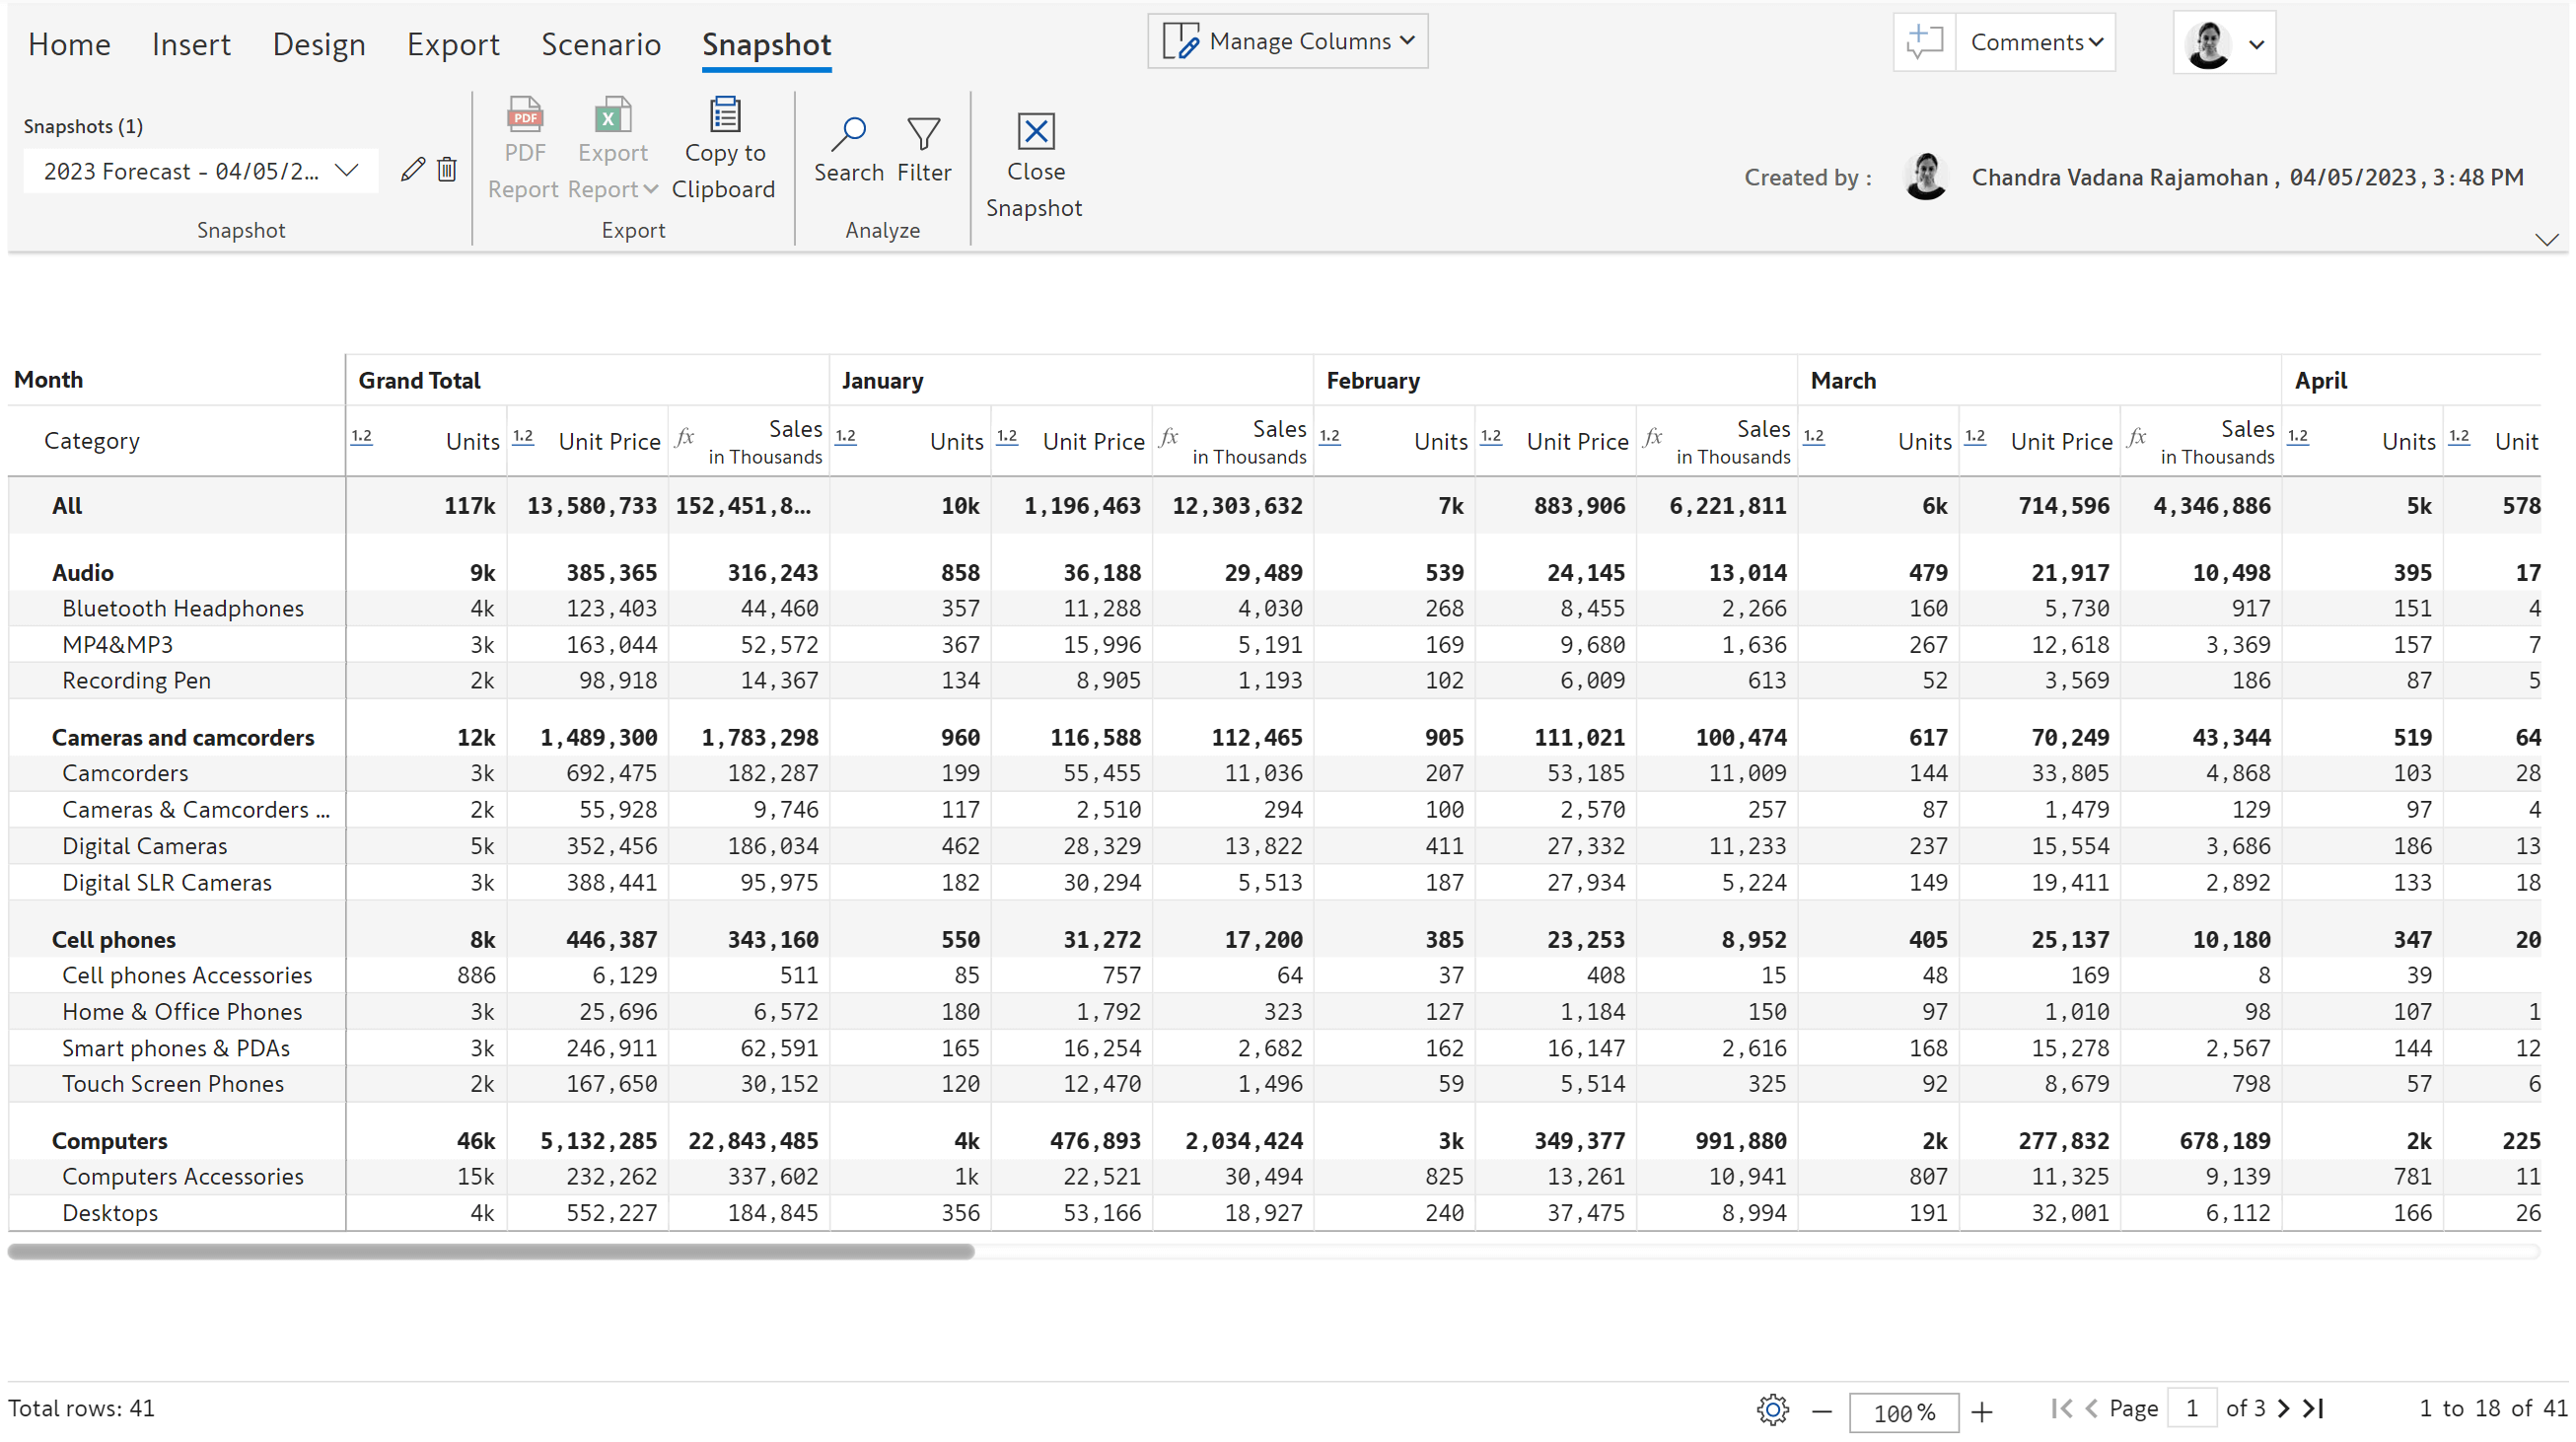
1. Snapshots (New use case)
In the edit mode, the current state of the report can be saved as a snapshot. Snapshots are read-only versions that can be used to freeze the data at month-end accounting/financial closes for future comparisons that are not impacted by source data changes and dataset refreshes. Data cannot be edited in a snapshot view. Write-back of snapshots will be supported with our next release (2.1).
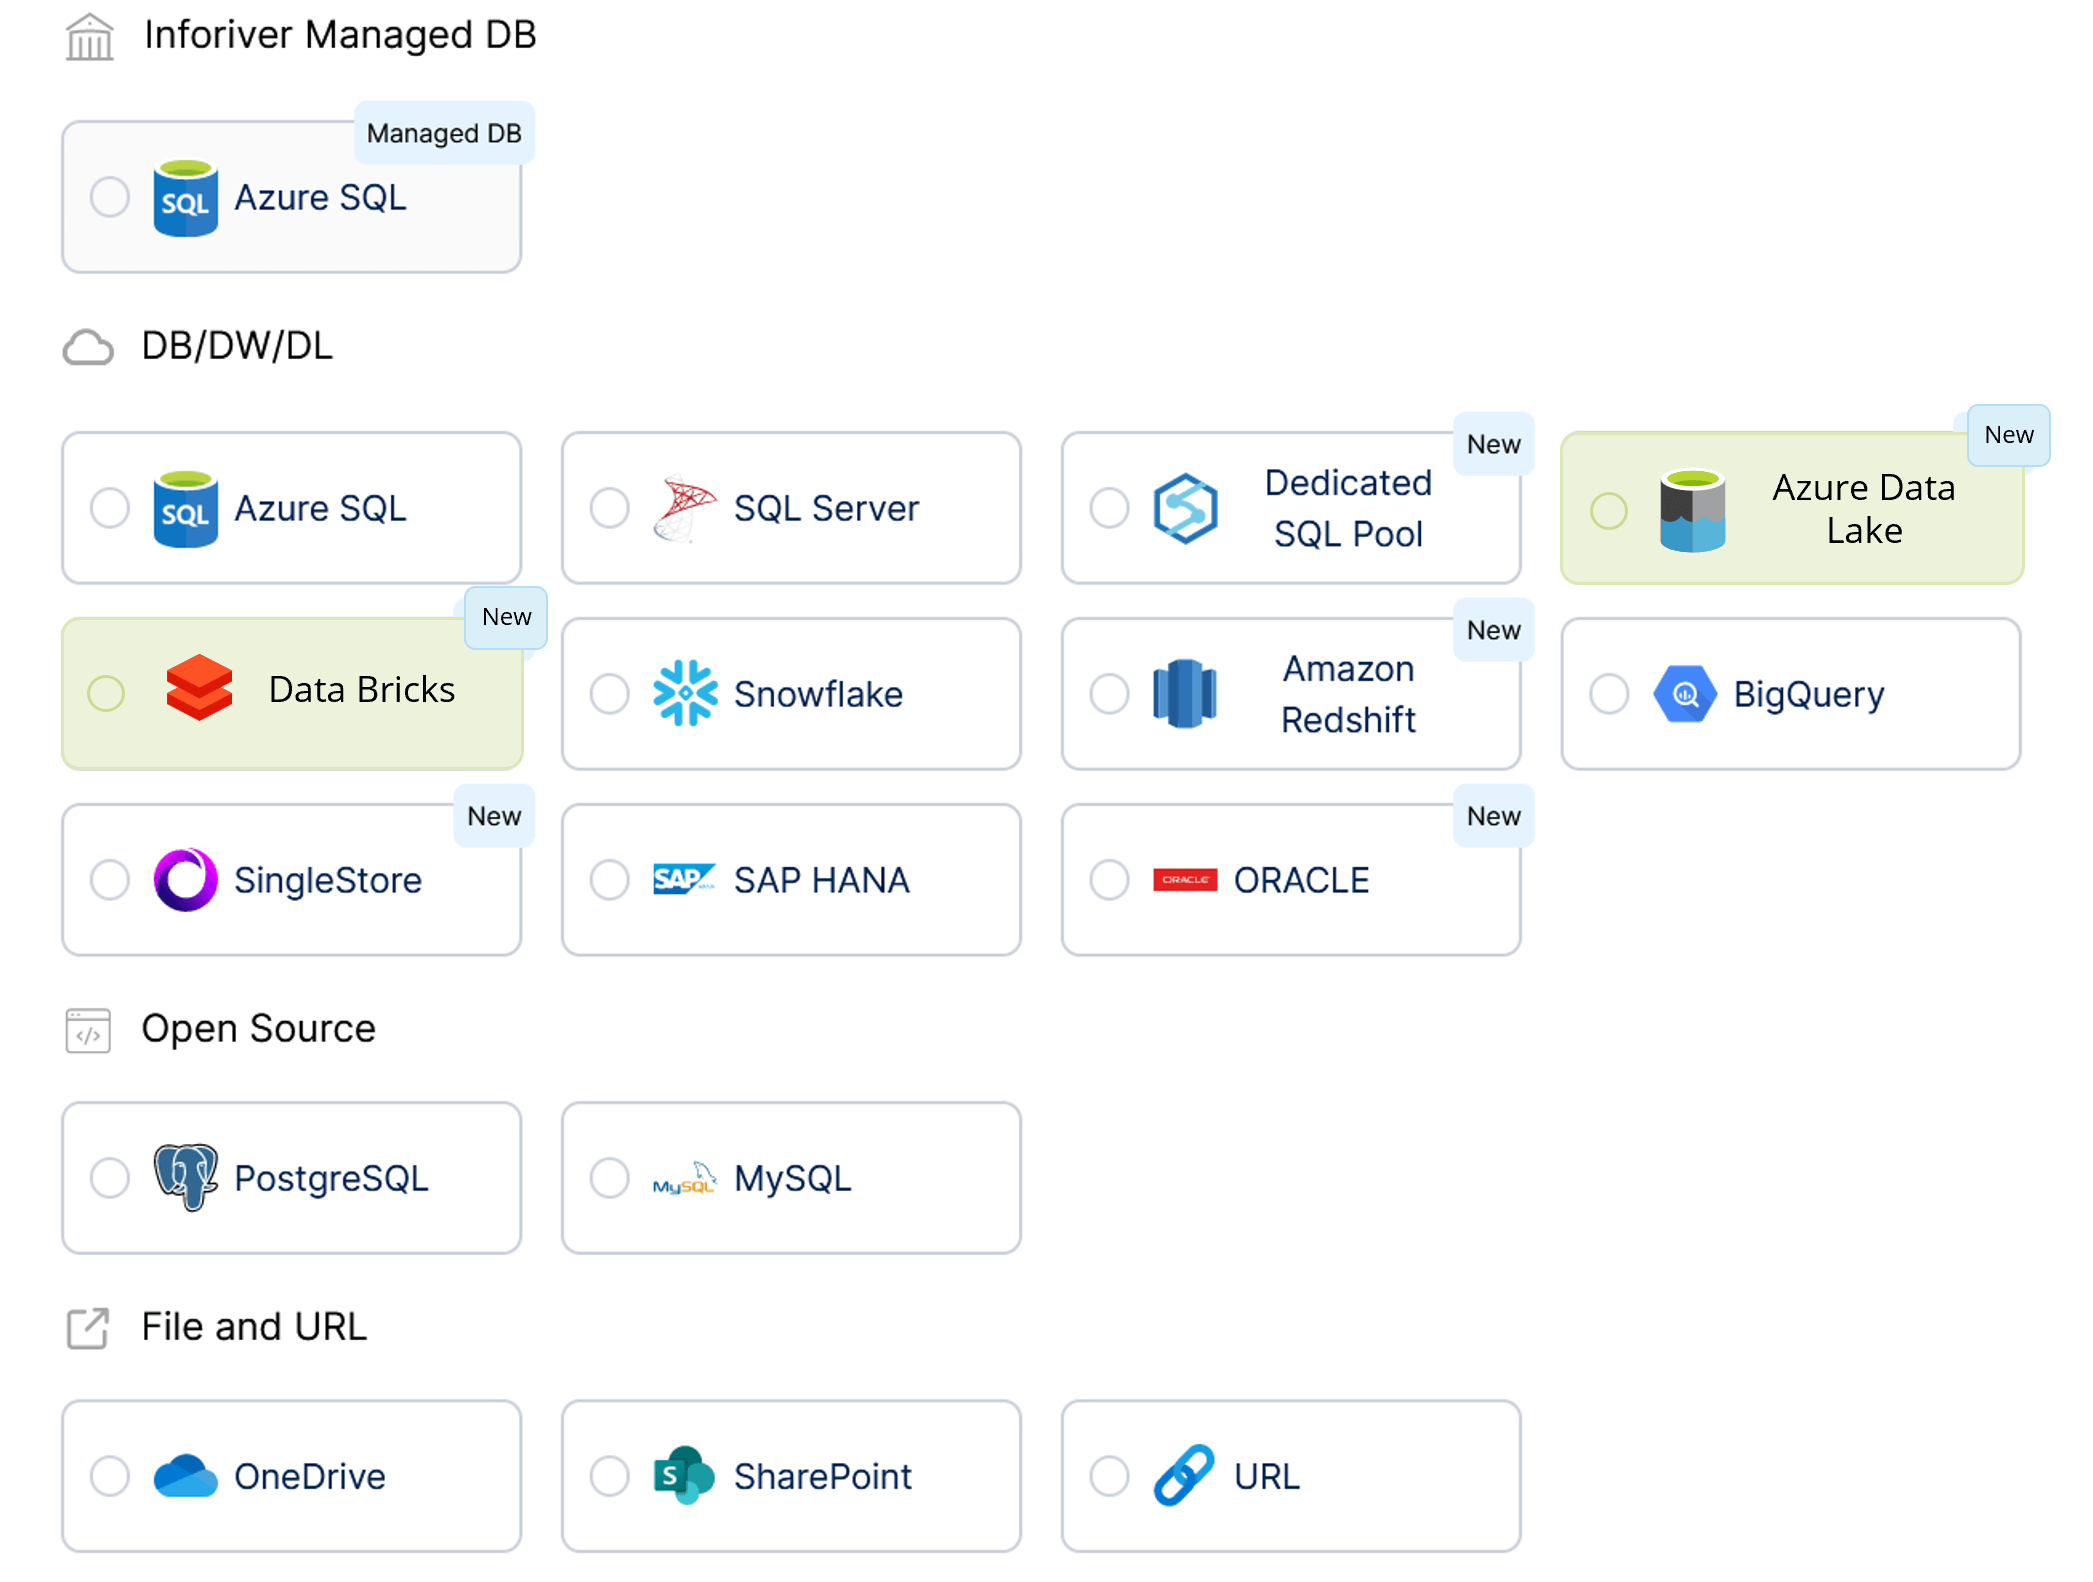
1. New writeback destinations
Support for Data Lake Storage Gen2 and Databricks has been introduced. Support for Dataverse as a destination will be available with our next release (2.1).
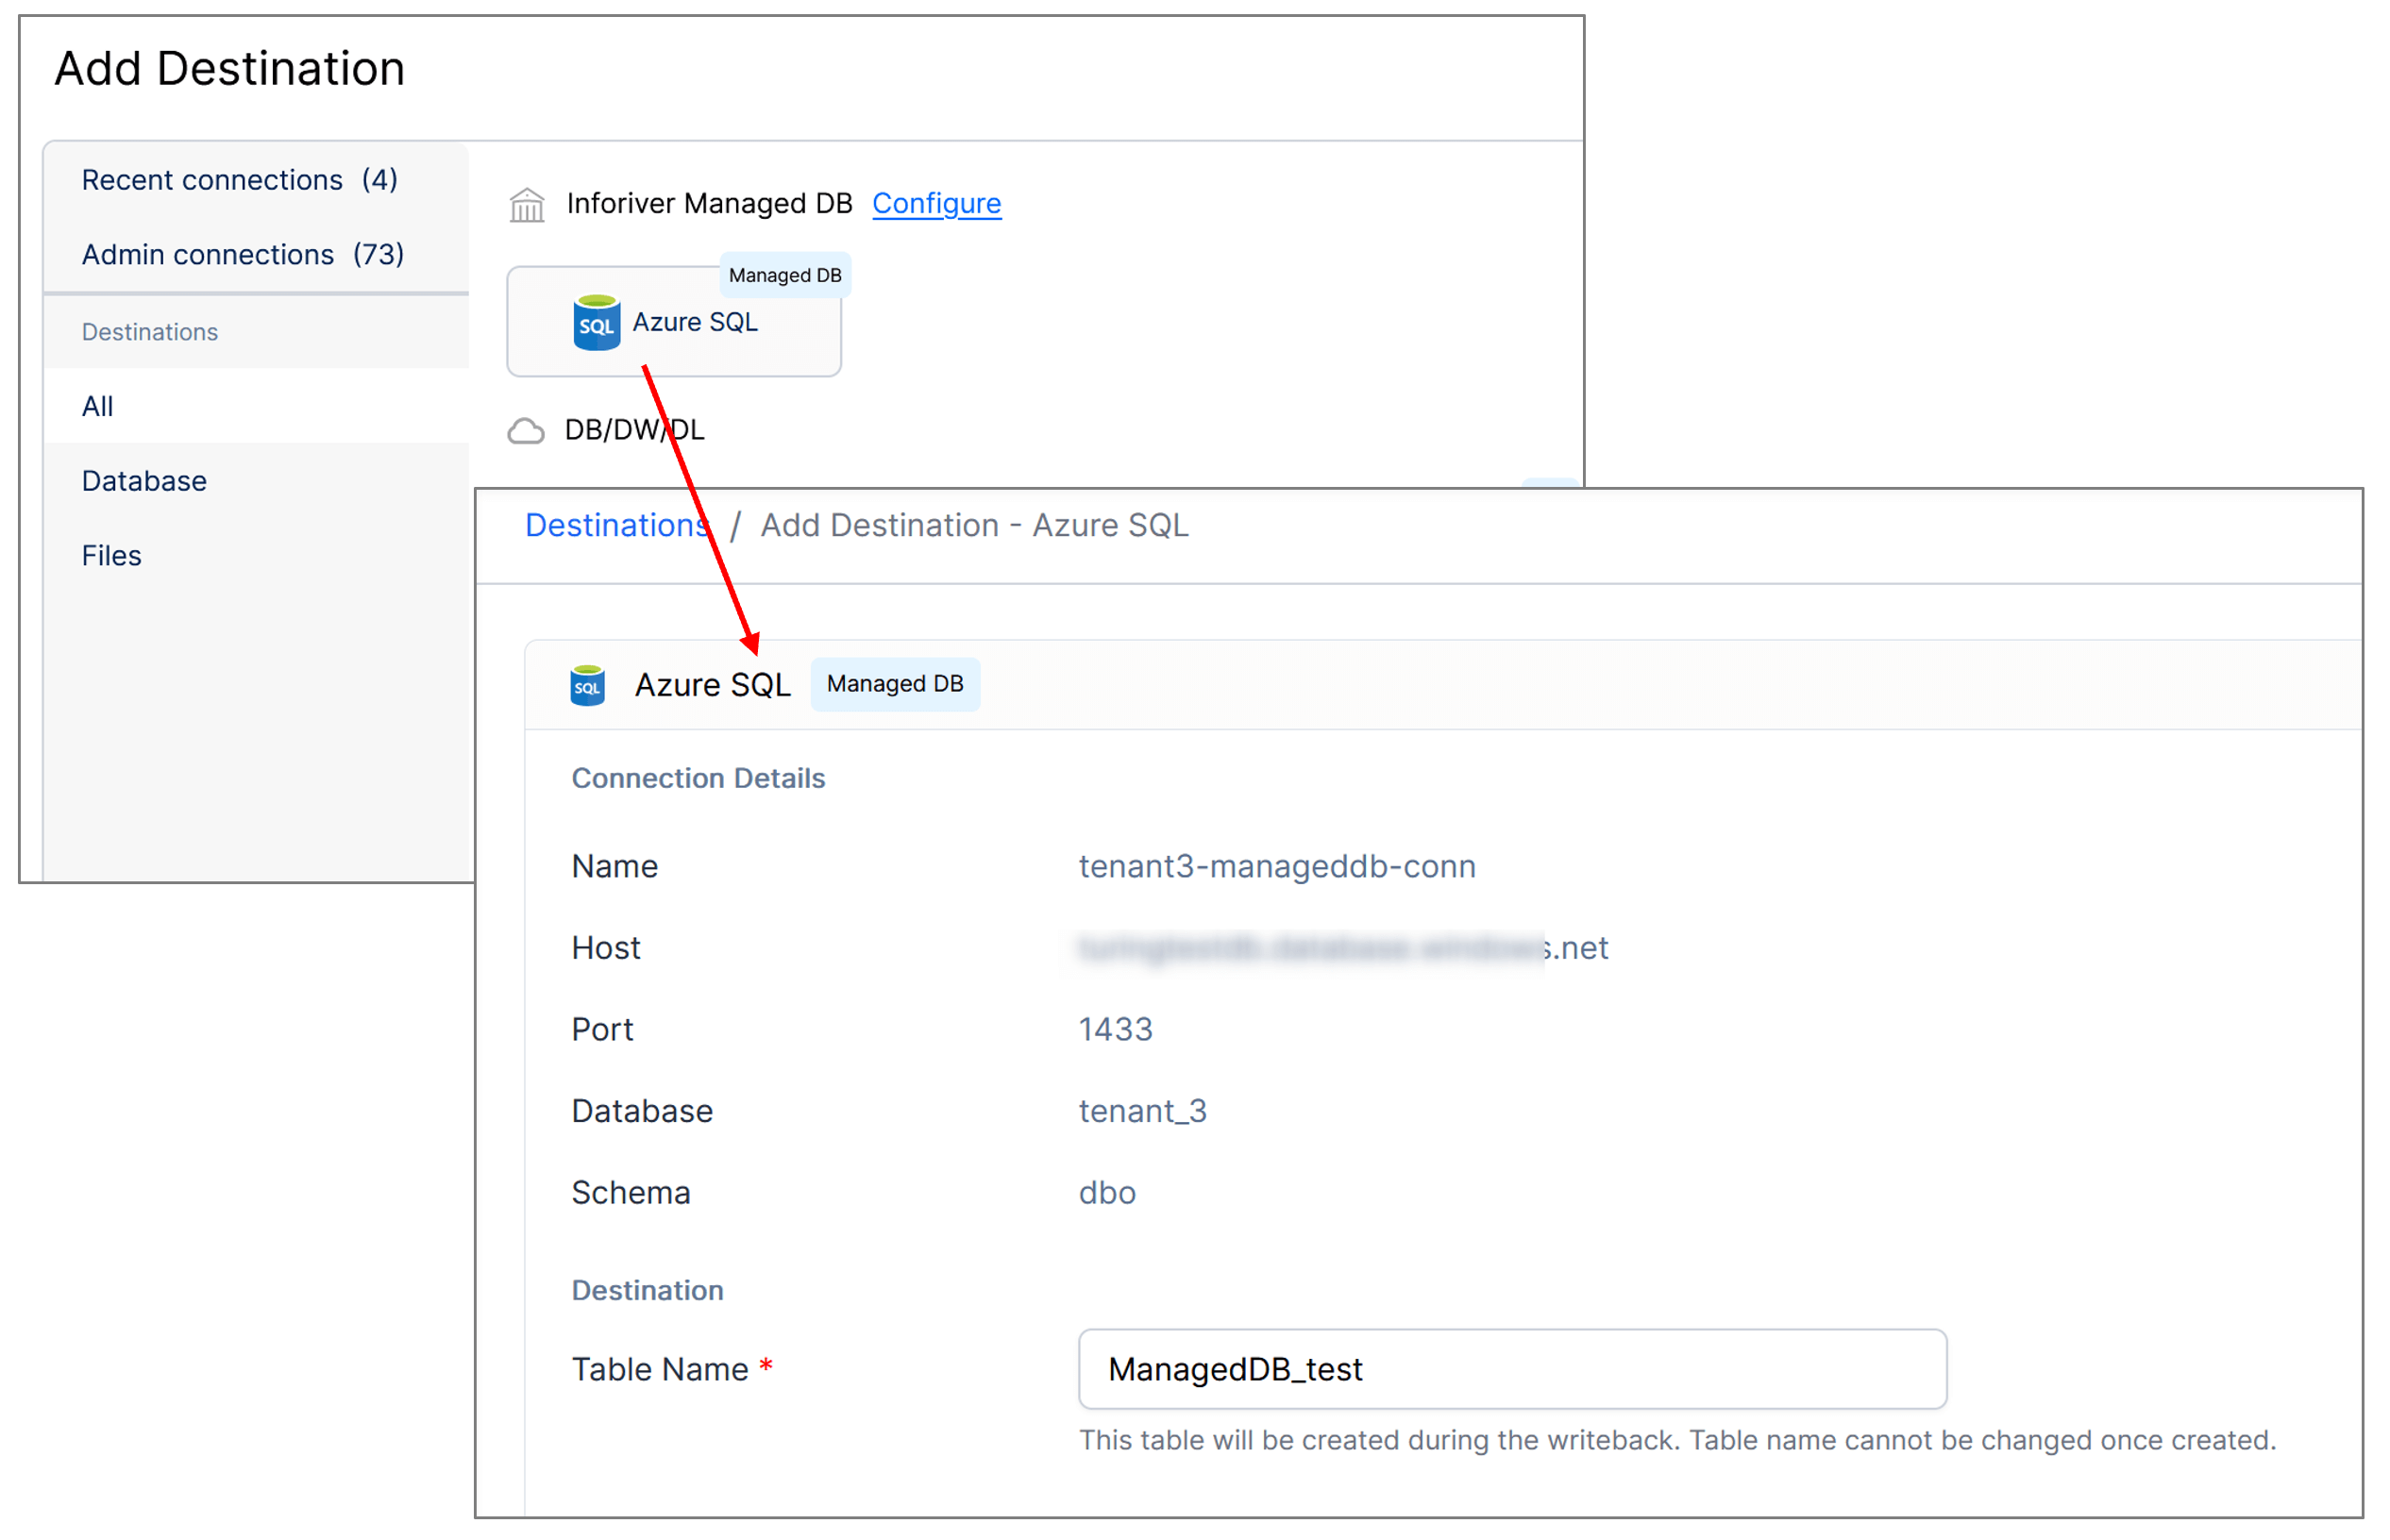
2. Inforiver managed Azure SQL database
With Inforiver Enterprise 2.0, we provide our Managed Azure SQL Writeback Database to simplify your testing and development process. You can now focus on building your proof of concepts without worrying about access or provisioning.
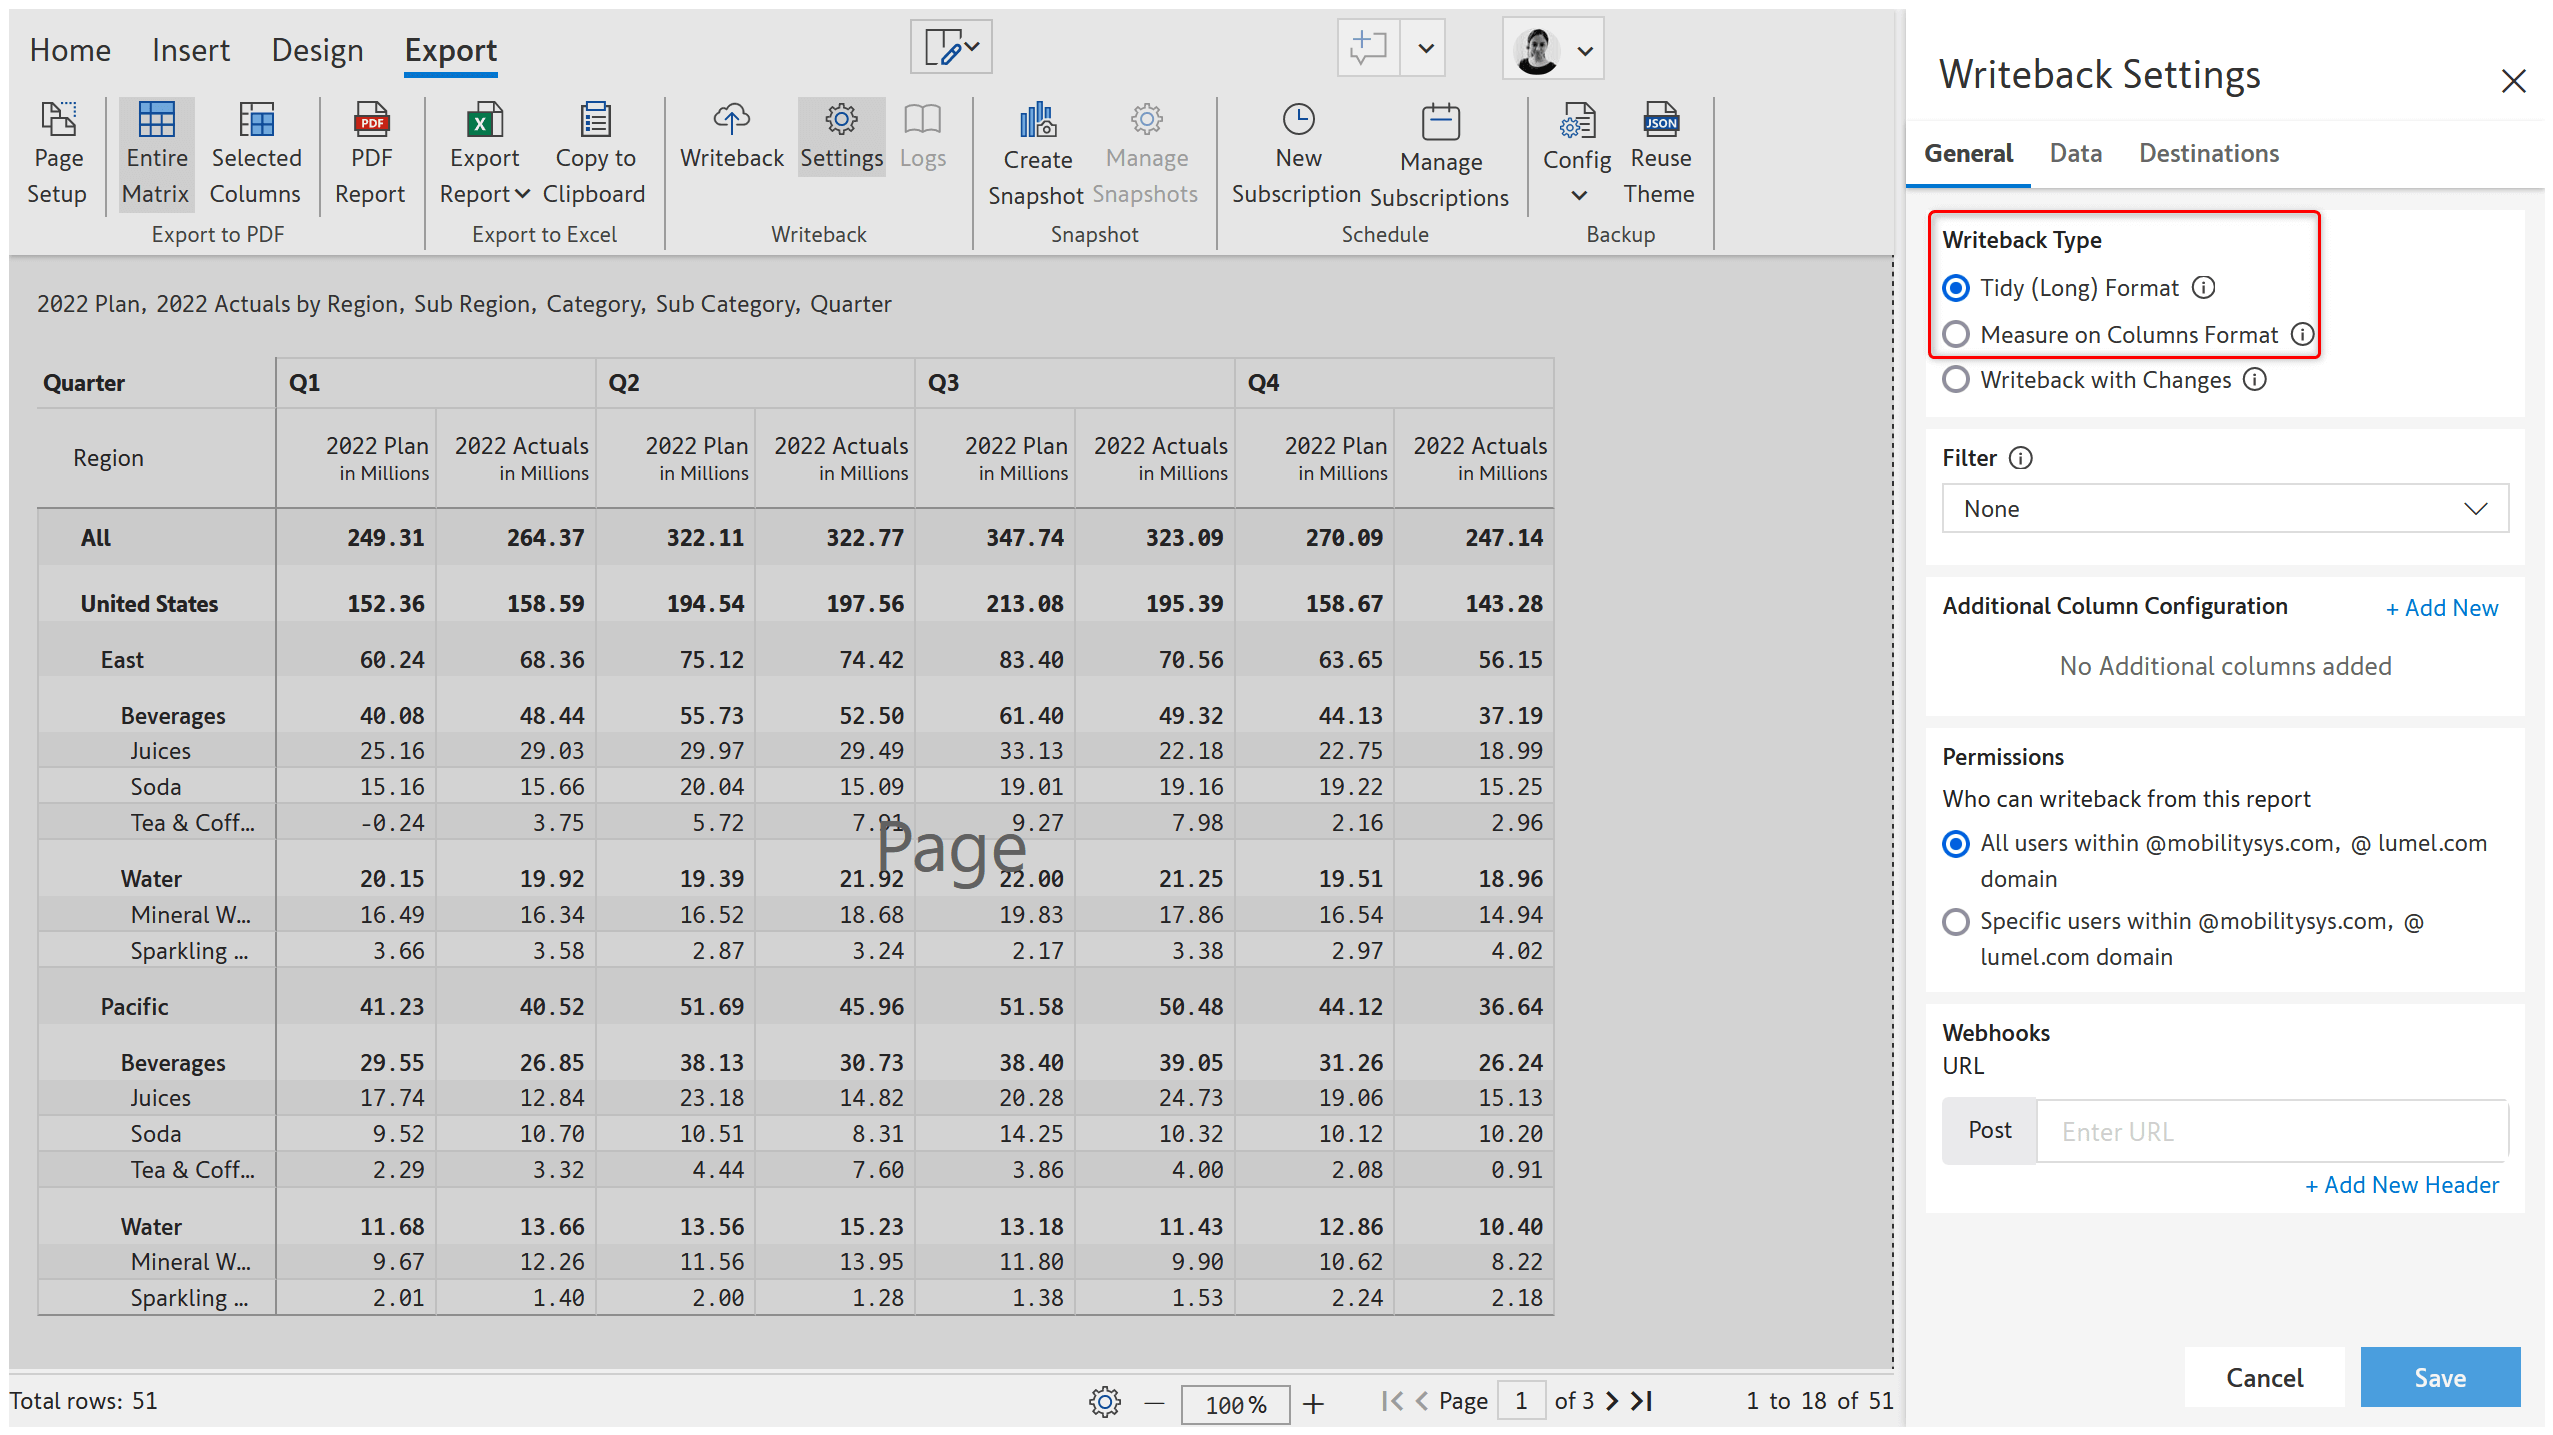
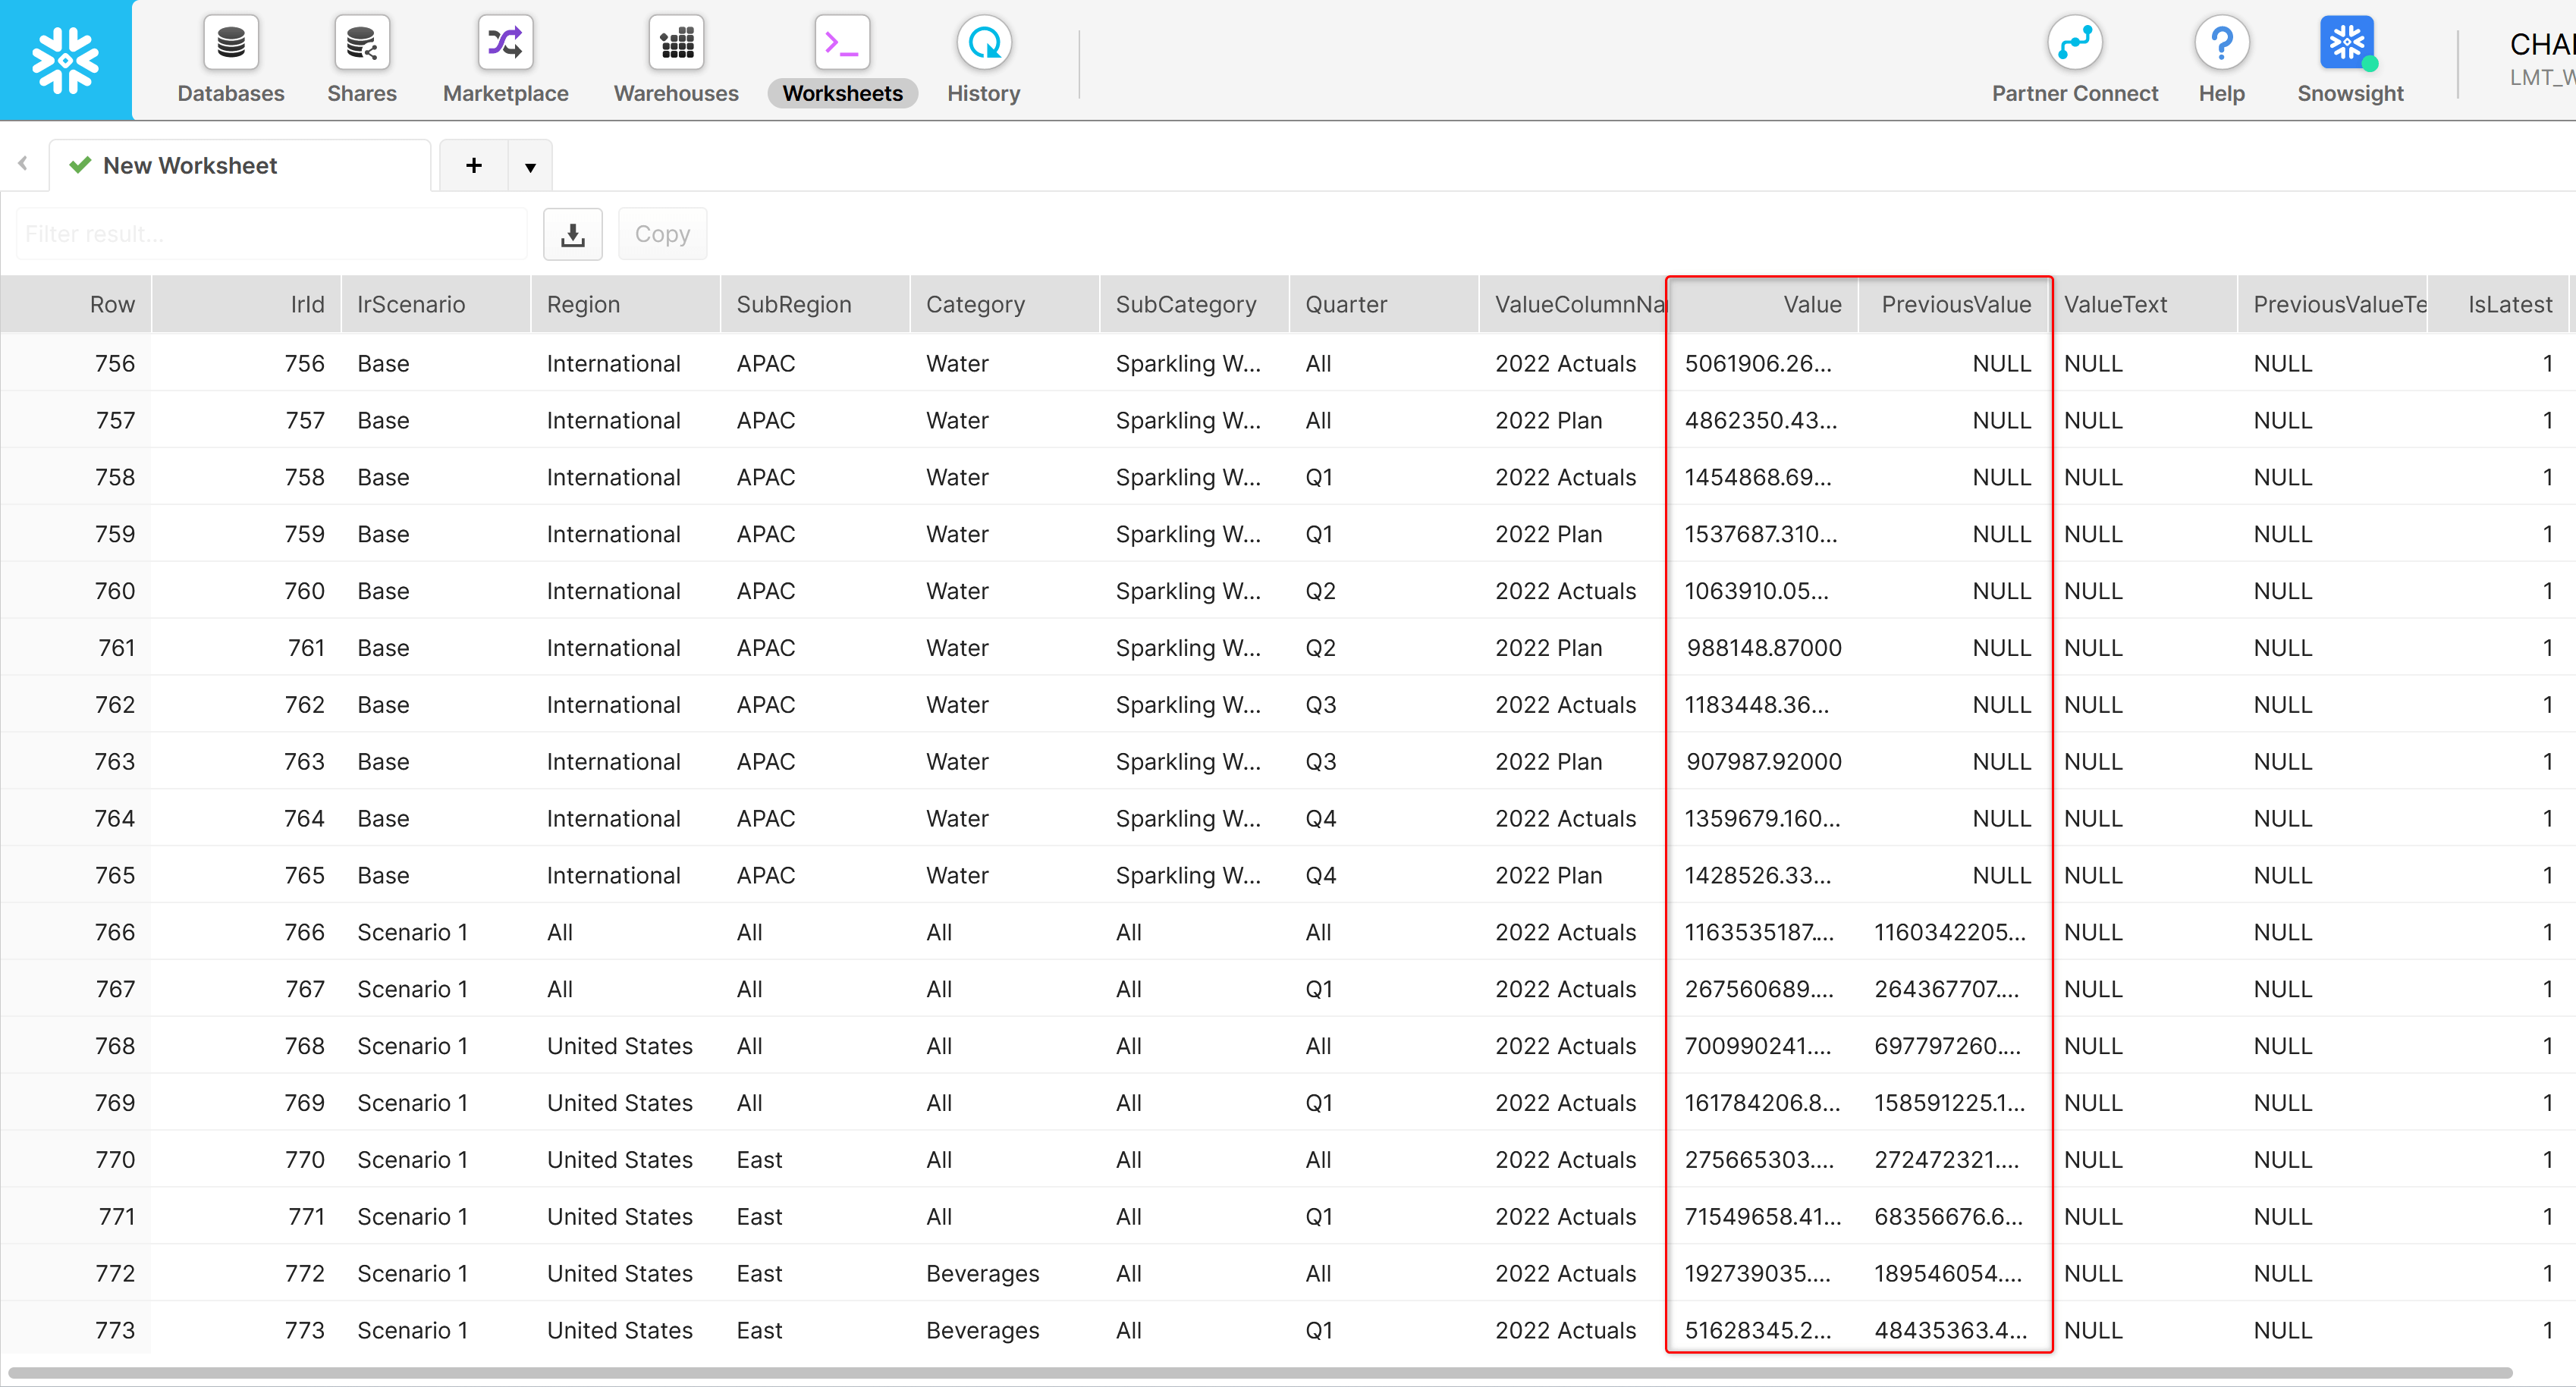
1. New writeback table formats
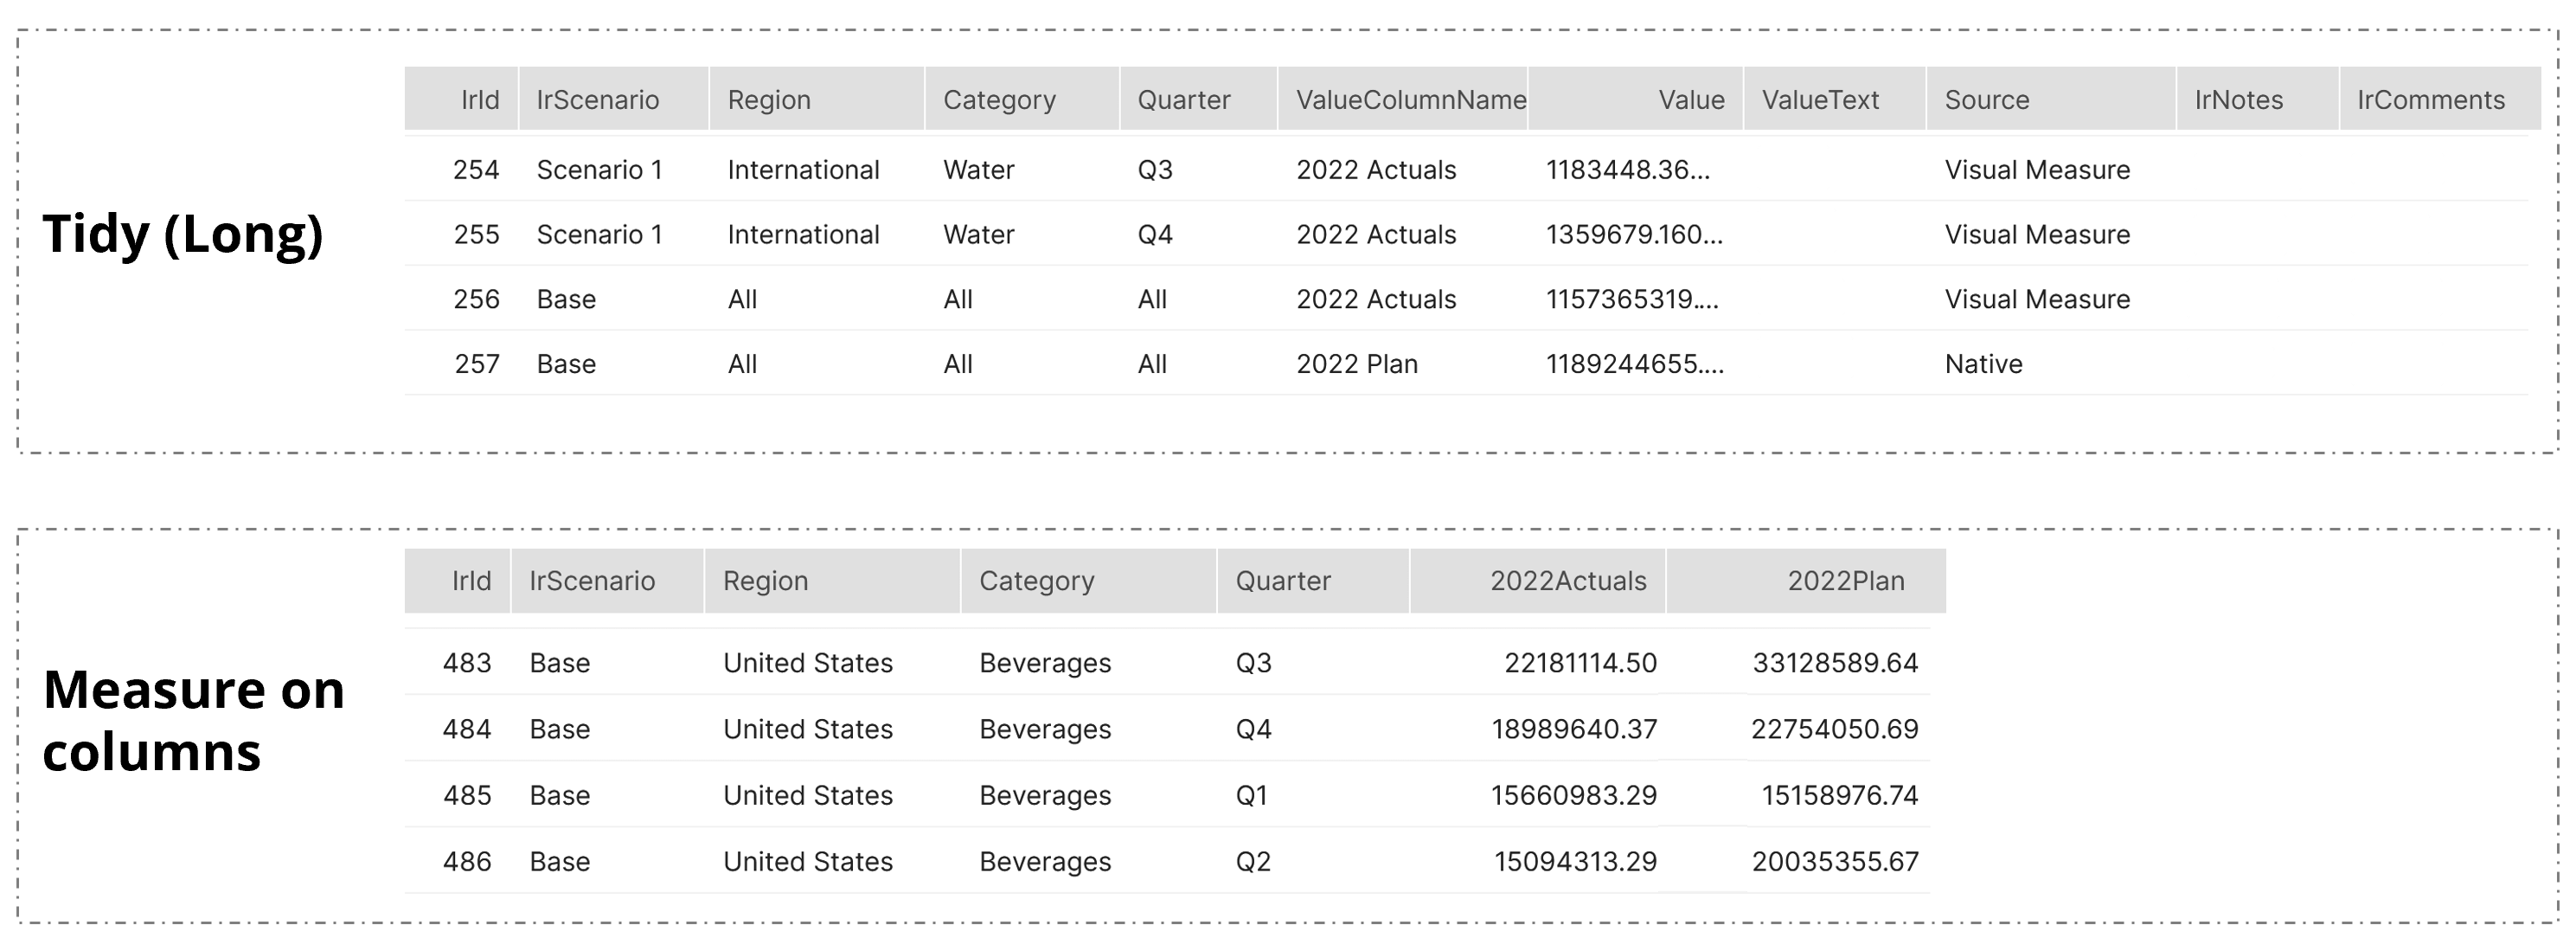
Three table formats have been introduced to provide flexibility to tailor writeback to your specific needs and preferences. The tidy (long) format includes cell metadata whereas the Measure on columns is a wide table format.
Sample tables are shown in the below image.
2. Delta writeback
Using the ‘Writeback only changes’ option, you can now perform delta writeback.
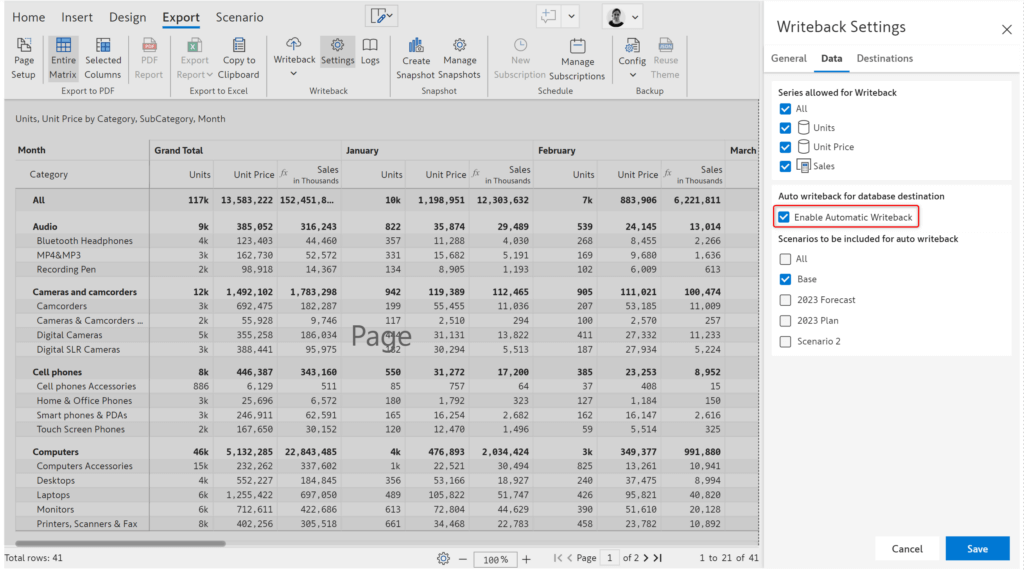
3. Automatic writeback
Any changes made to the report are automatically synced to the writeback destination by enabling the ‘Automatic writeback’ feature. This also ensures that other visuals that are configured using the writeback table are updated without the need for a report refresh.
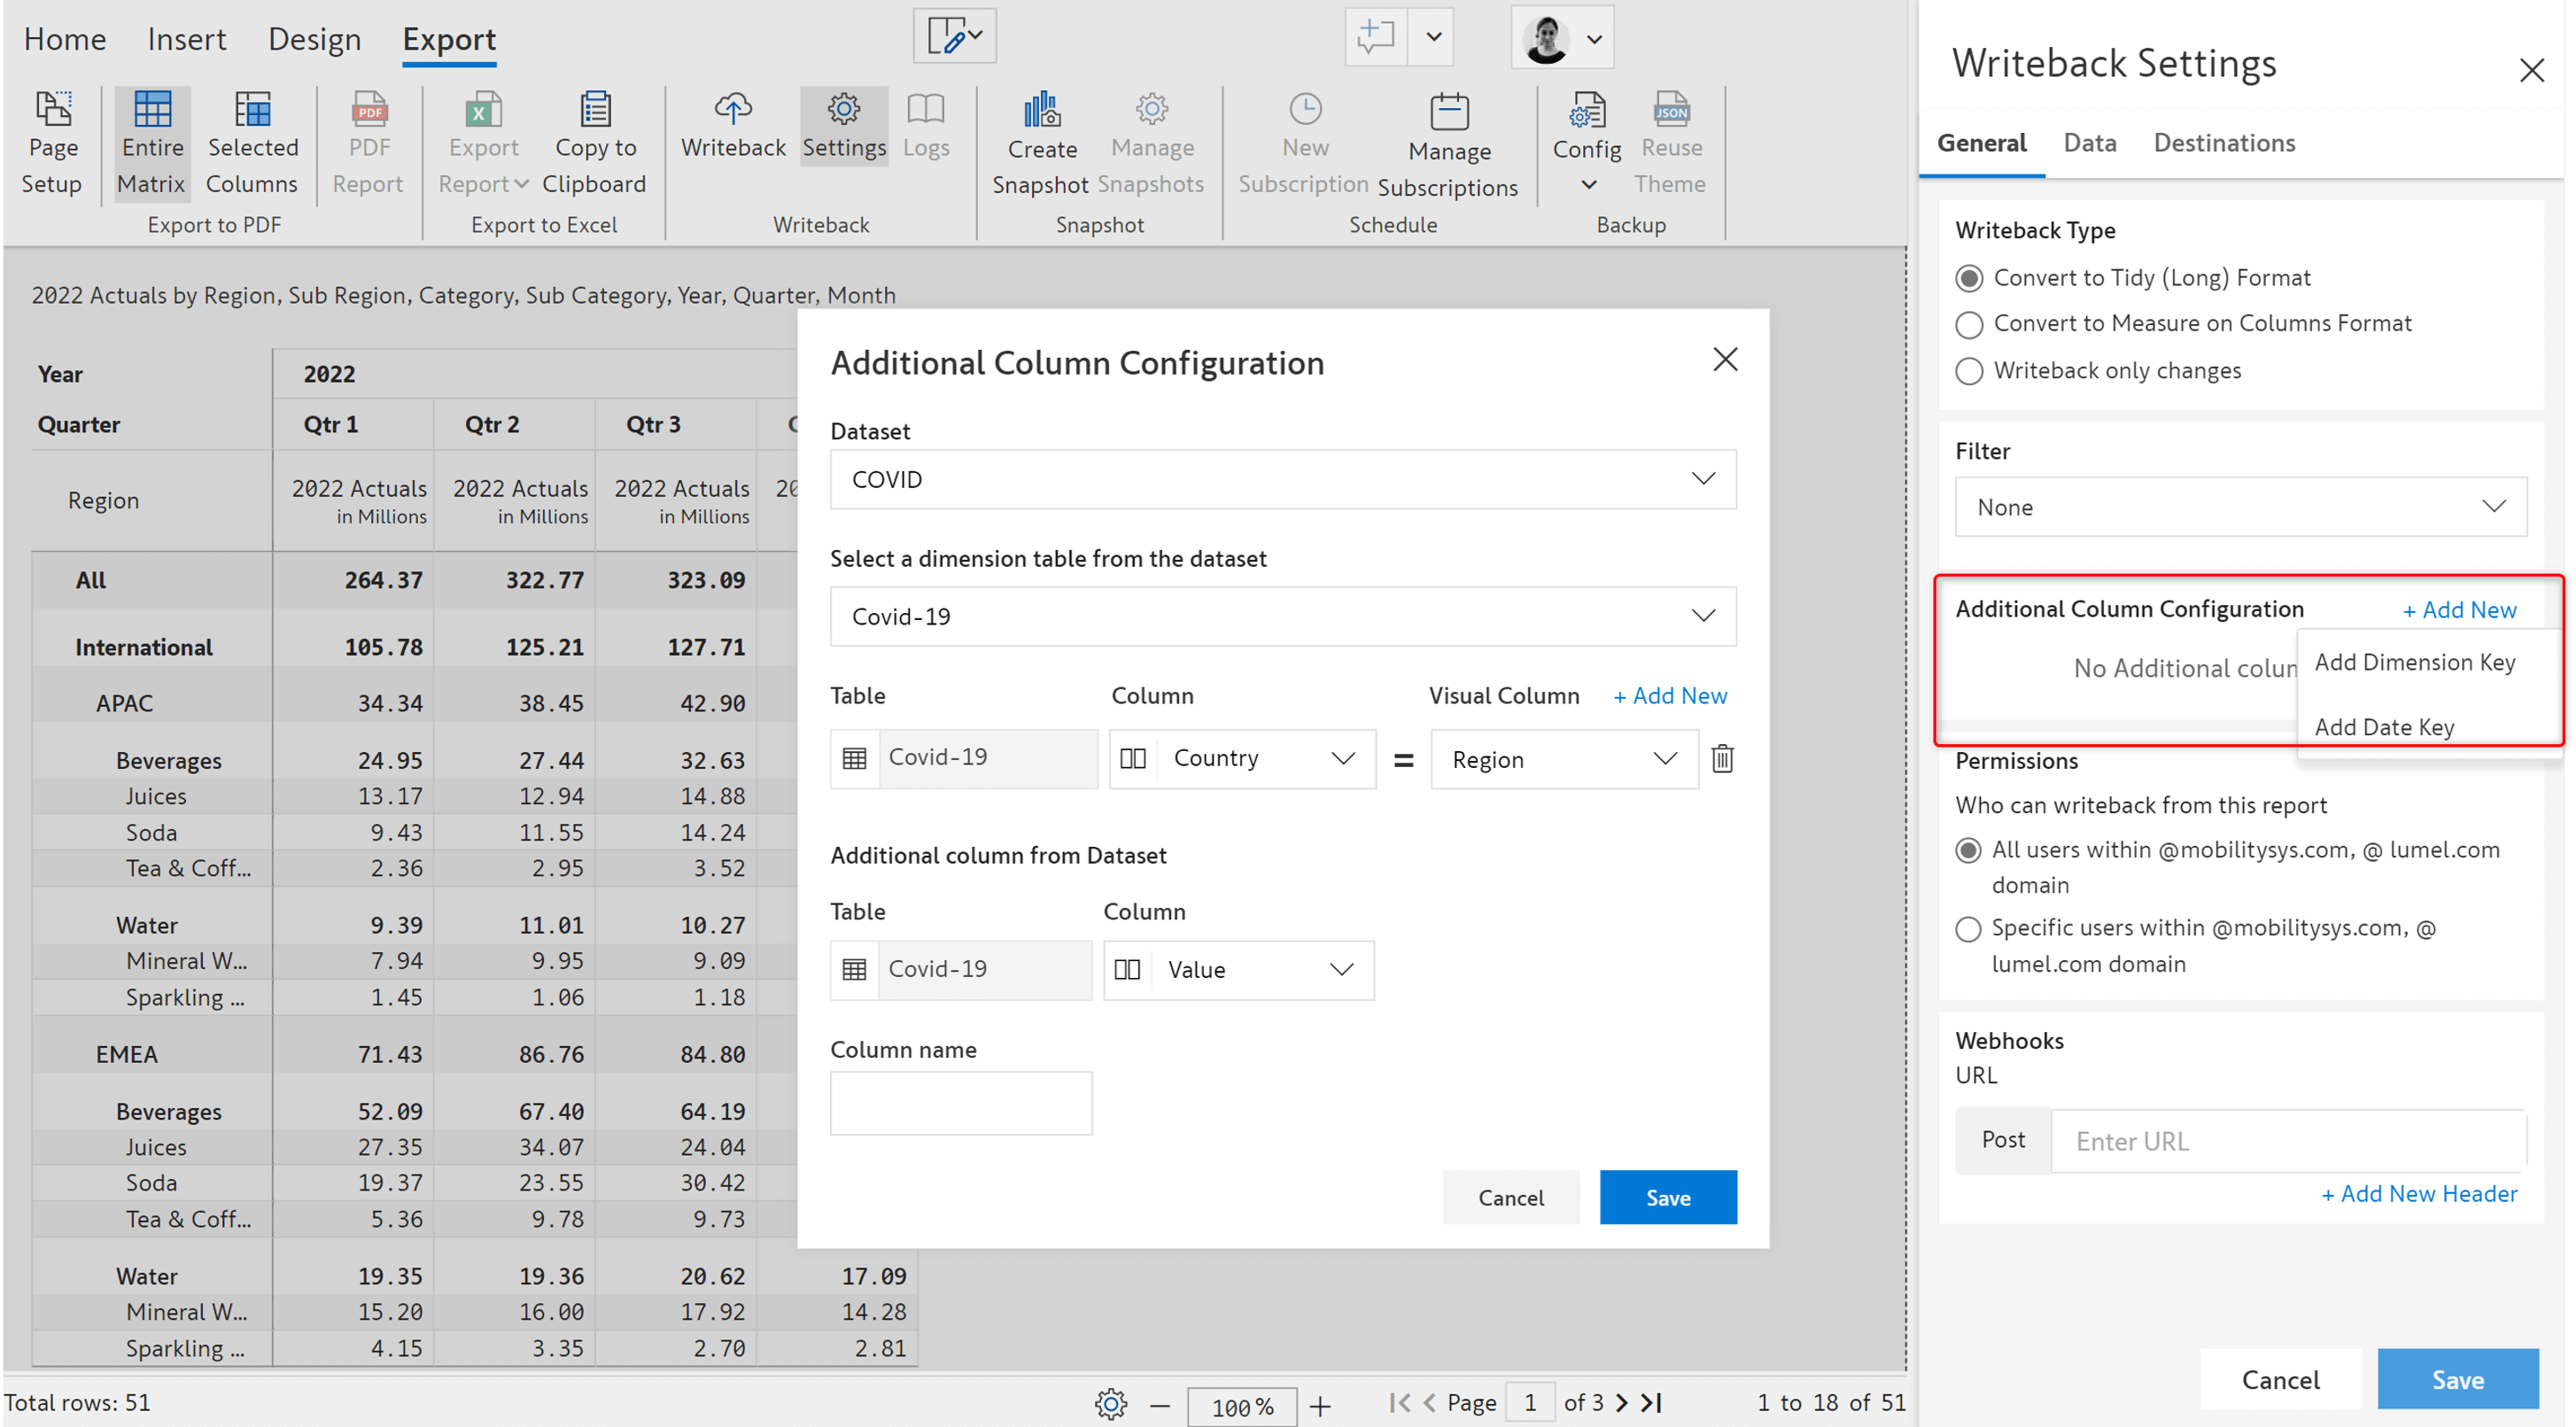
4. Writeback additional mapping columns
Once the data is written back to the writeback table, to use the writeback table in your star schema model, you can map the dimension key and date key using this option.
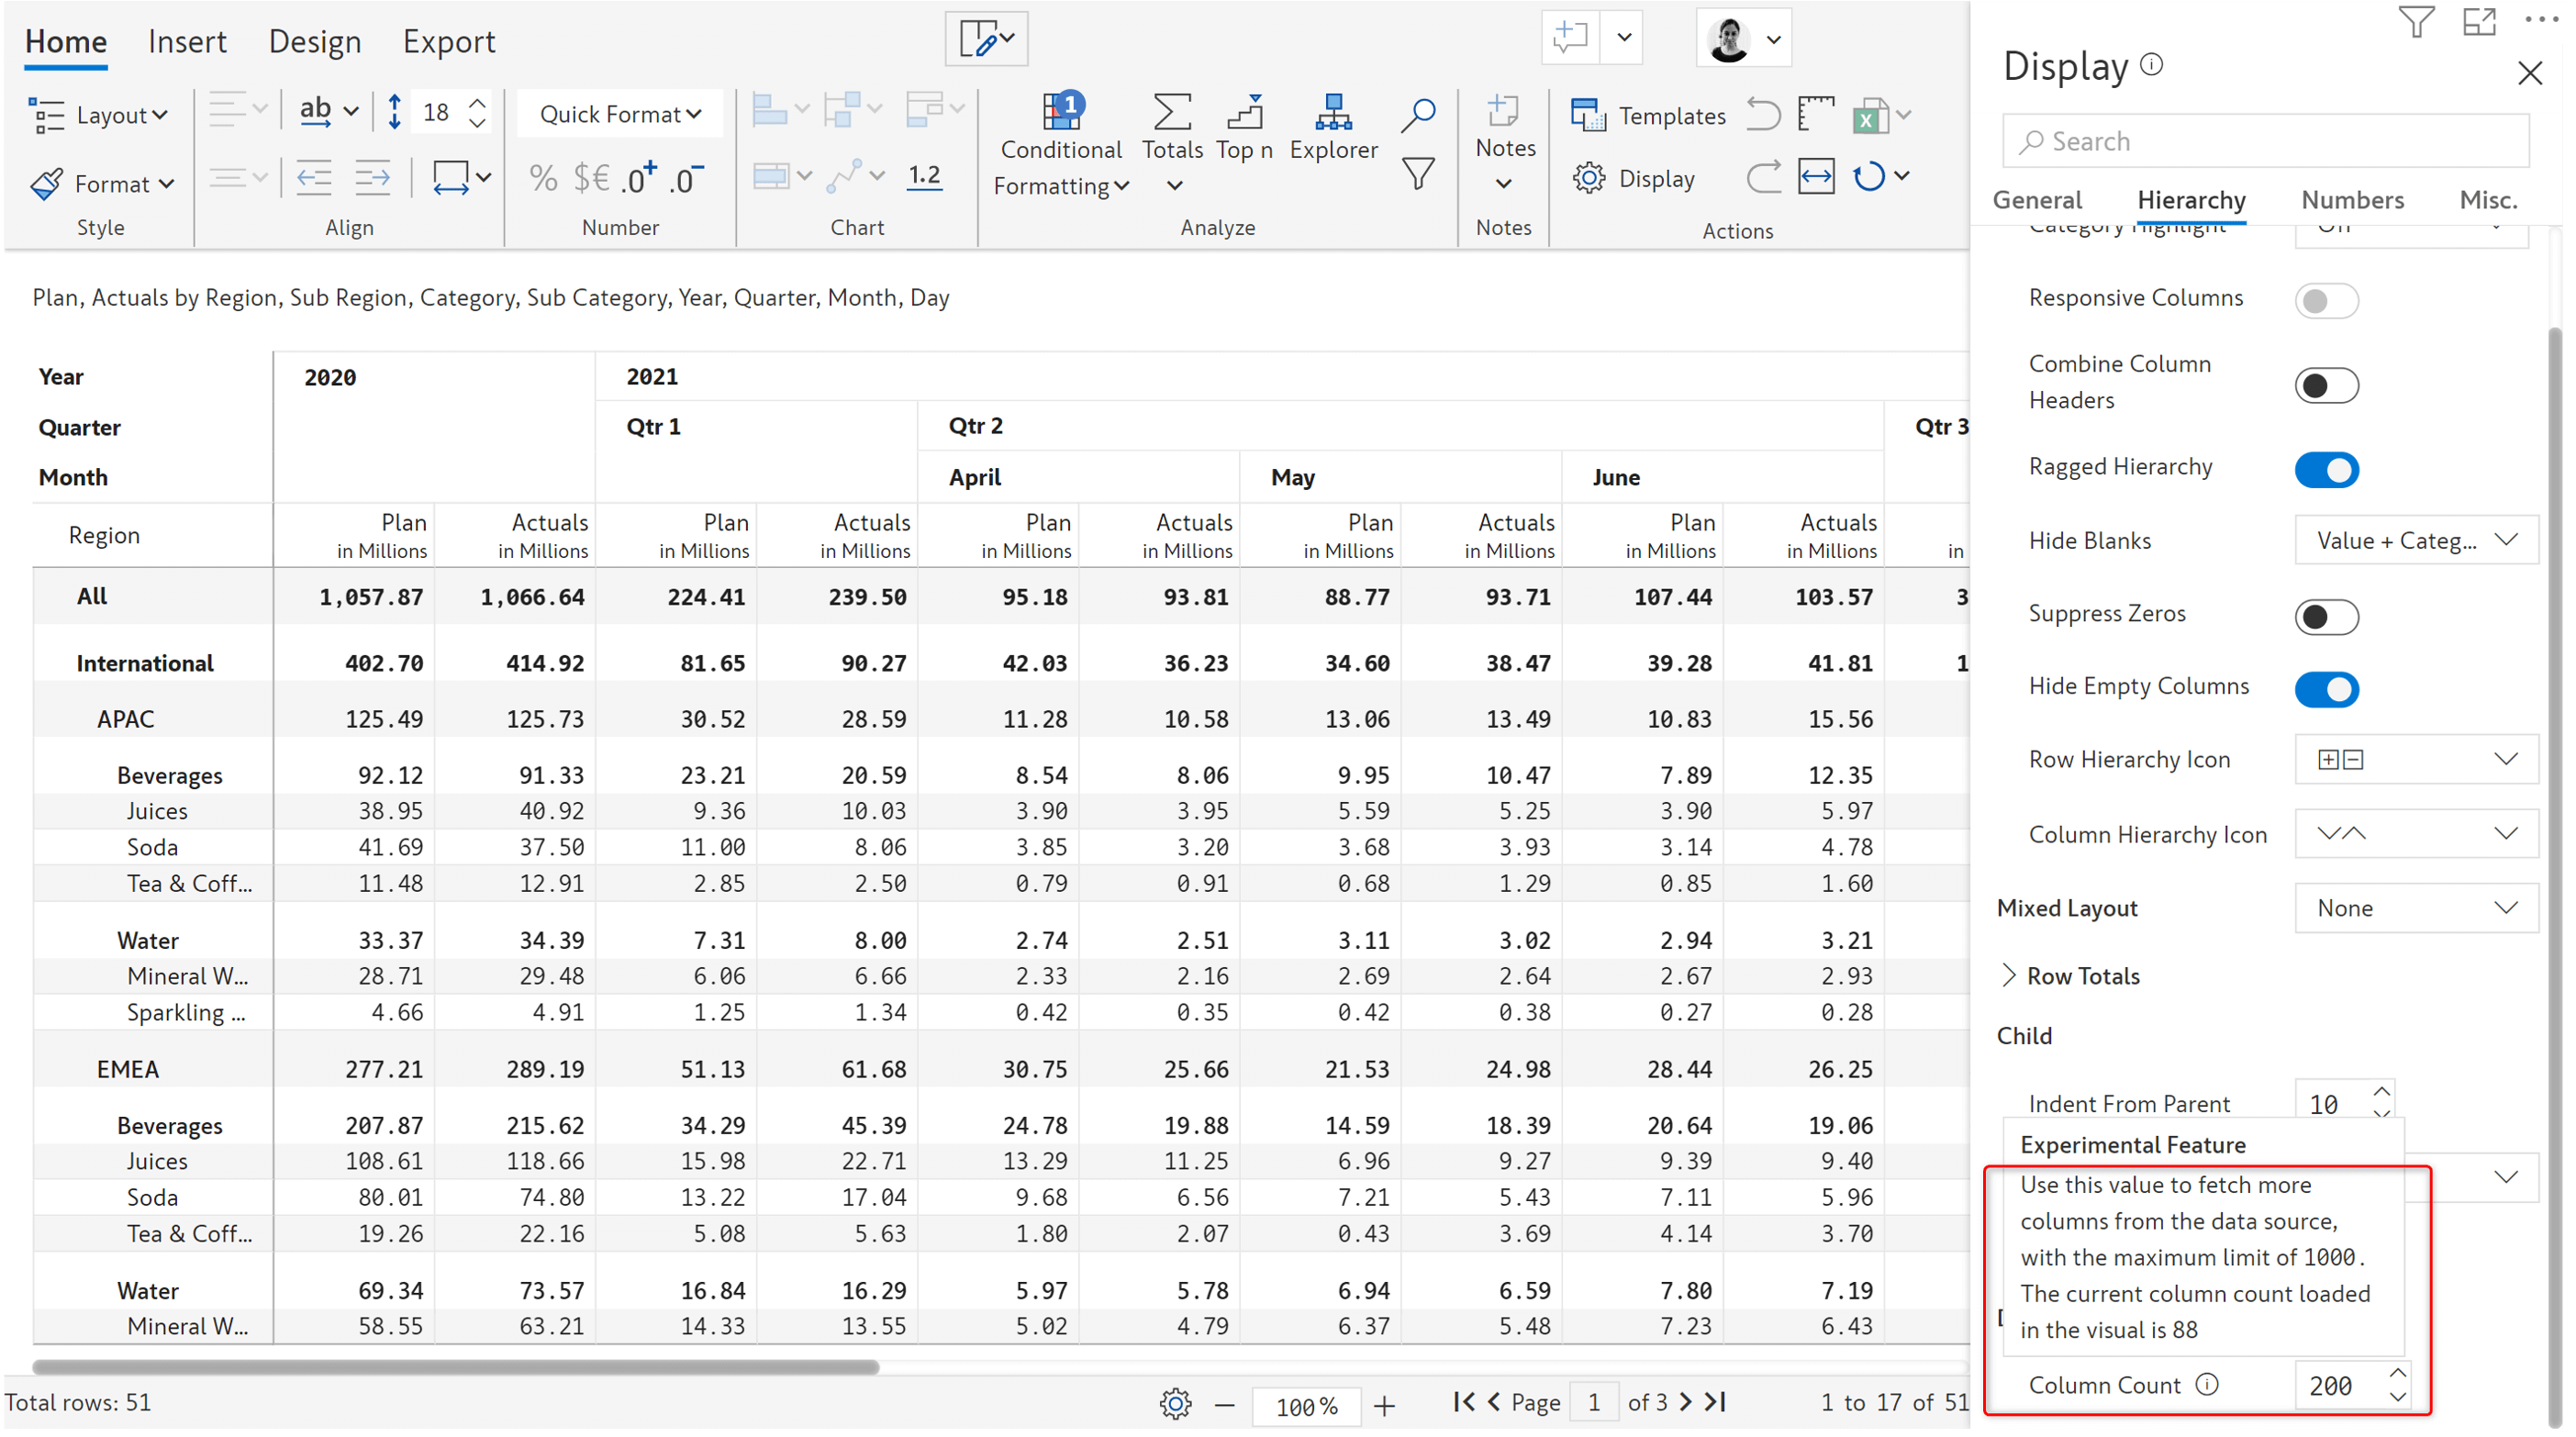
1. Dynamic columns
With the 2.0 release, Inforiver offers support for wide tables overriding the 60 columns limitation with a maximum limit of 1000 columns.
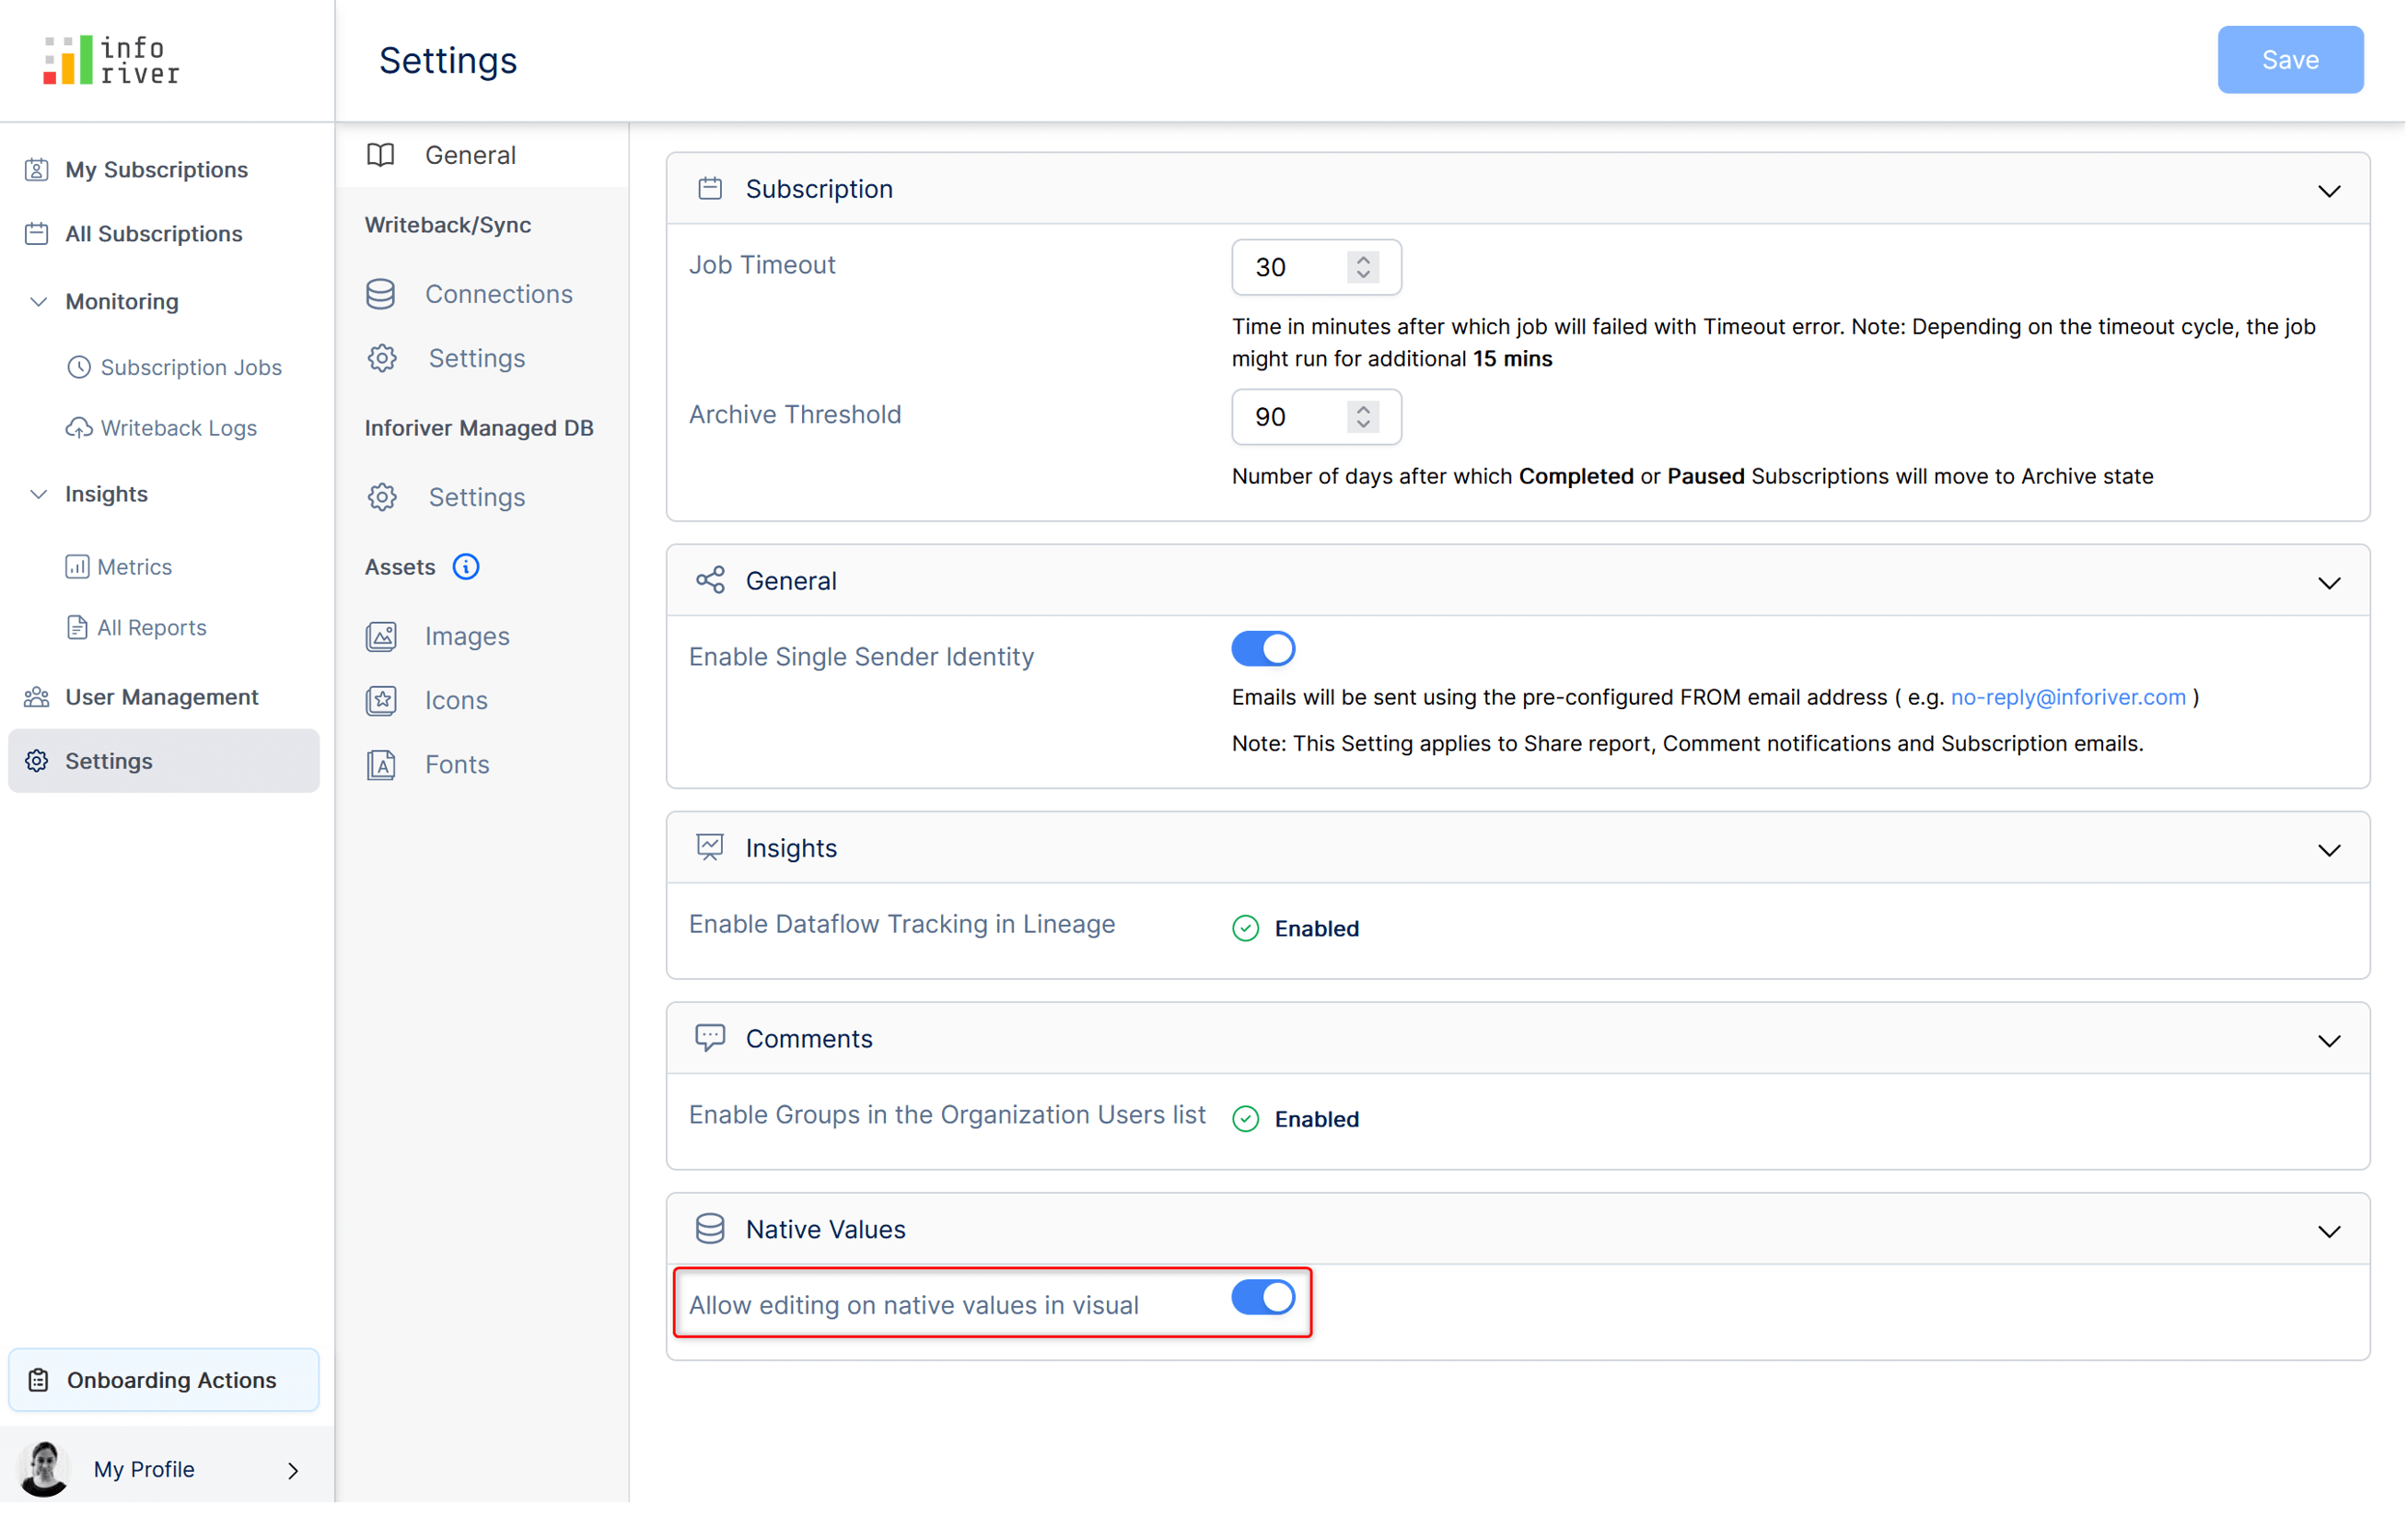
1. Native measures edit access
You can manage access to edit native measure in your report at the workspace level.
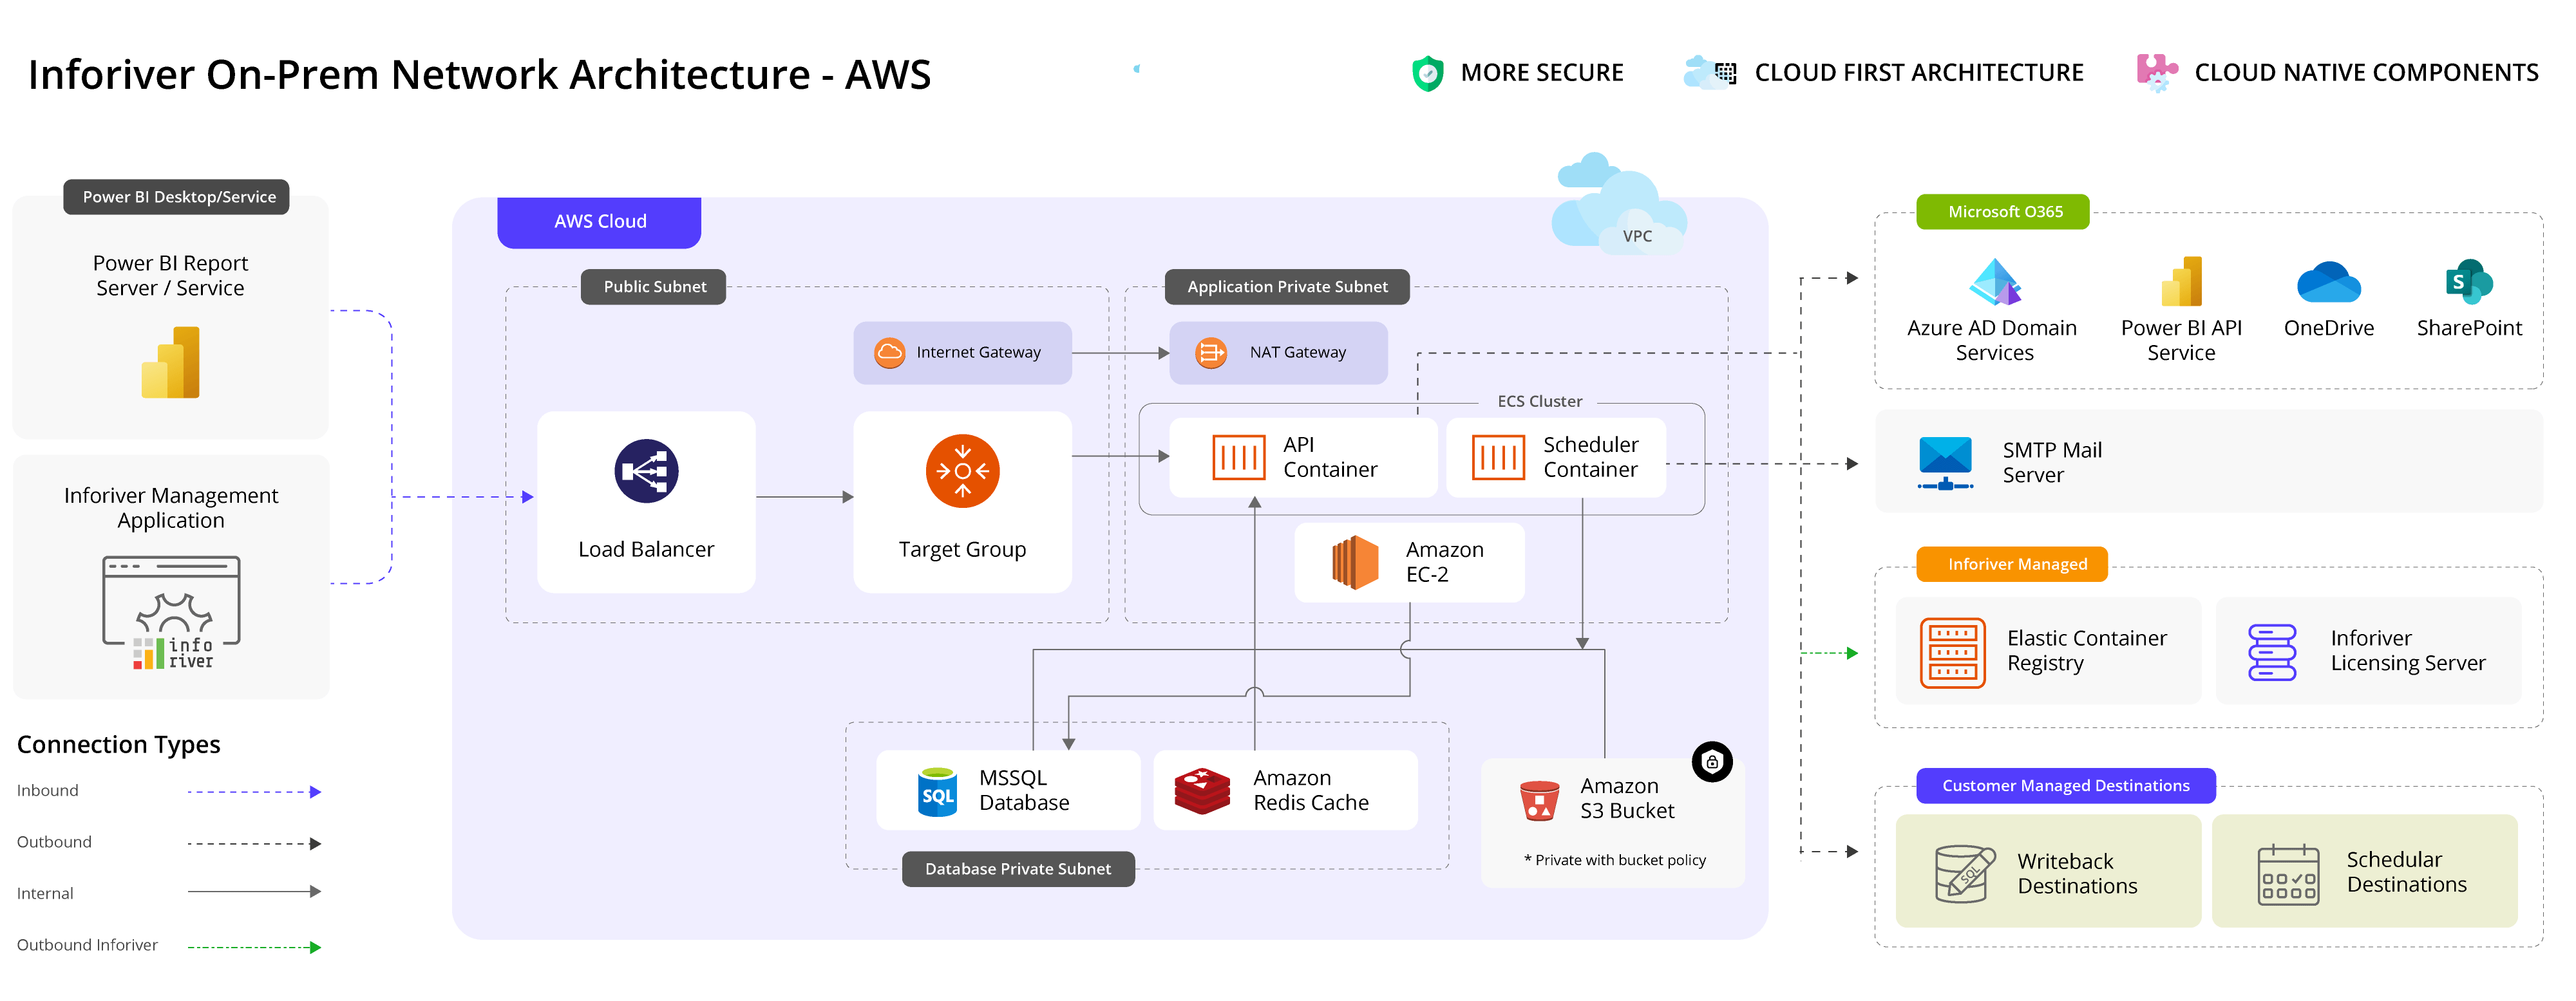
1. One-click deployment in AWS platform
Inforiver Enterprise 2.0 on-prem edition provides one click deployment/installation support for AWS. The functional architecture is shown in the below image. For the SaaS version, data isolation options for increased security and privacy for sensitive data is part of the roadmap.
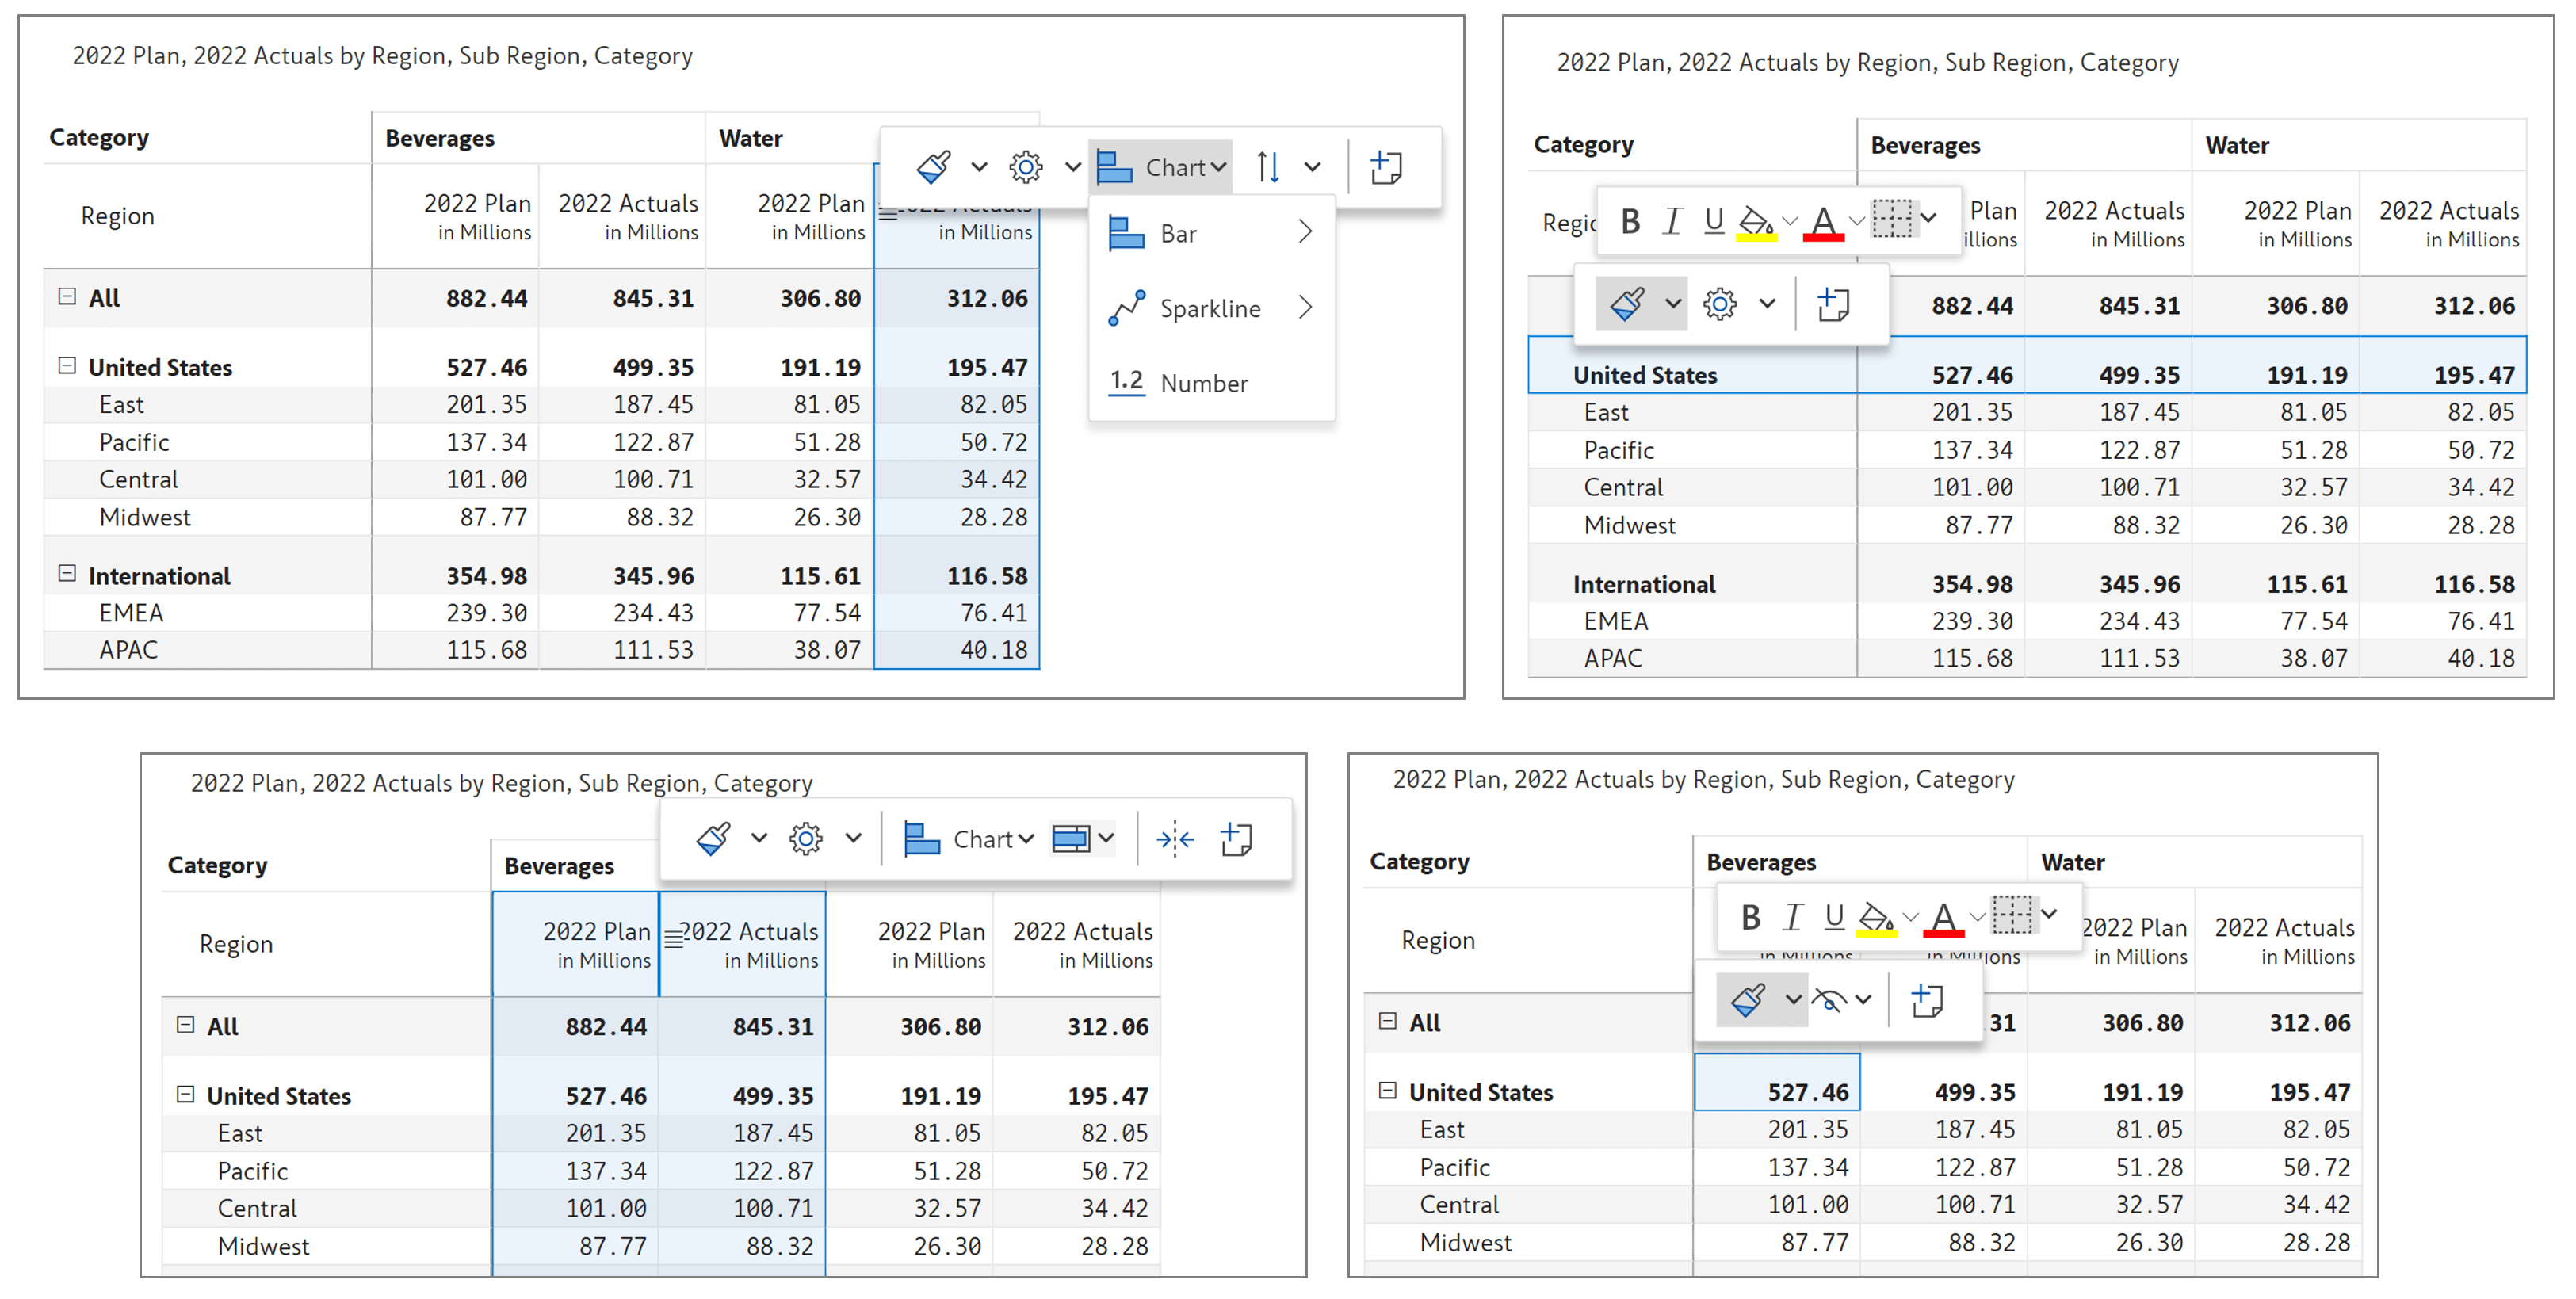
1. Floating toolbar
Version 2.0 introduces an Excel-like floating toolbar on selecting specific report elements for improved discoverability and better small screen experience. This is enabled only when the toolbar is unpinned. The floating toolbars on selecting a cell, row, column and multiple columns are shown below. Watch this video to learn more.
2. Column styling
You can customize the background and text color and fill type in the reading and editing modes for locked cells, data input columns and others (data source, calculated and simulated columns) with the column styling option.
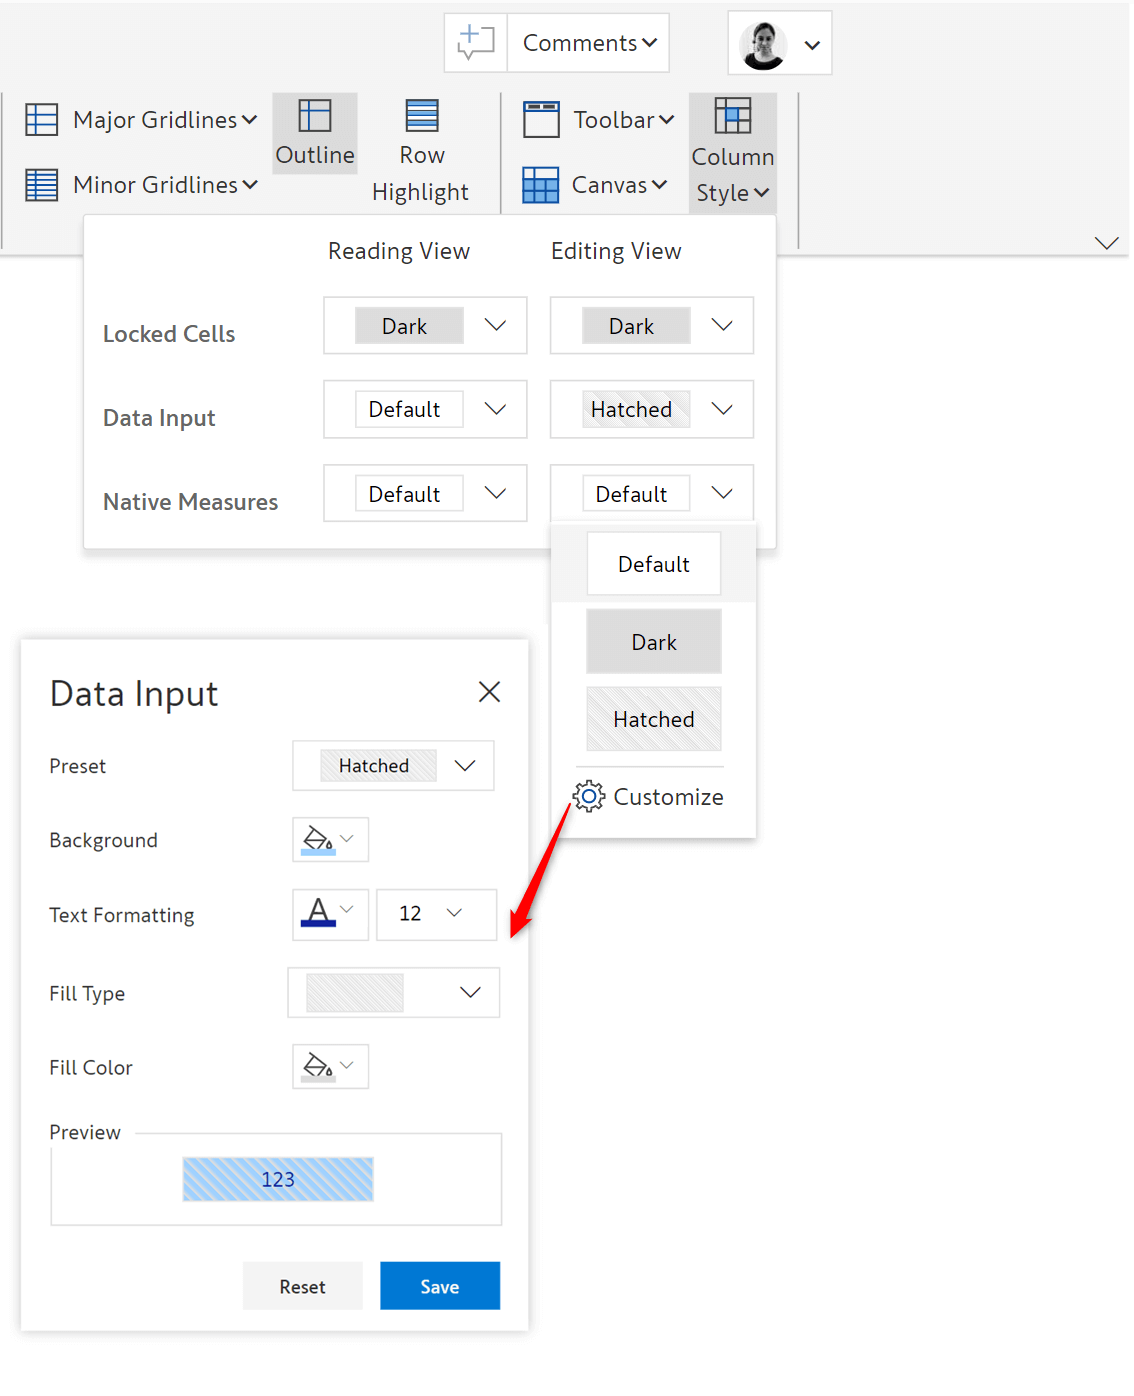
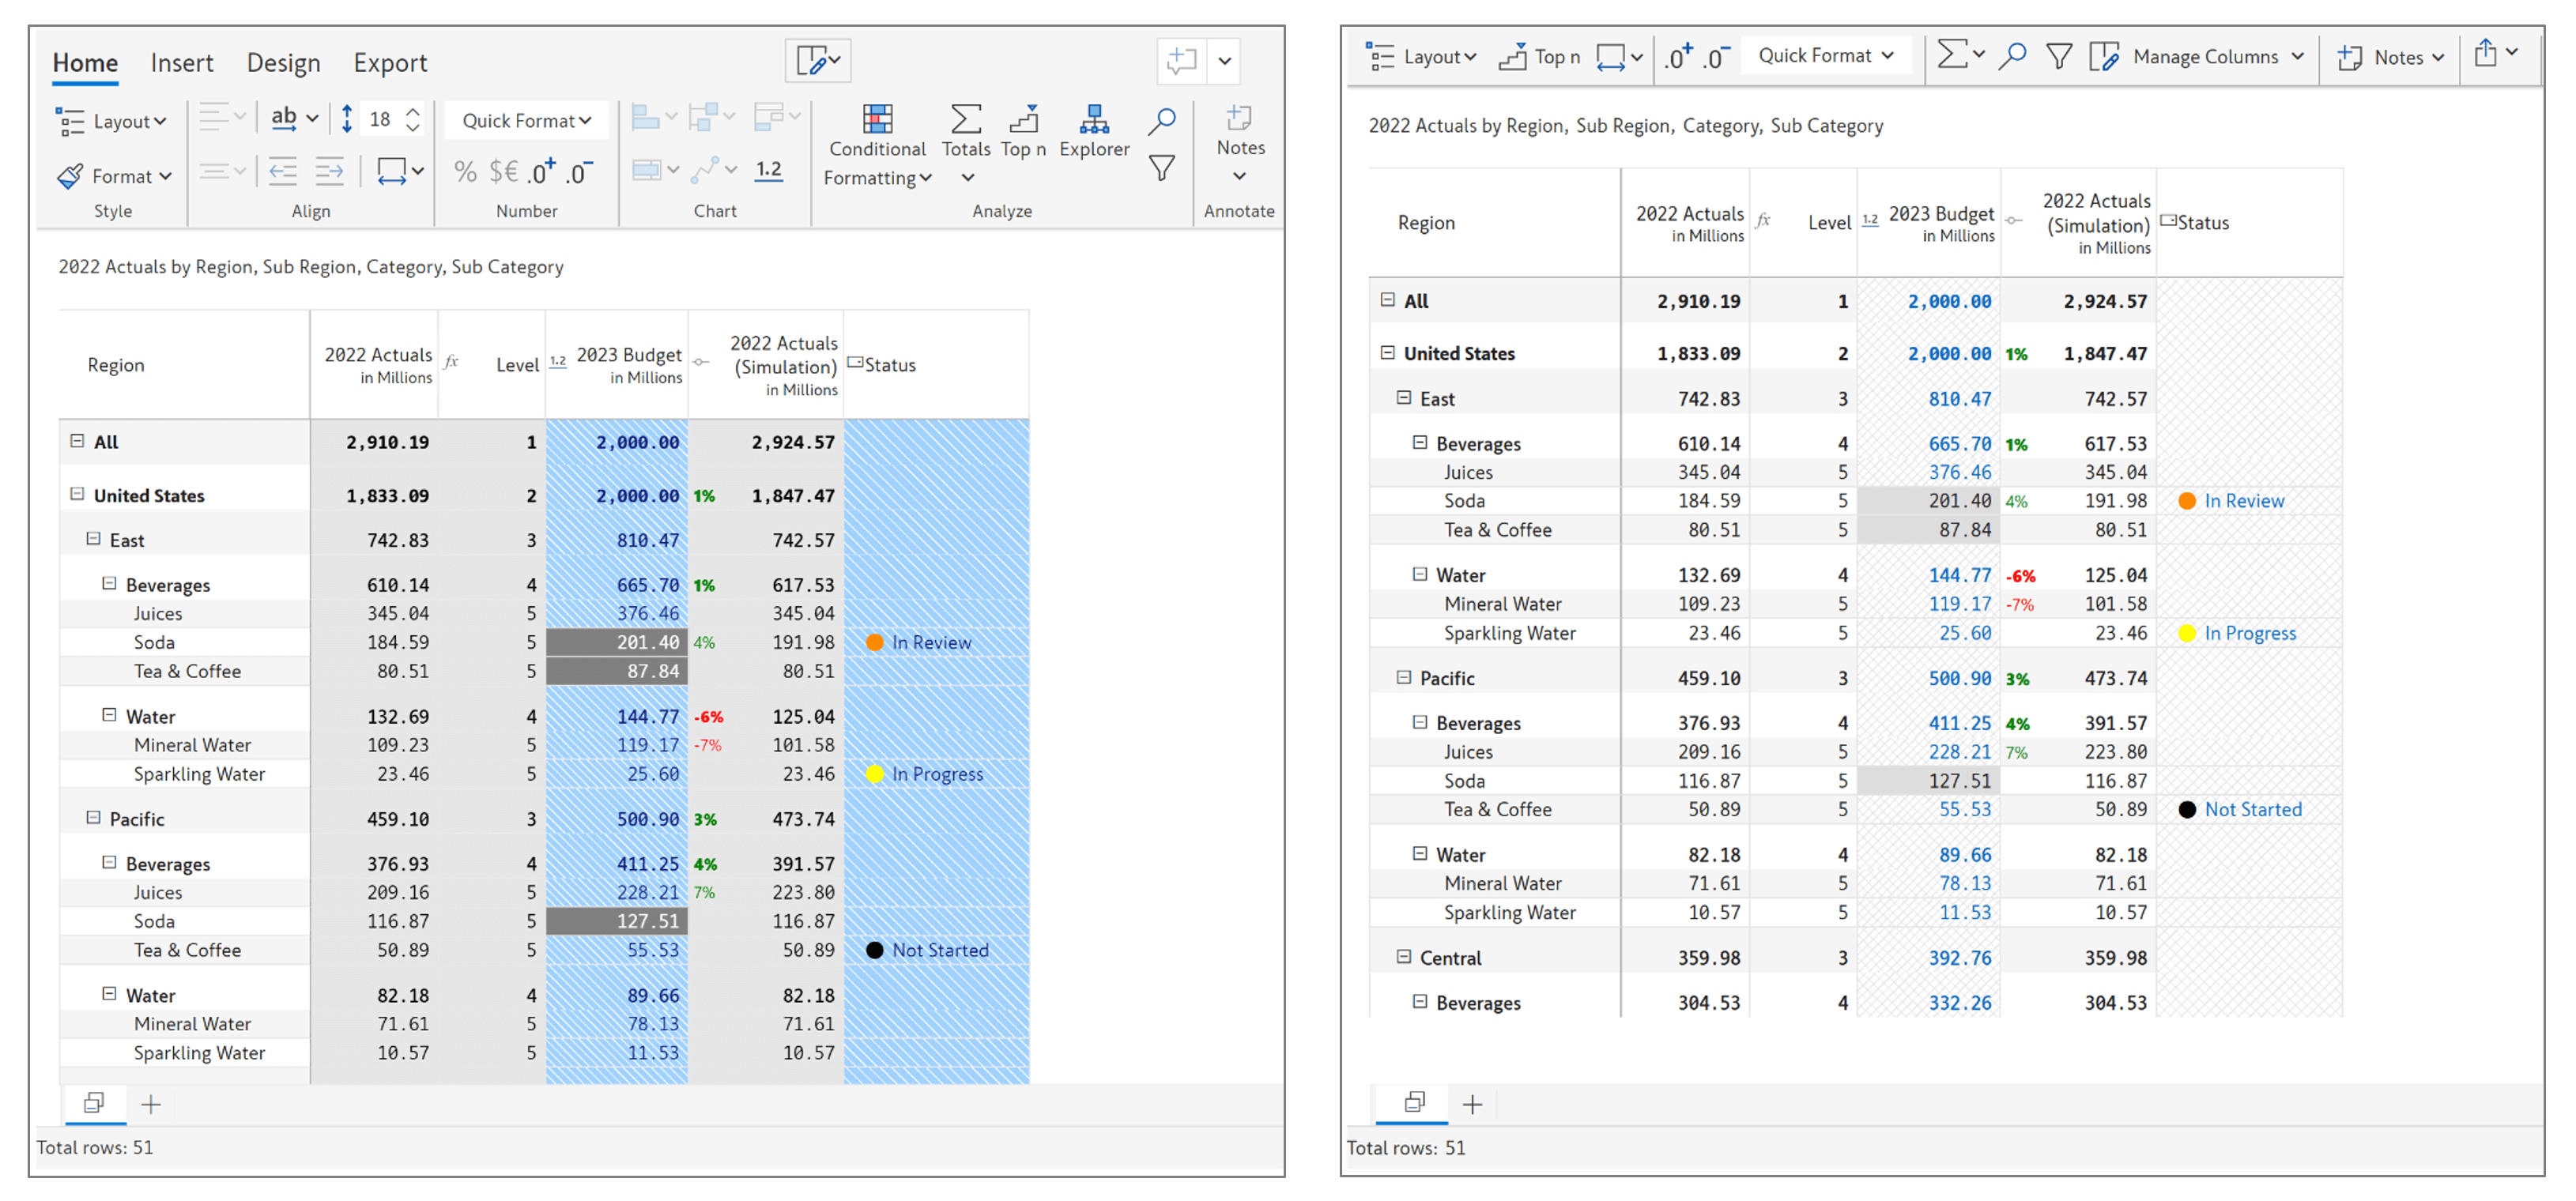
The report in edit view and reading view are shown below.
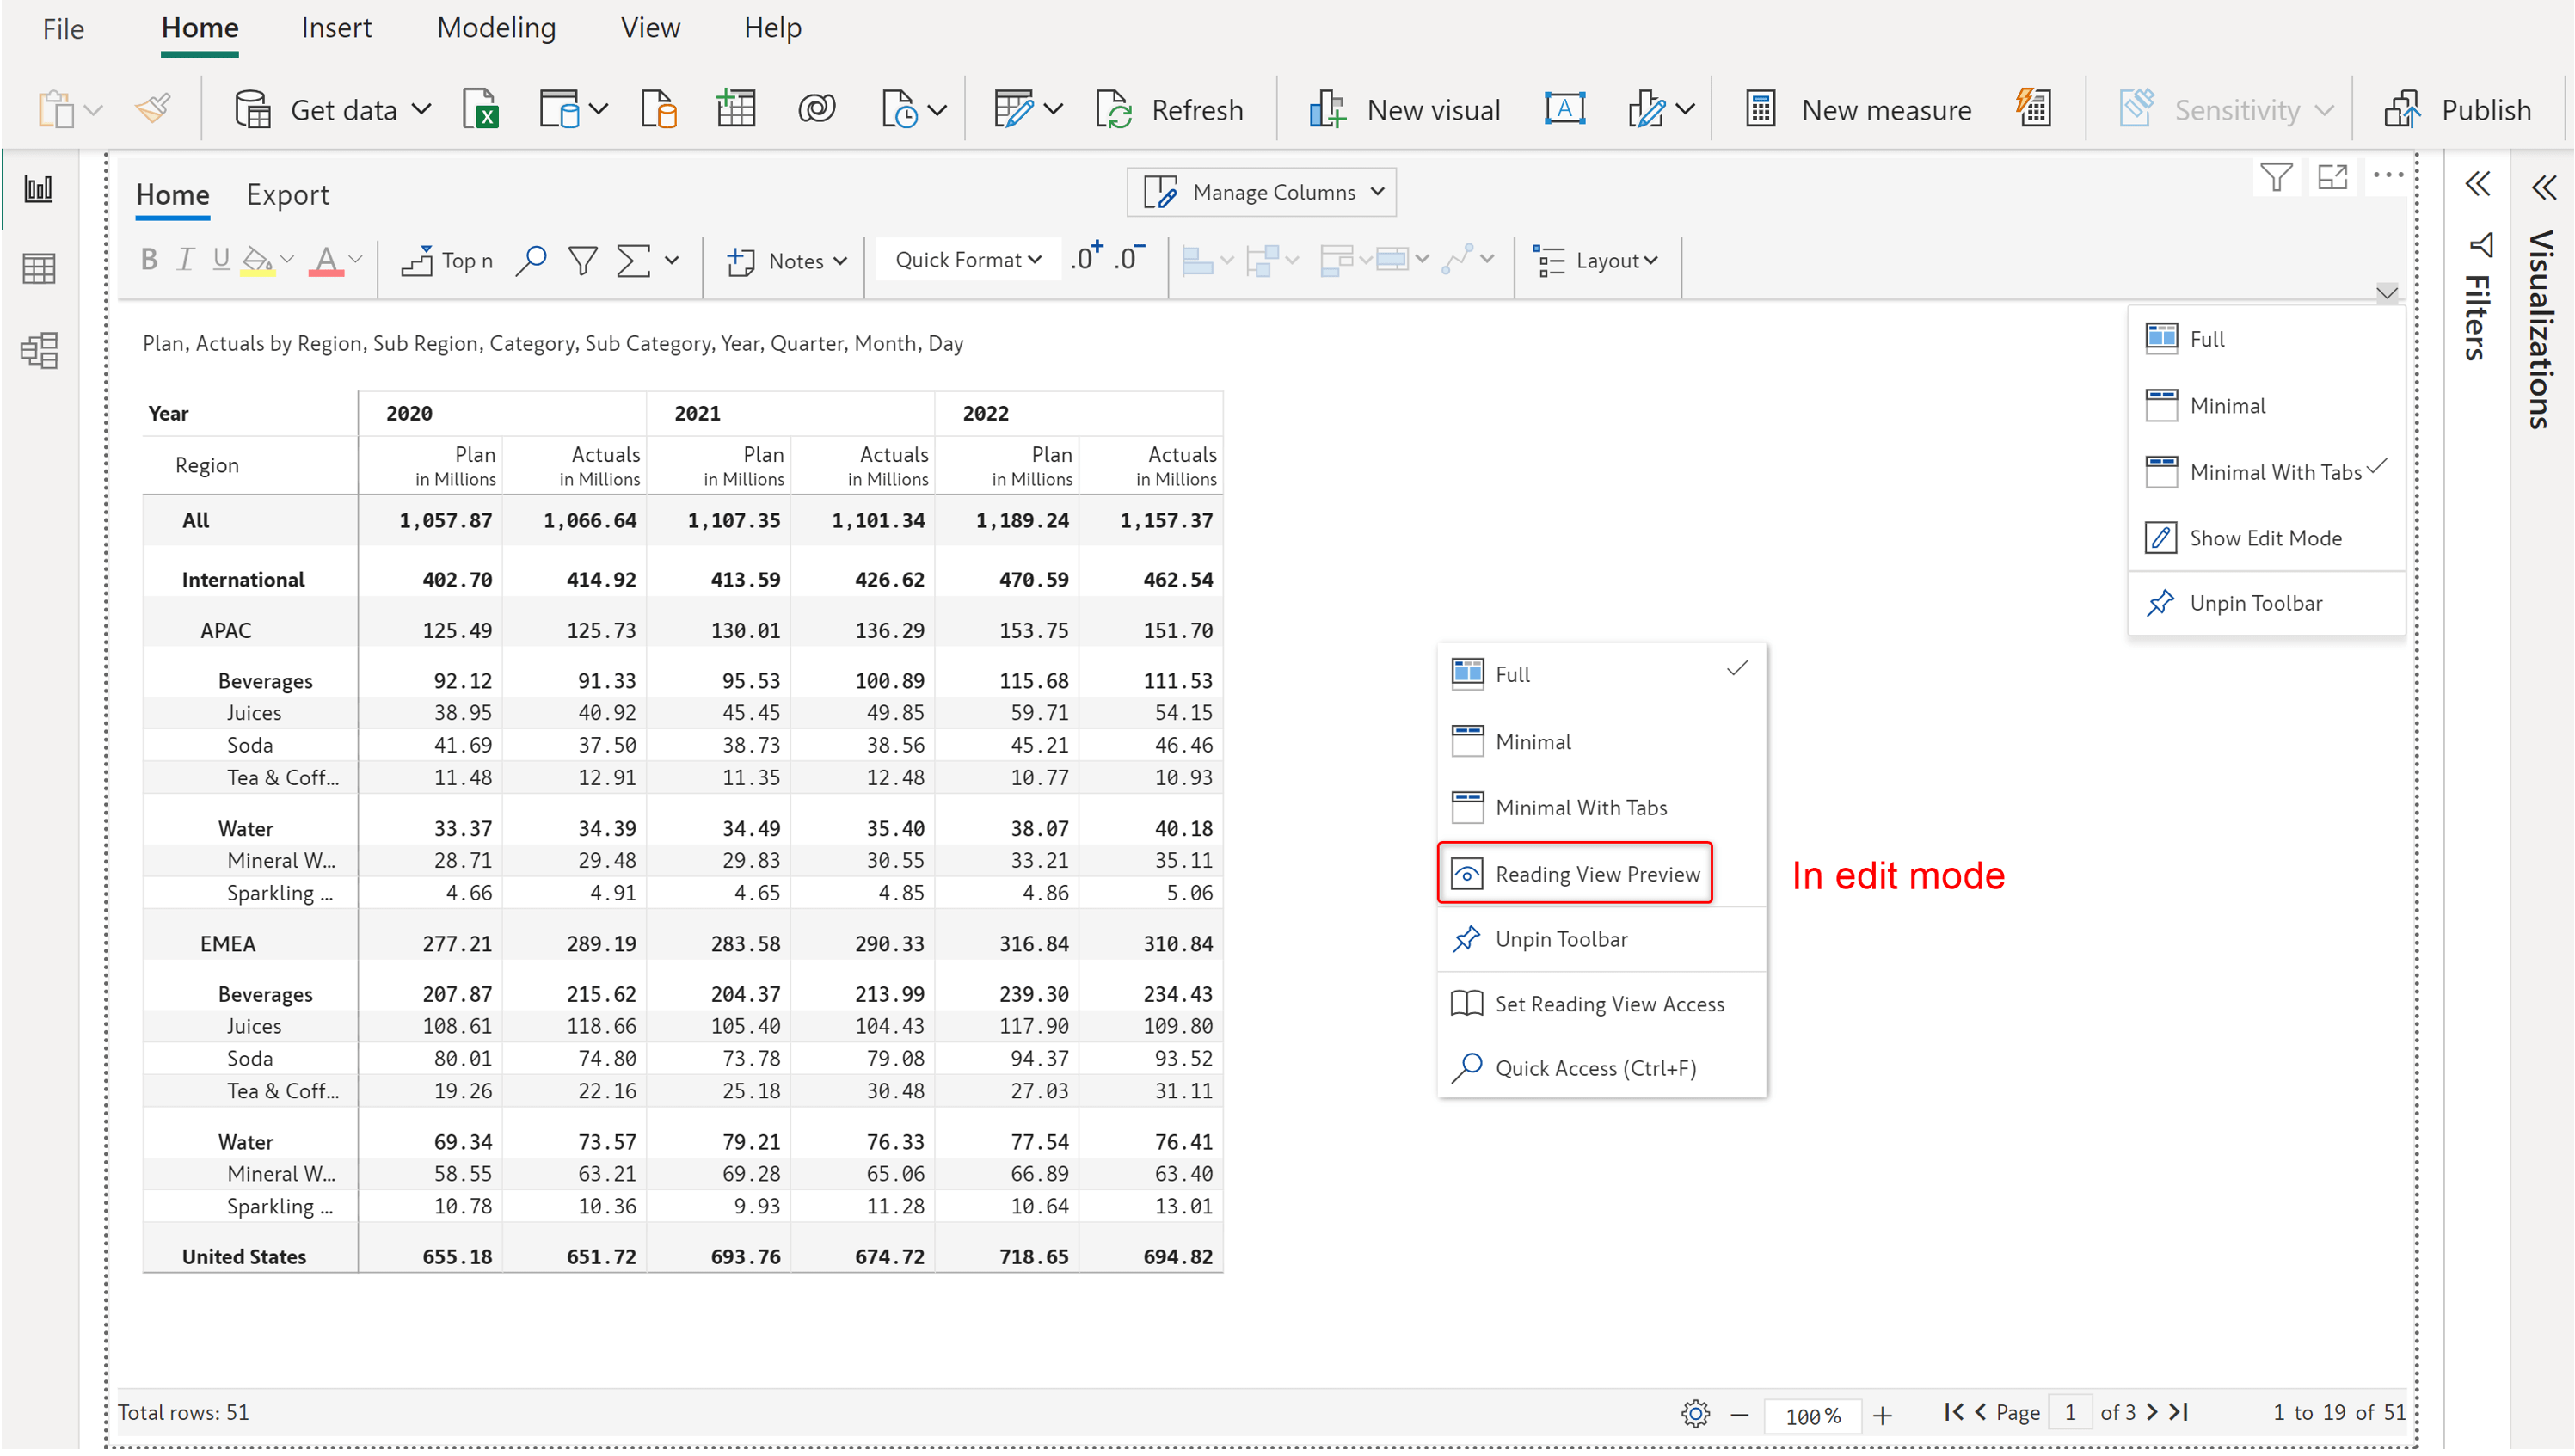
3. Reading view preview
You can preview the reading view toolbar right from the edit mode (without publishing the report to Power BI service).
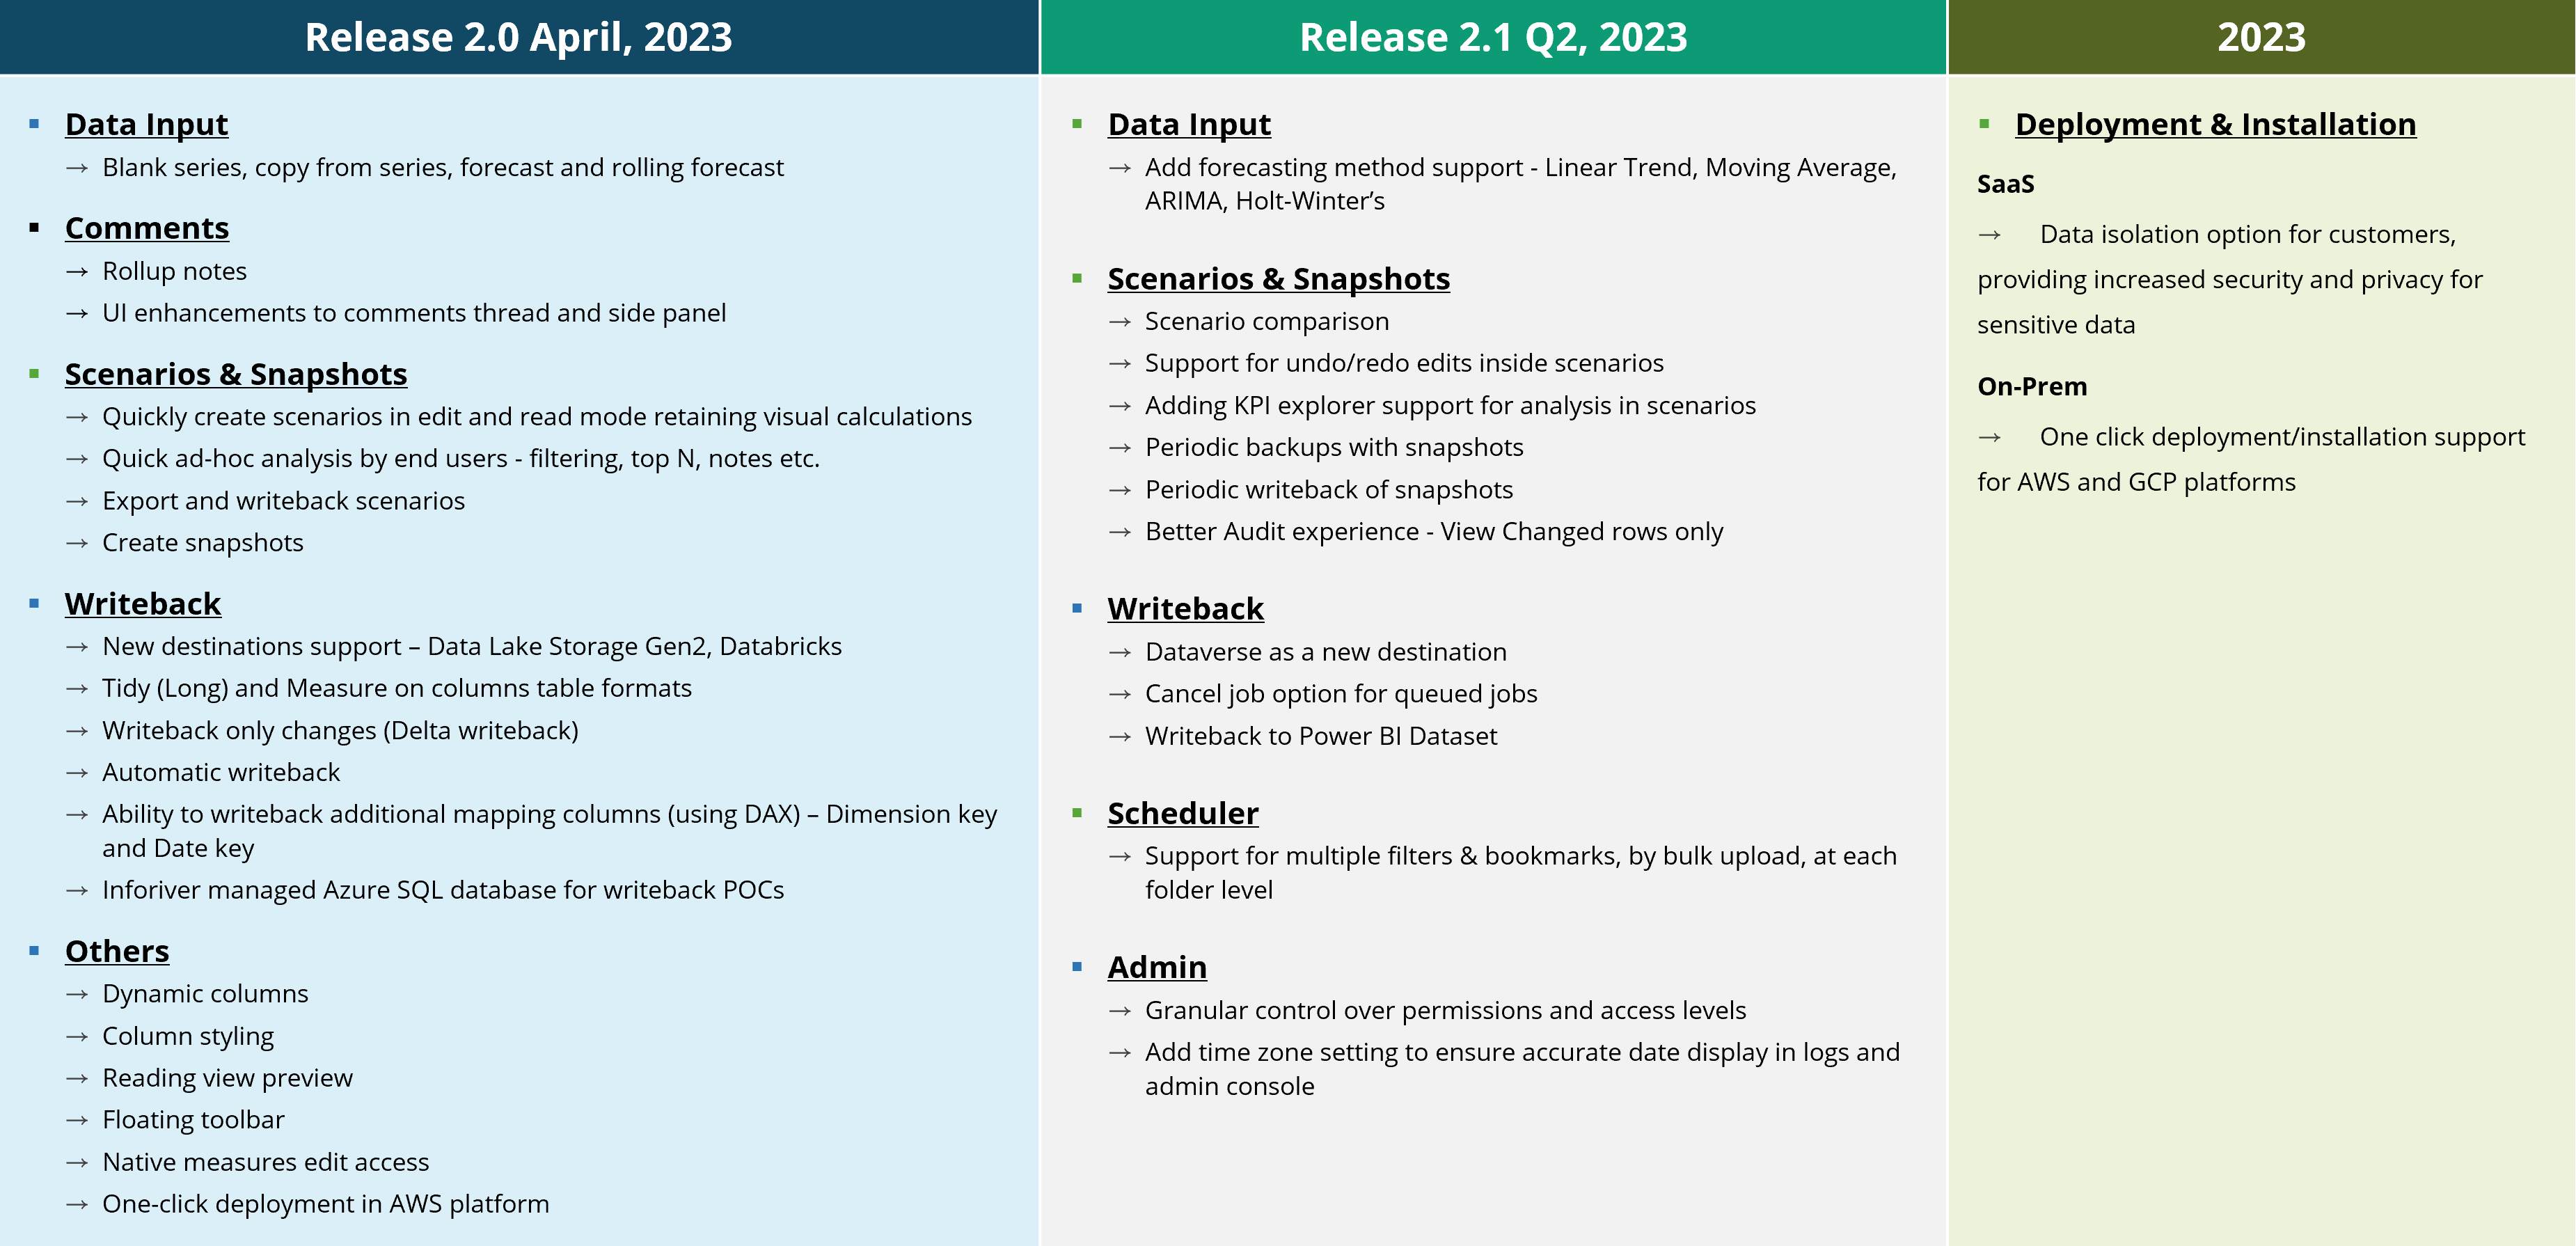
New features and enhancements that are part of the 2.0 release and the roadmap for the next quarter are given below.
Note: The latest version of Inforiver Enterprise is now available on Microsoft Appsource.
We'd love to hear your ideas for Inforiver – be it a cool new feature or an improvement on existing features. Visit the Inforiver Community to share your ideas, vote on other submissions, and interact with other users.

Inforiver helps enterprises consolidate planning, reporting & analytics on a single platform (Power BI). The no-code, self-service award-winning platform has been recognized as the industry’s best and is adopted by many Fortune 100 firms.
Inforiver is a product of Lumel, the #1 Power BI AppSource Partner. The firm serves over 3,000 customers worldwide through its portfolio of products offered under the brands Inforiver, EDITable, ValQ, and xViz.