Upcoming webinar on 'Inforiver Charts : The fastest way to deliver stories in Power BI', Aug 29th , Monday, 10.30 AM CST. Register Now
Upcoming webinar on 'Inforiver Charts : The fastest way to deliver stories in Power BI', Aug 29th , Monday, 10.30 AM CST. Register Now
Welcome to the Inforiver Premium 2.4 release update. We are thrilled to announce several new features and key enhancements to forecasting, formulas & functions, headers and UI/UX - most anticipated by our Inforiver community!
Key enhancements in this 2.4 release are listed below. Feel free to jump to any specific section!
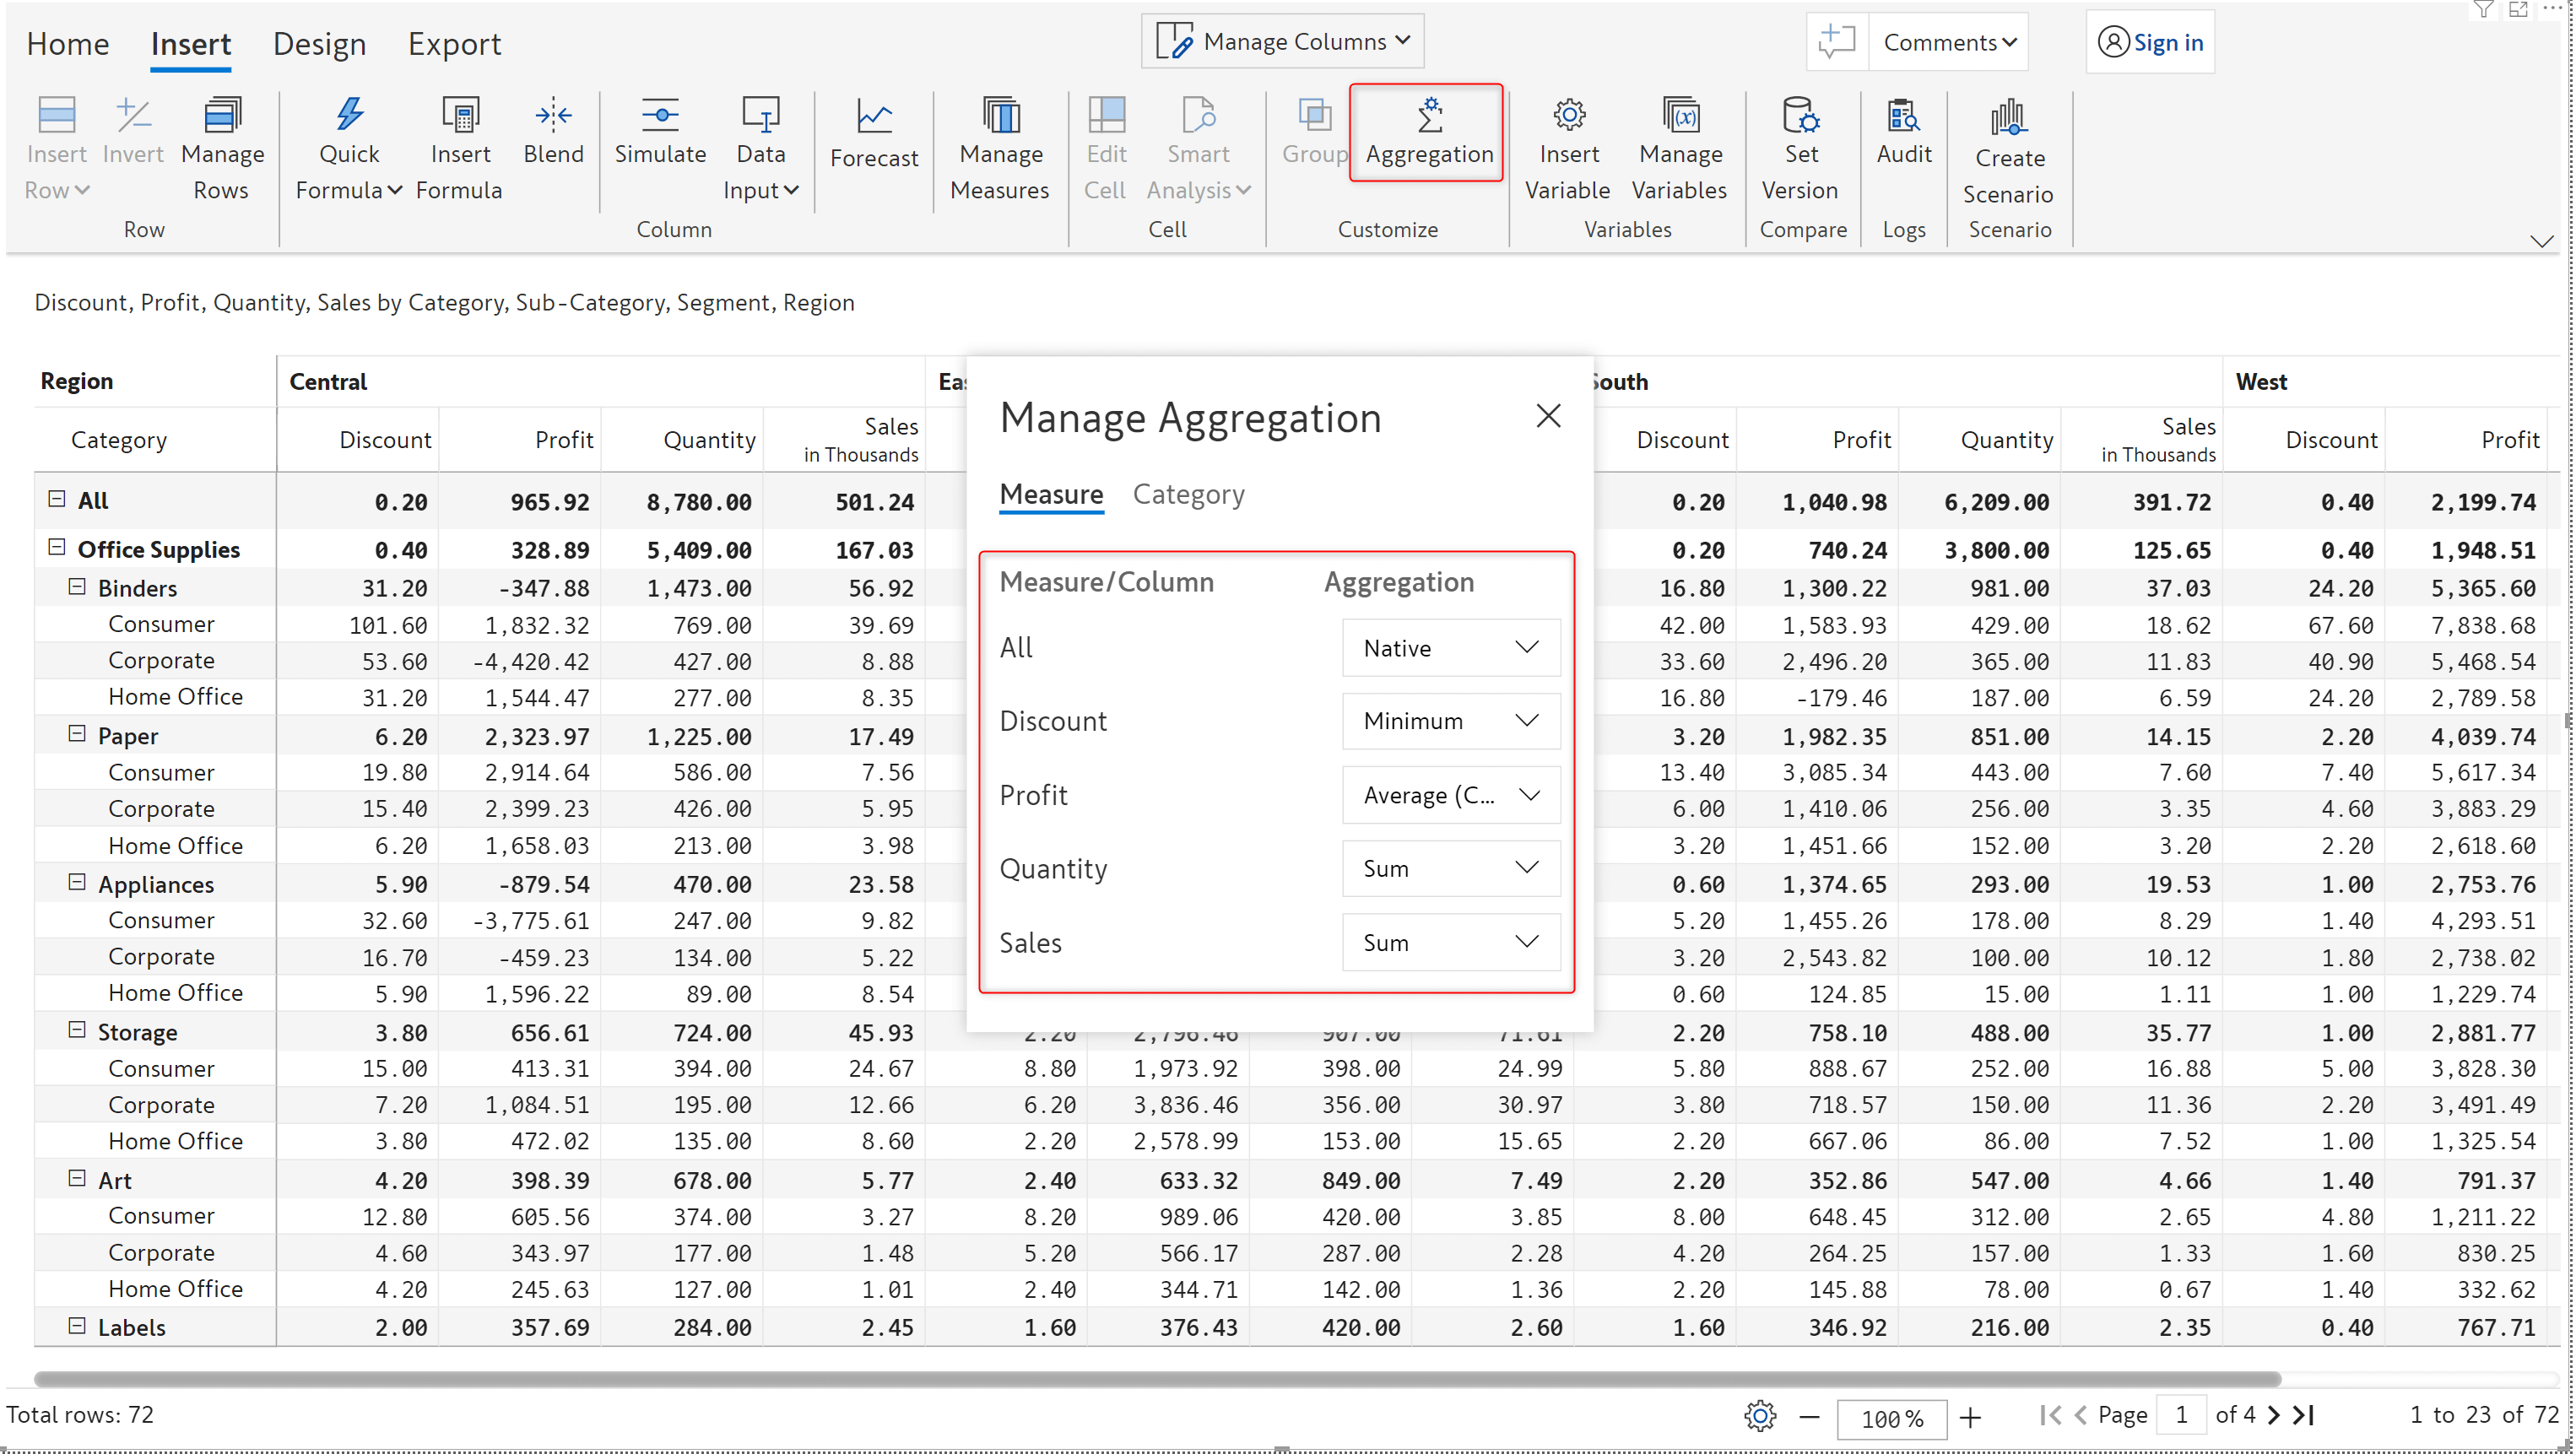
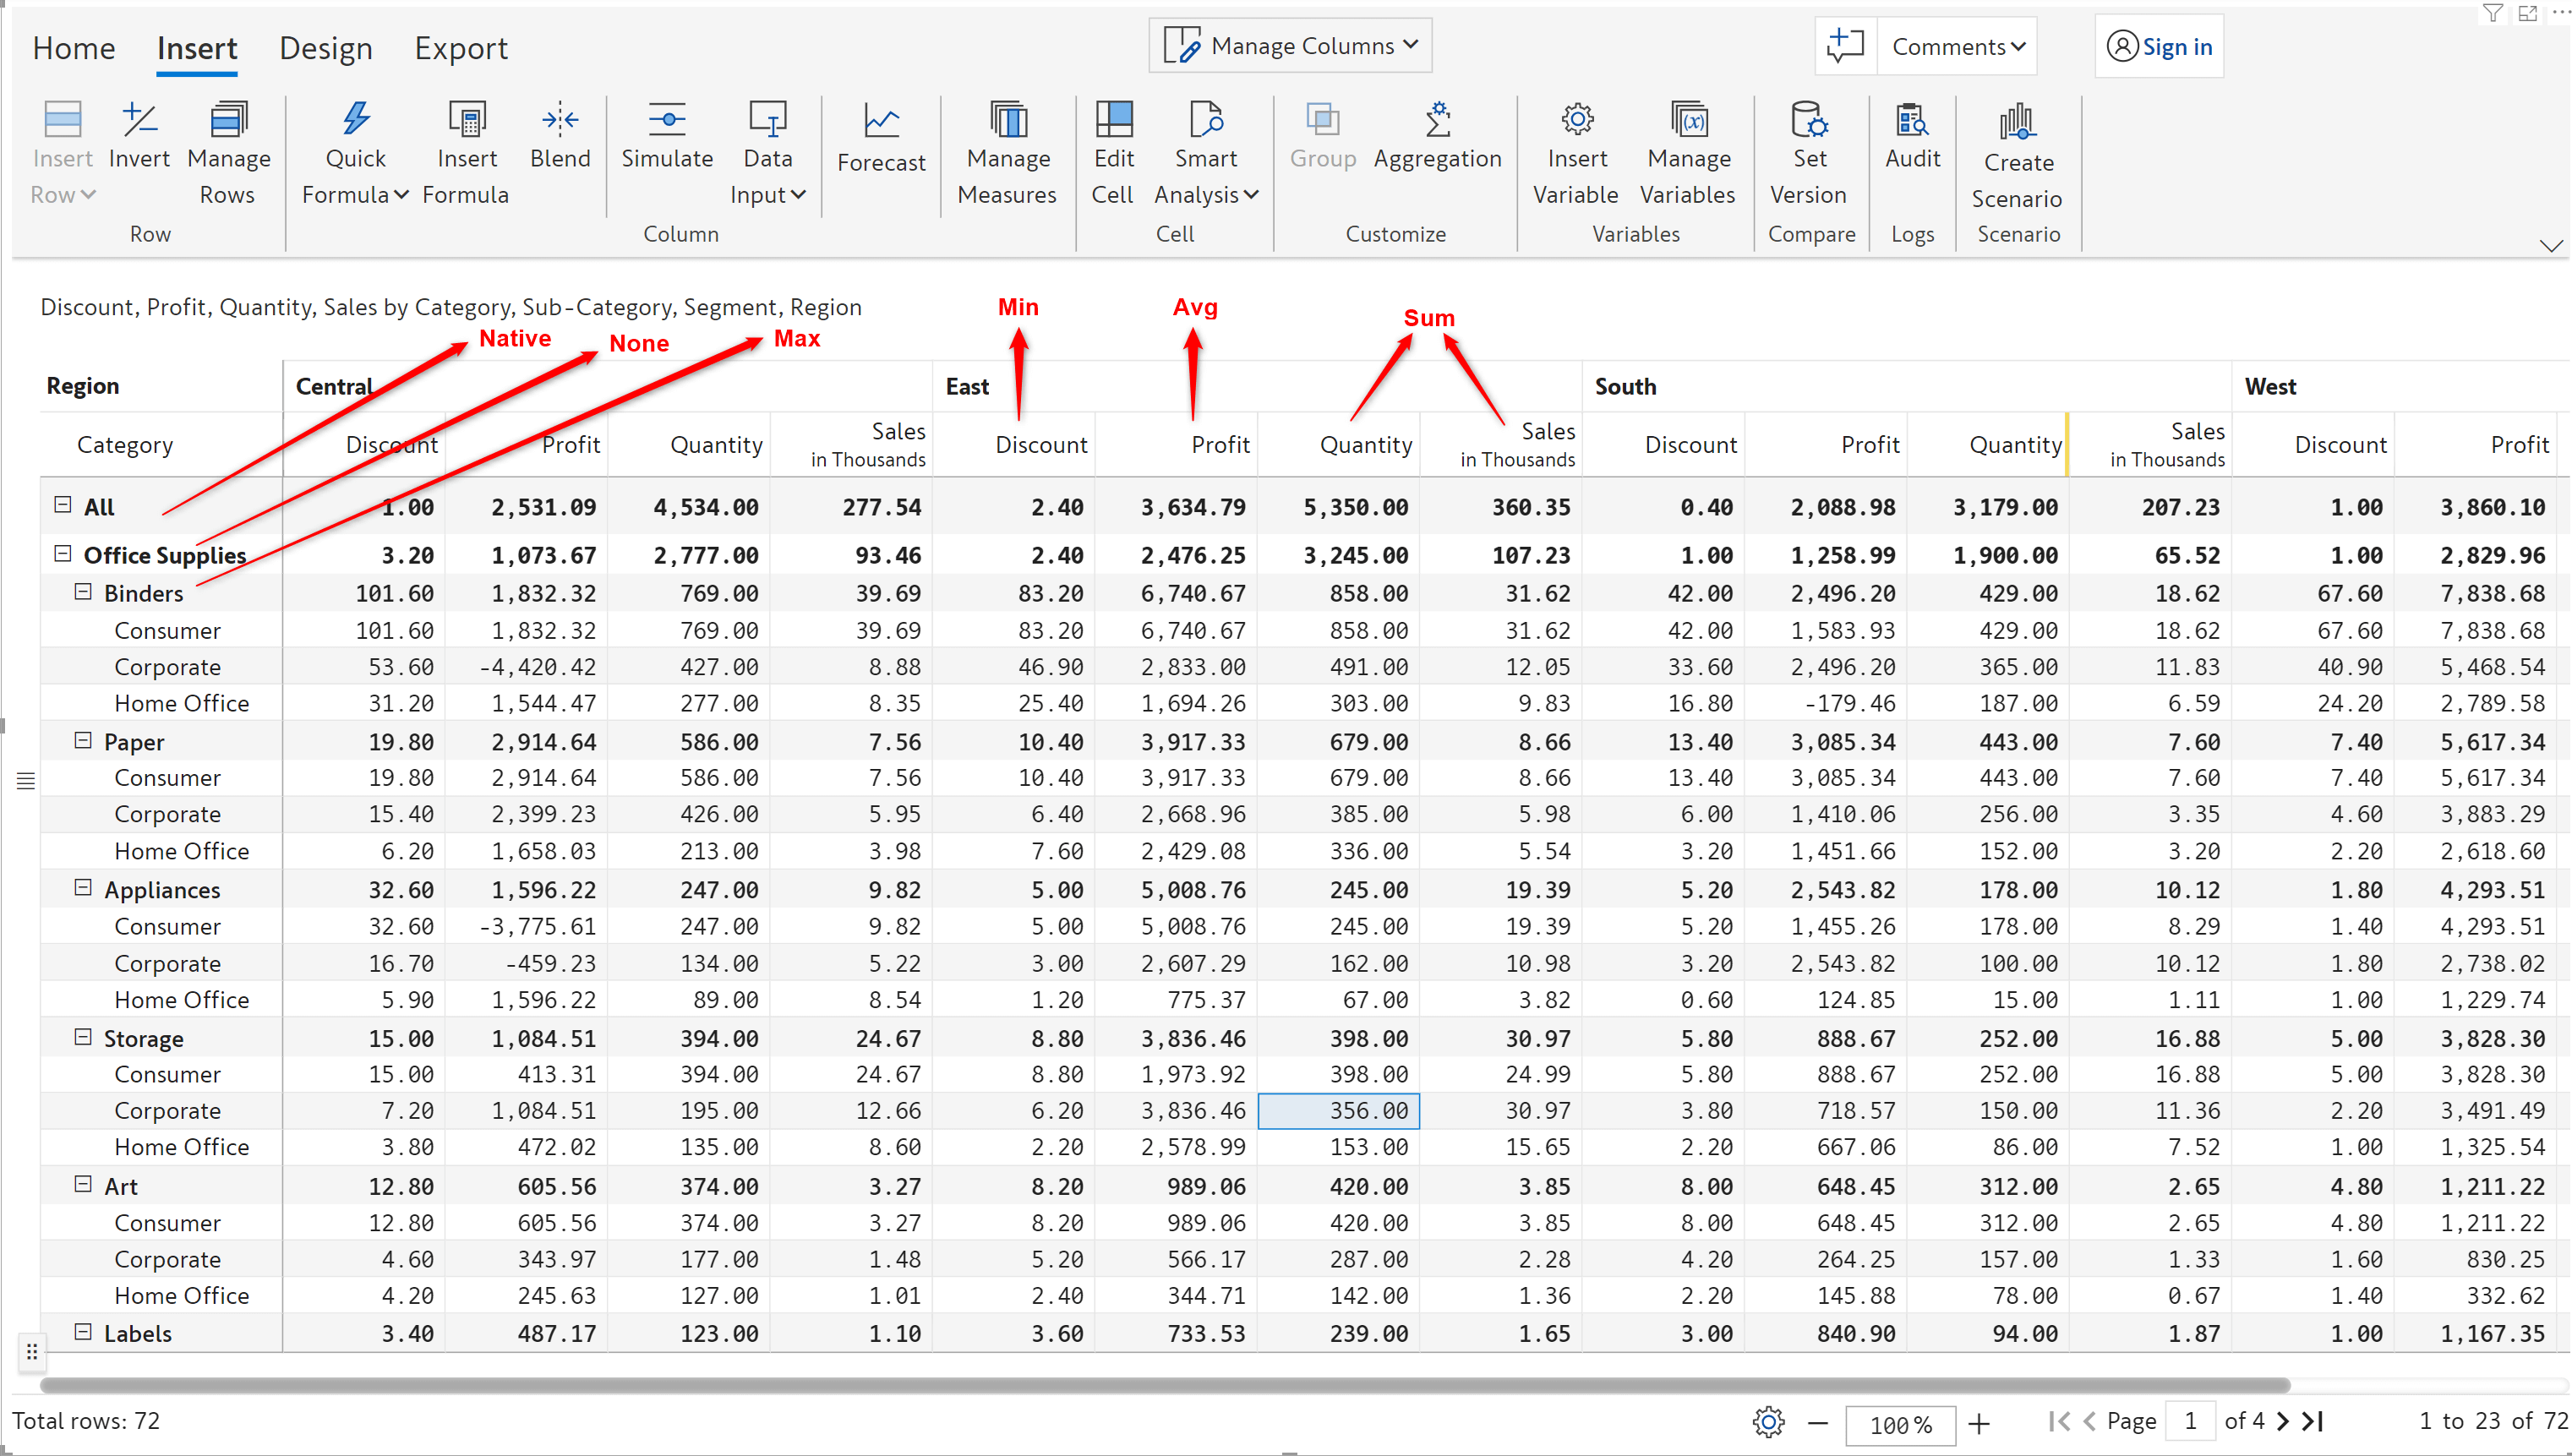
With the 2.4 release, the interface for setting aggregation enables you to set aggregation at global level, measure level as well as category level in a centralized configuration window.
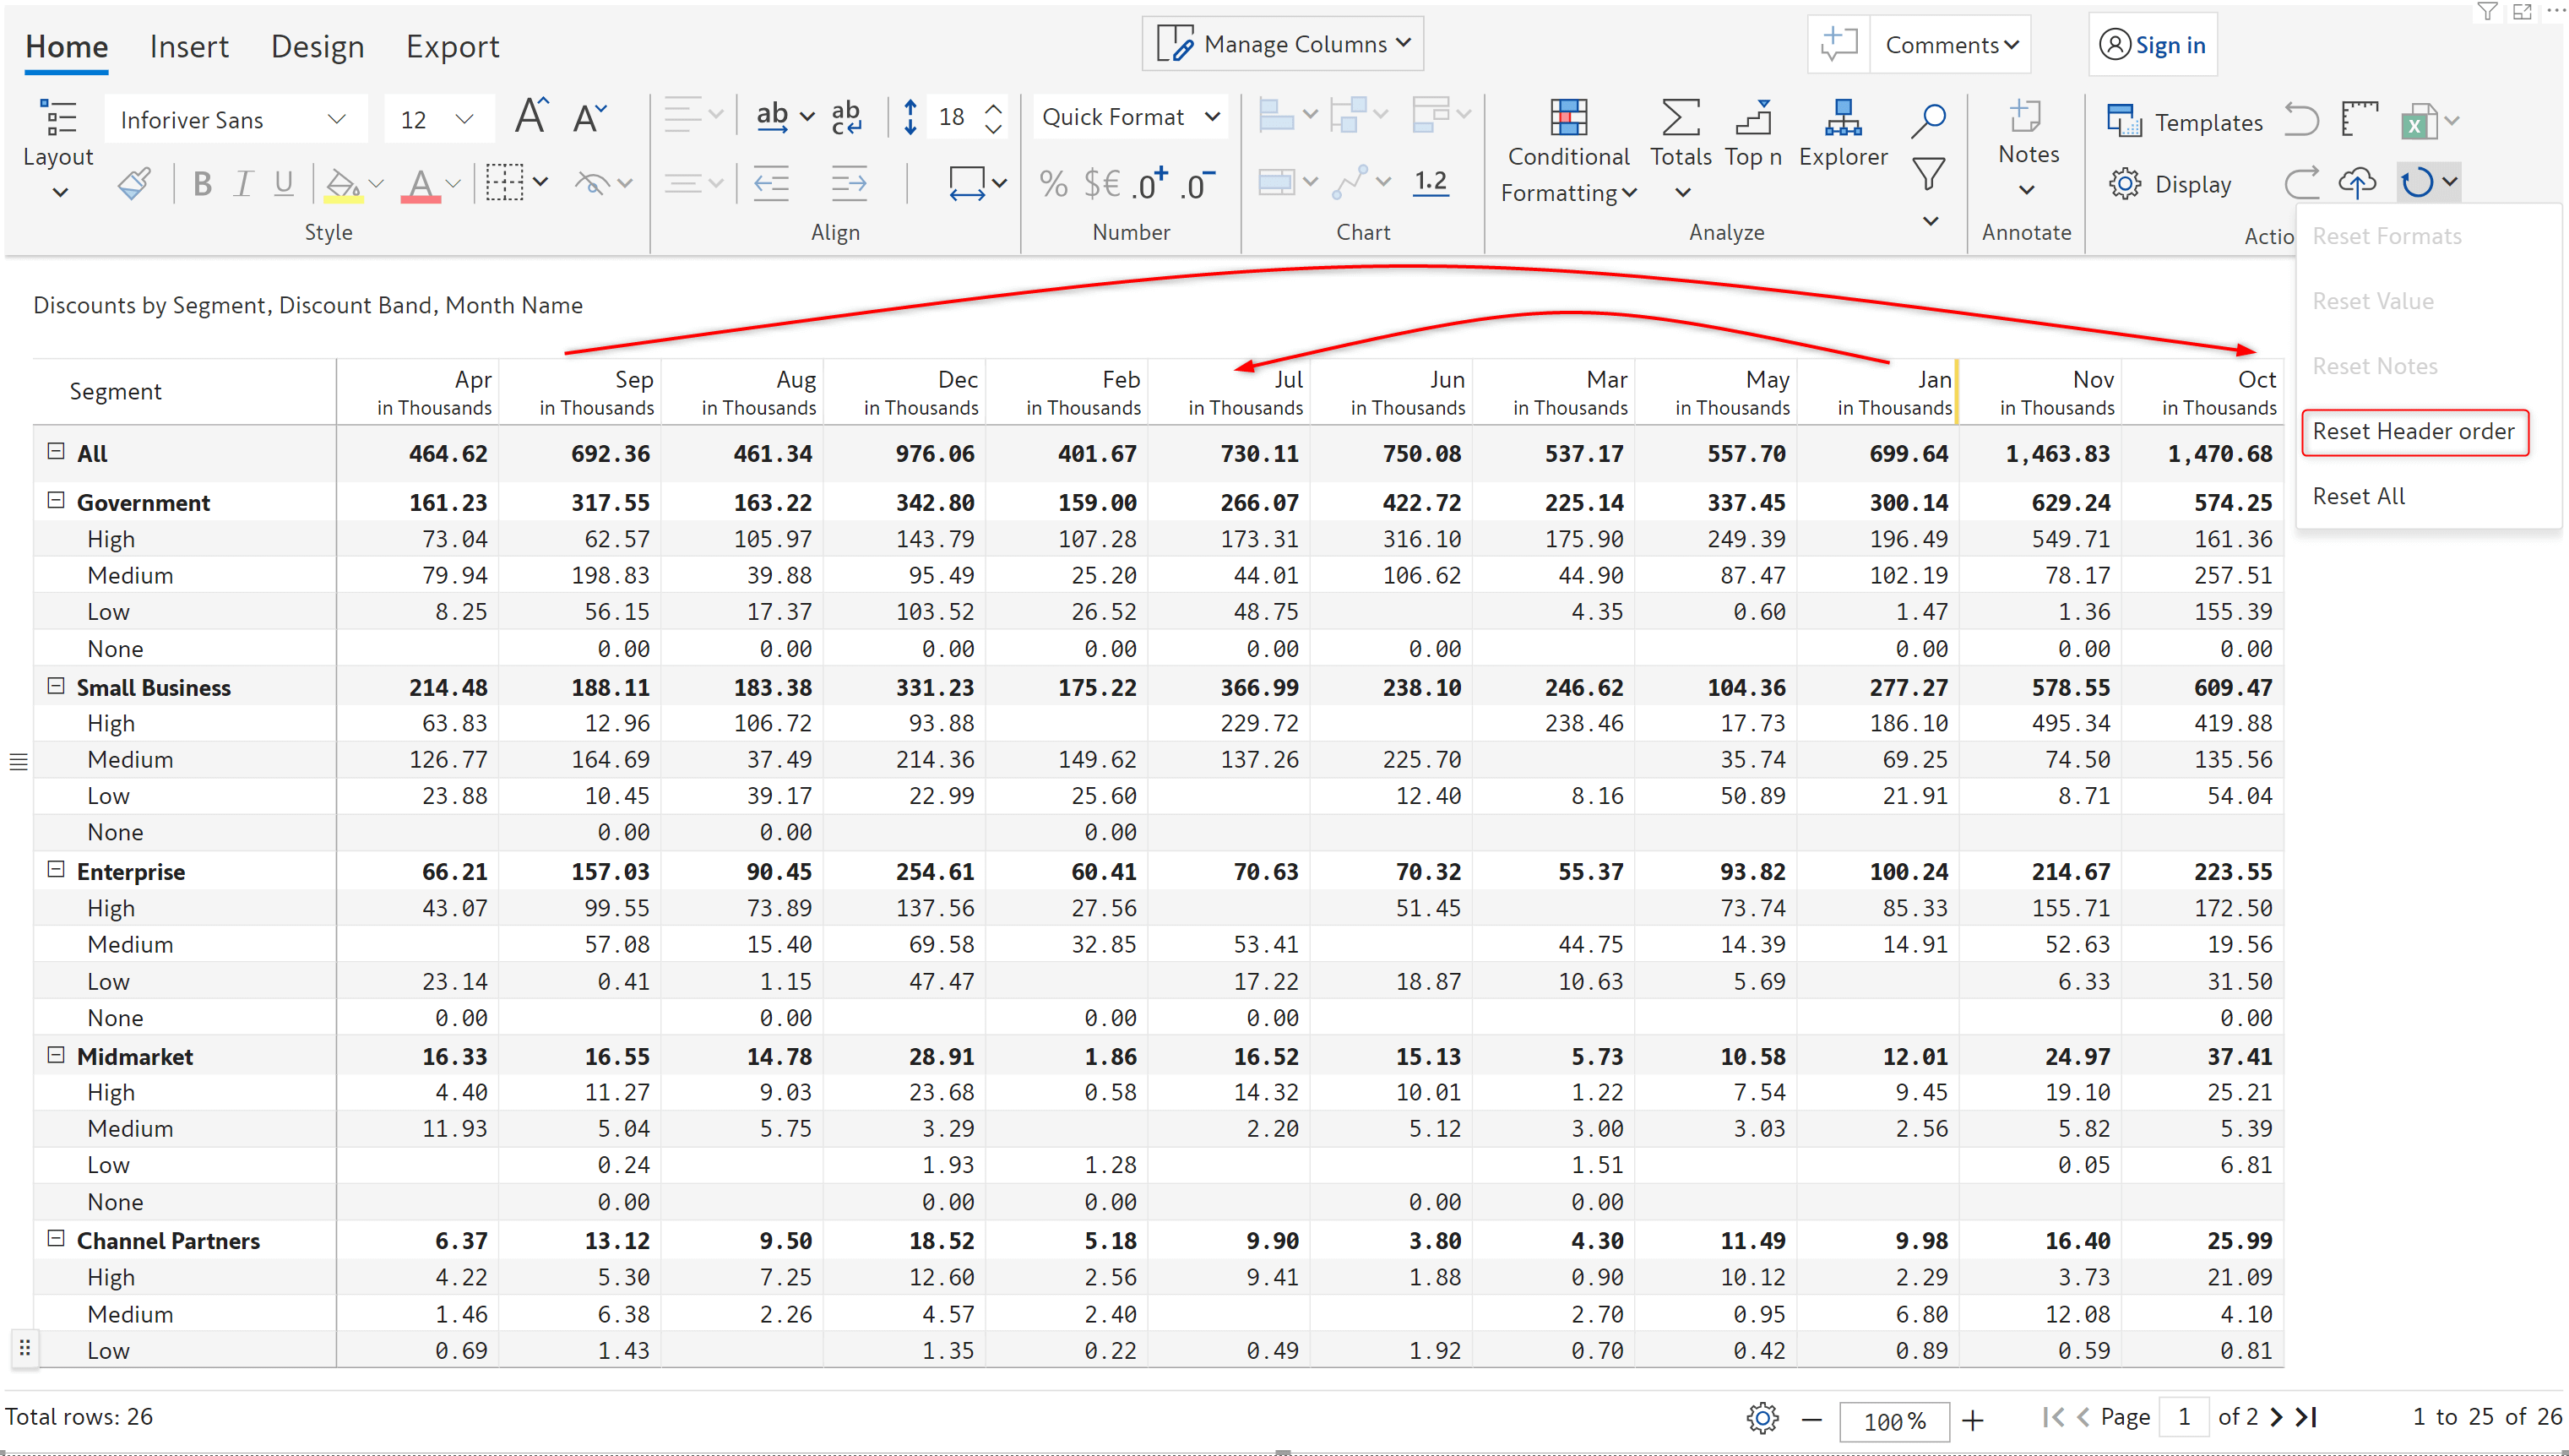
Your dataset may contain date values that are not in Power BI standard format, in this case, Inforiver will order the fields alphabetically. If you have re-ordered the fields for analysis, you can easily revert to the original alphabetical sequence using the ‘Reset Header order’ option.
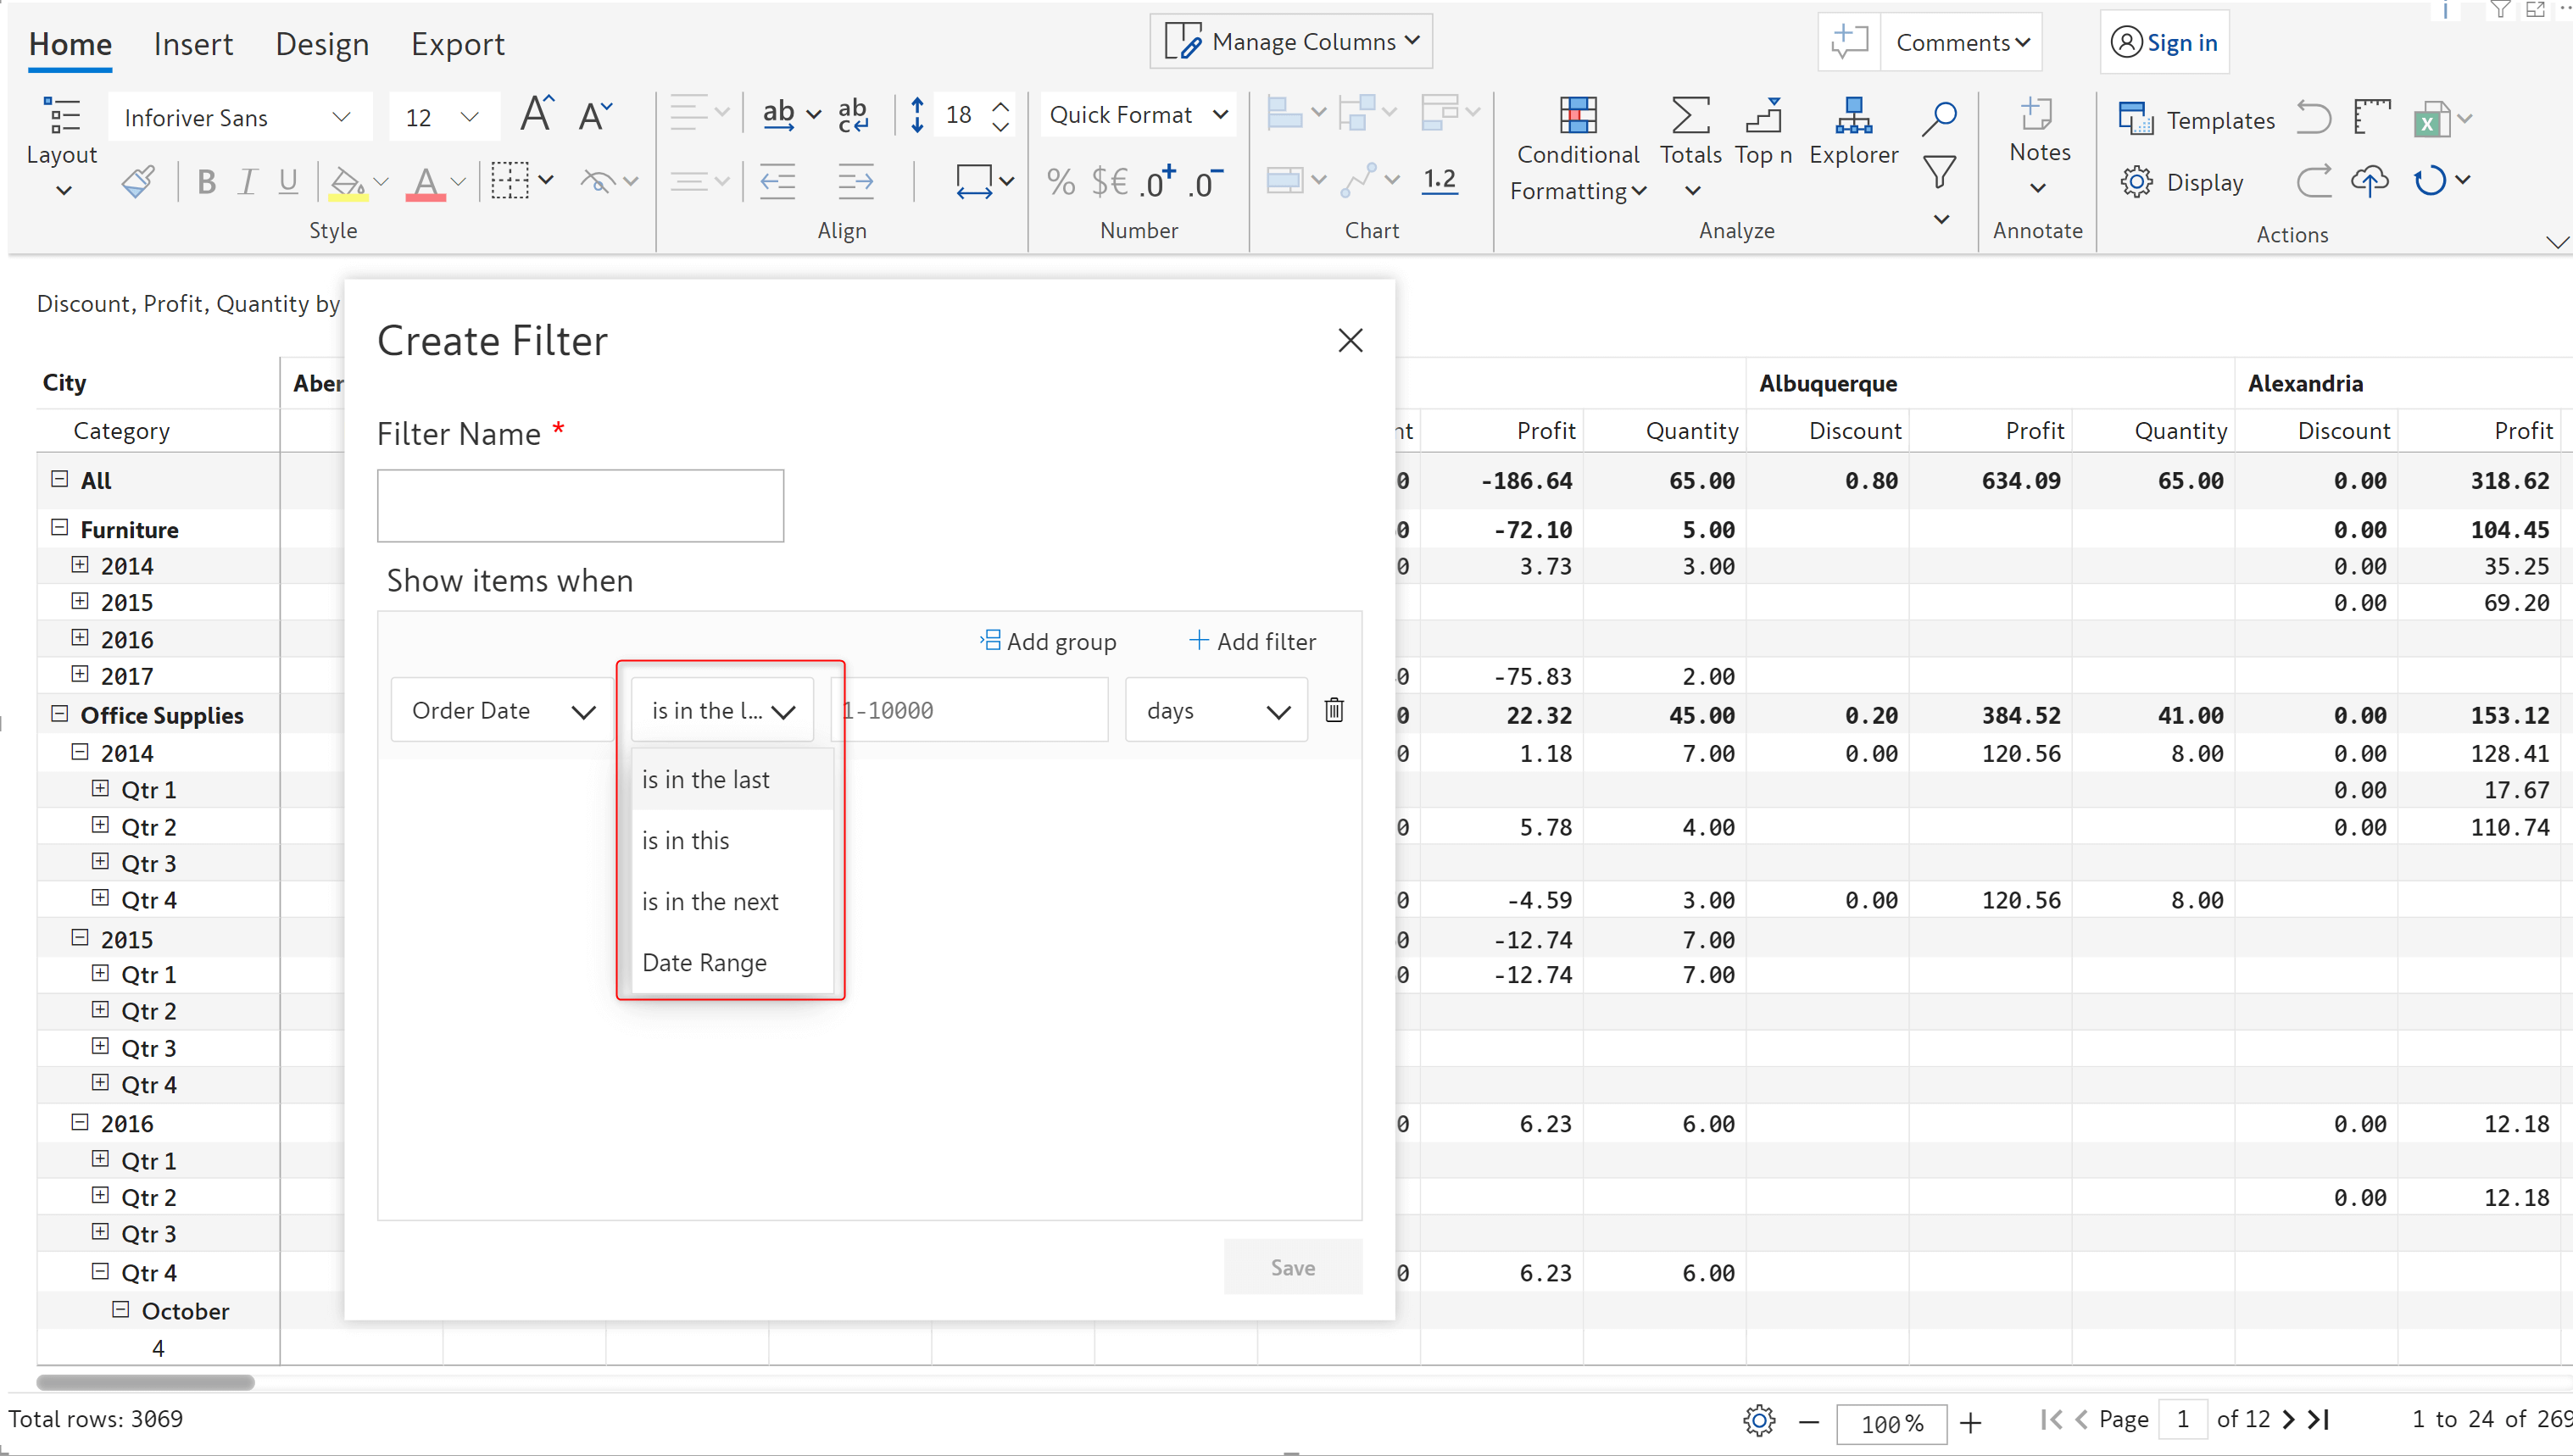
You can now create various comprehensive filters on fields which contain hierarchical date values.
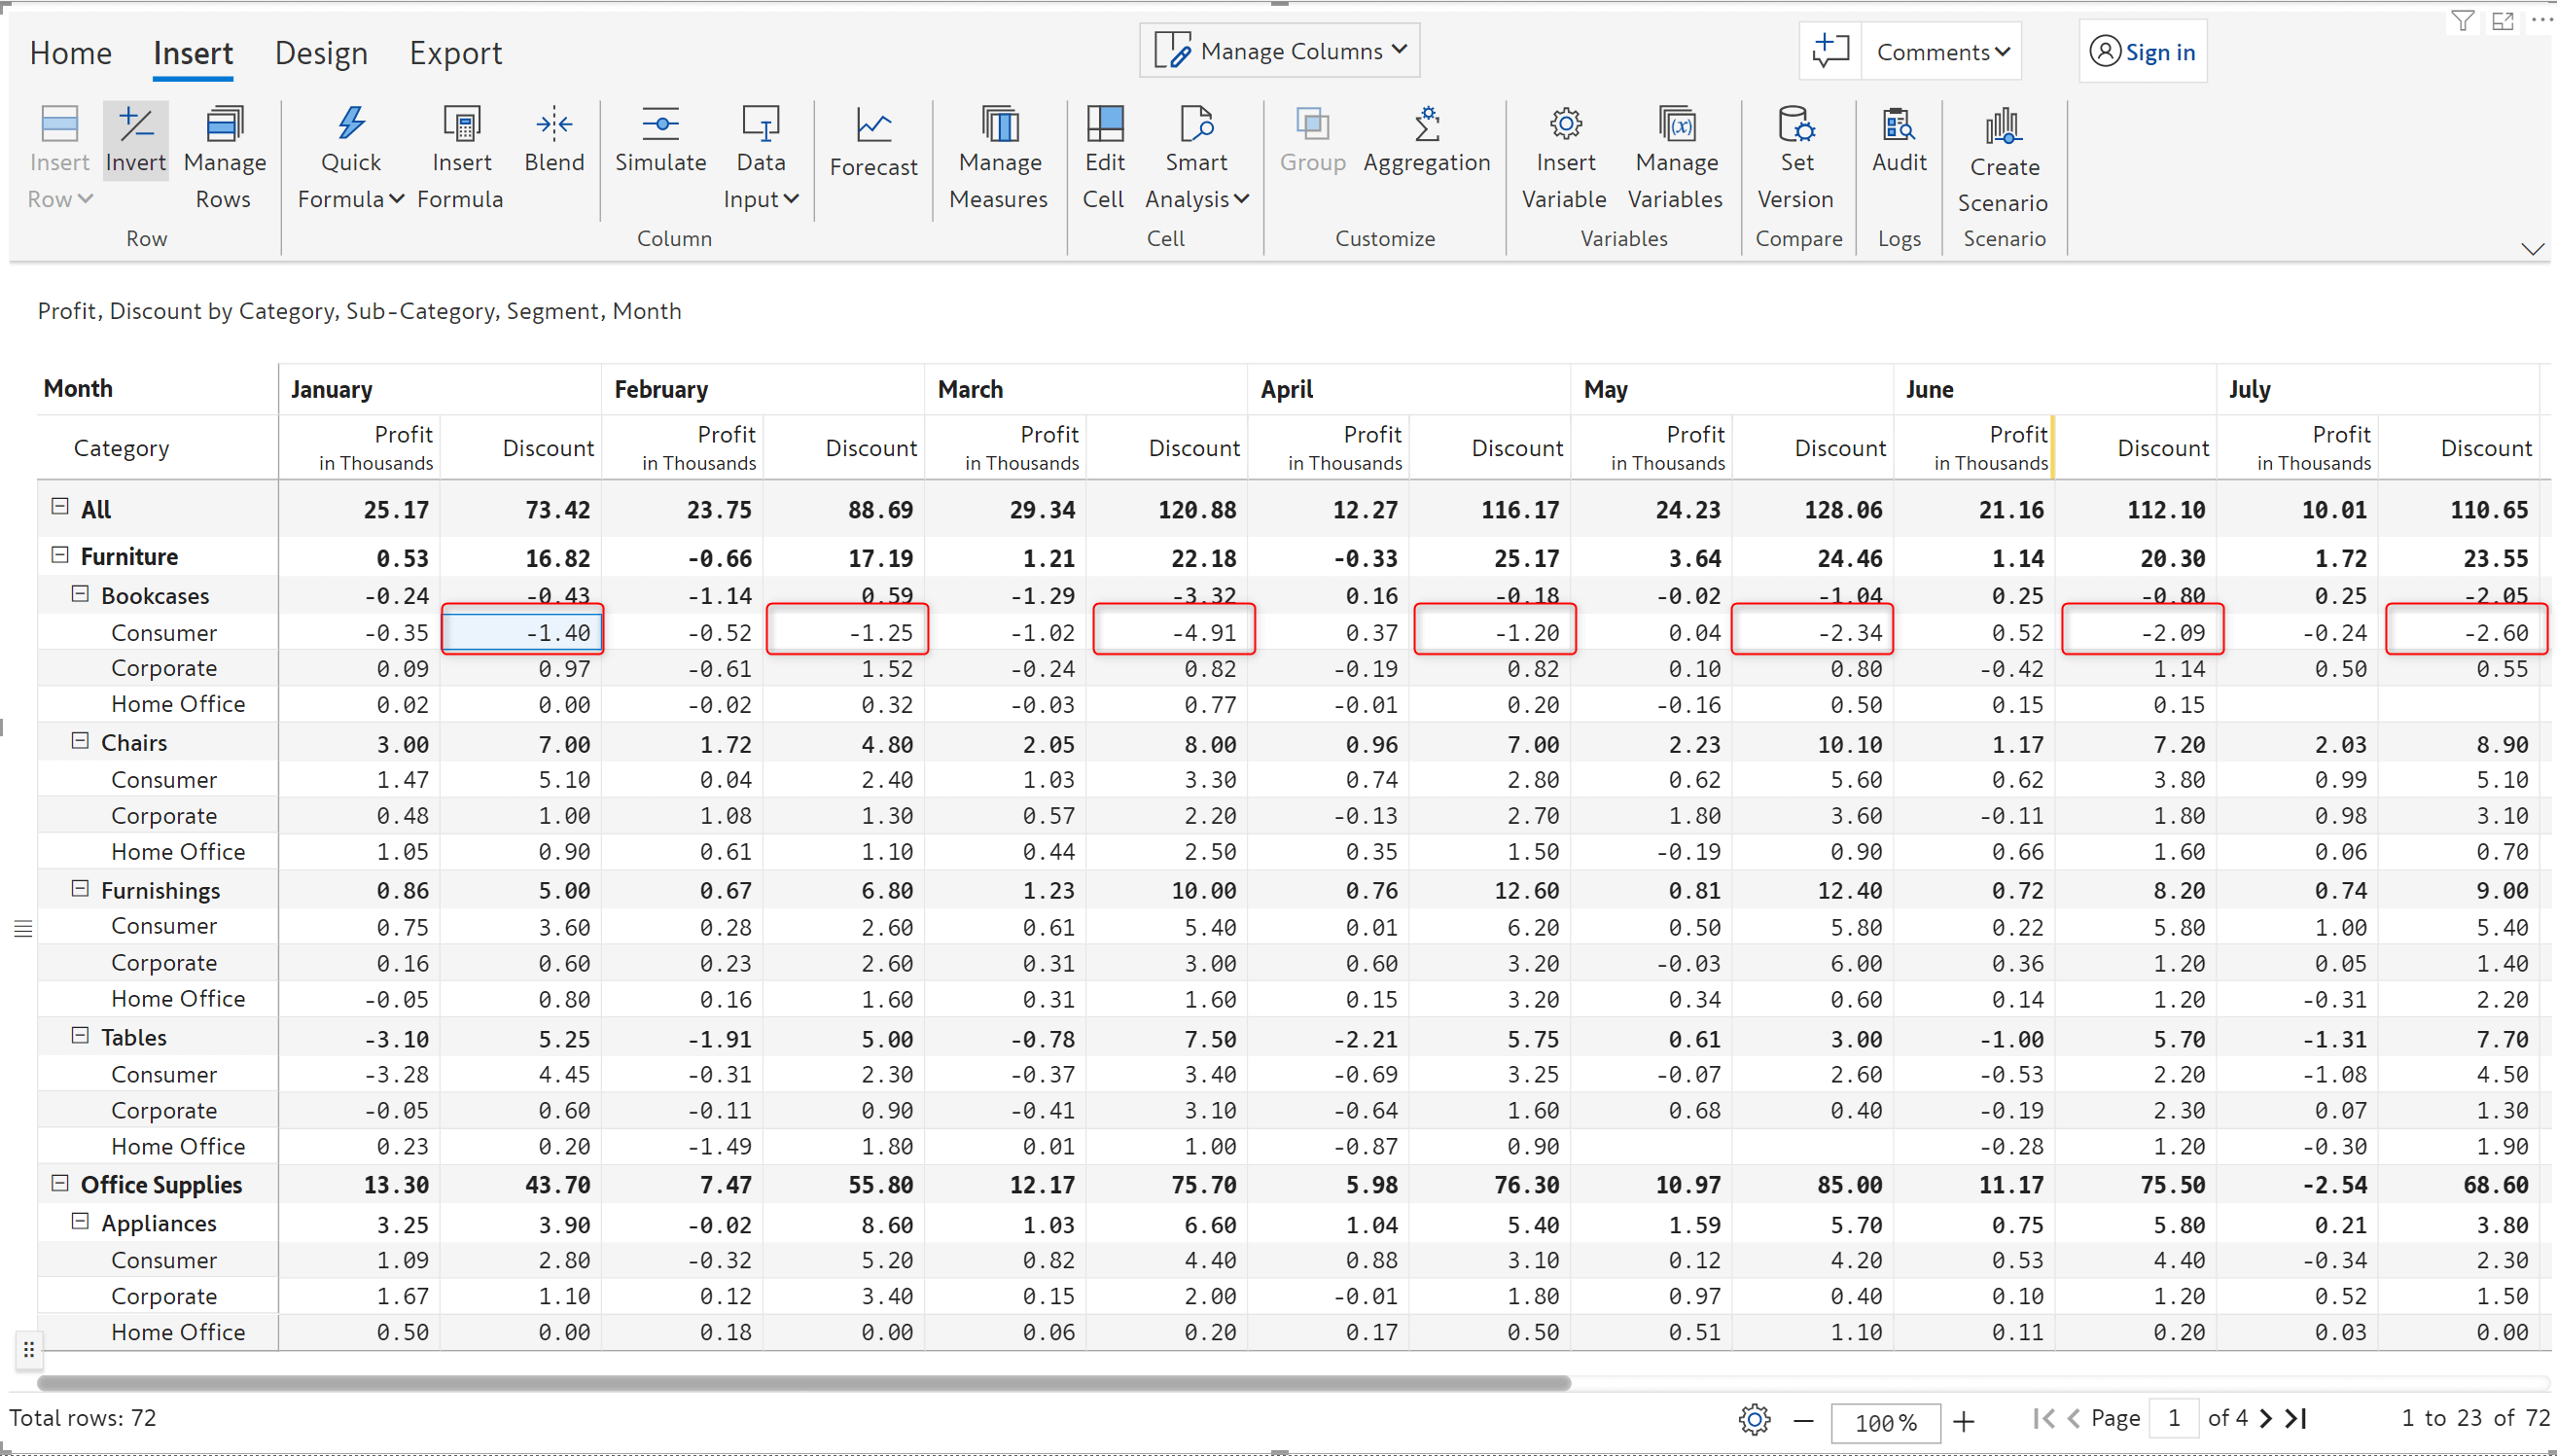
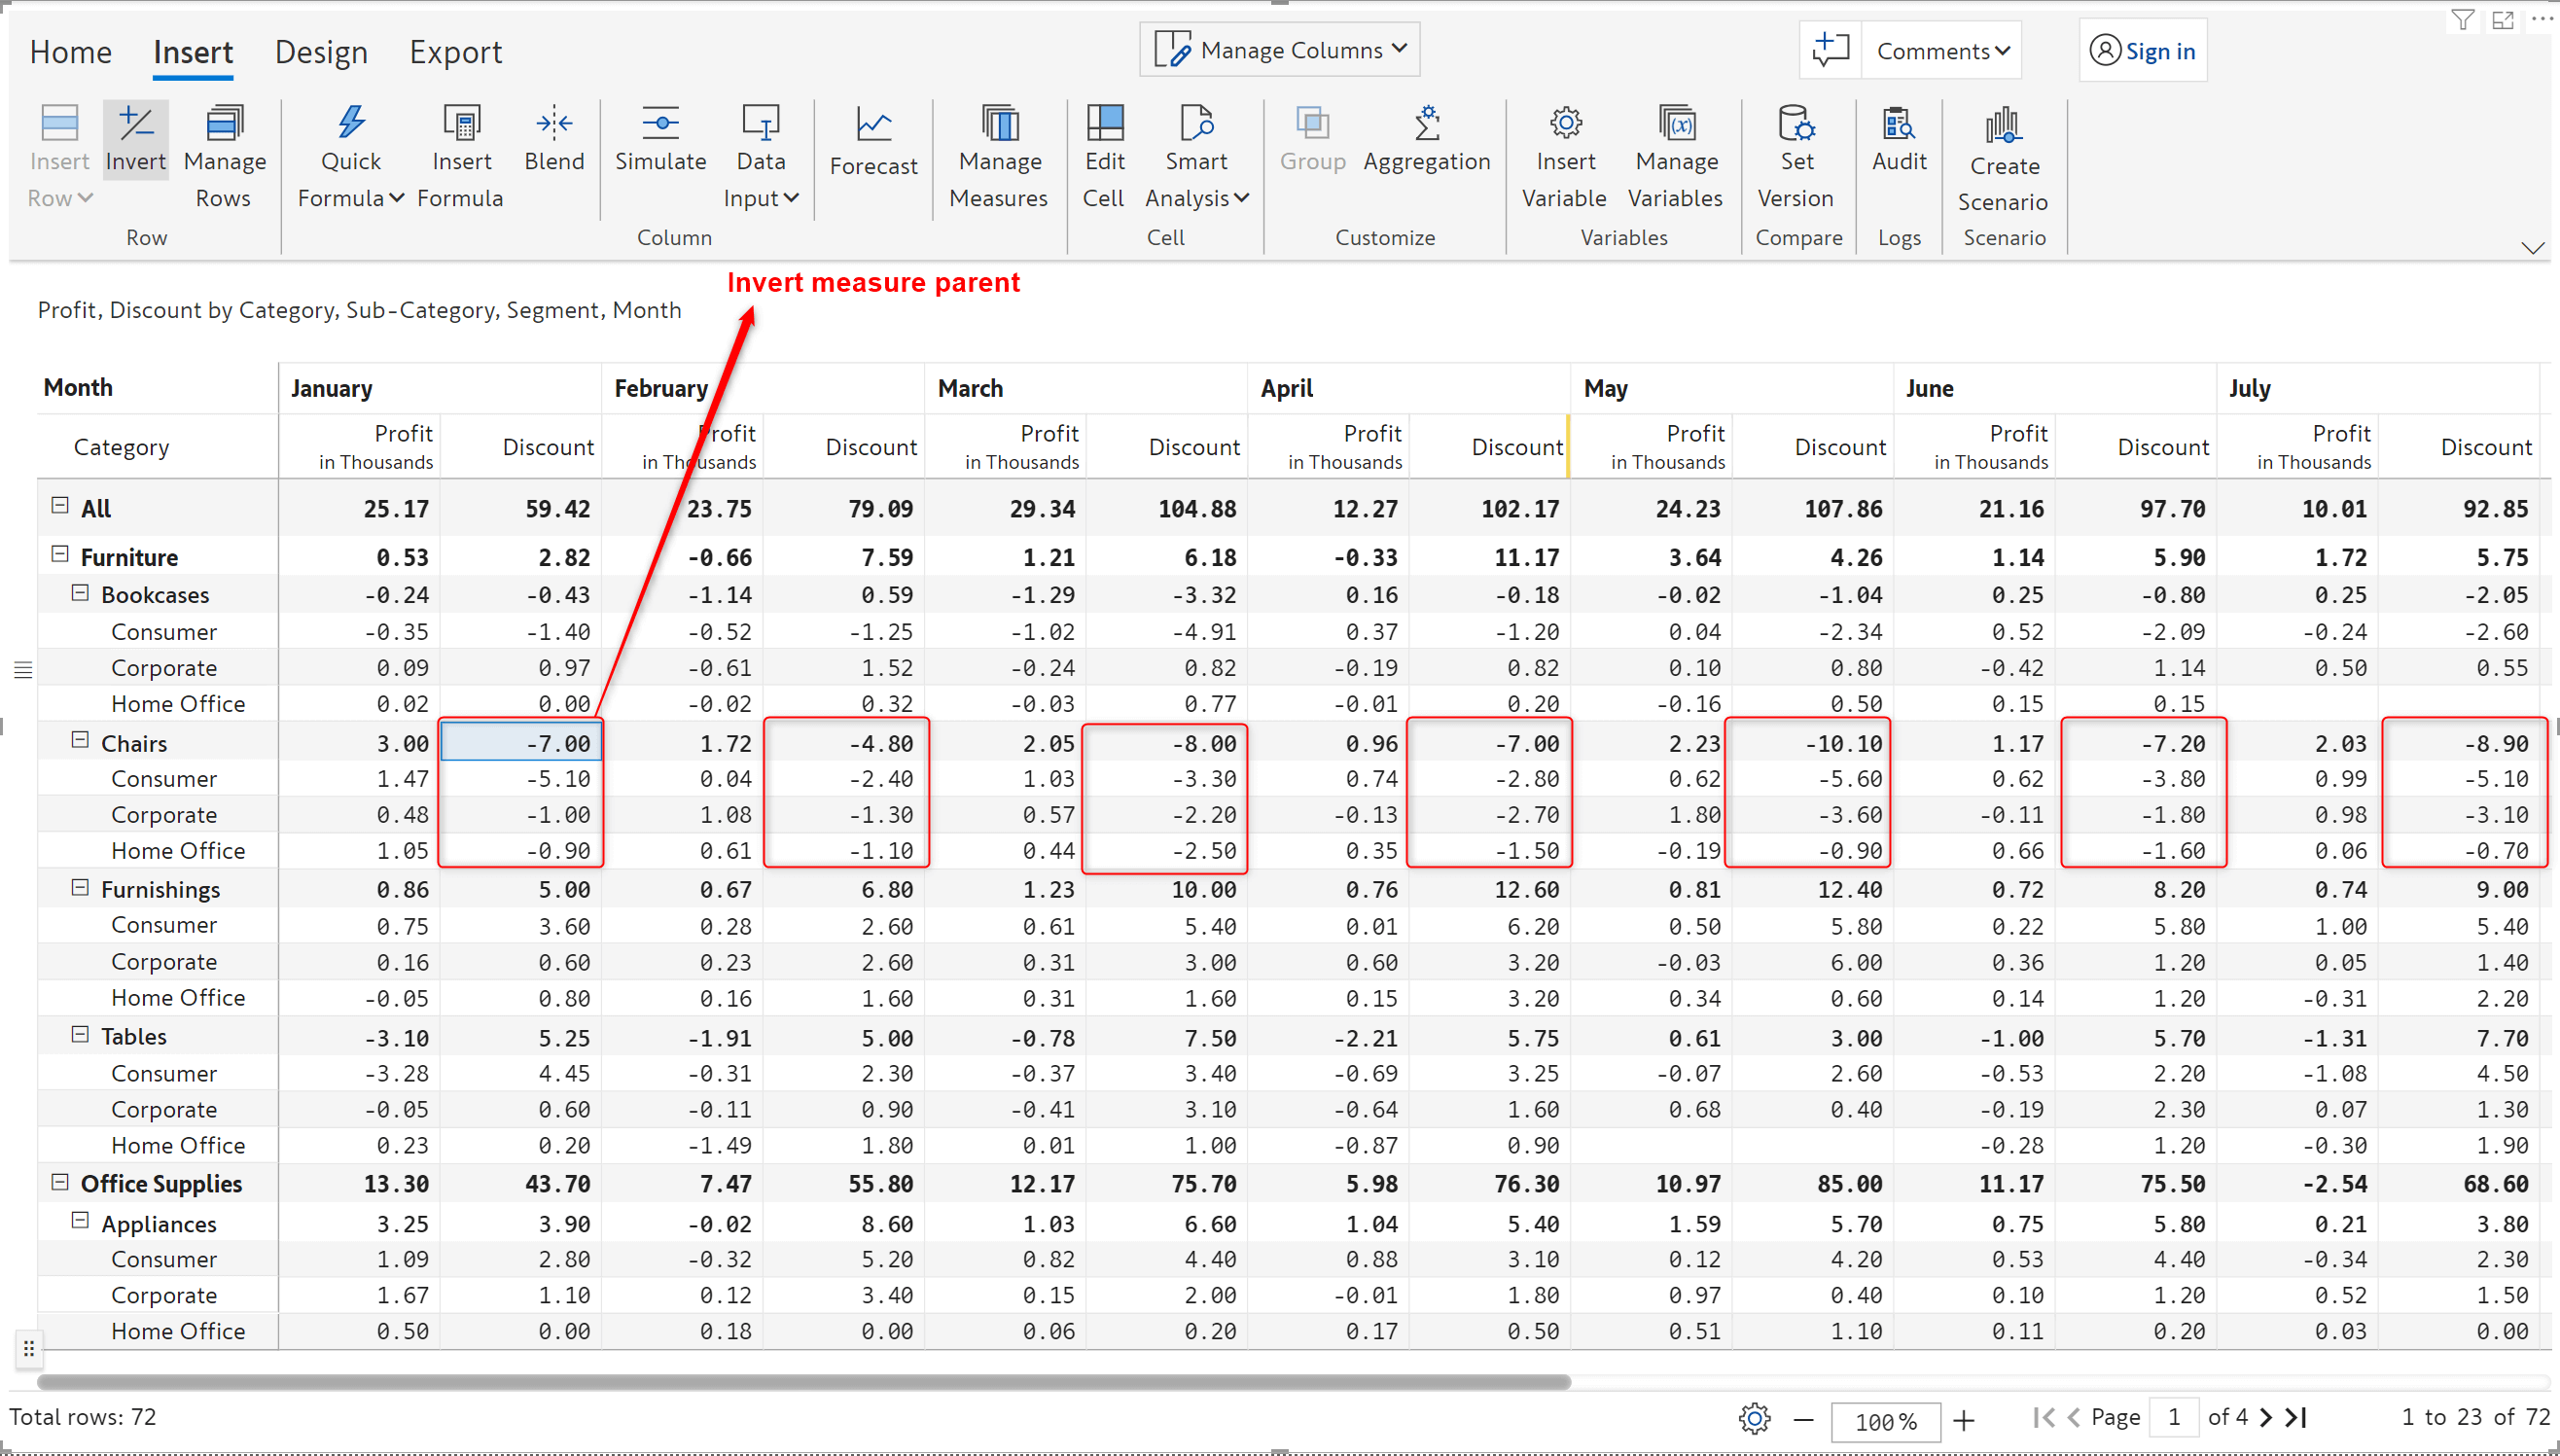
Inforiver now allows you to change the sign for a single measure at both child and parent level. For a given row, select any cell and click on the ‘Invert’ button.
Notice how the sign for the Discount measure has been flipped in the example below.
When hierarchical data is involved, you can also change the sign for a particular measure at parent level, this will be cascaded to all the child rows.
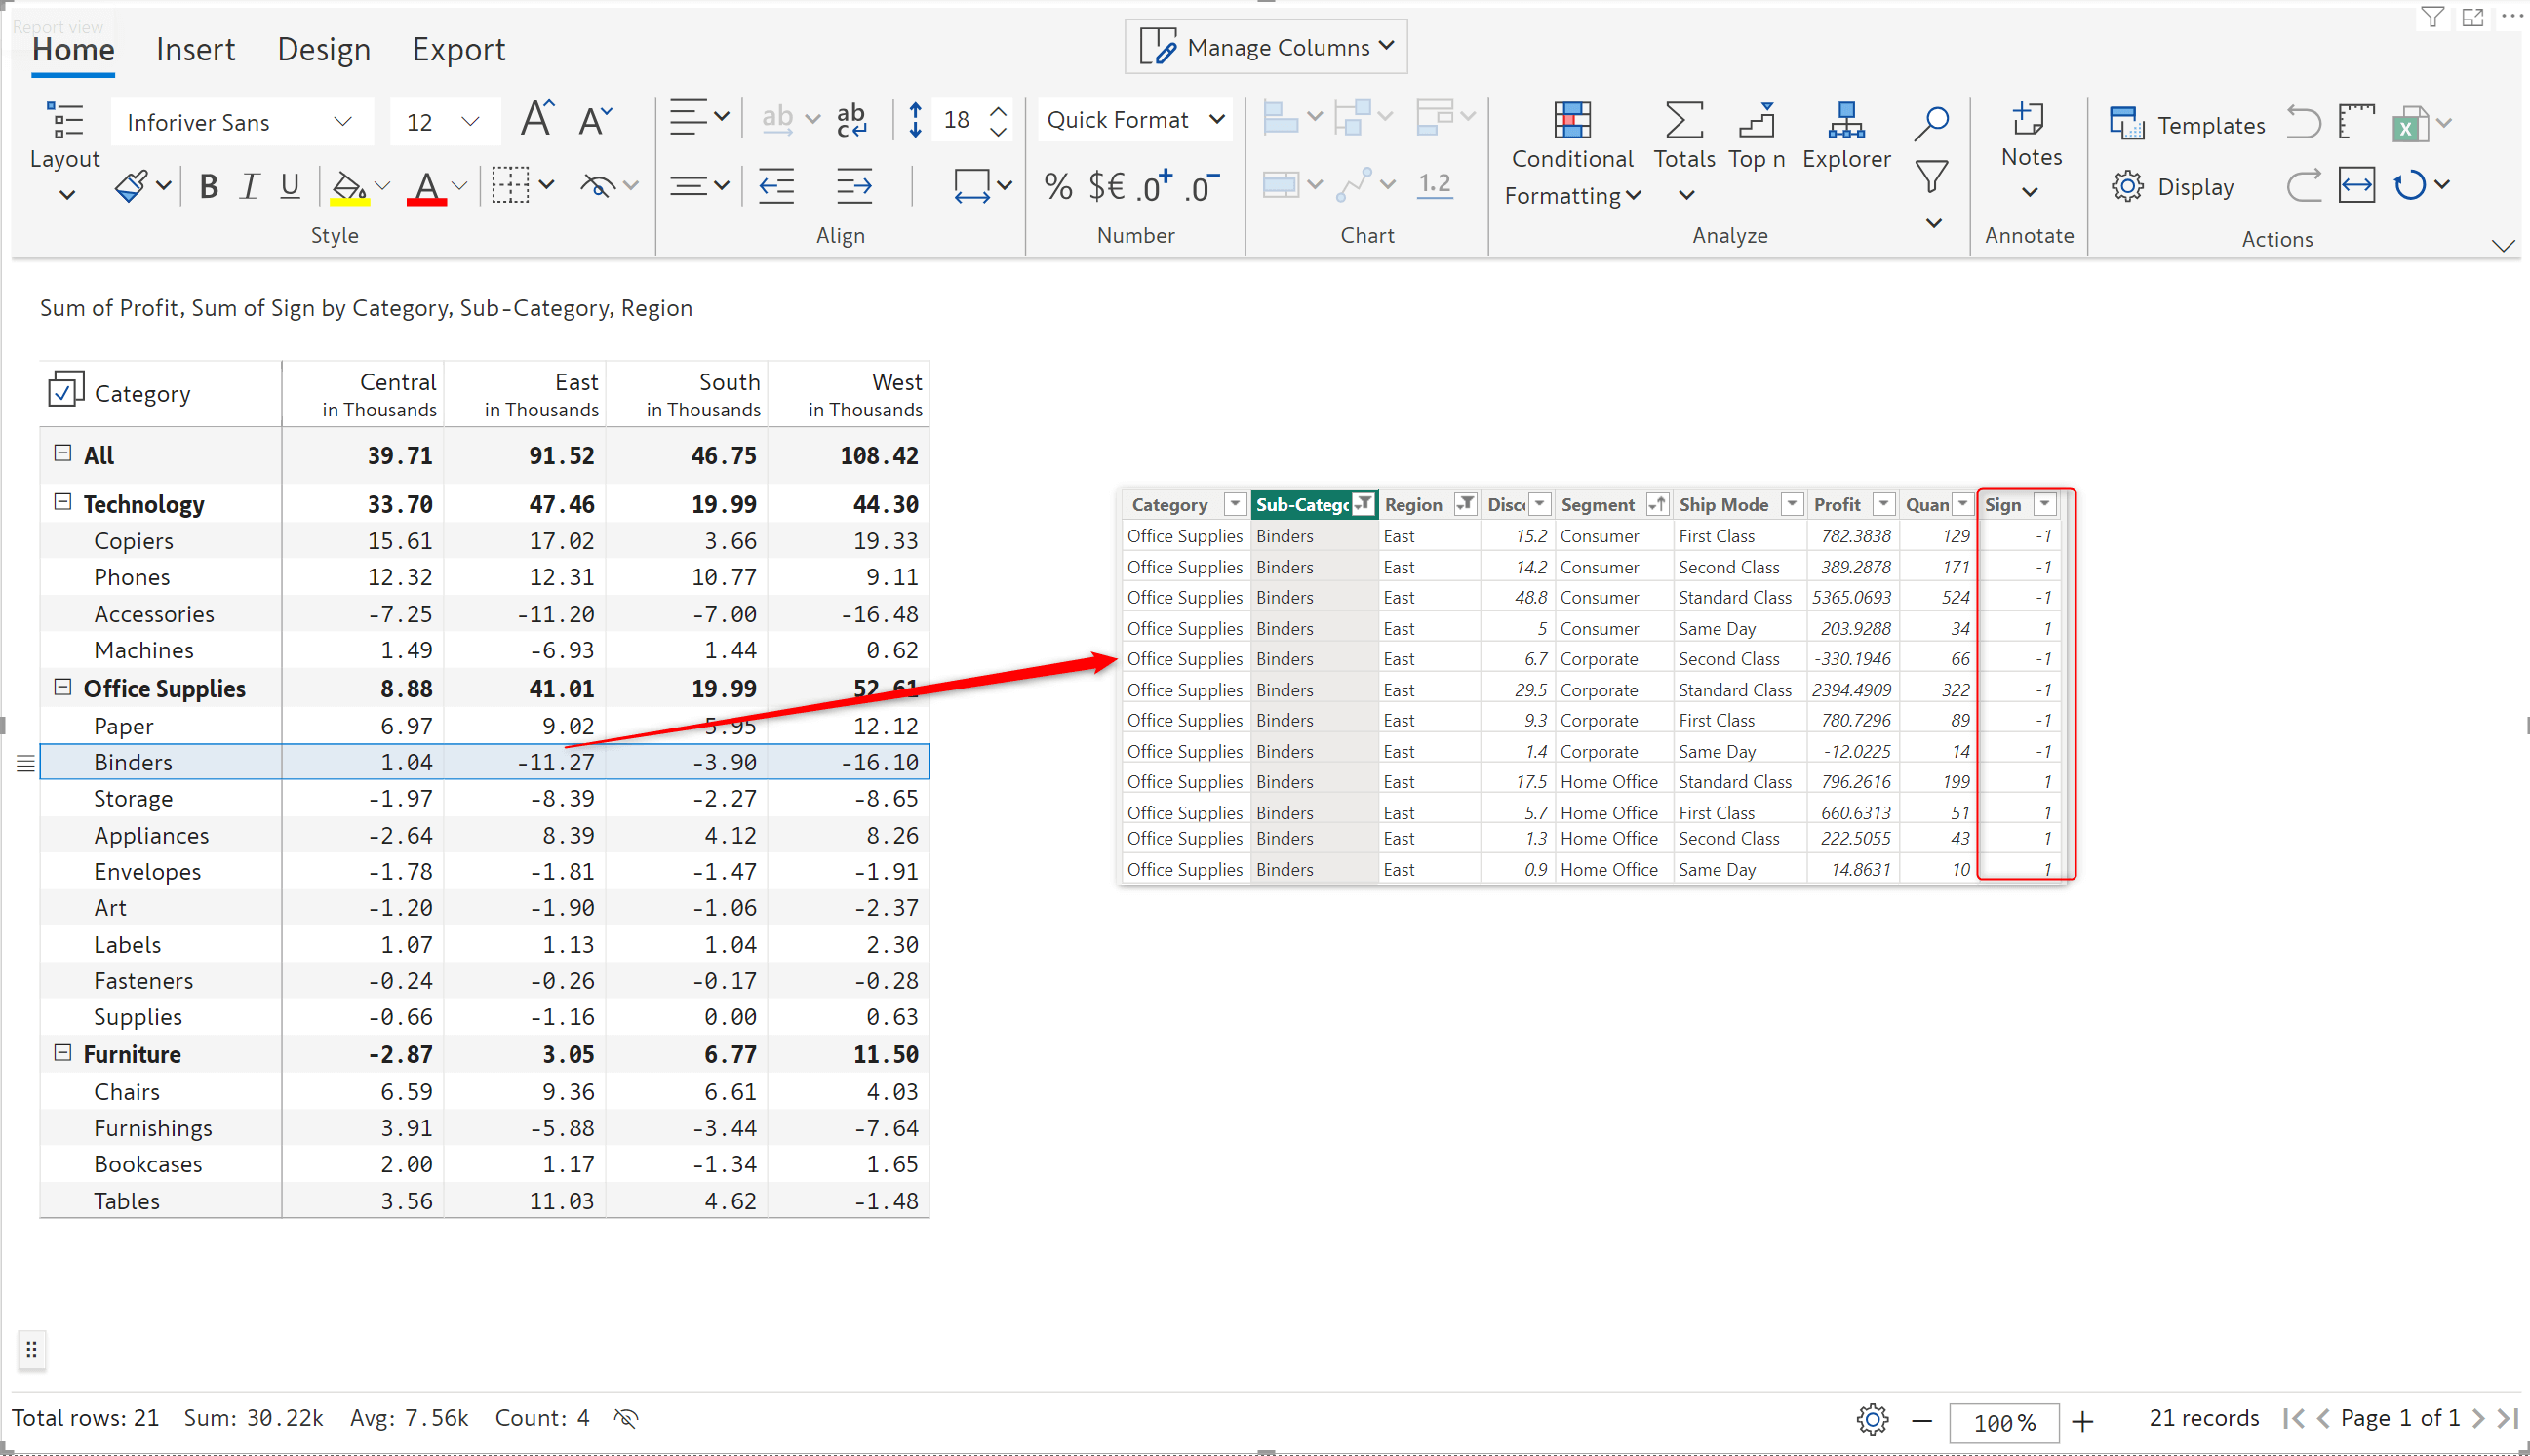
The sign measures in your datasets can now be applied to all the measures used in a report.
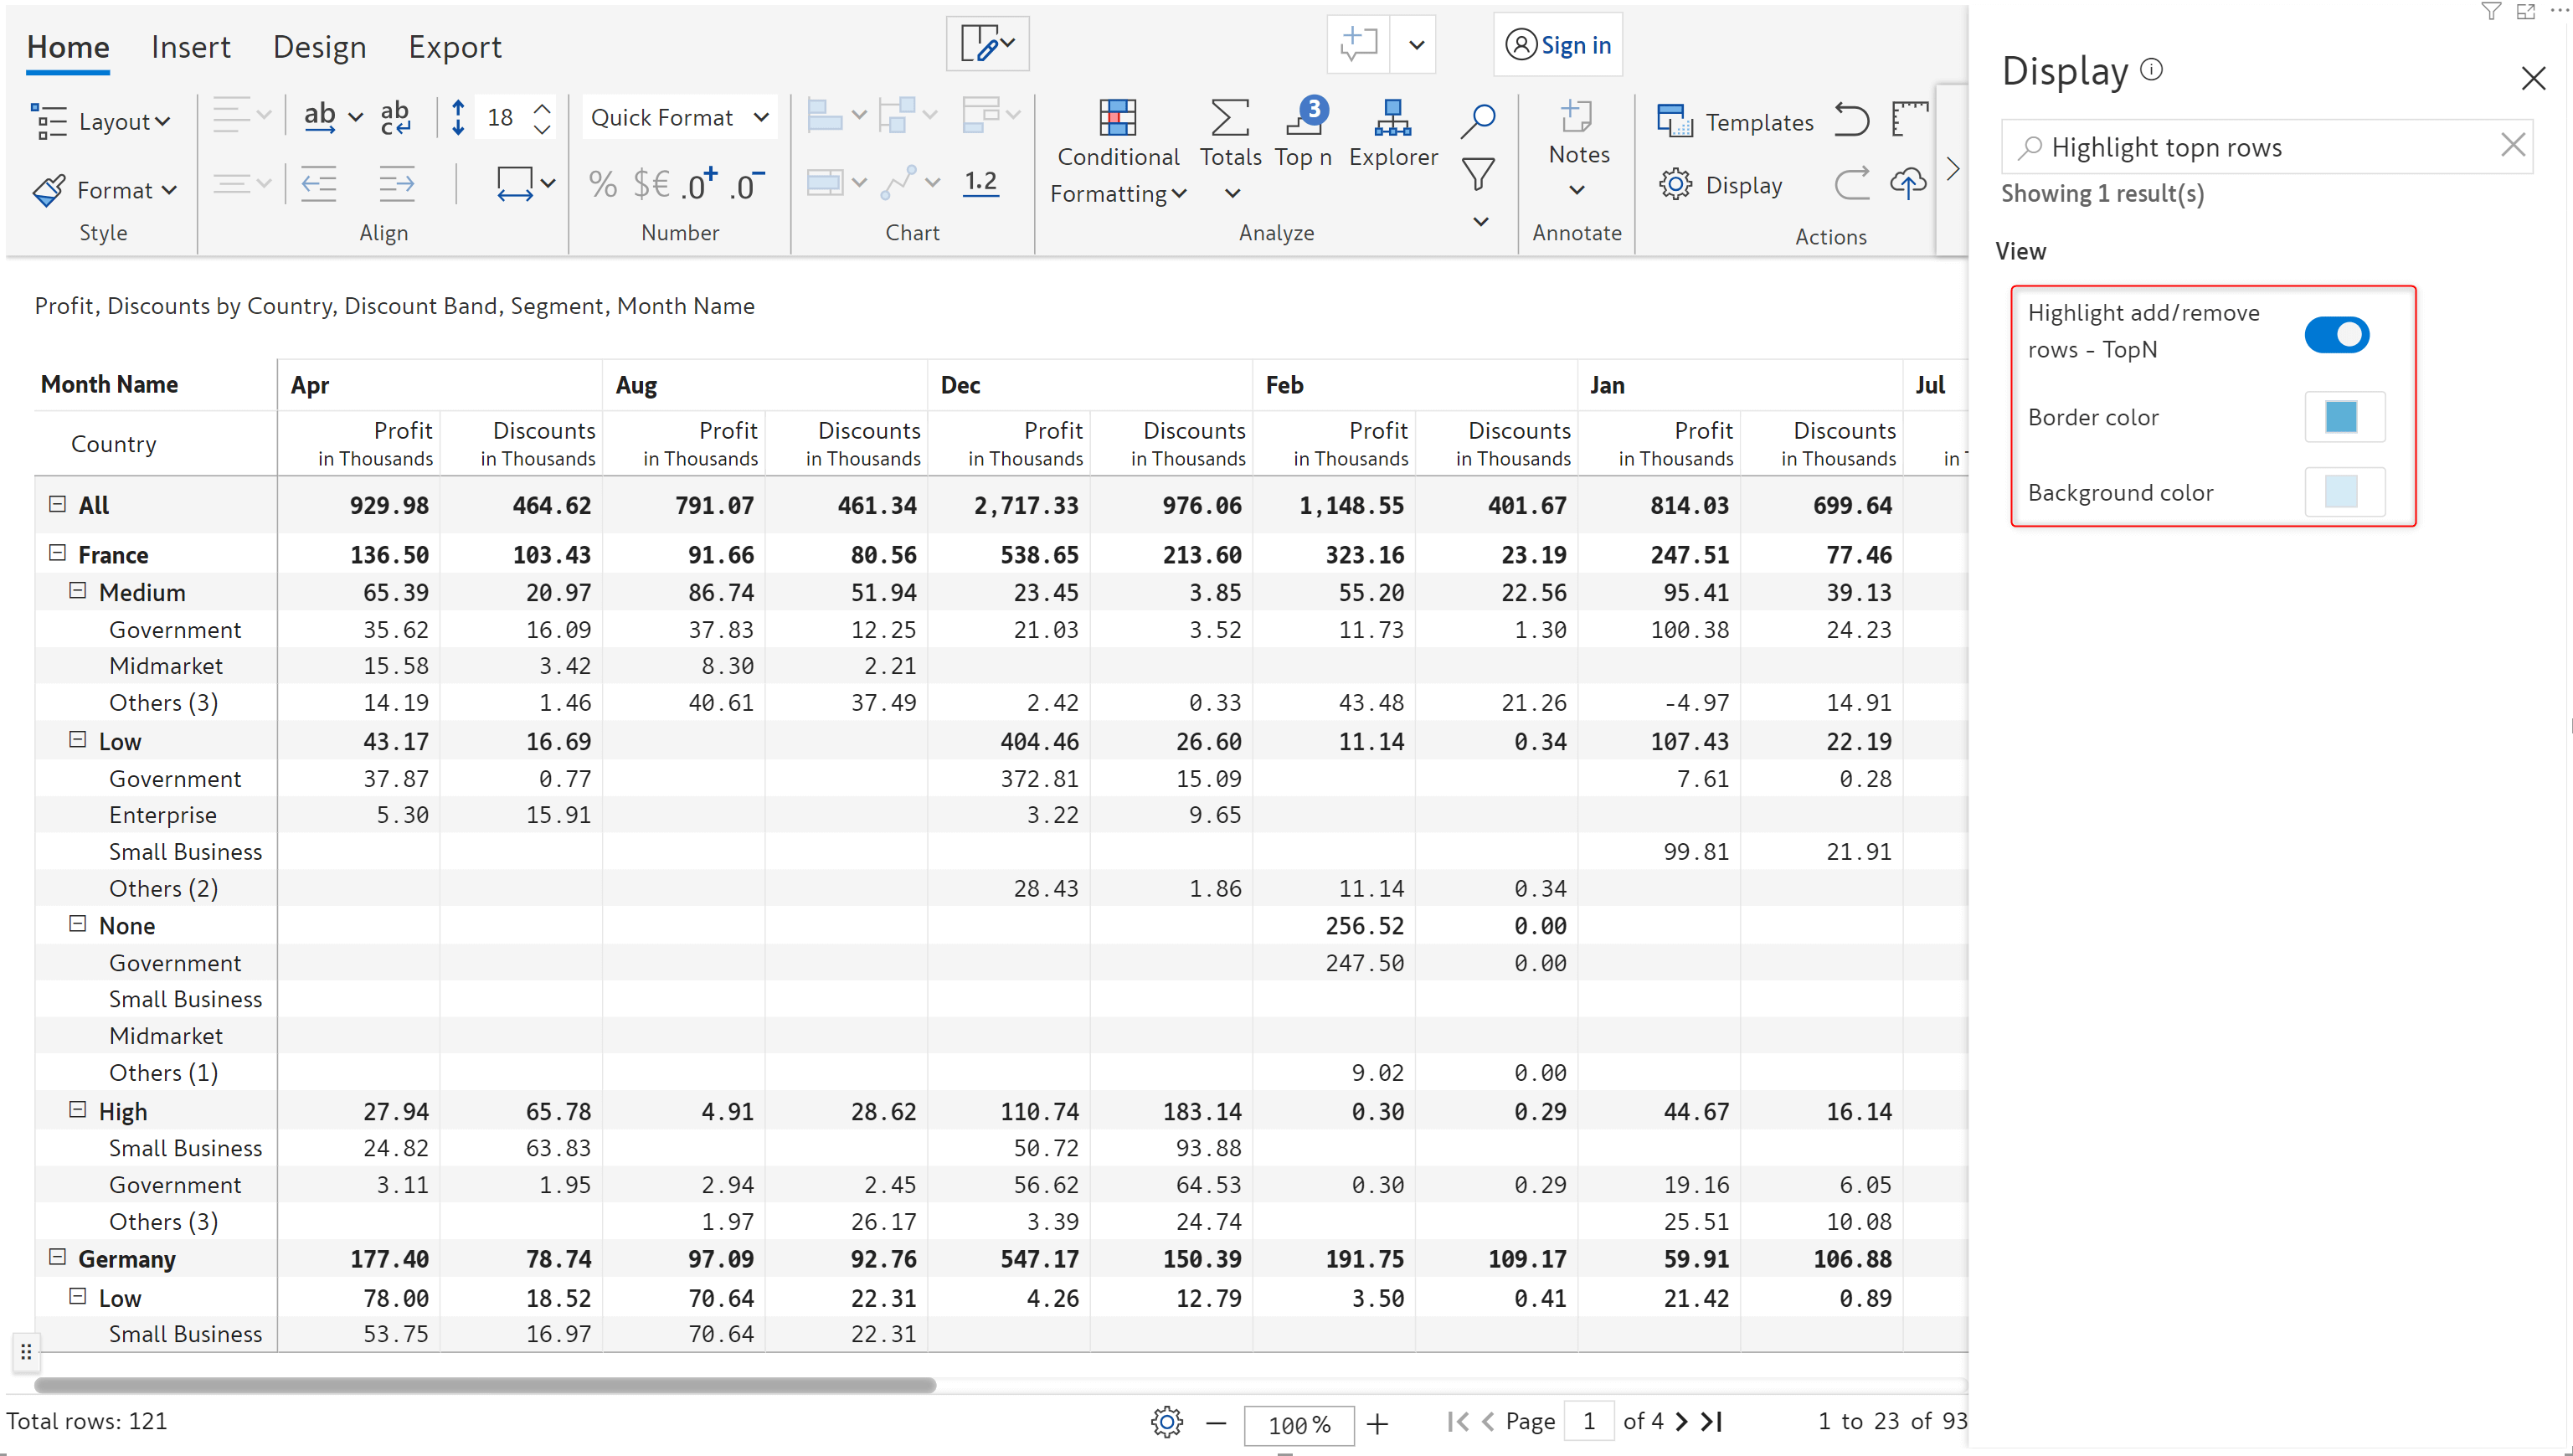
The ‘Others’ option for Top N items has been enhanced to cater to hierarchies which contain the same element at different levels.
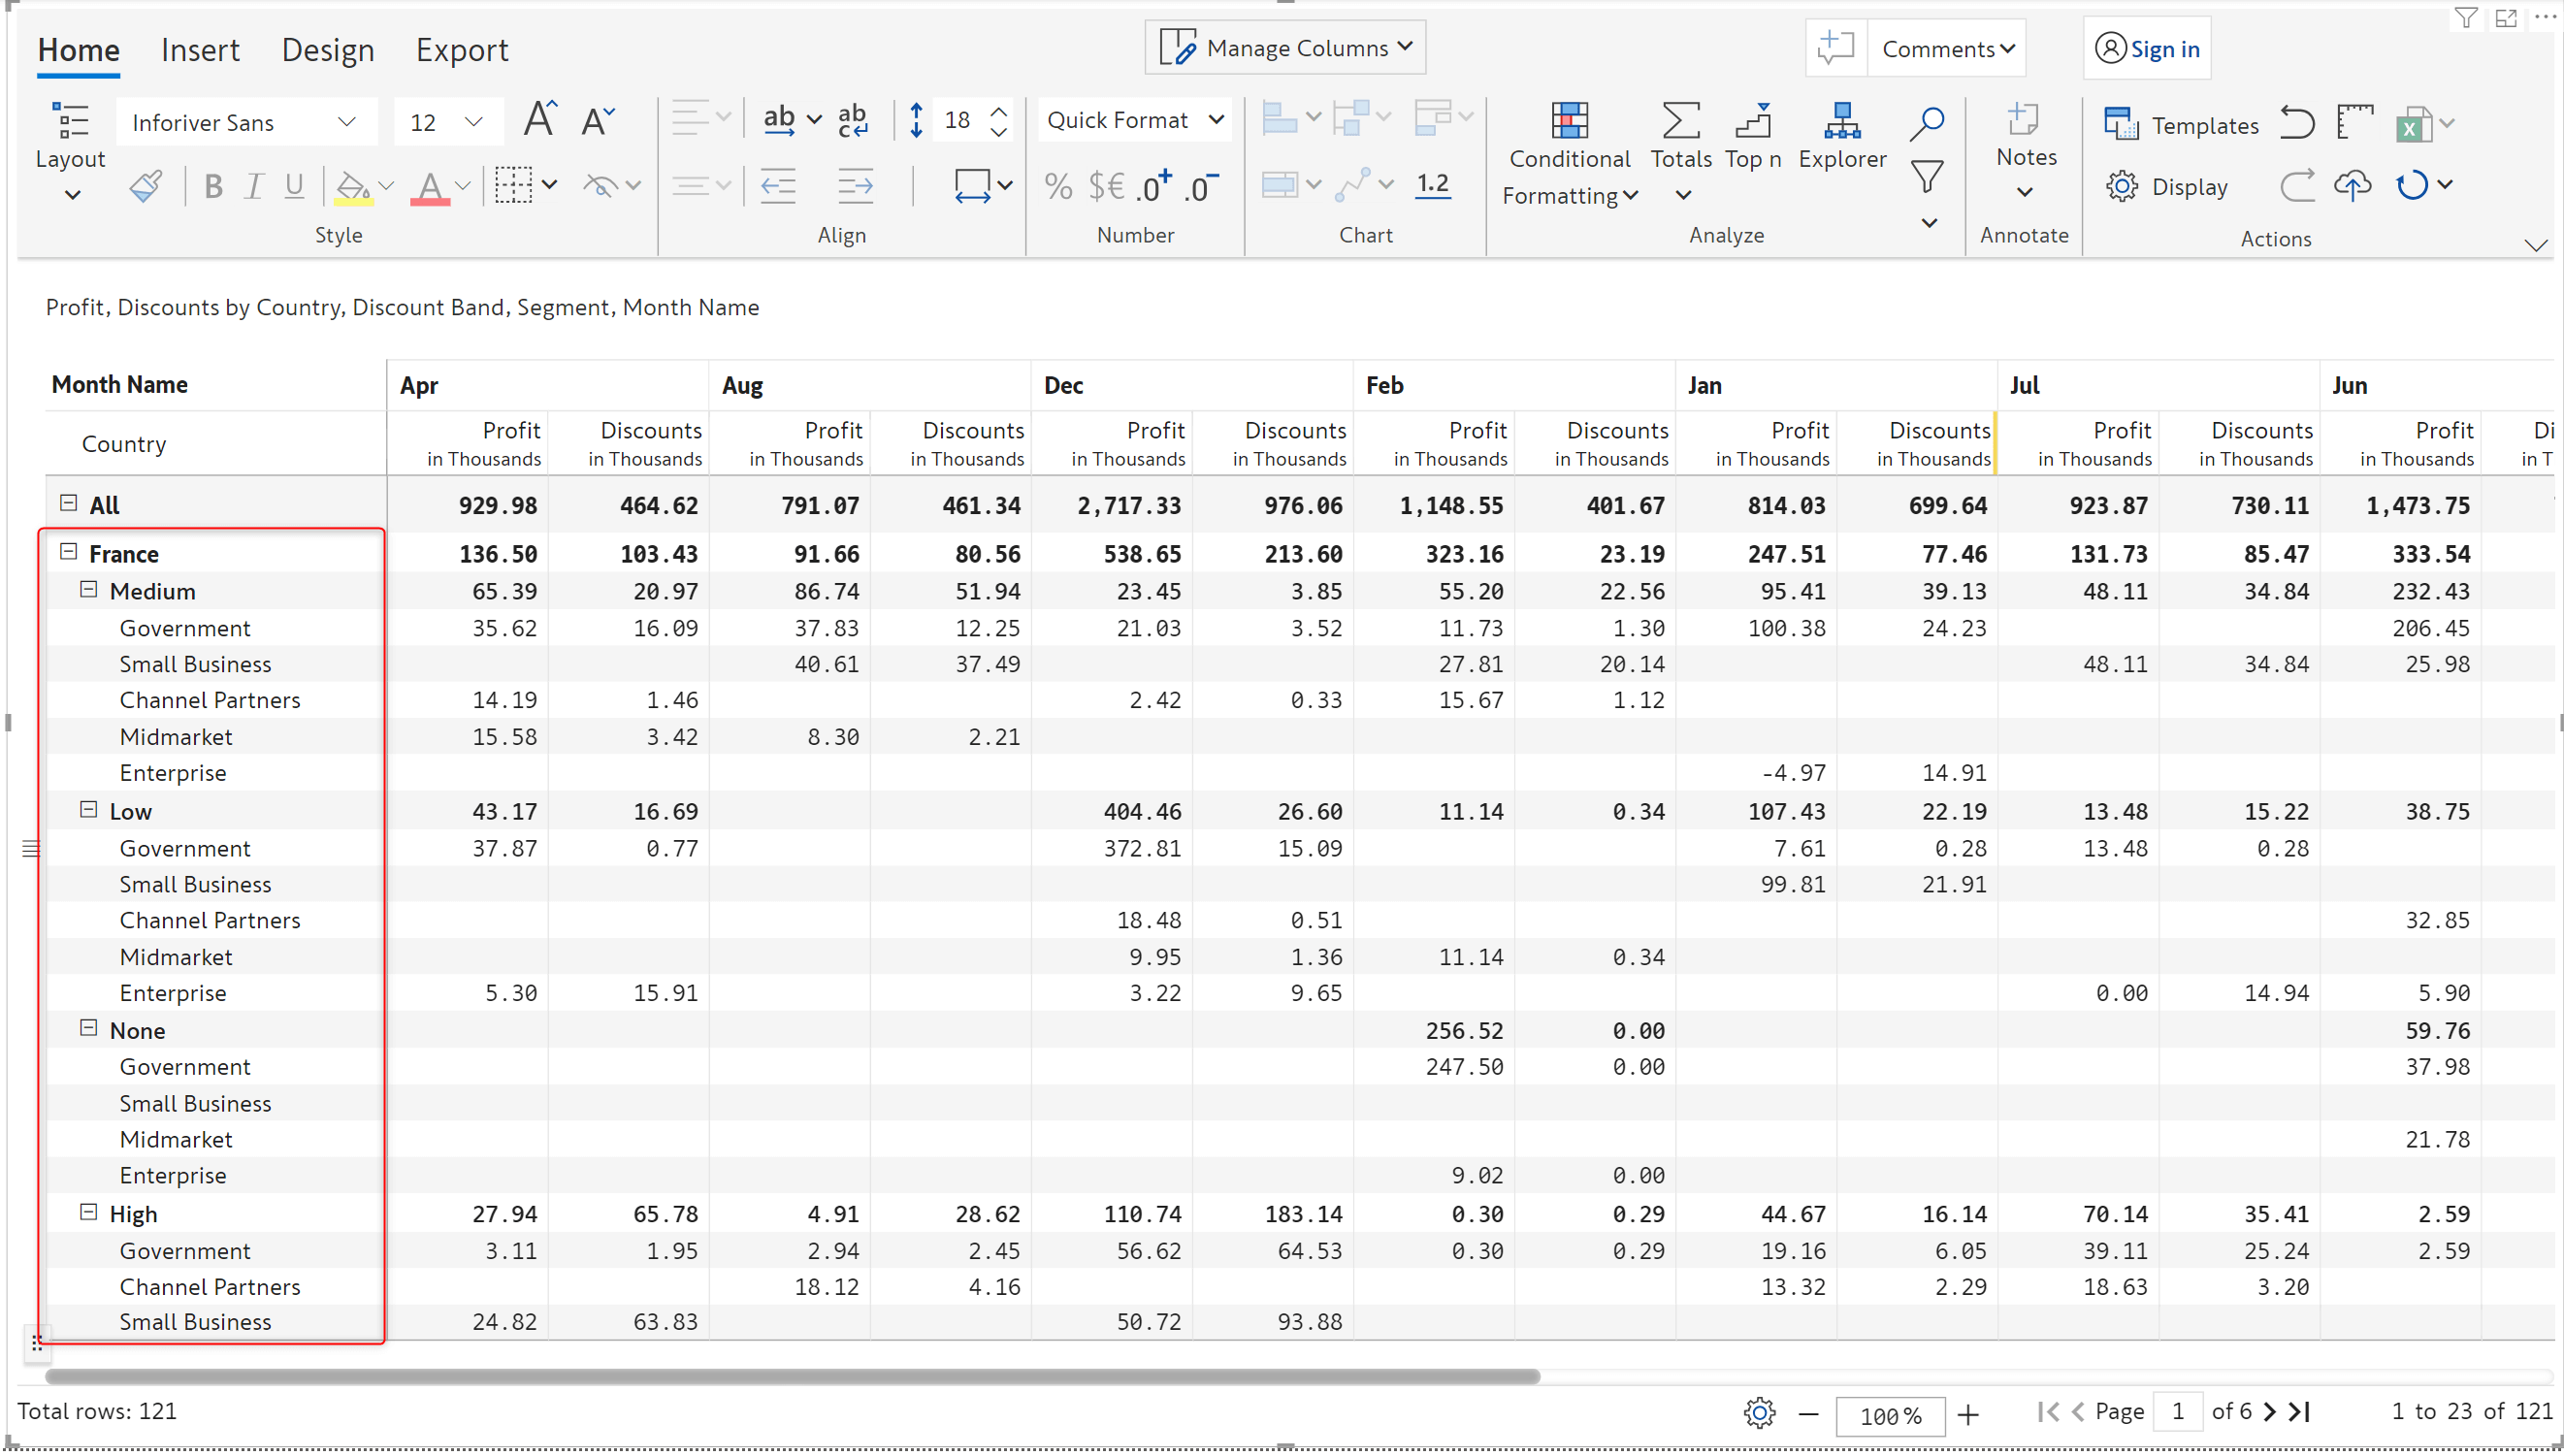
You can now choose to remove a particular element from its immediate parent or from all levels which contain that element. The same applies to adding an element to the Others bracket.
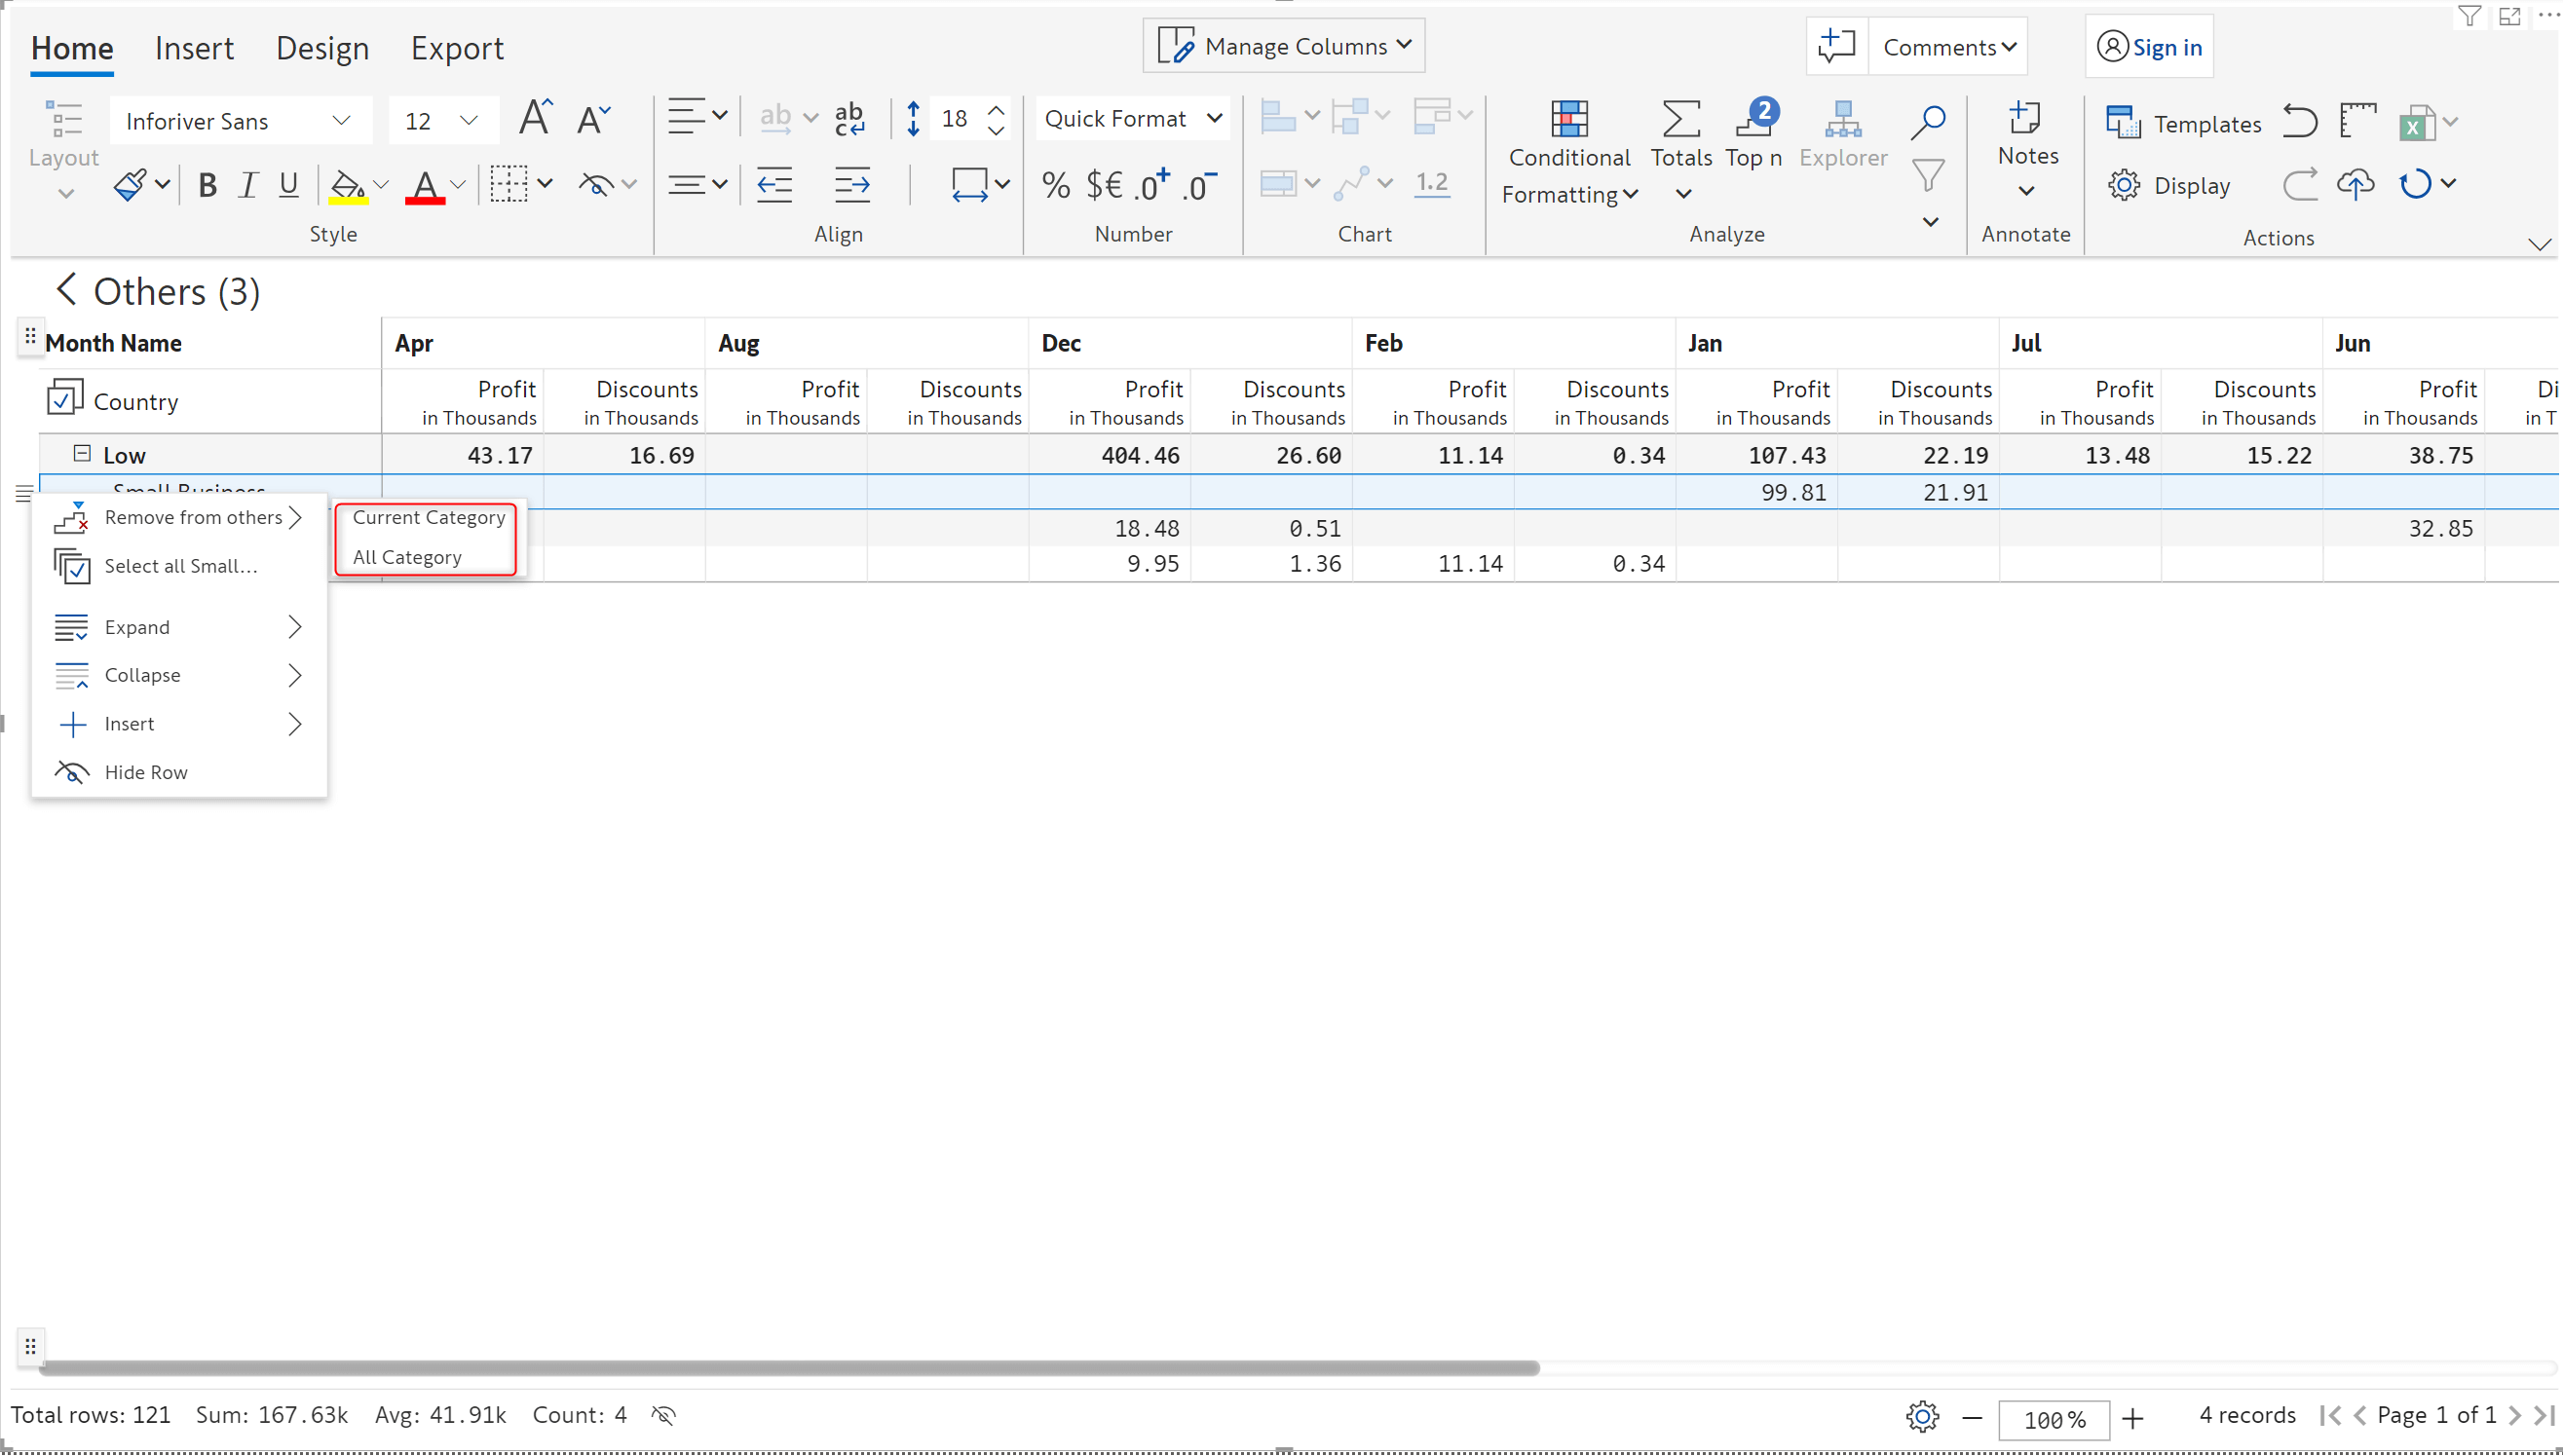
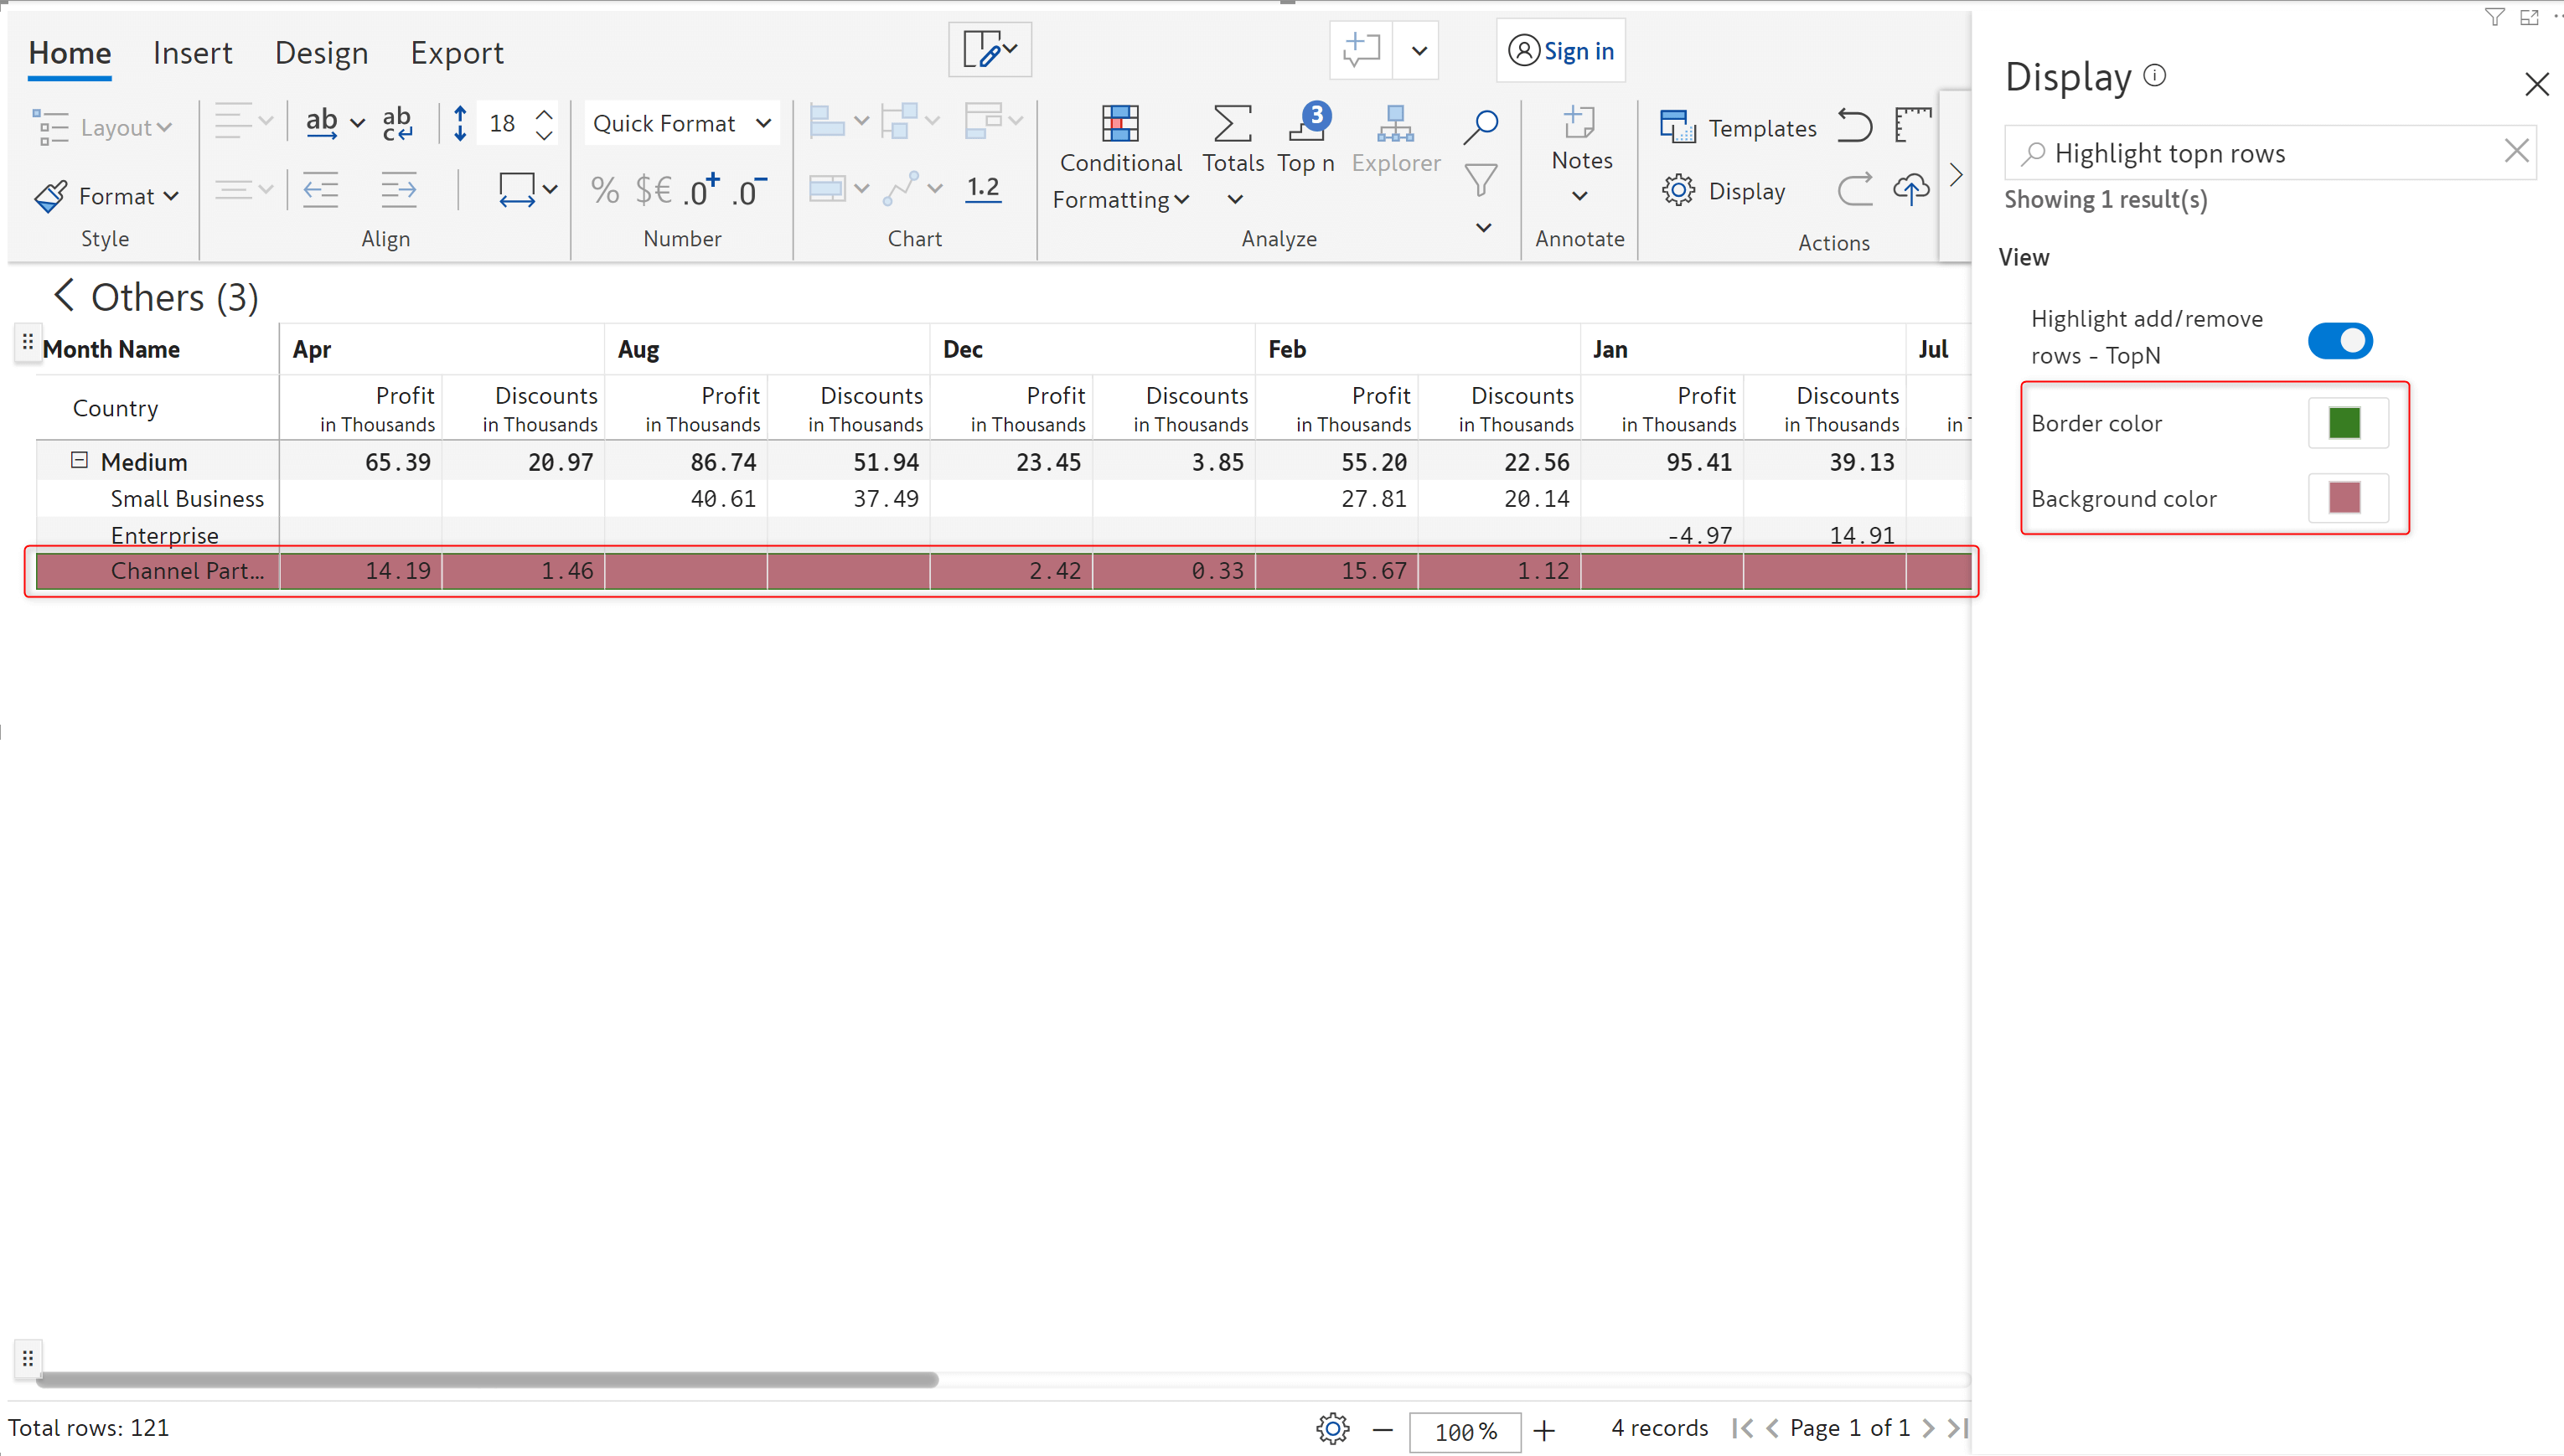
If you decide to move a particular element to the Others bucket, you can choose whether to move the elements under the immediate parent only or from all levels of the hierarchy. To easily identify such rows, Inforiver also provides an option to highlight rows which are moved to Others.
The rows which are manually moved to the Others bucket are highlighted. Inforiver also offers additional customizations such as setting a custom background and border colour. The same applies if you remove a row from the Others section as well.
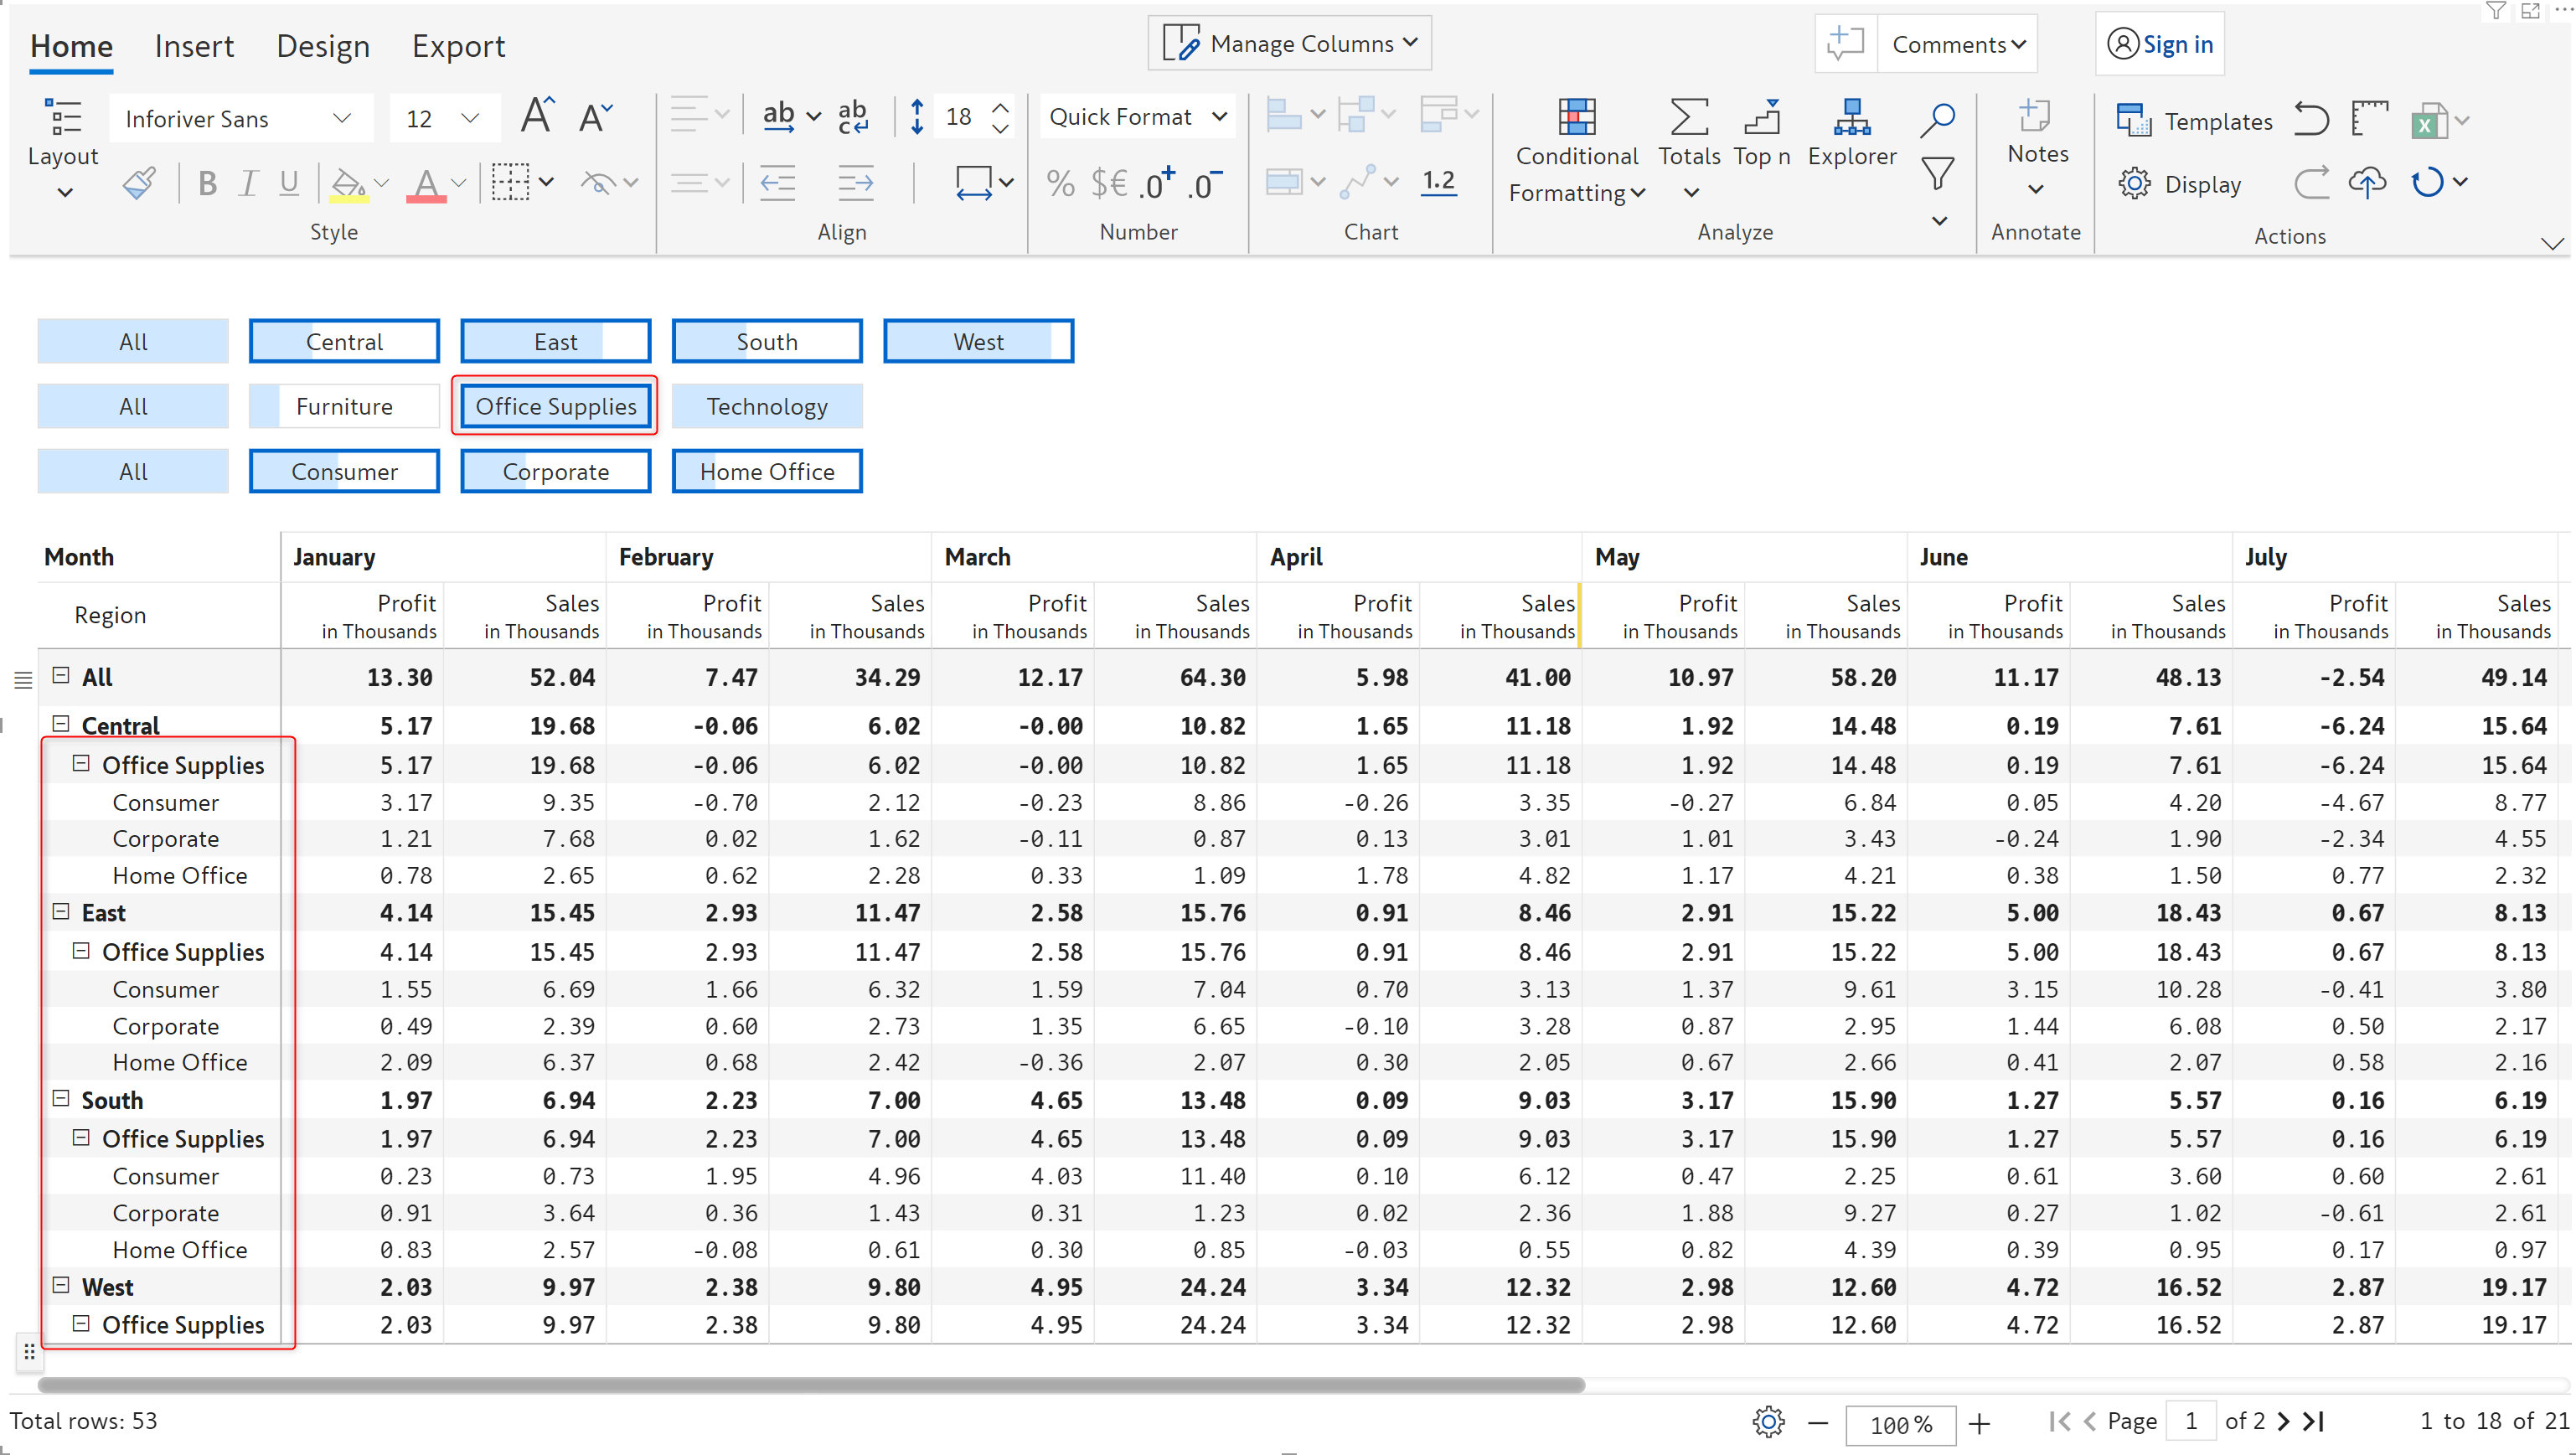
A new header preset has been added which enables you to efficiently filter and view data under selected categories.
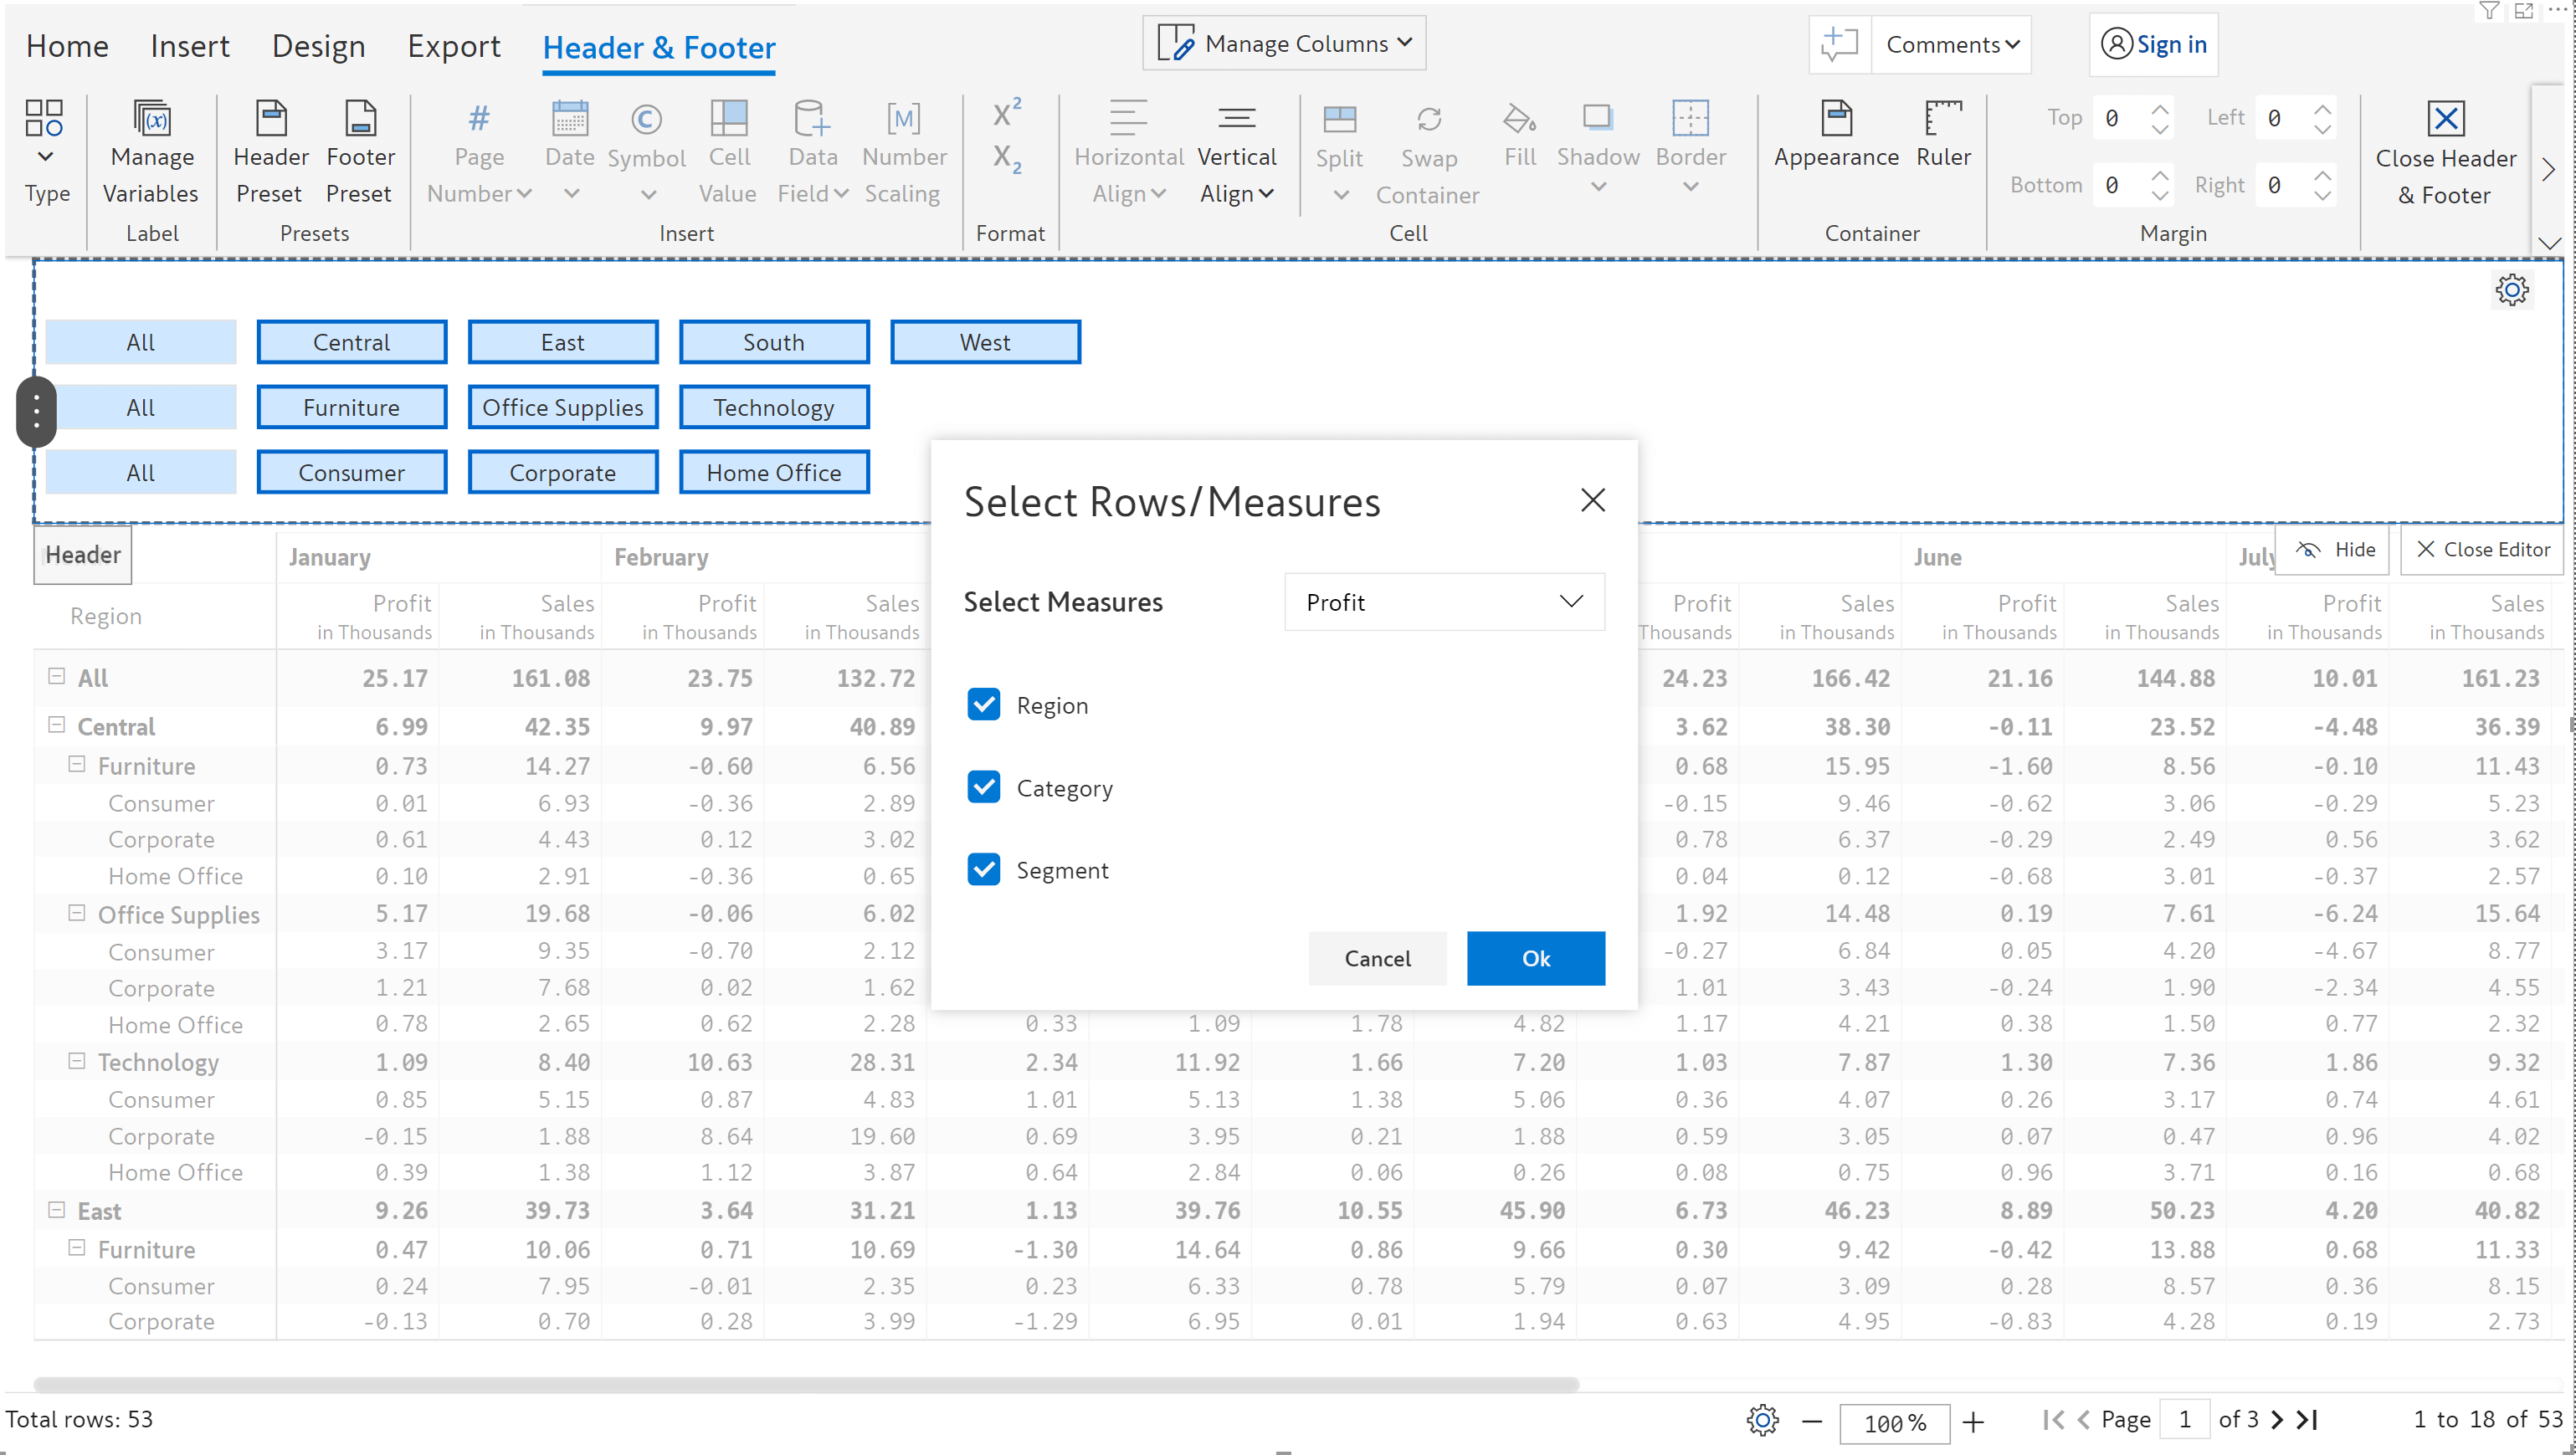
Simply click on the category to be analysed to quickly filter data for those category/categories only.
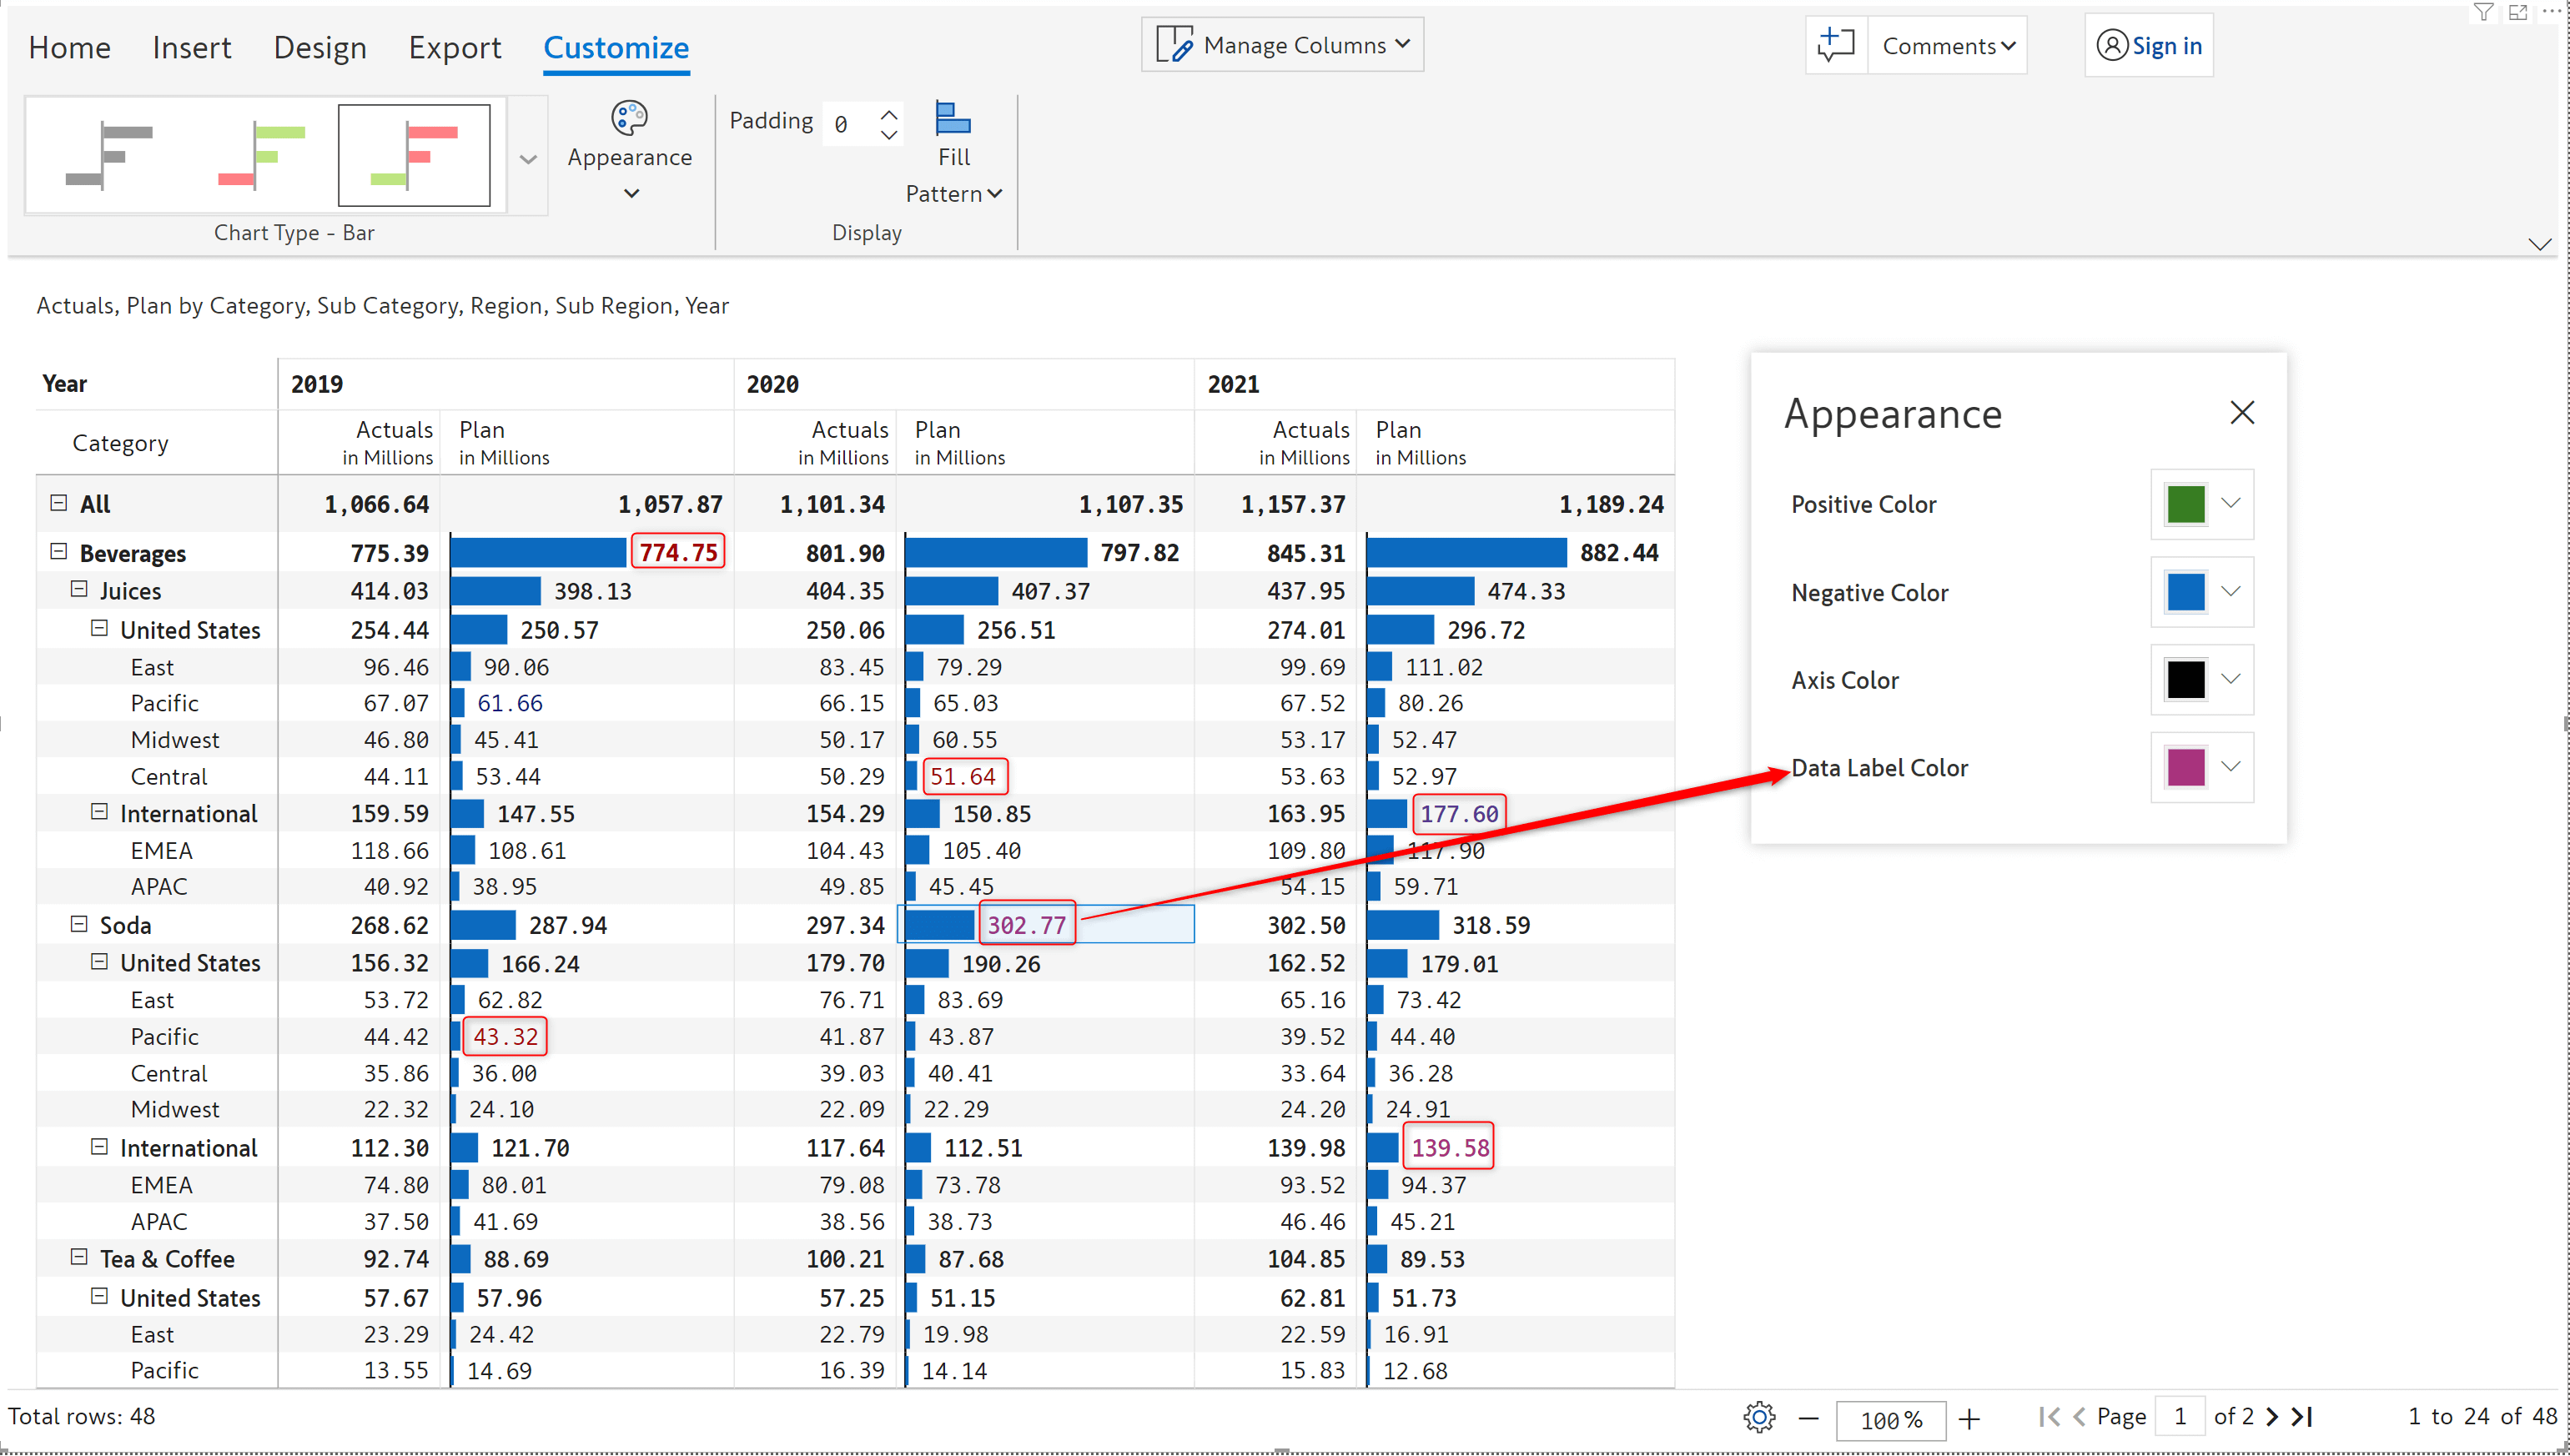
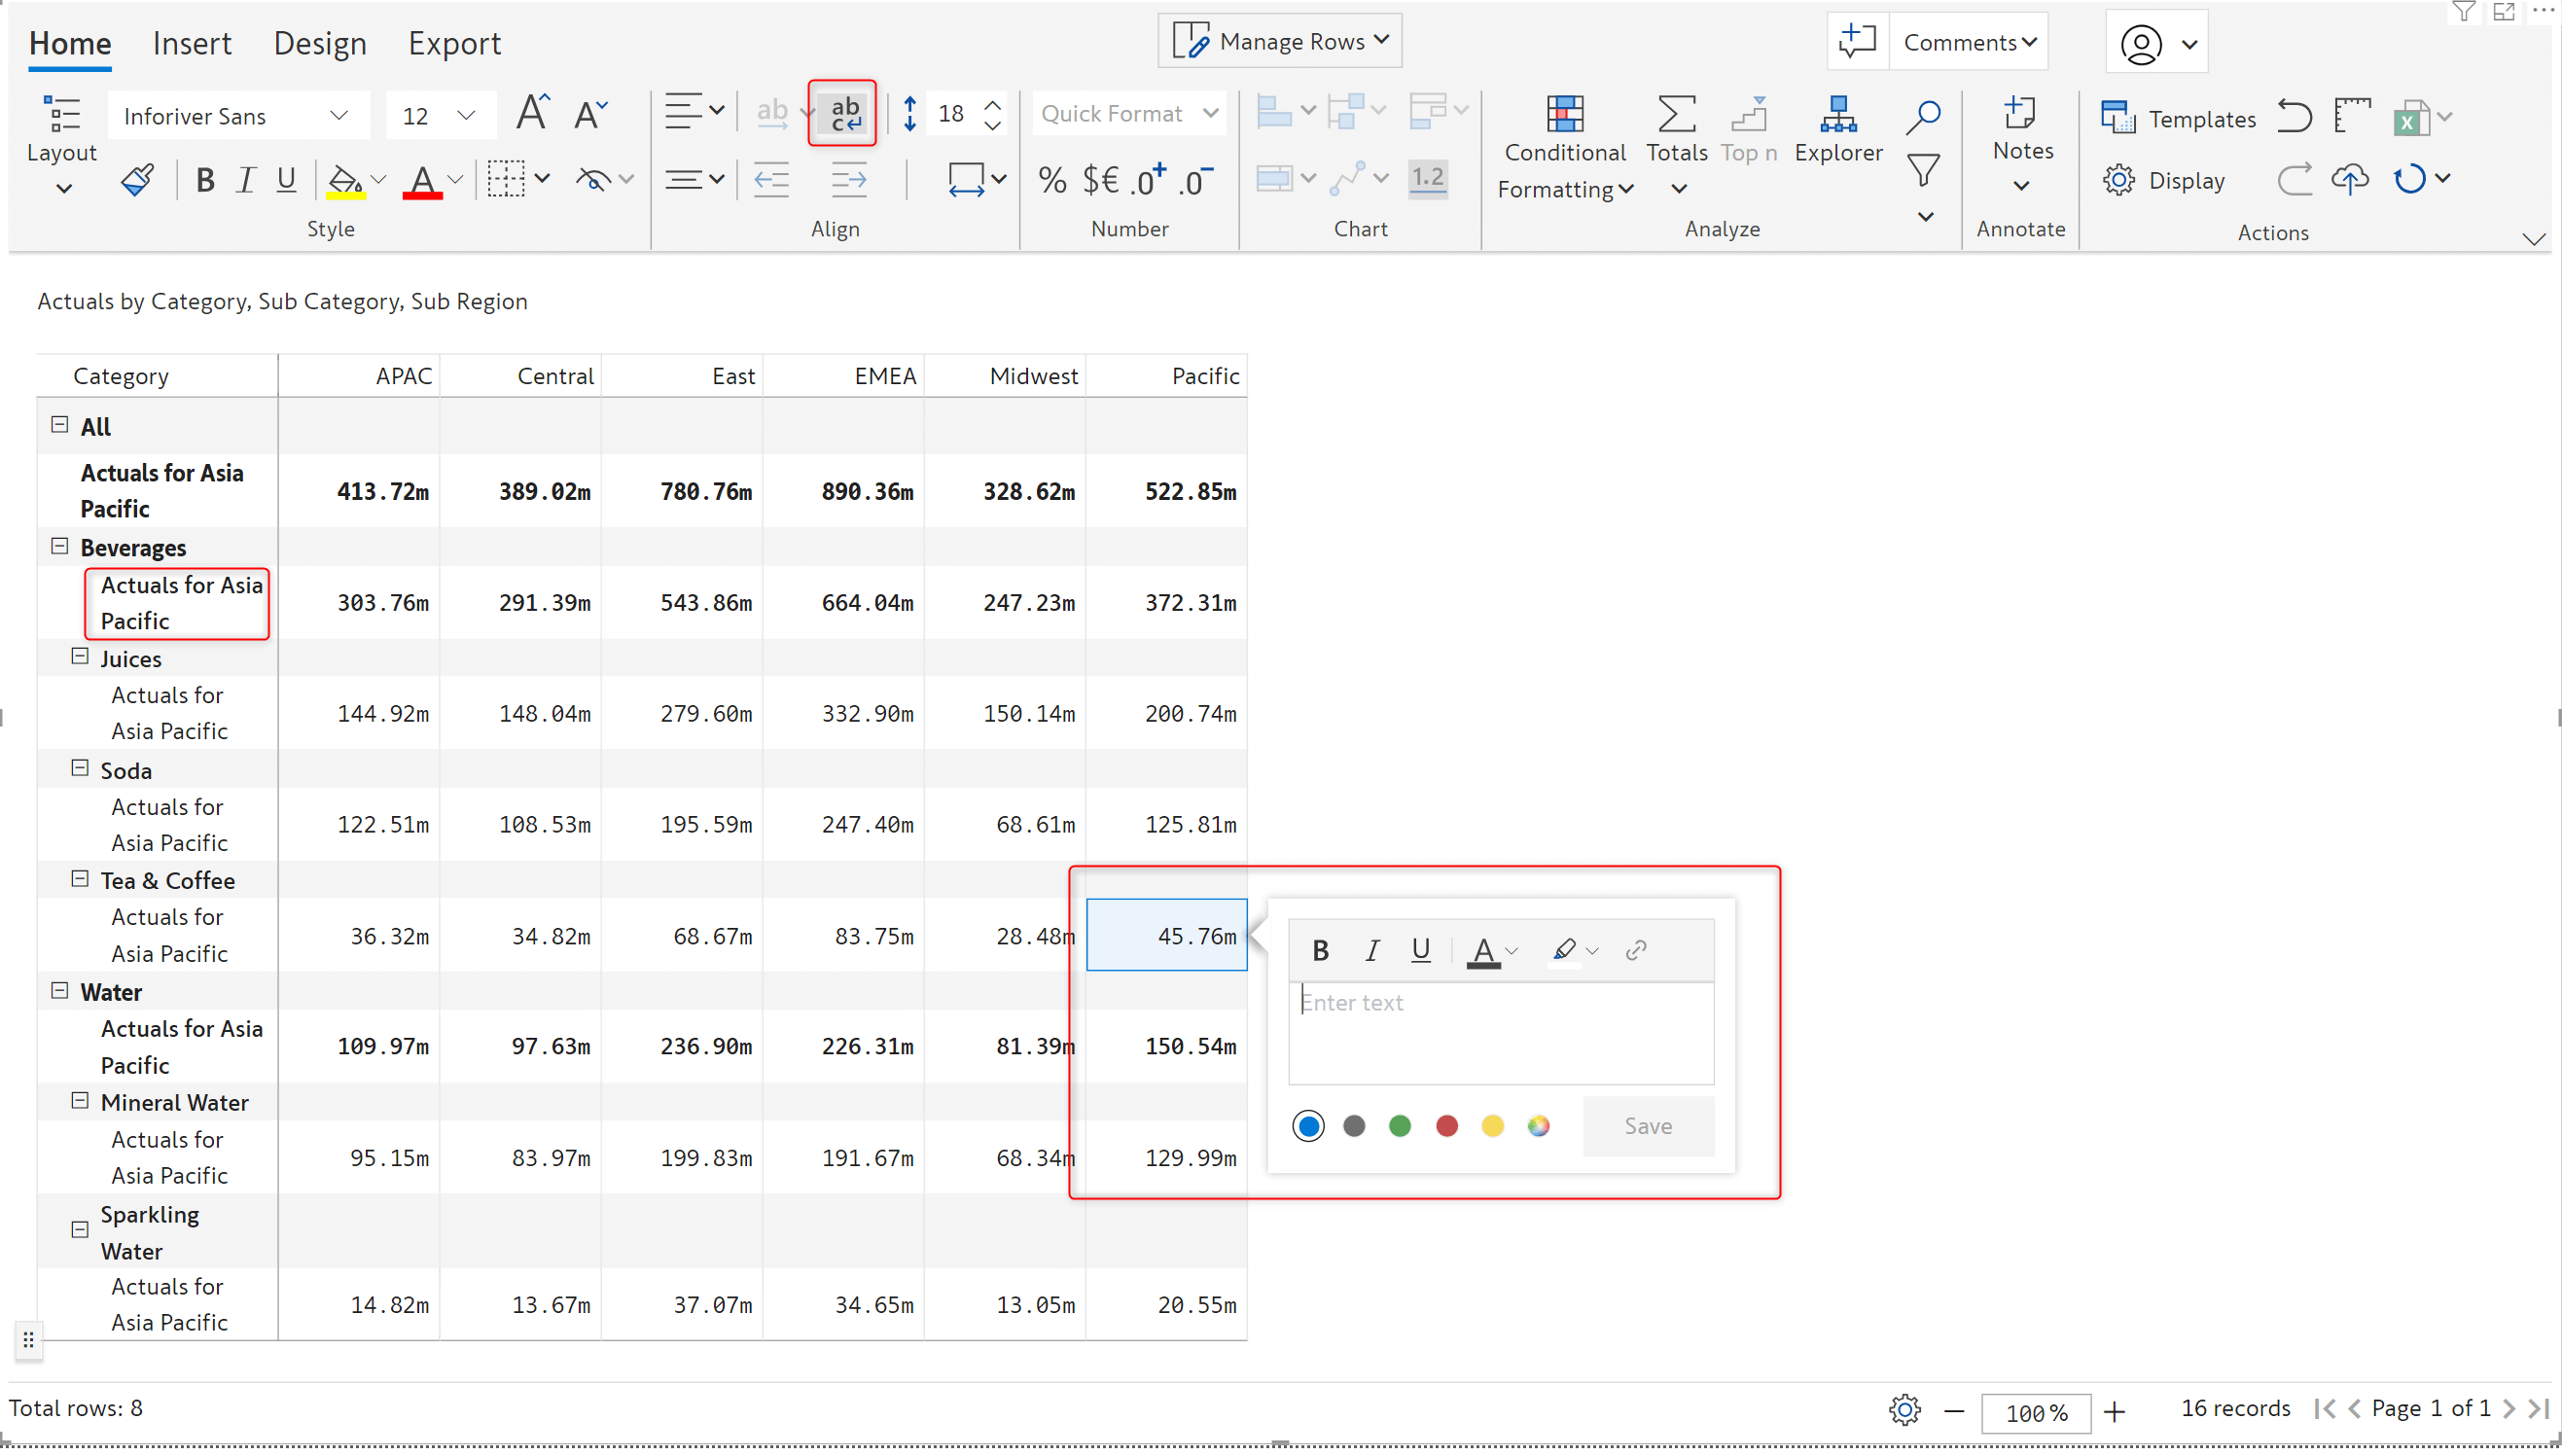
You can now emphasize your data by applying customizations for individual cells. You can change the colour of the data label at a cell level.
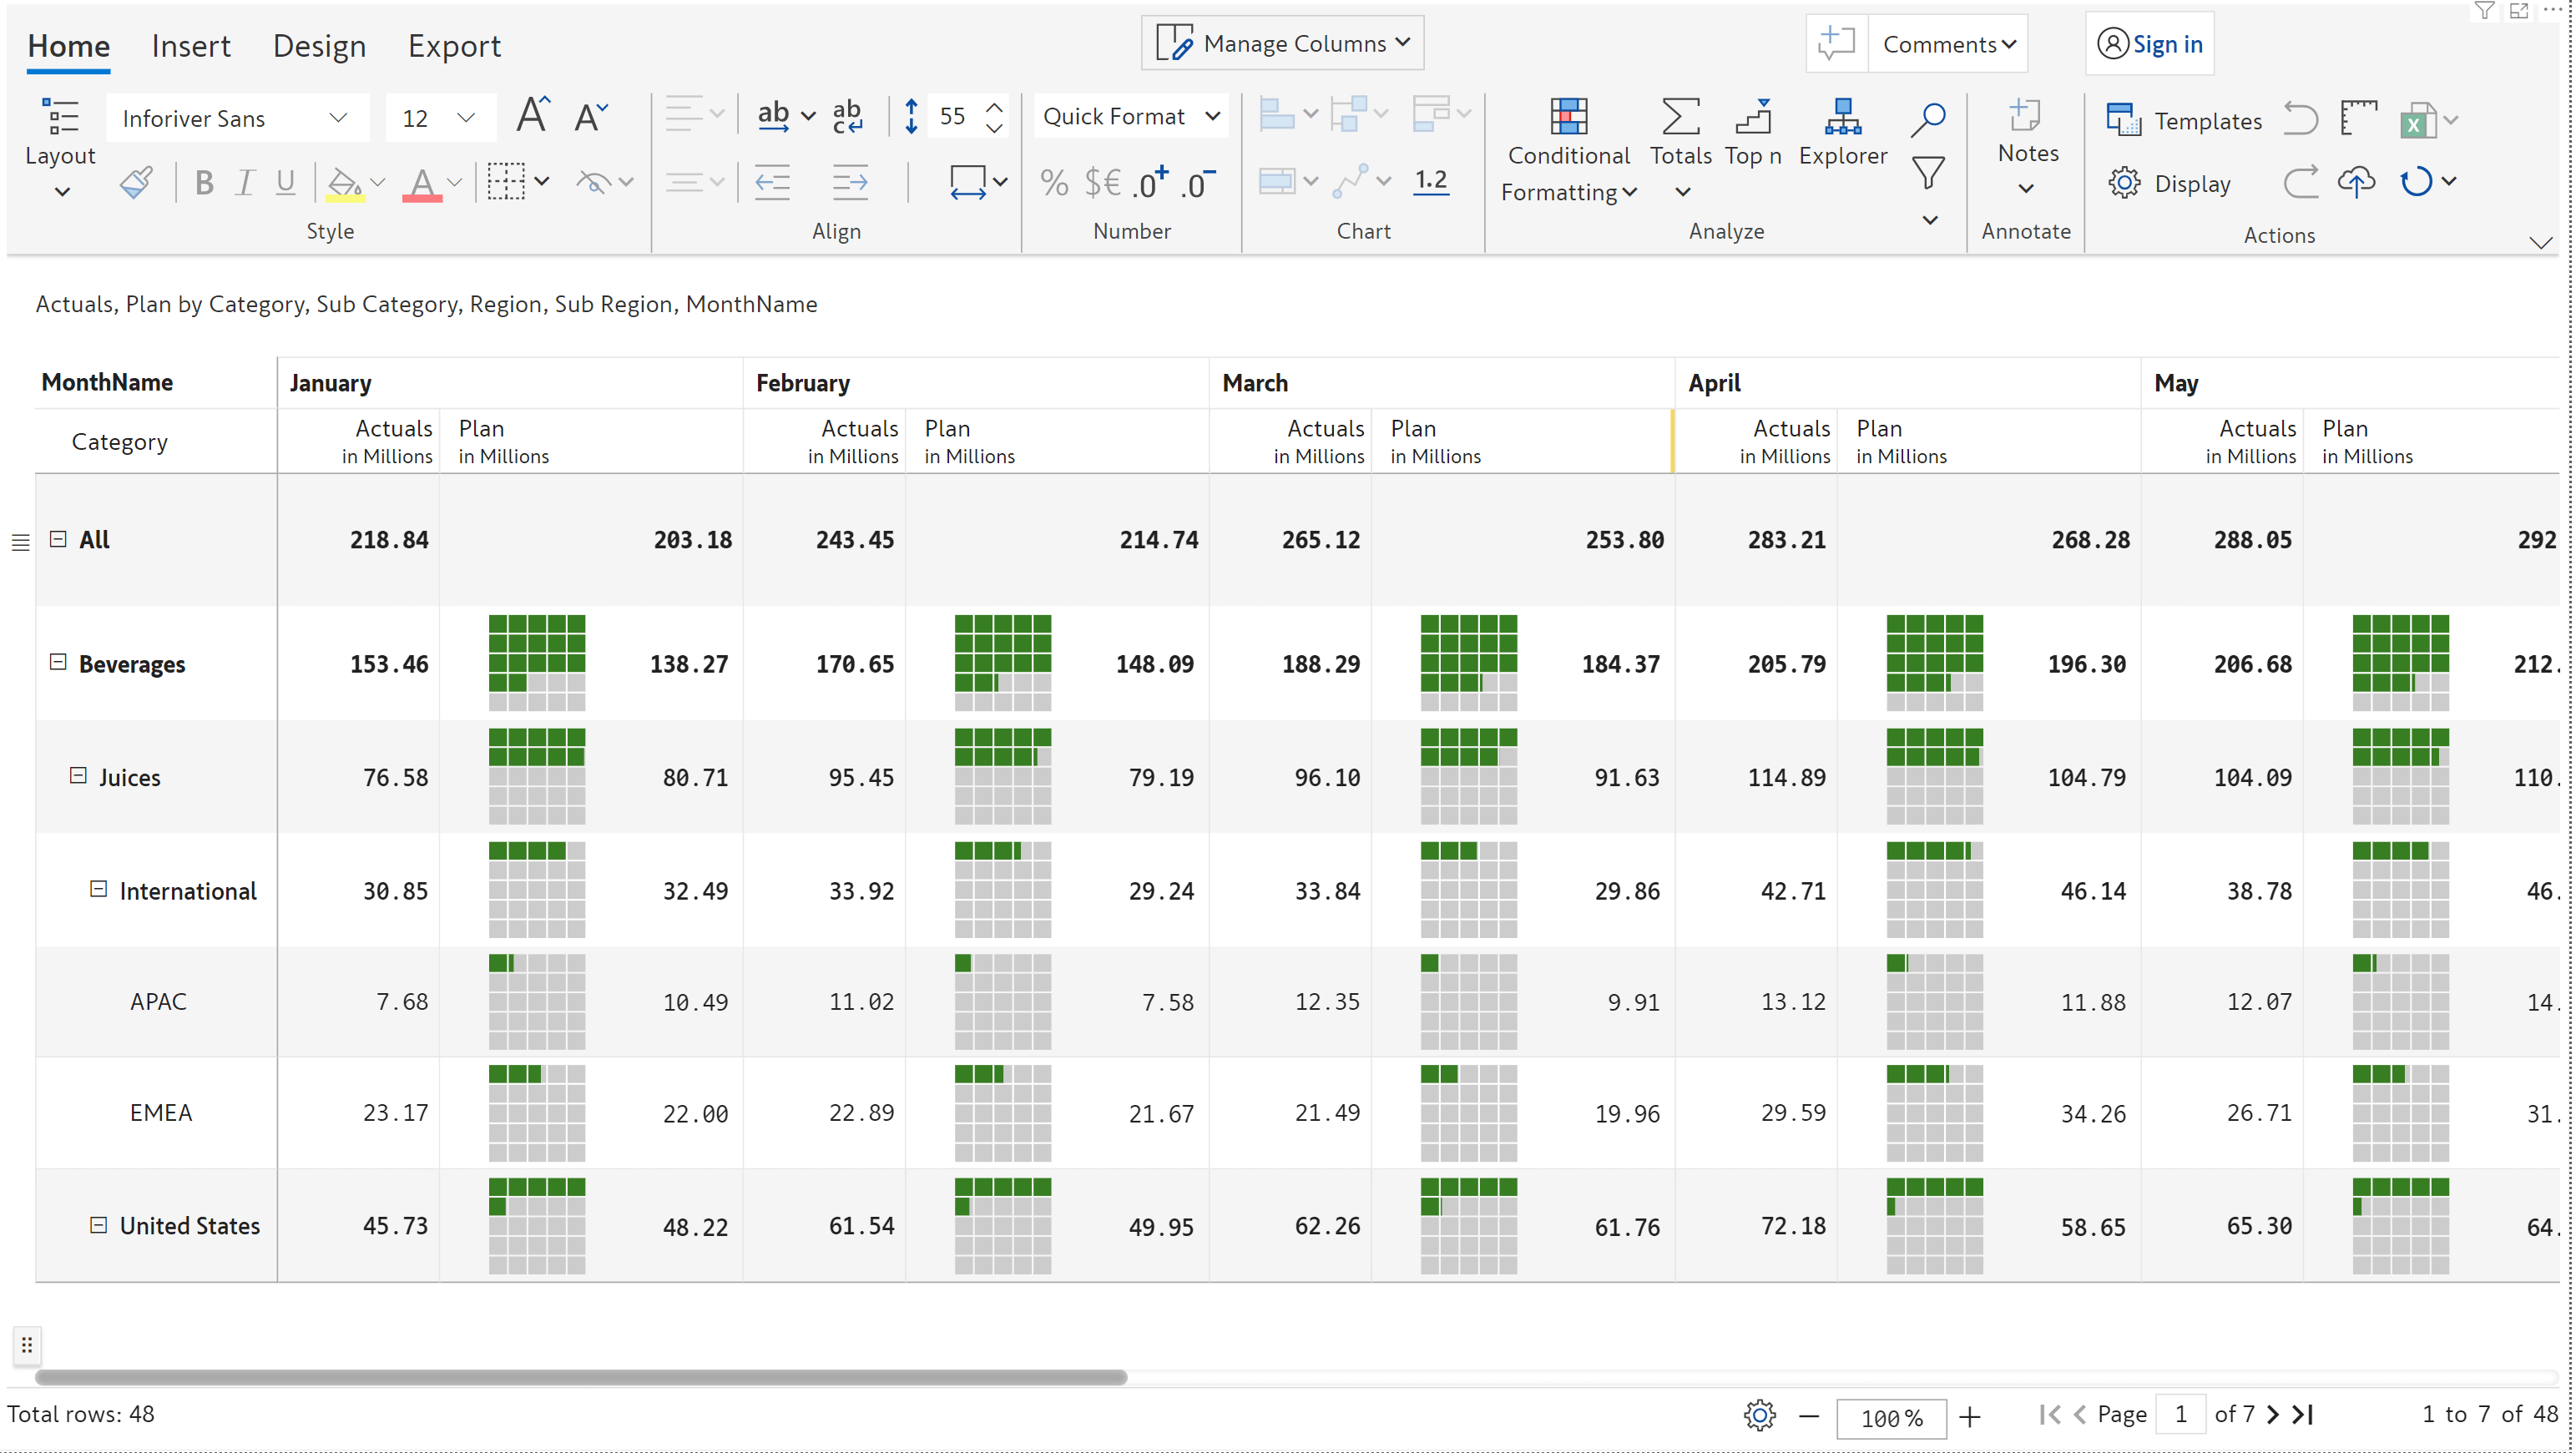
The alignment for waffle charts has been rectified. Reports that use waffle charts will be more visually appealing with the charts being centre aligned for each row.
The enhancements outlined in this section contribute to making your interactions with Inforiver a smoother, more efficient, and straightforward experience.
All the formulas that you have implemented on your data are now at your fingertips. To view the underlying logic, click on any cell of a measure or column that contains a formula.
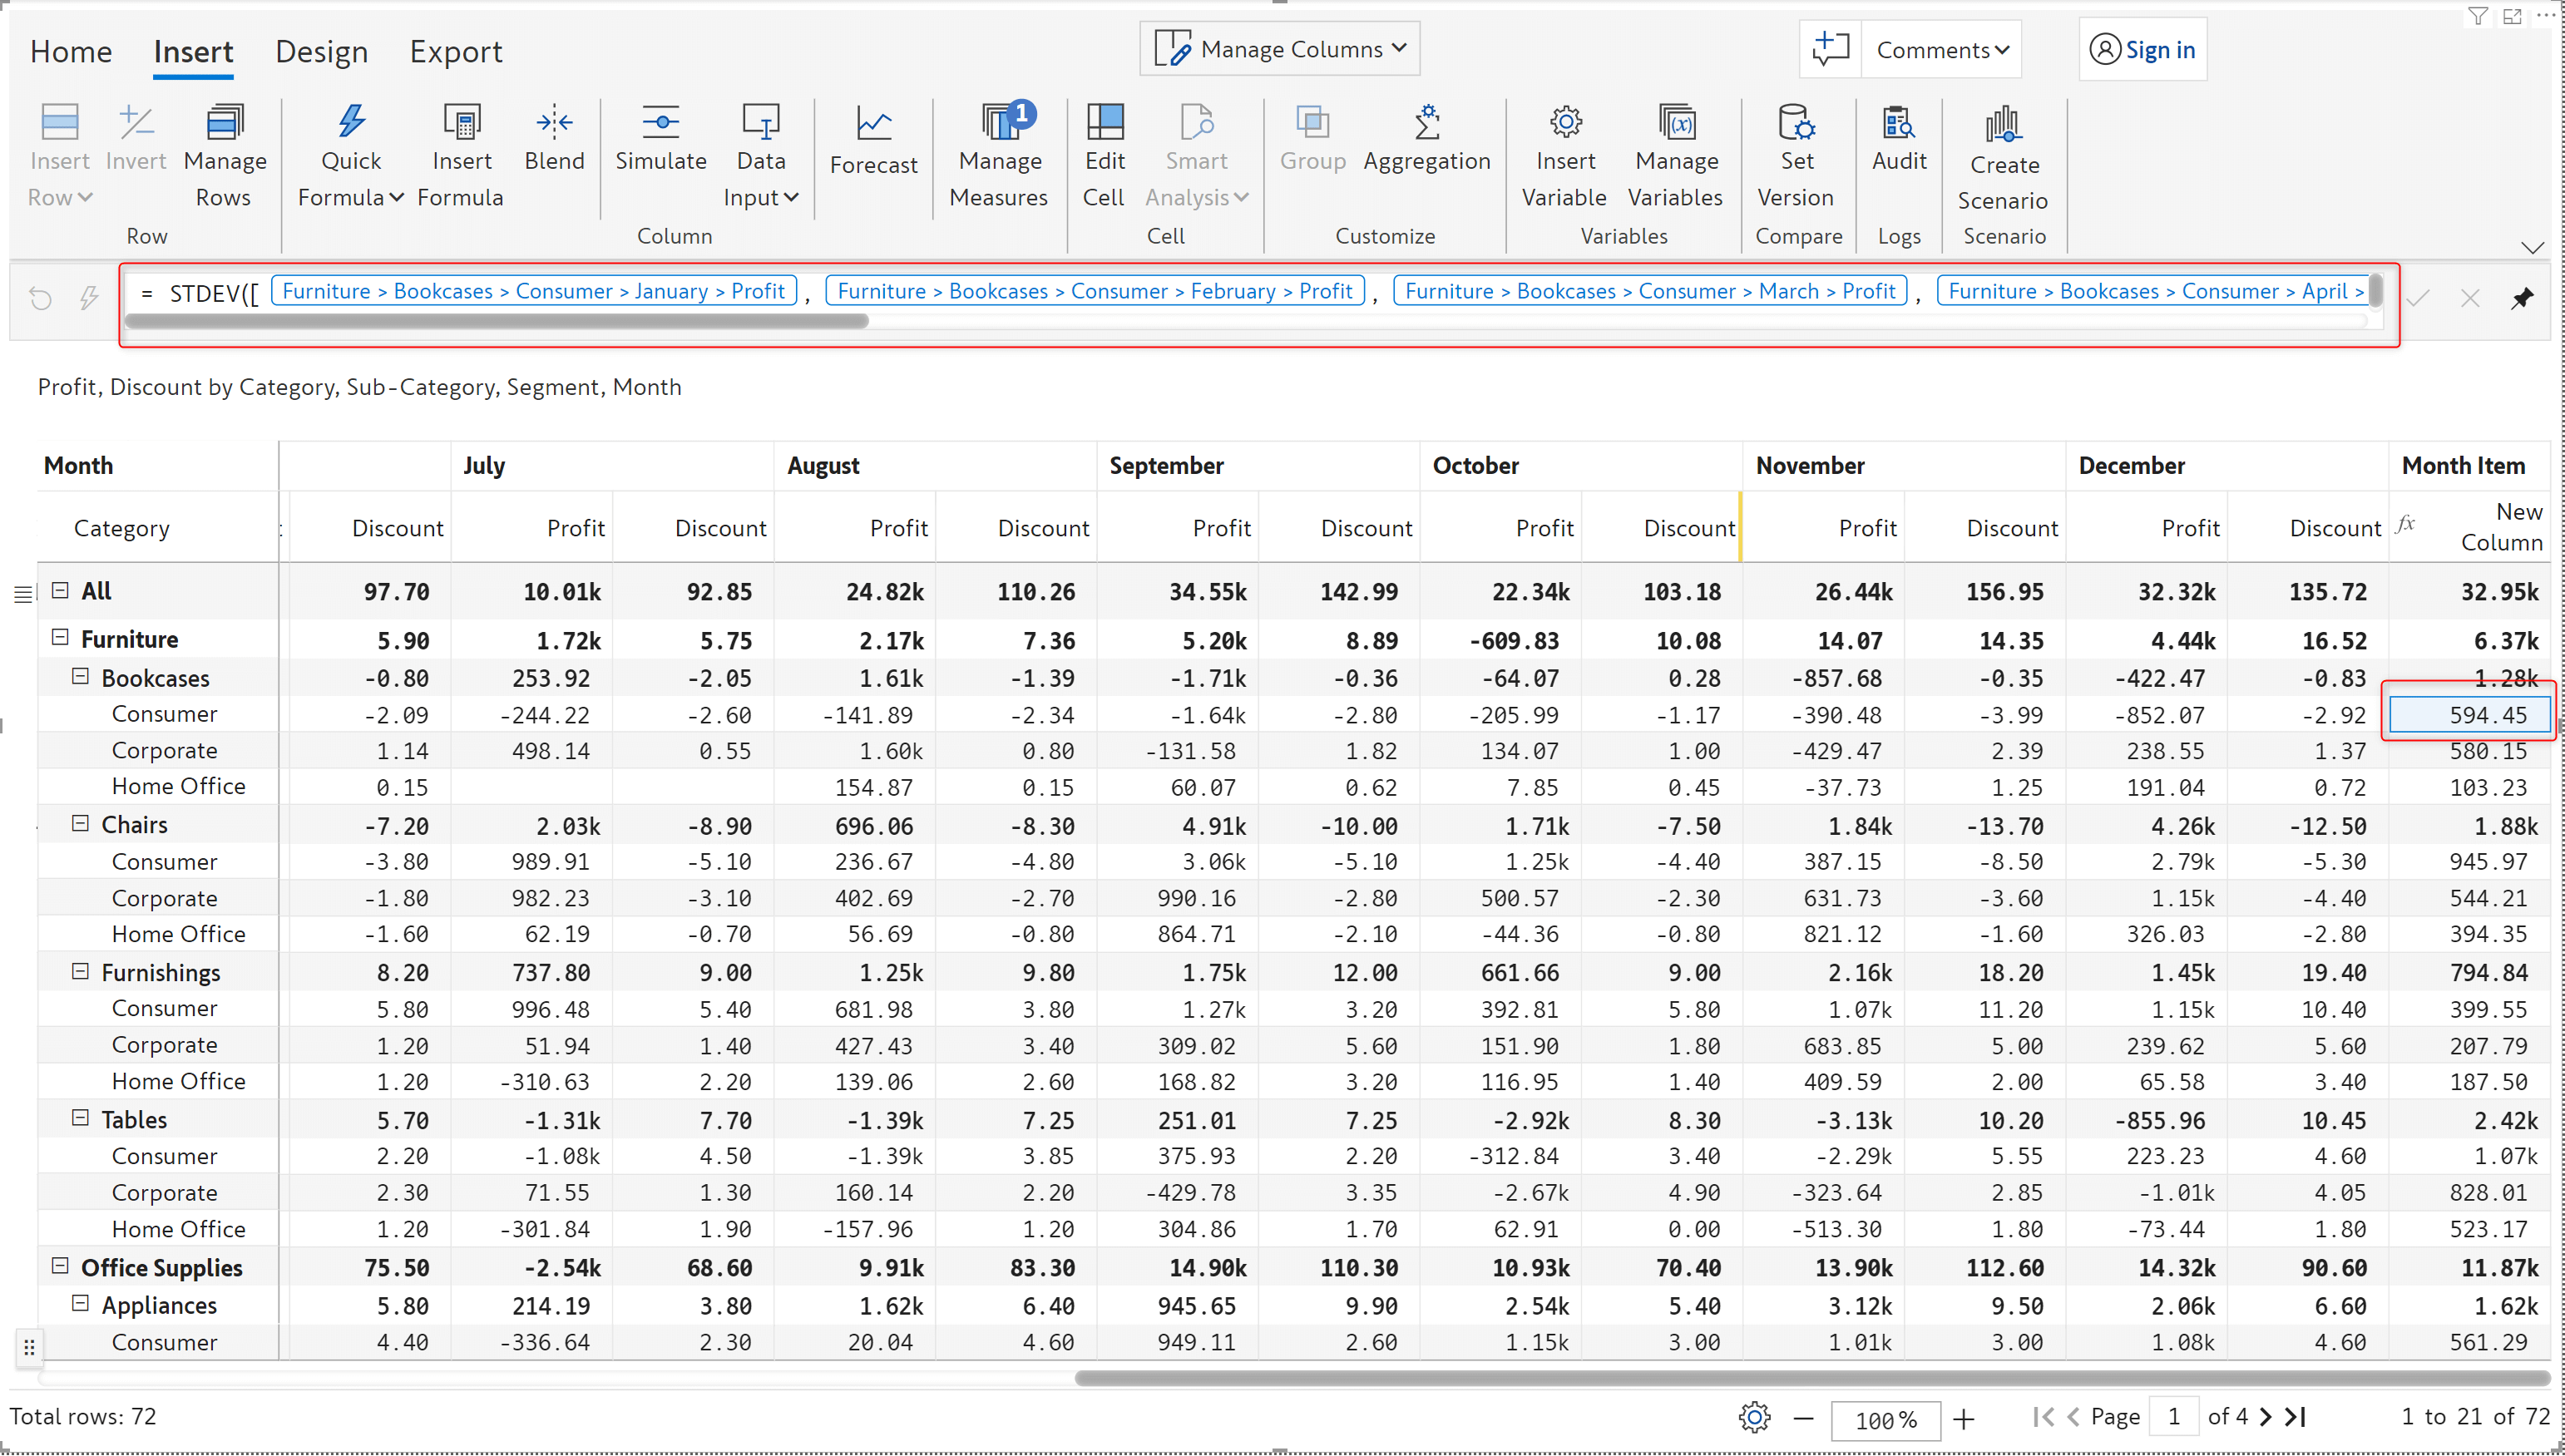
With the 2.4. release, Inforiver simplifies writing complex formulas by highlighting the opening and closing braces.
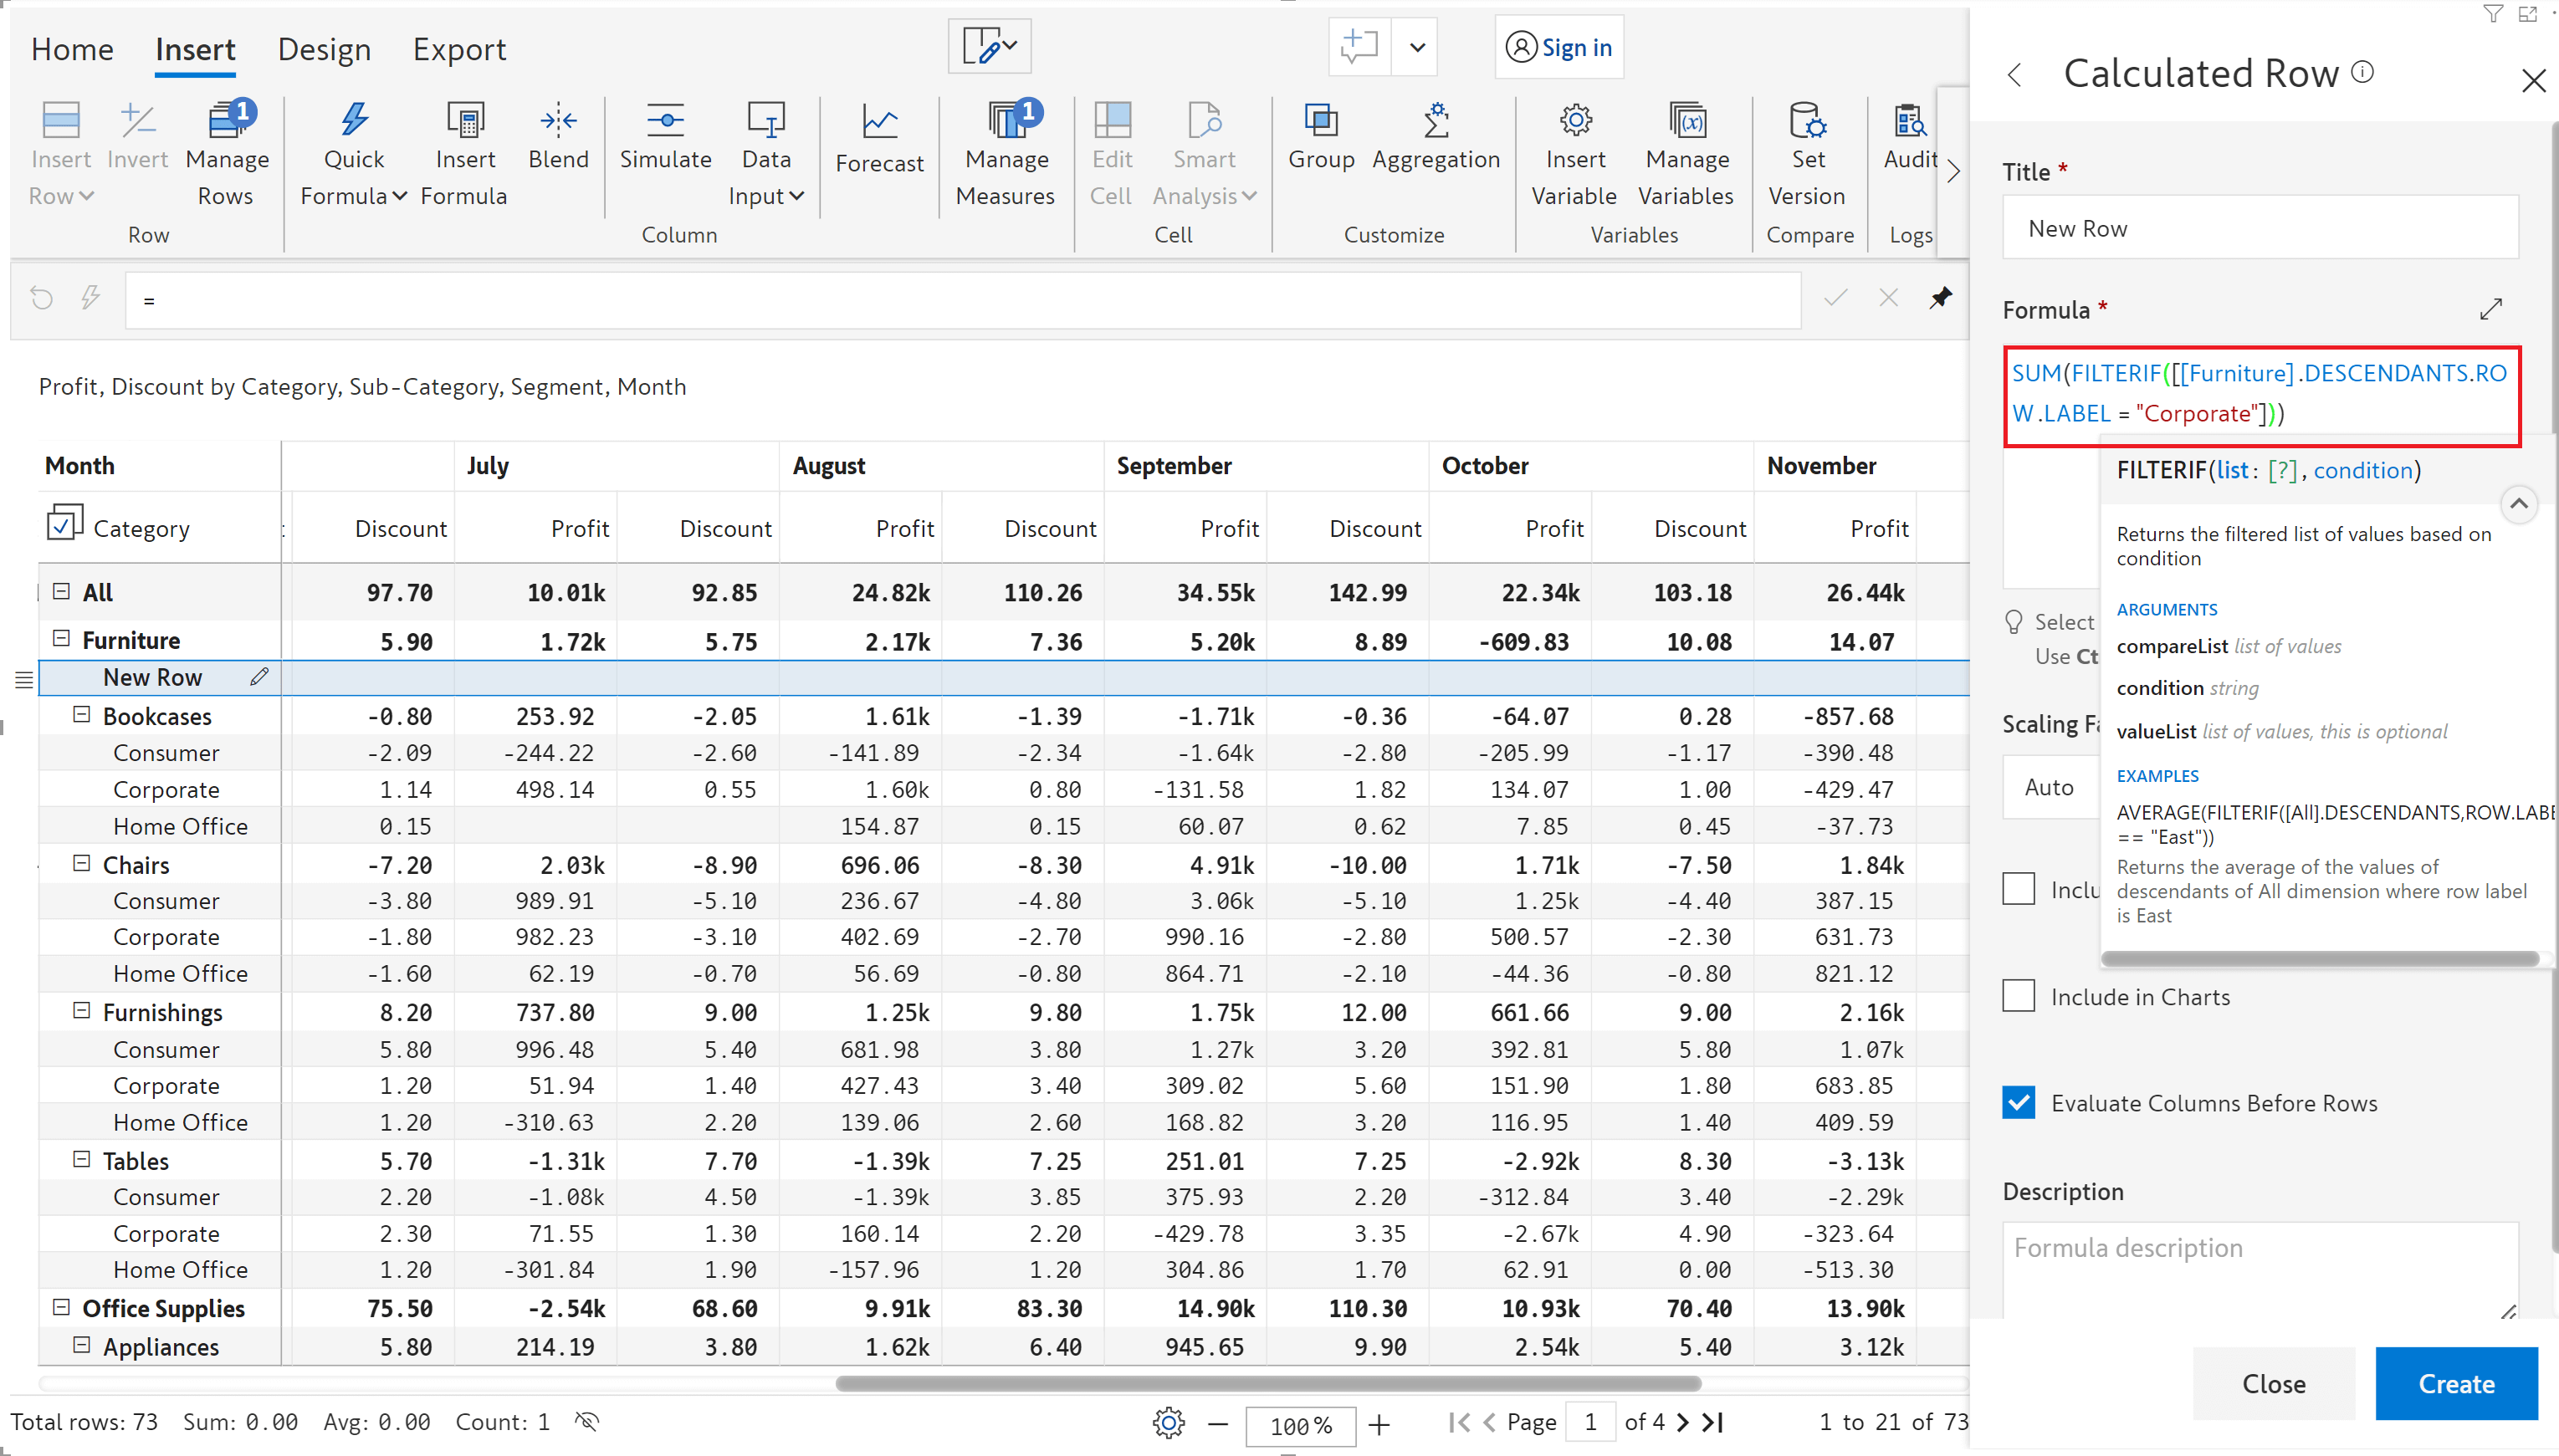
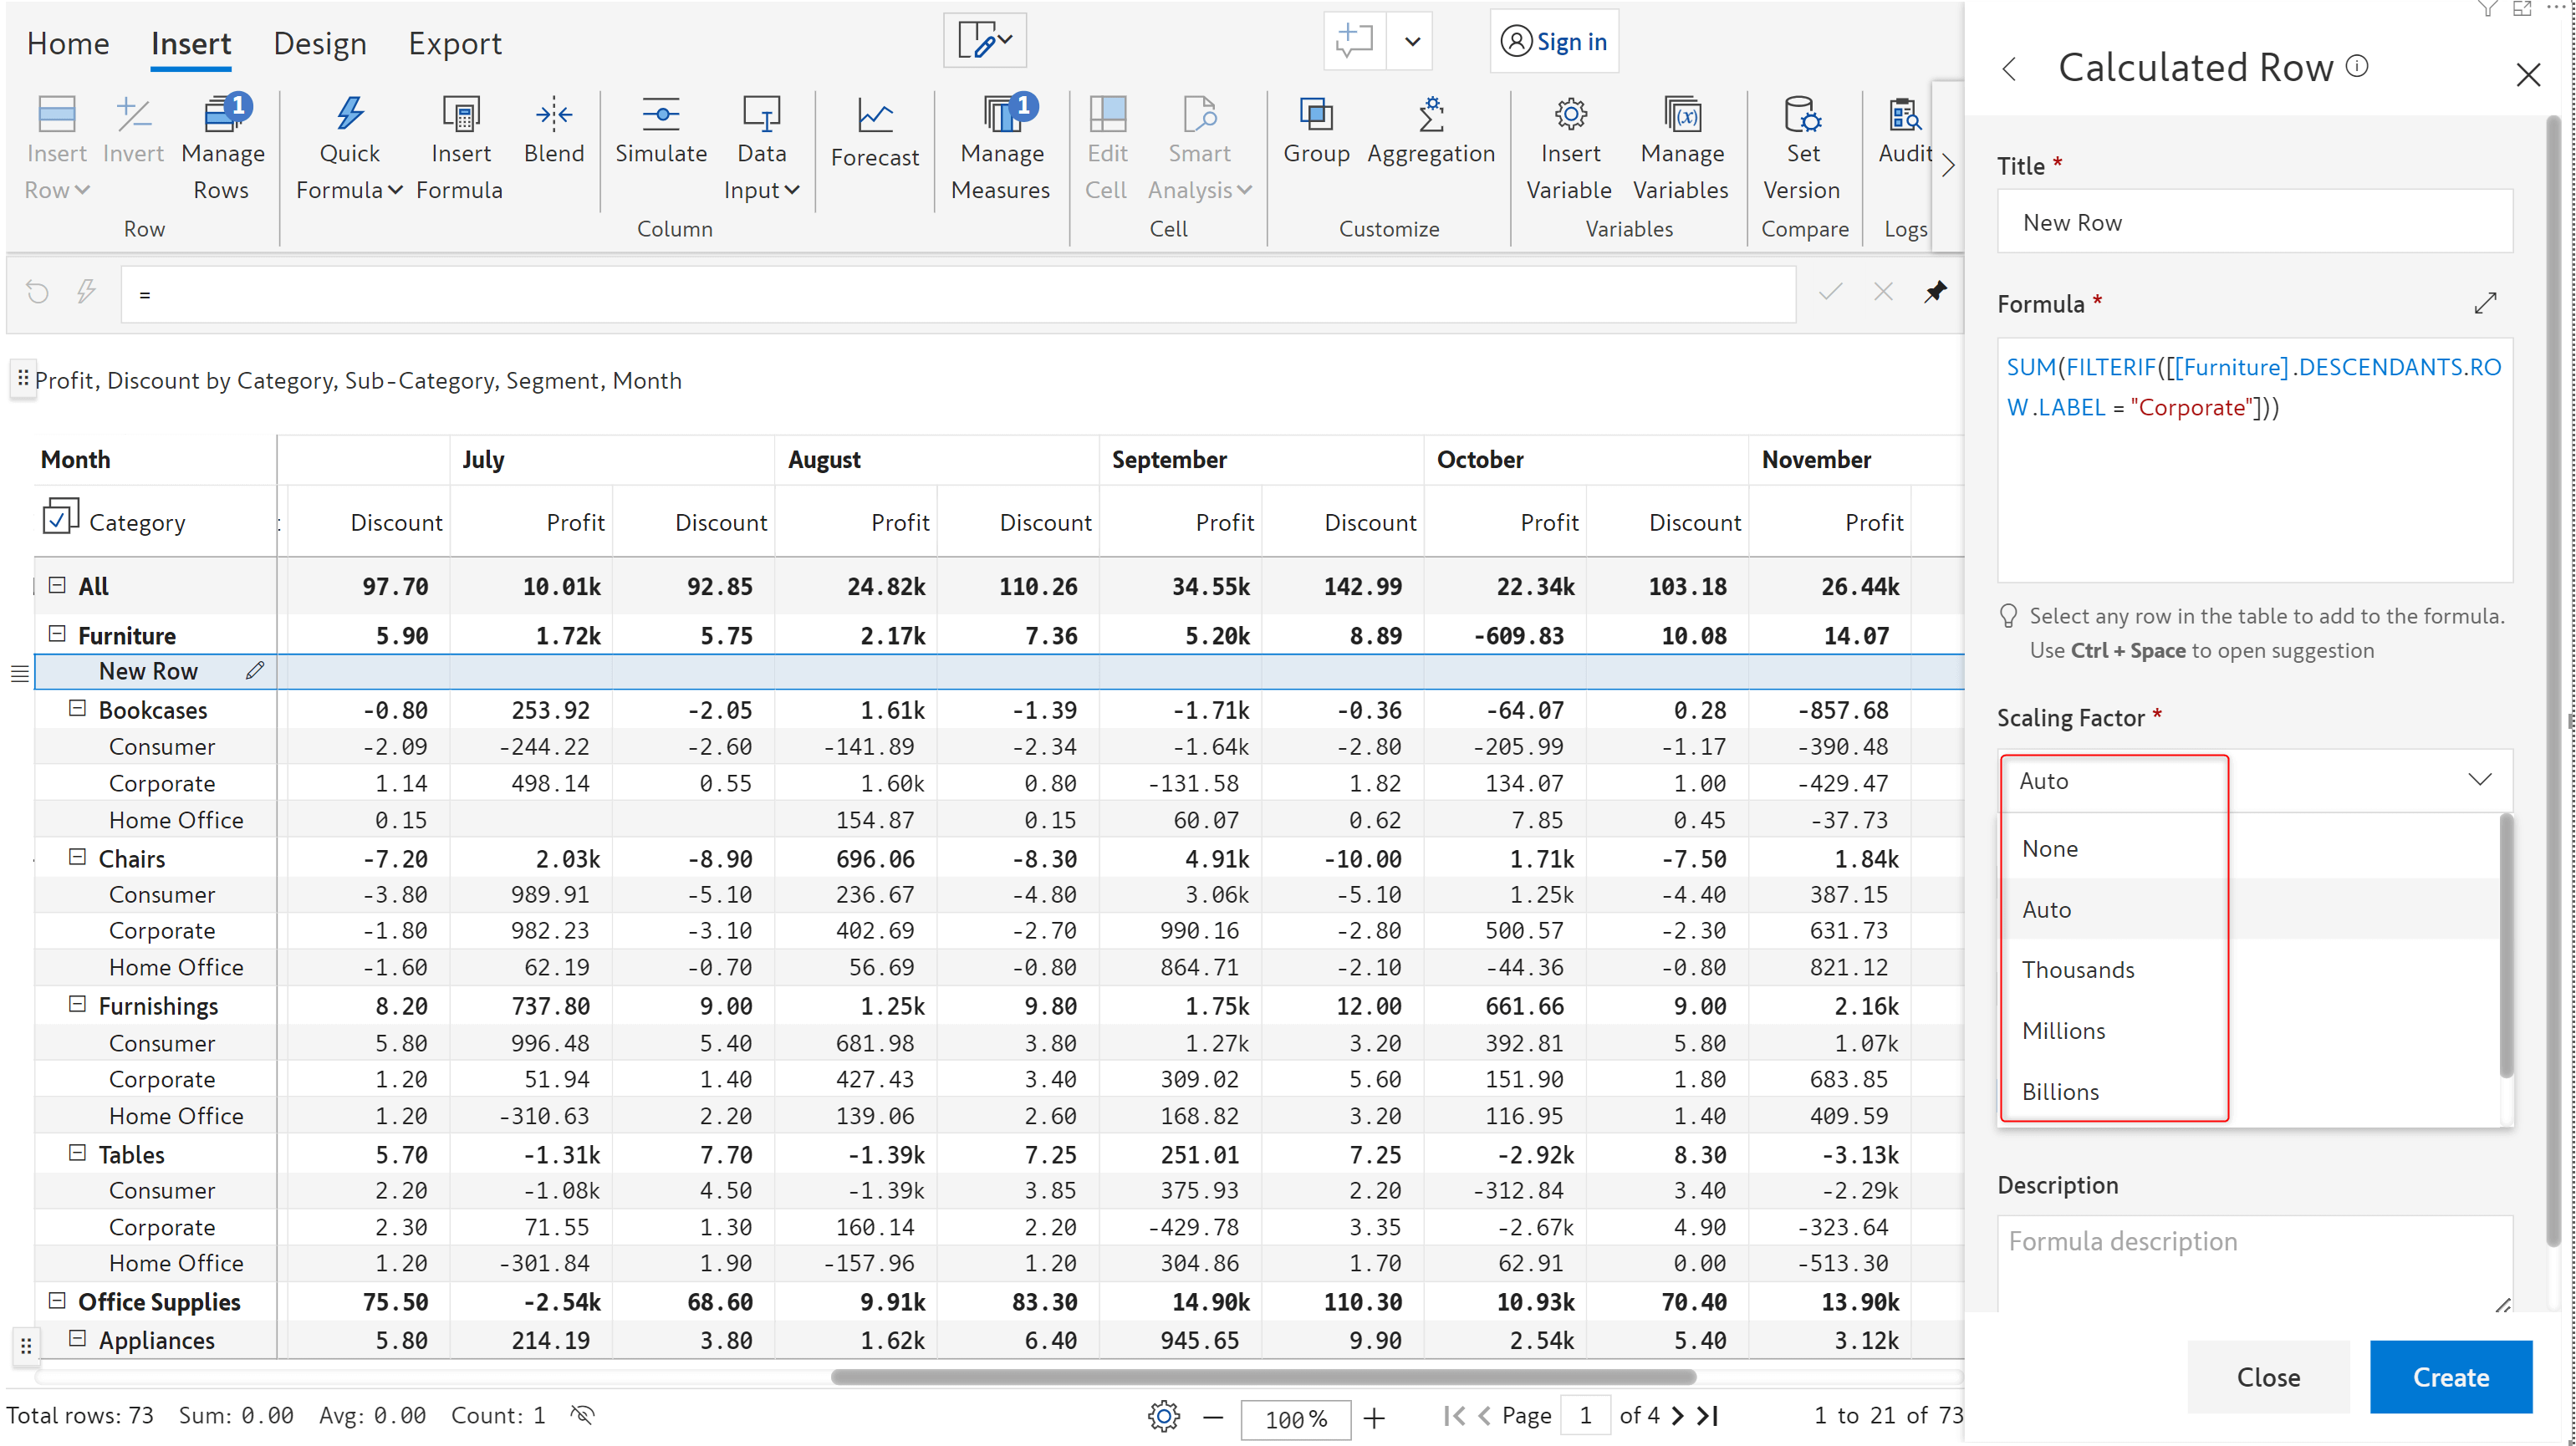
In certain cases, the values in calculated rows may not conform to the number scaling set at report level. With the 2.4. release, you can apply a custom scaling factor based on the nature of the calculation applied.
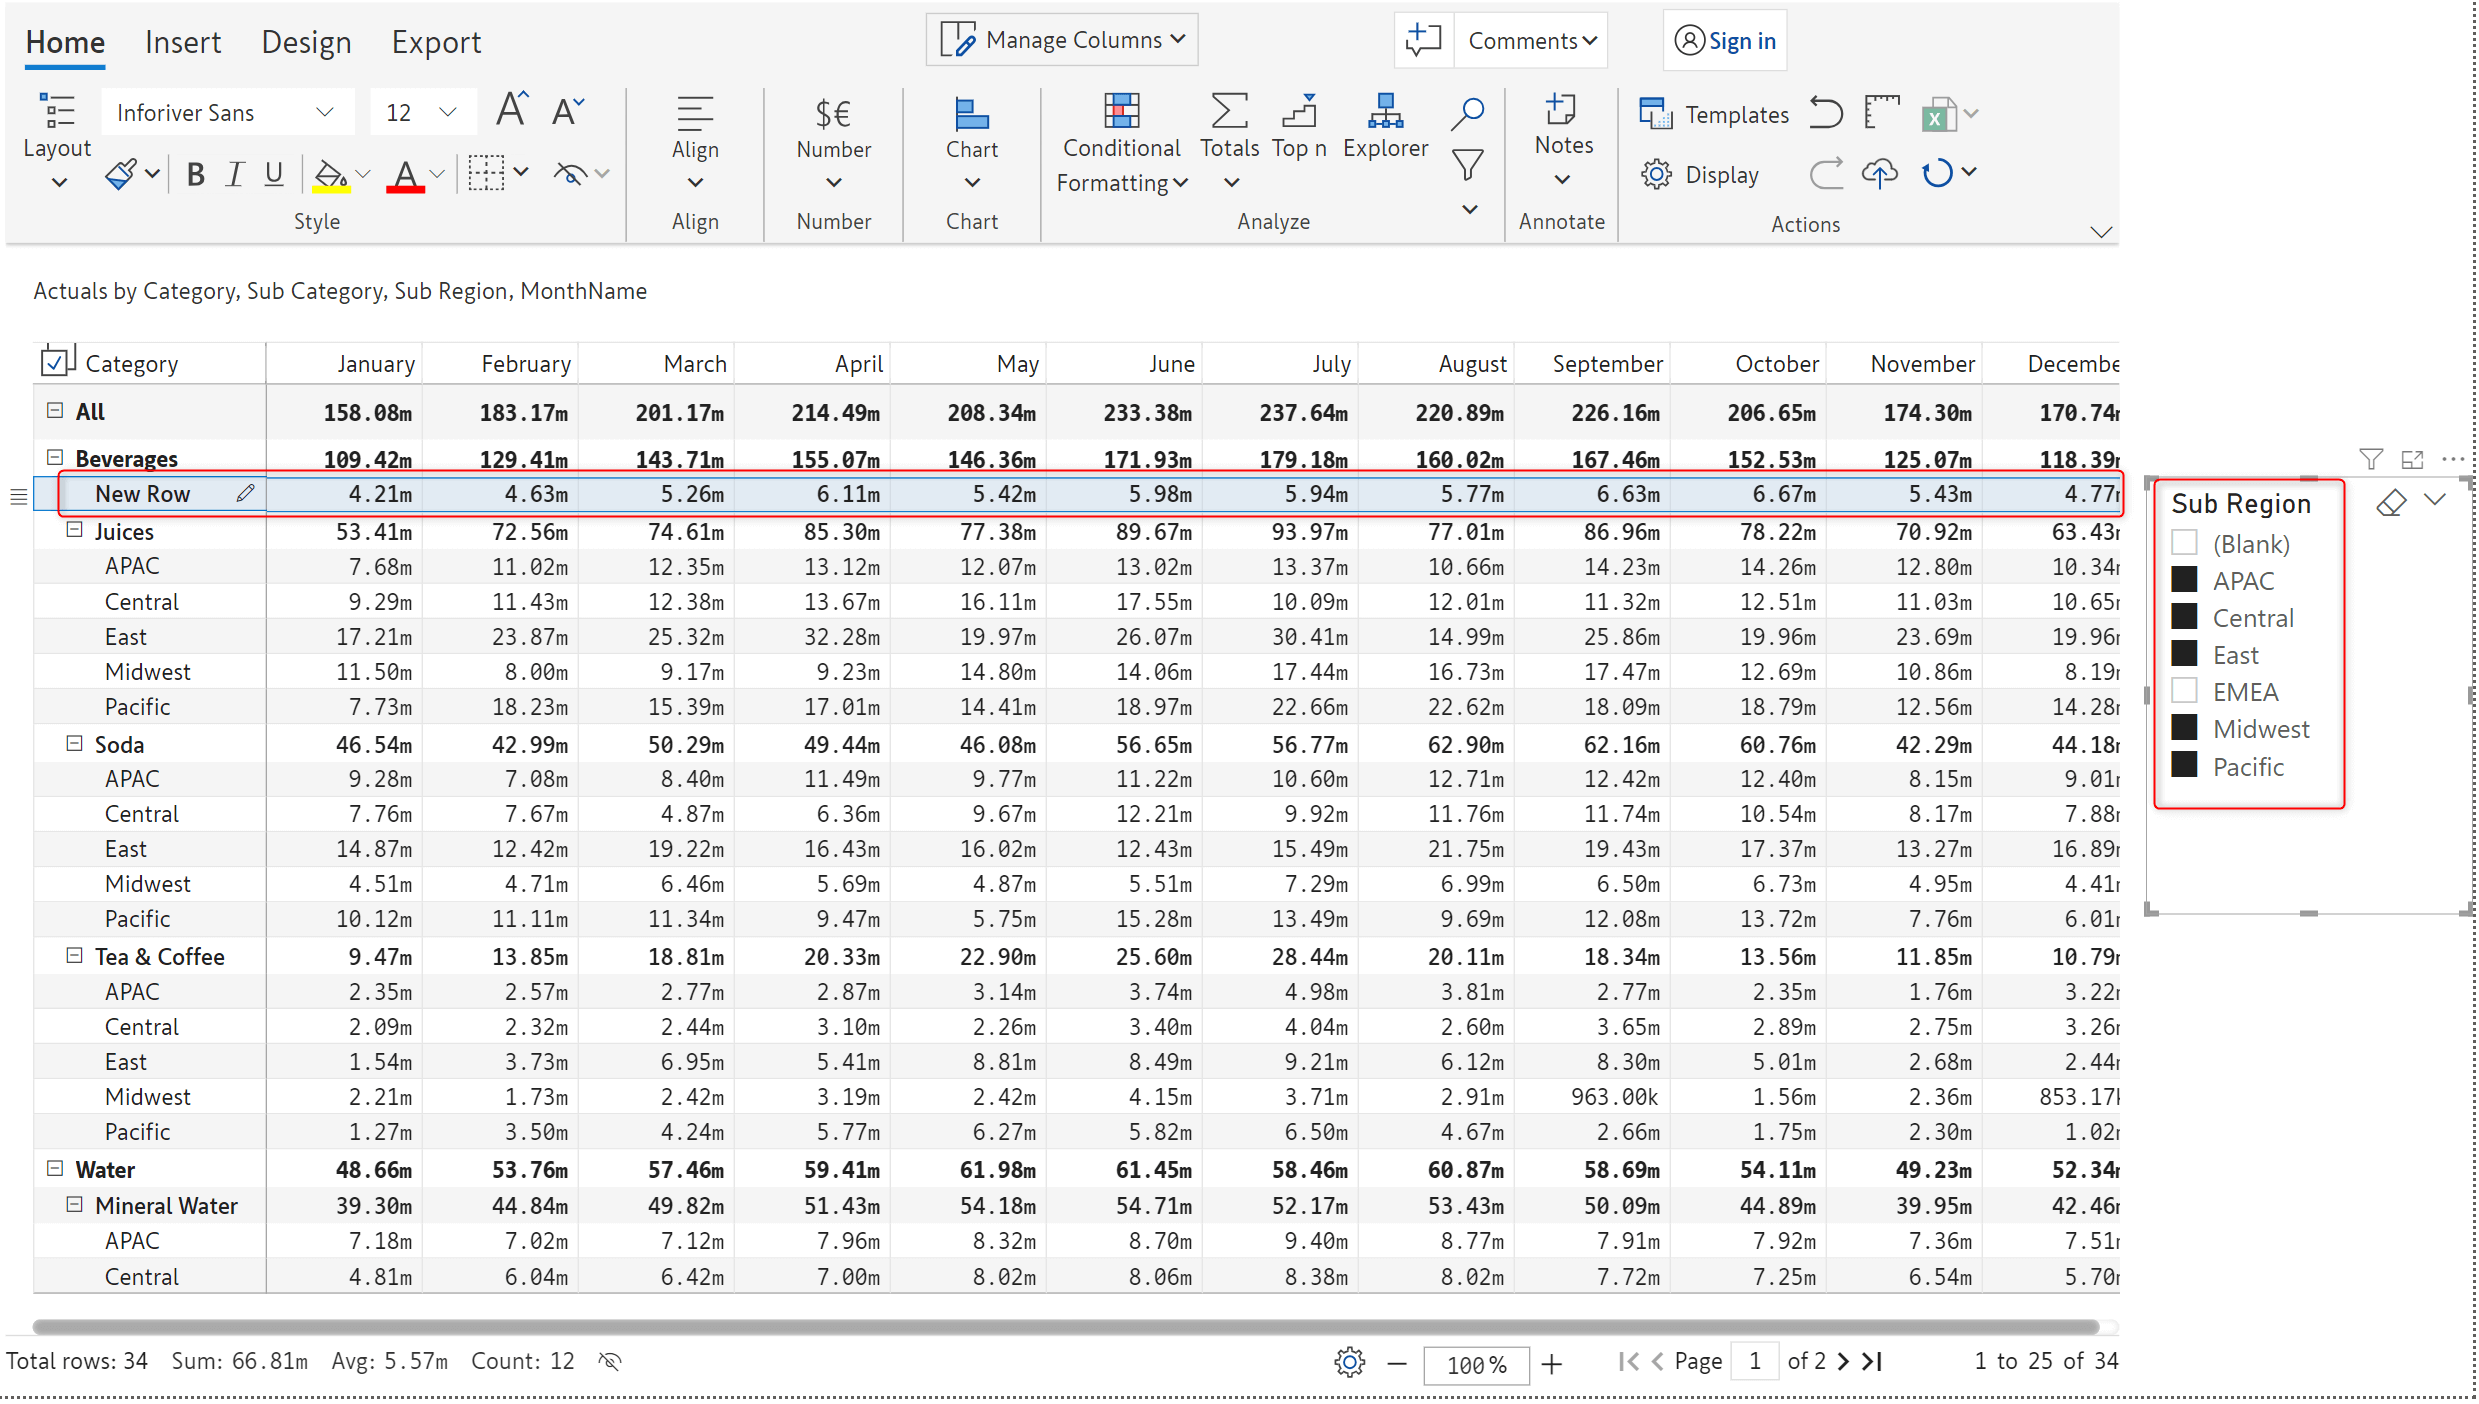
Inforiver provides a global error handling setting which internally handles missing reference errors and converts the missing values to 0 when used in calculations.
Consider that you are deriving the standard deviation for beverages across EMEA and APAC regions.
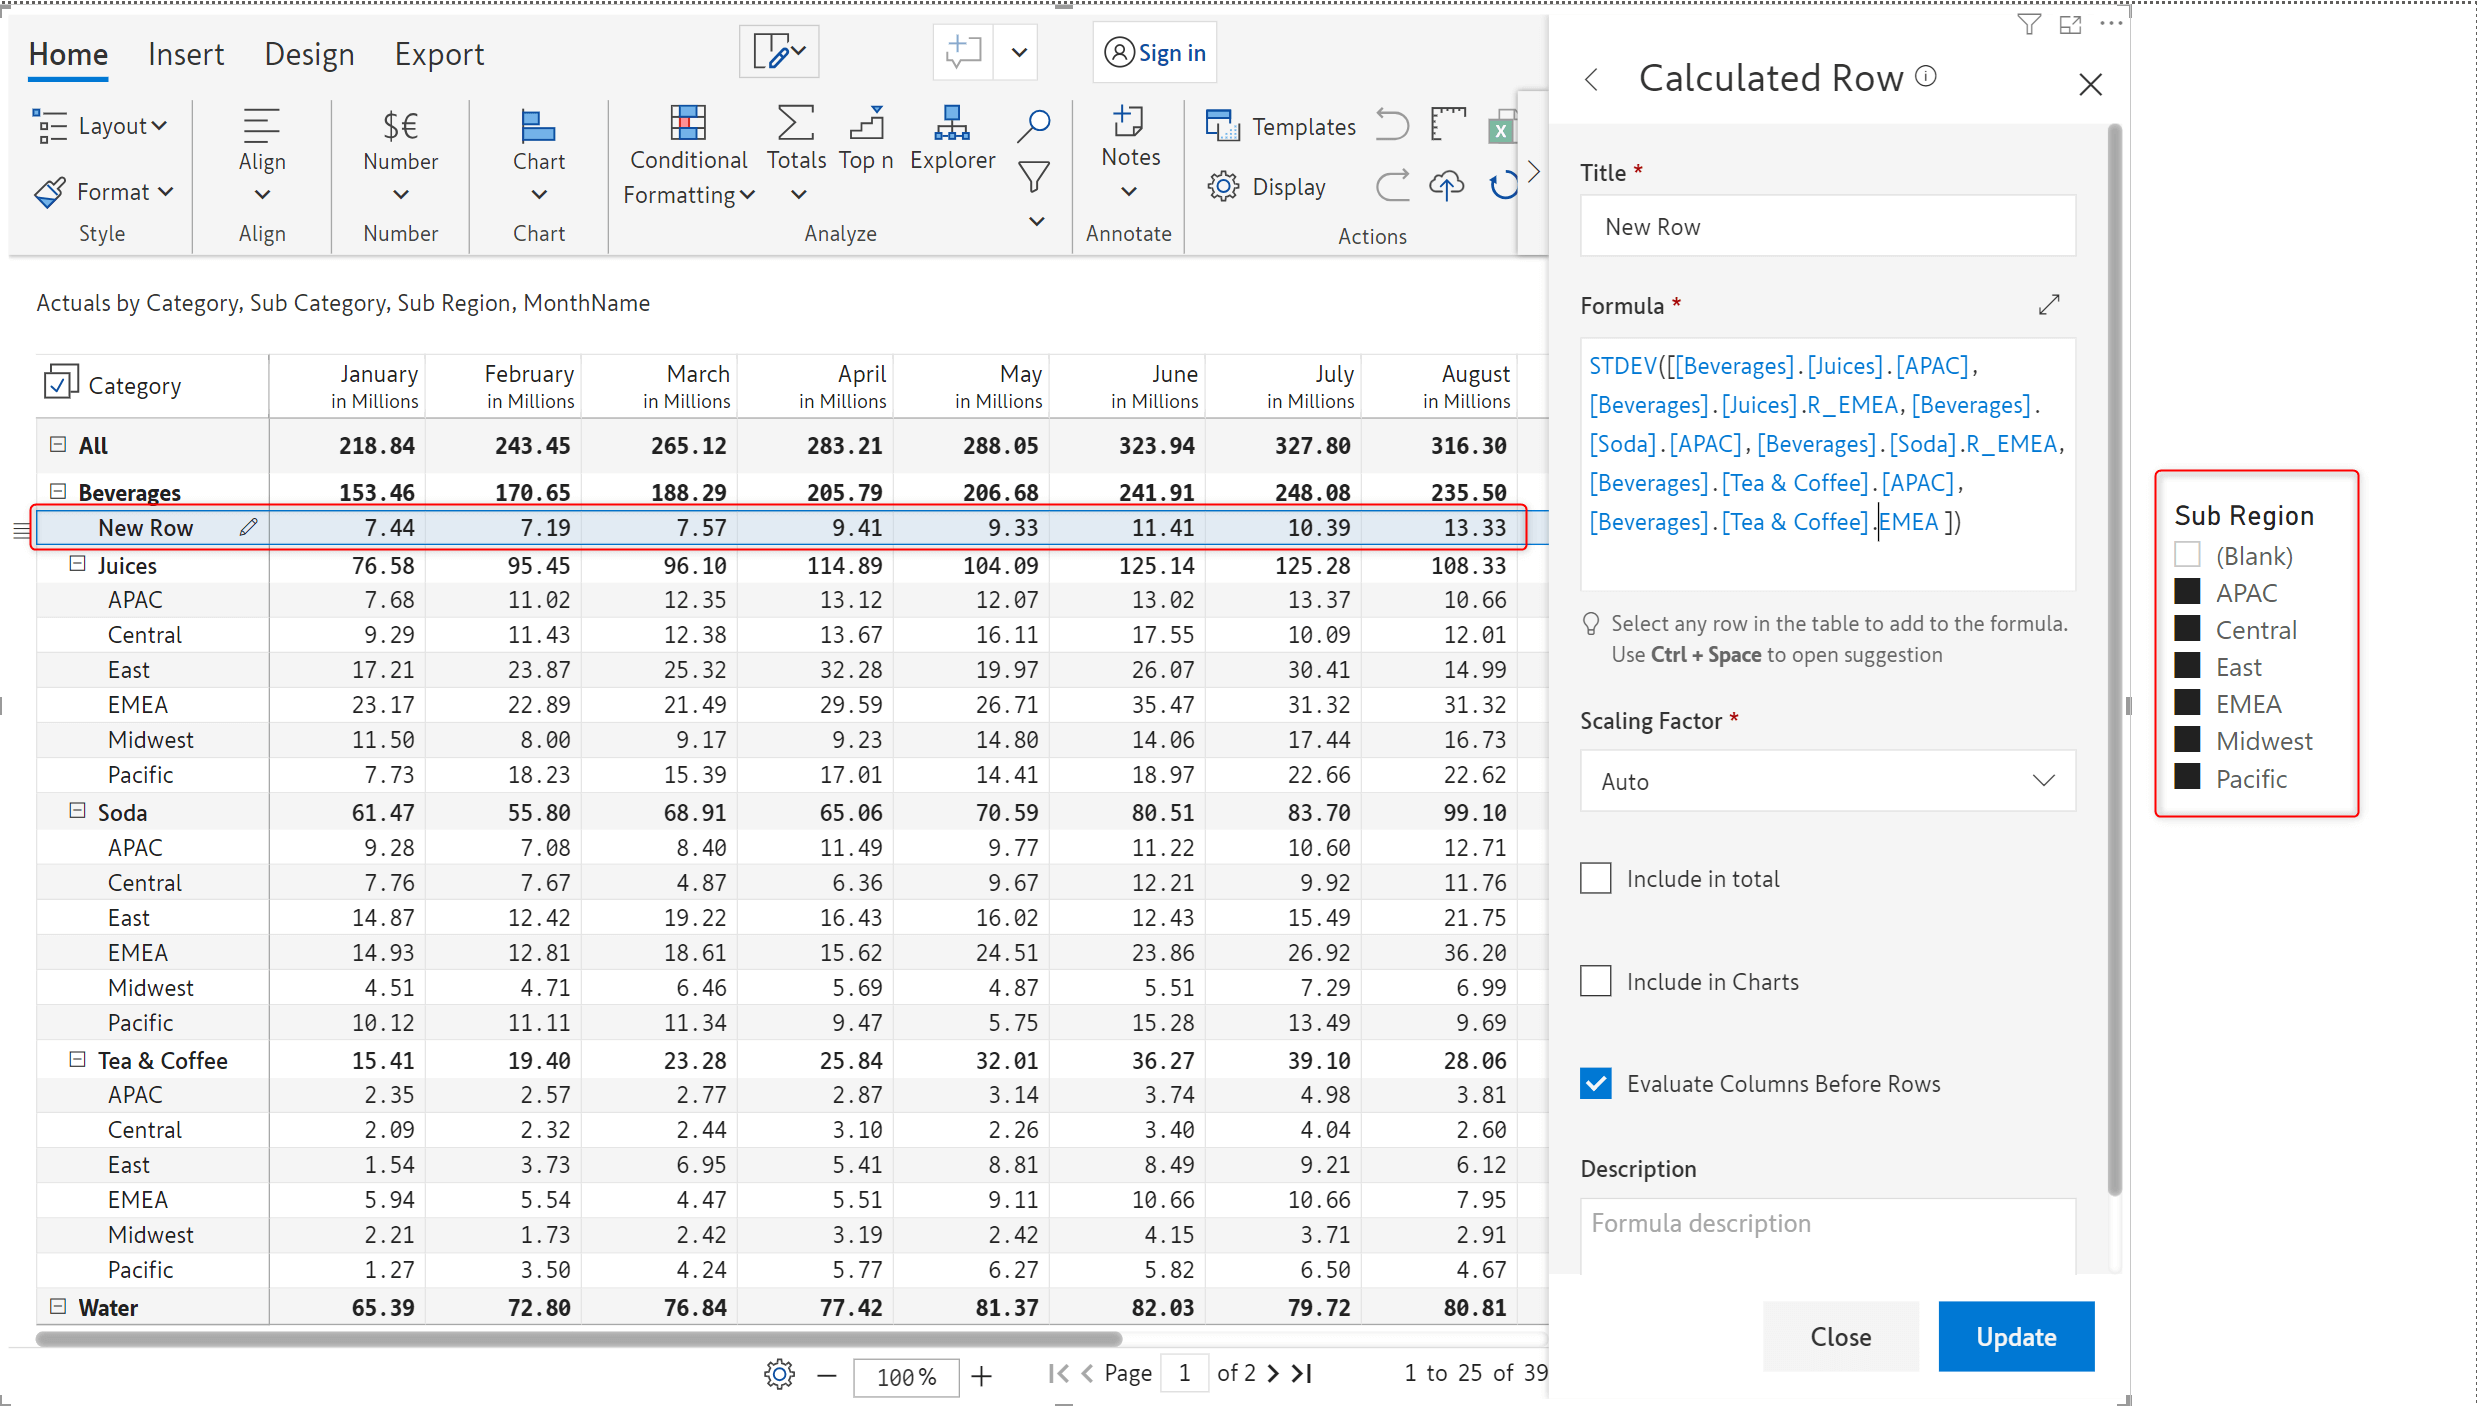
If EMEA data is not available, the calculation will still work seamlessly in the report without throwing errors.
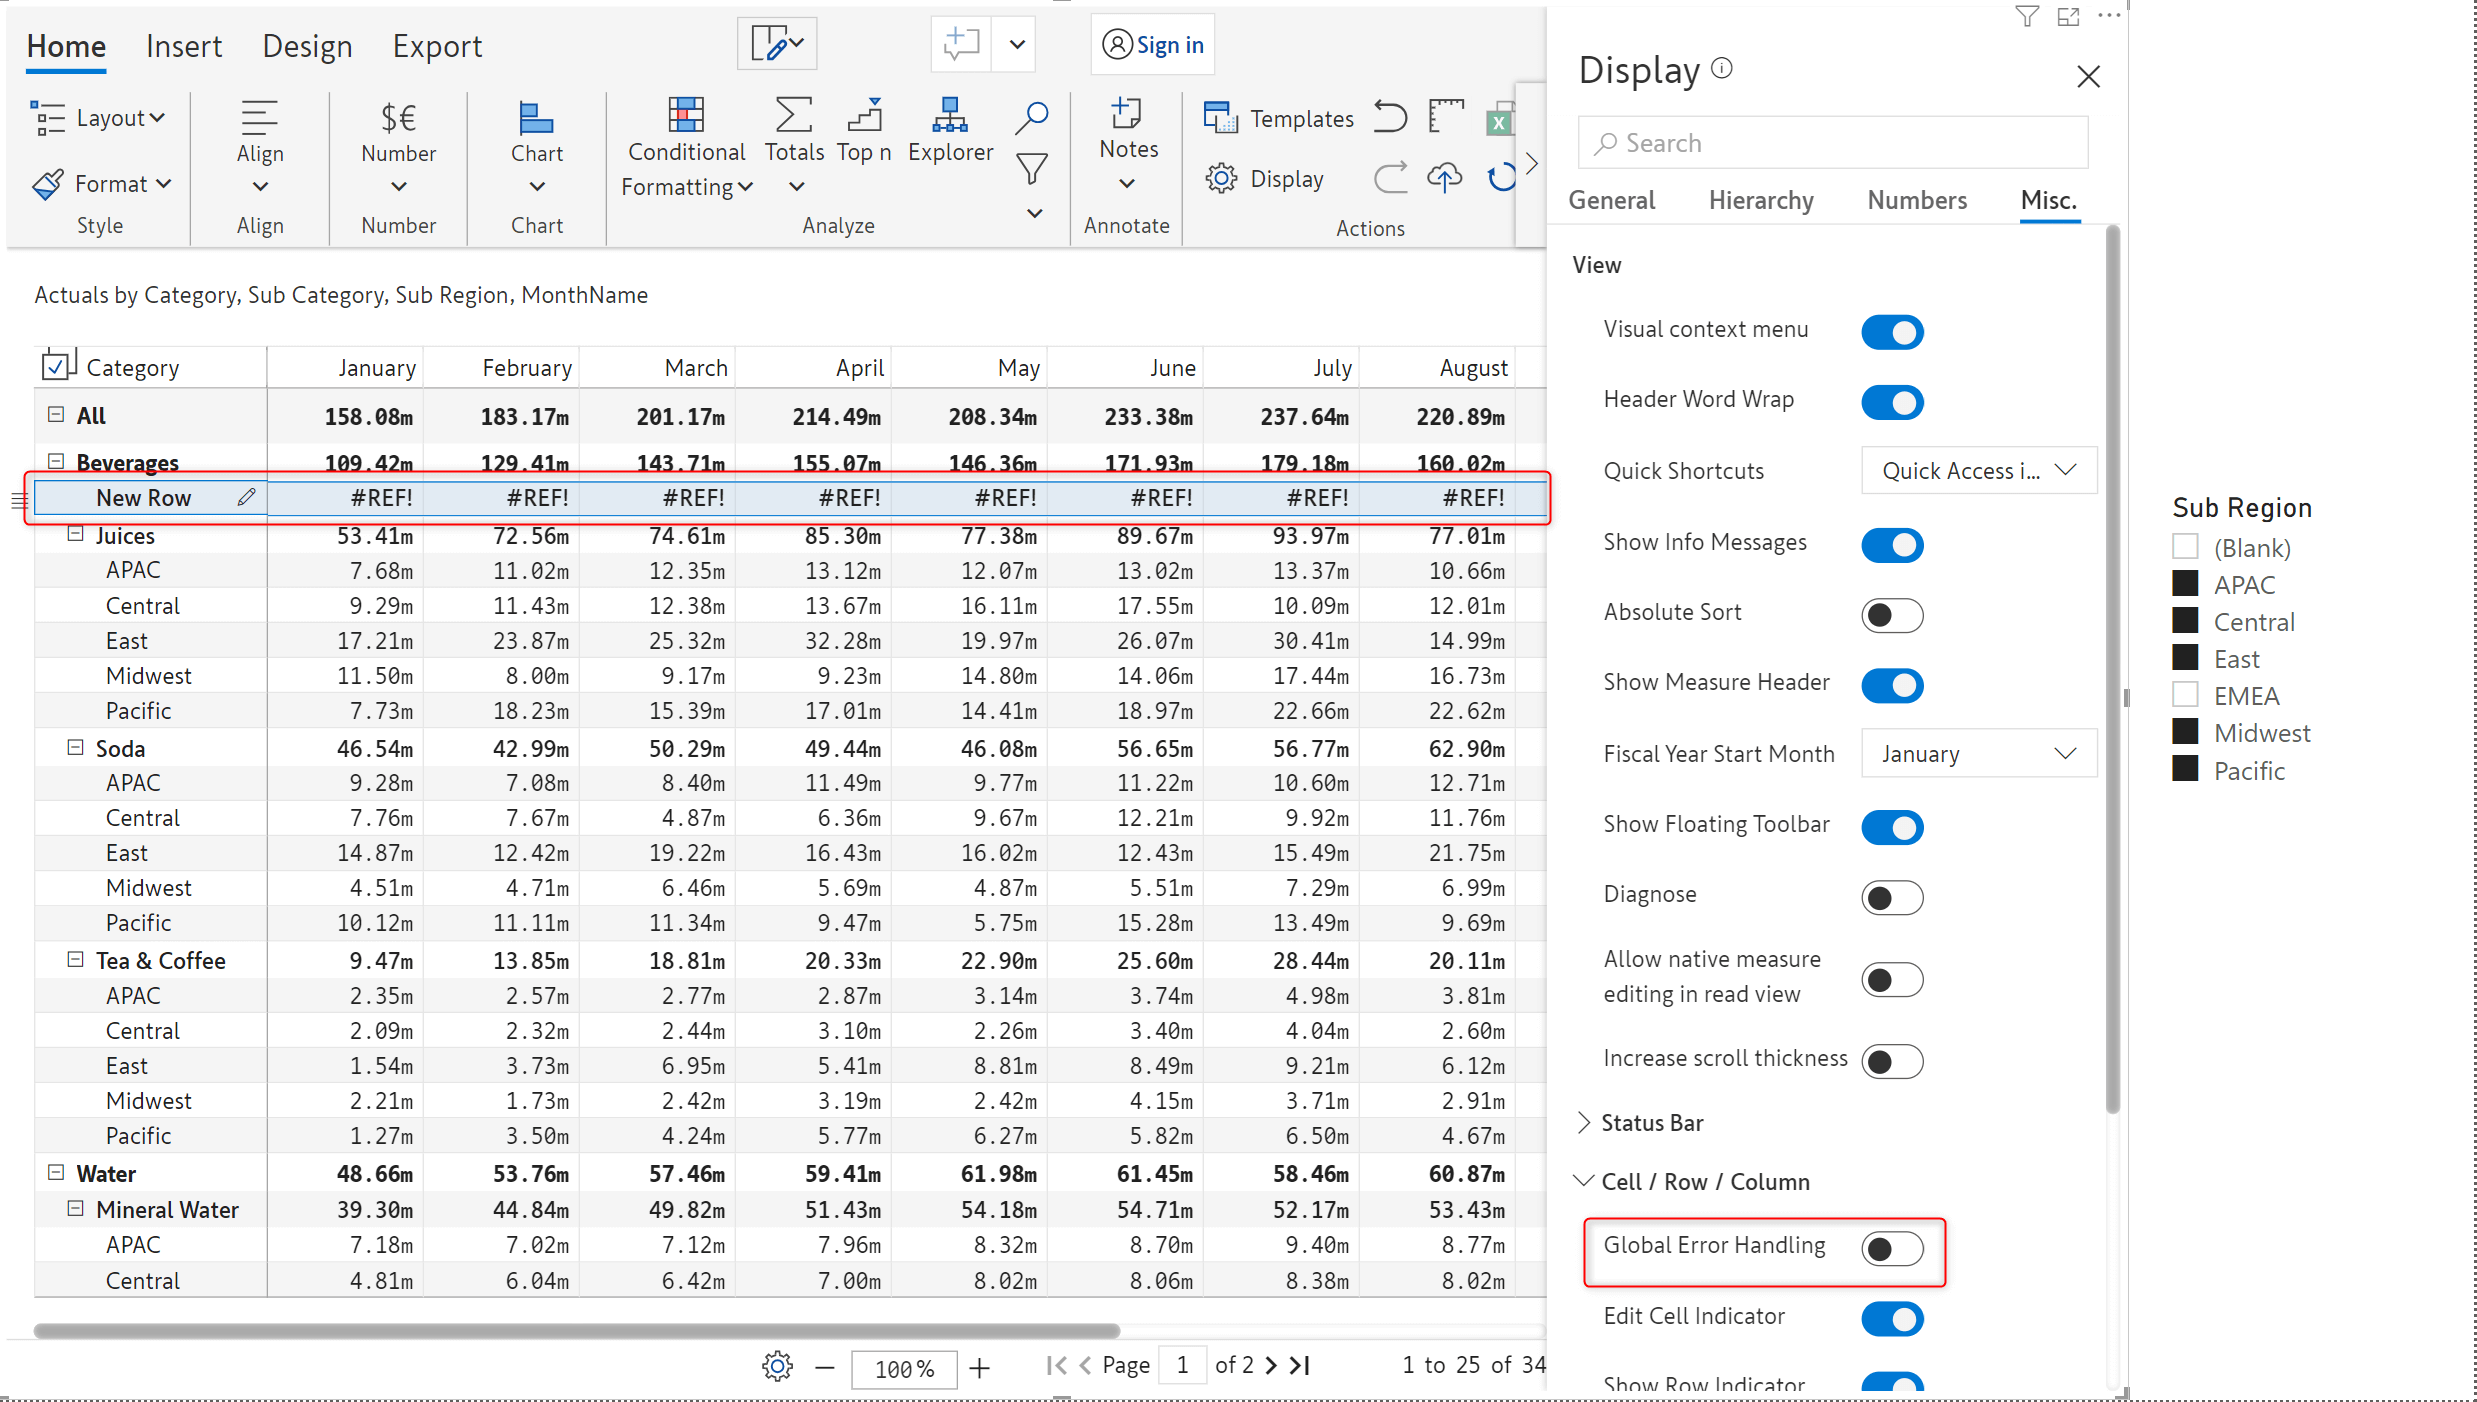
Notice how a missing reference error is displayed when the error handling setting is disabled.
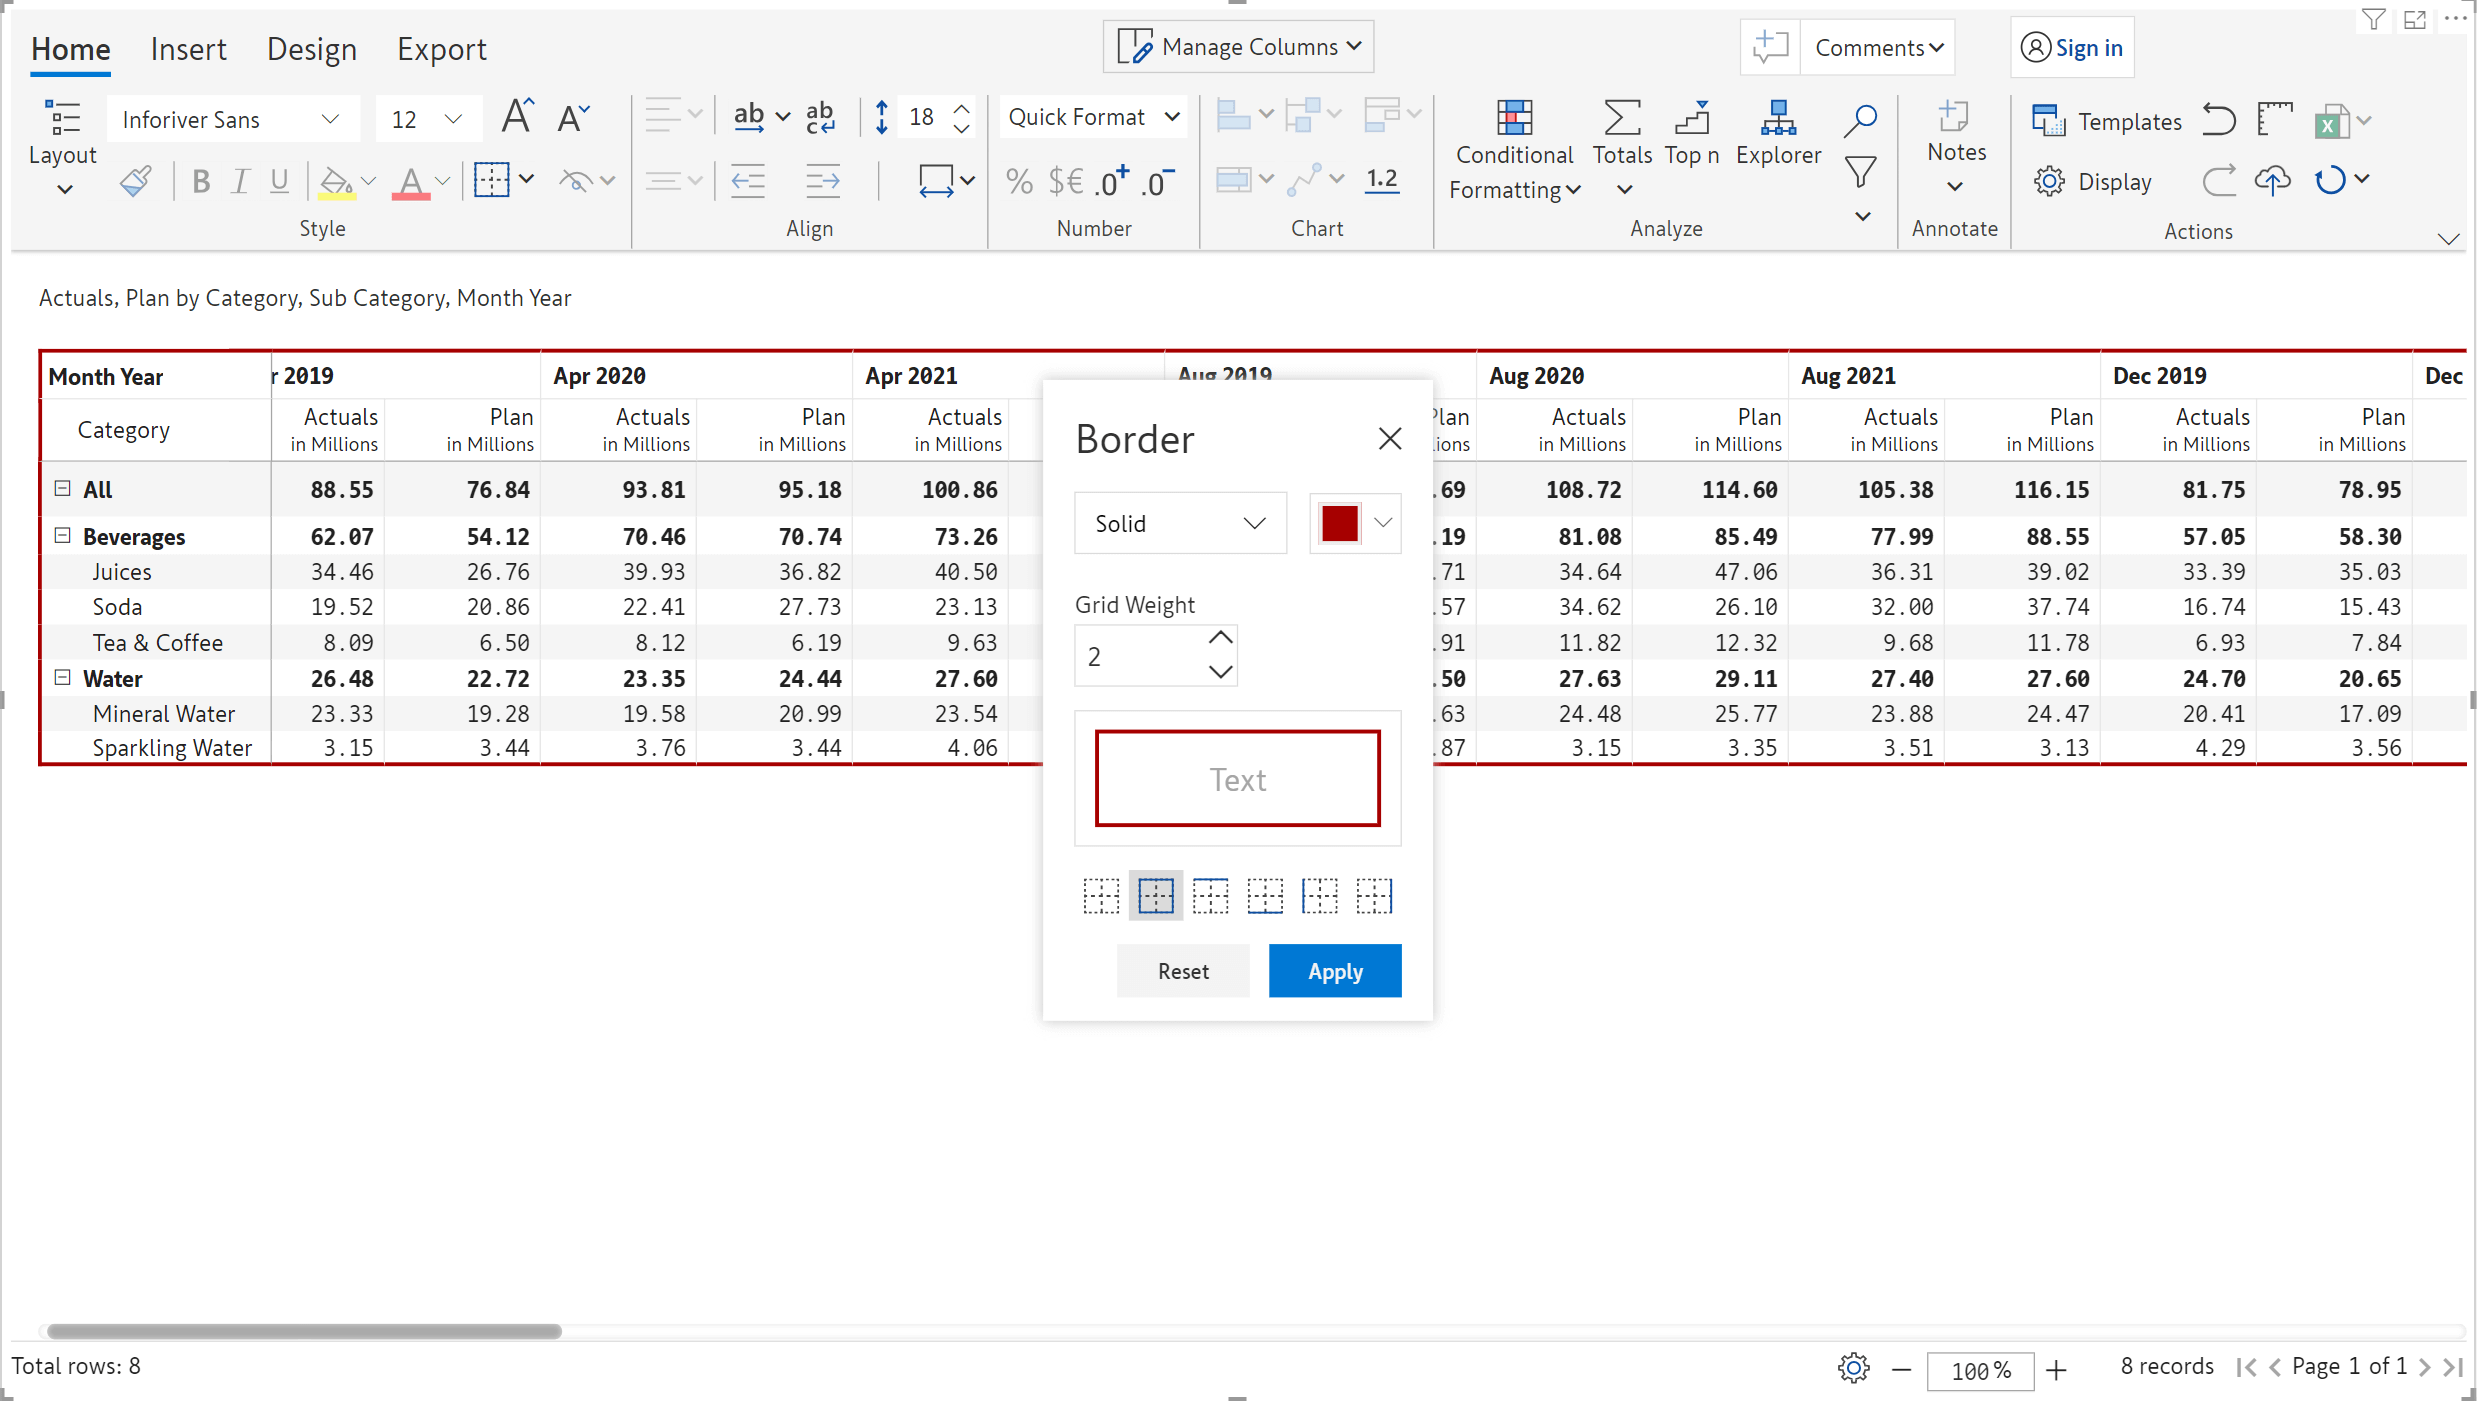
You can apply and customize the borders applied for the entire gird in the report. You can set the colour, thickness, and type of border.
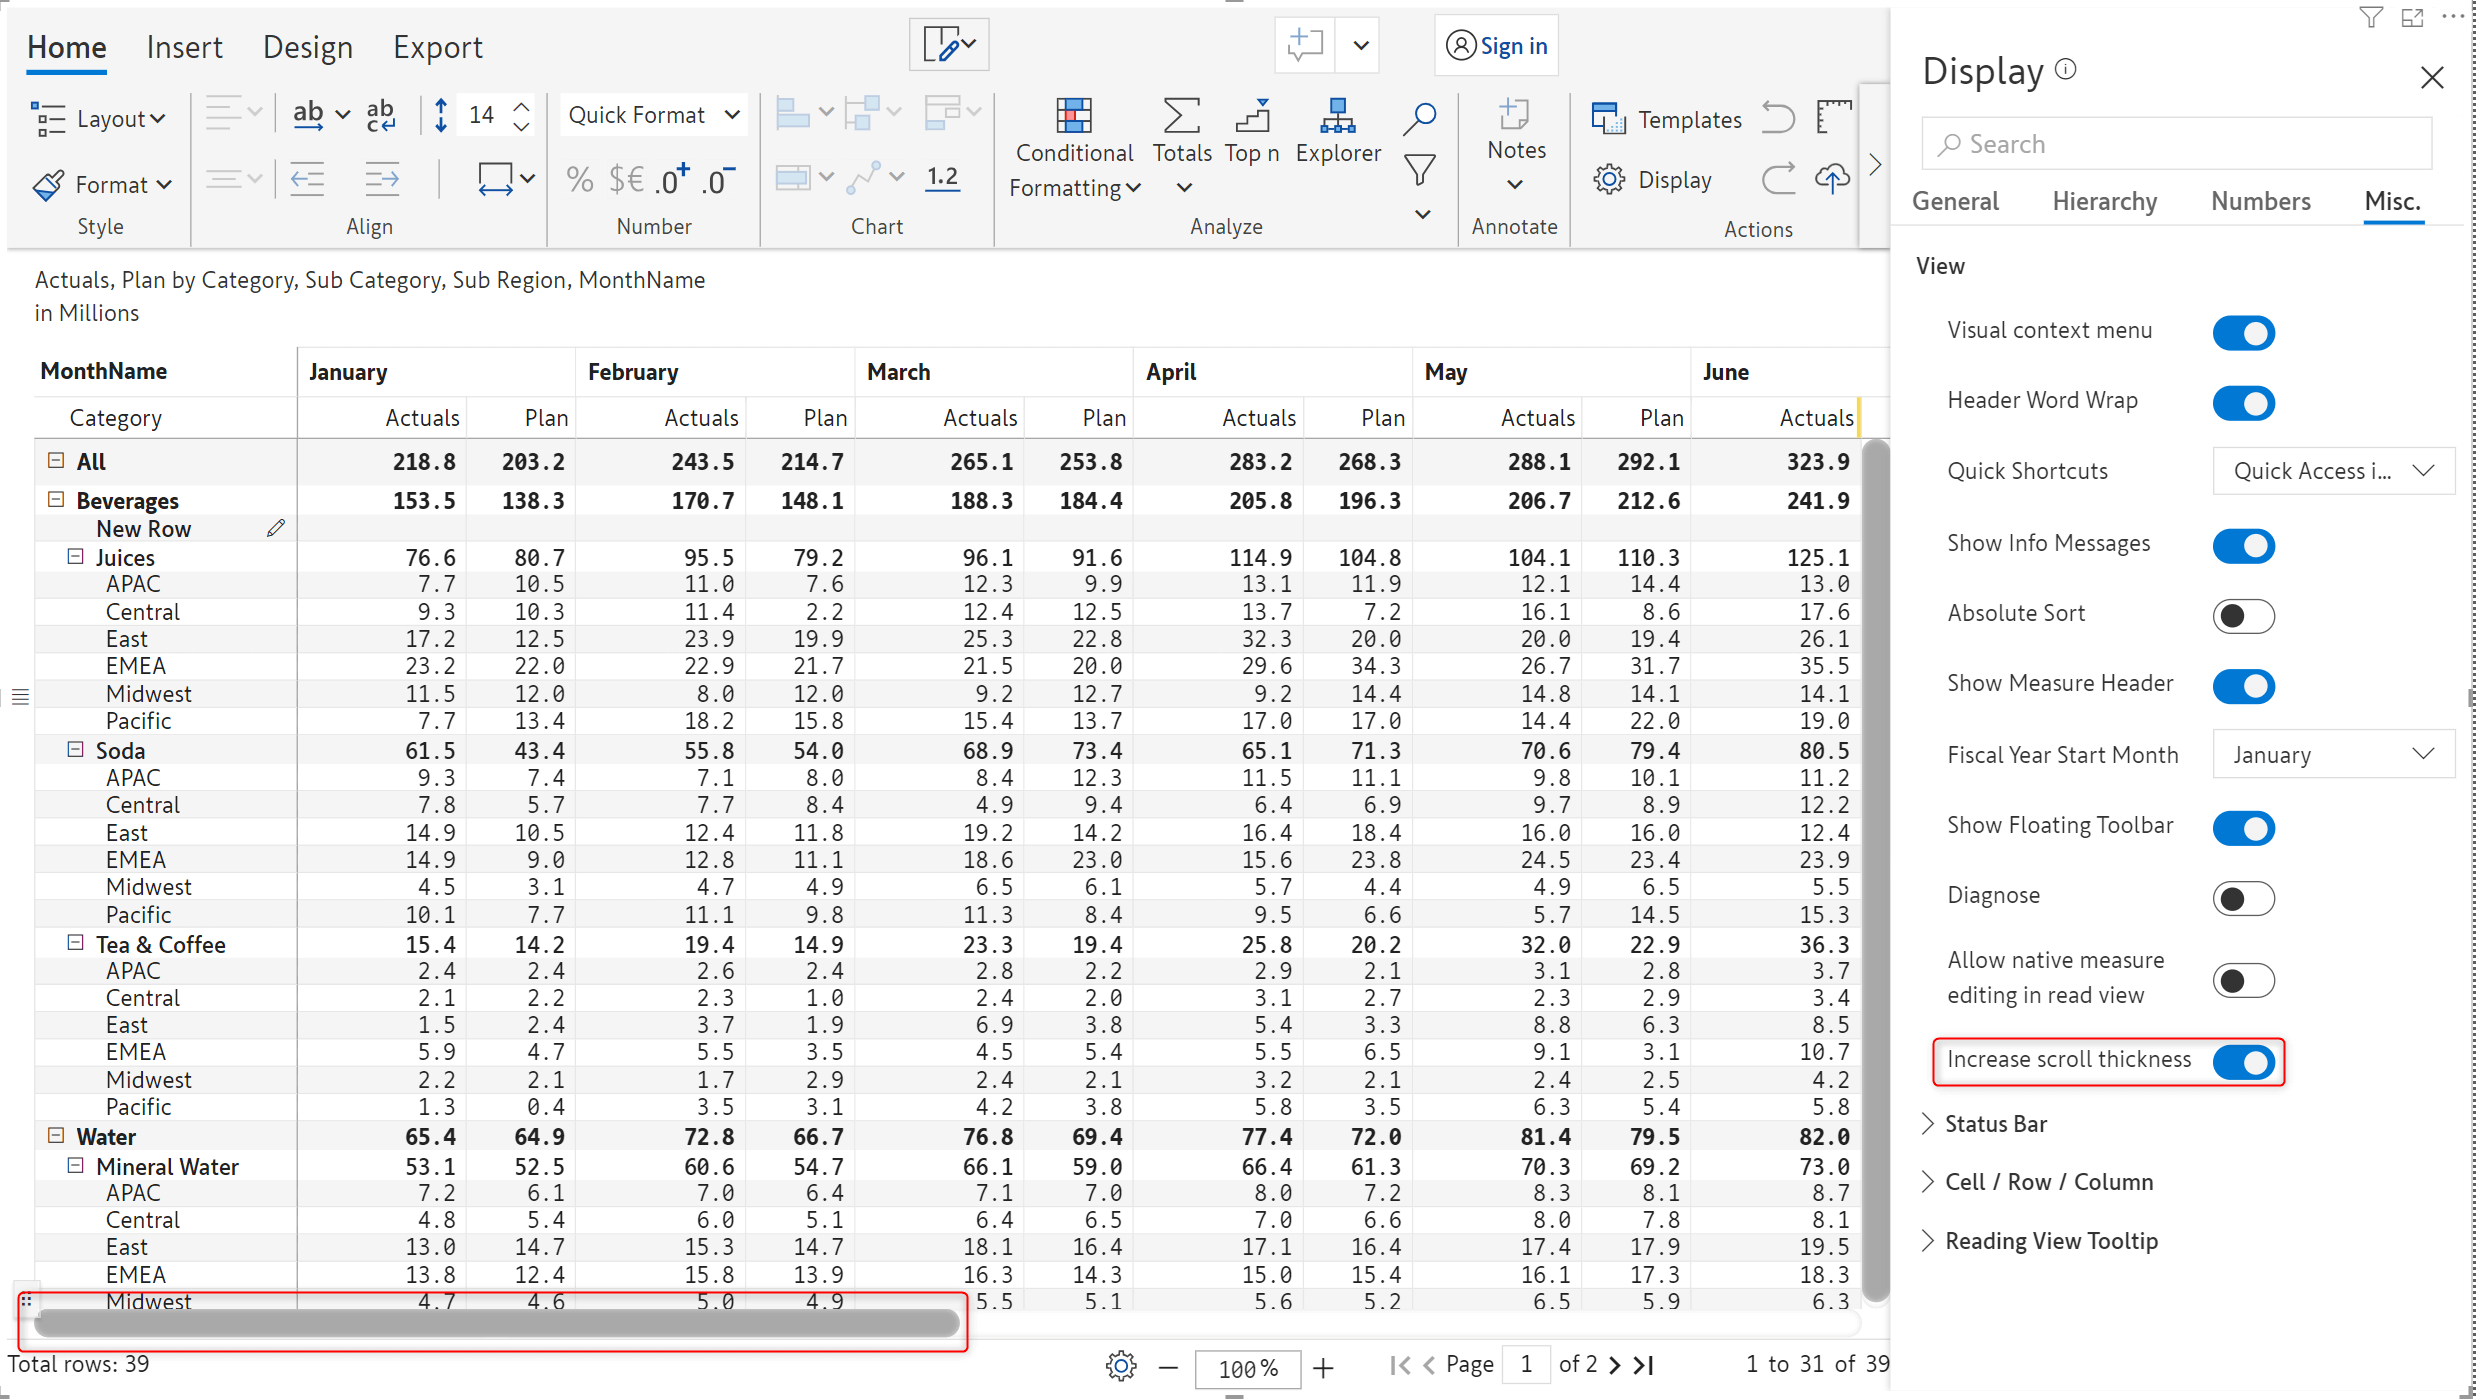
You can smoothly scroll through reports with large volumes of data with the option to increase the width of the scrollbar.
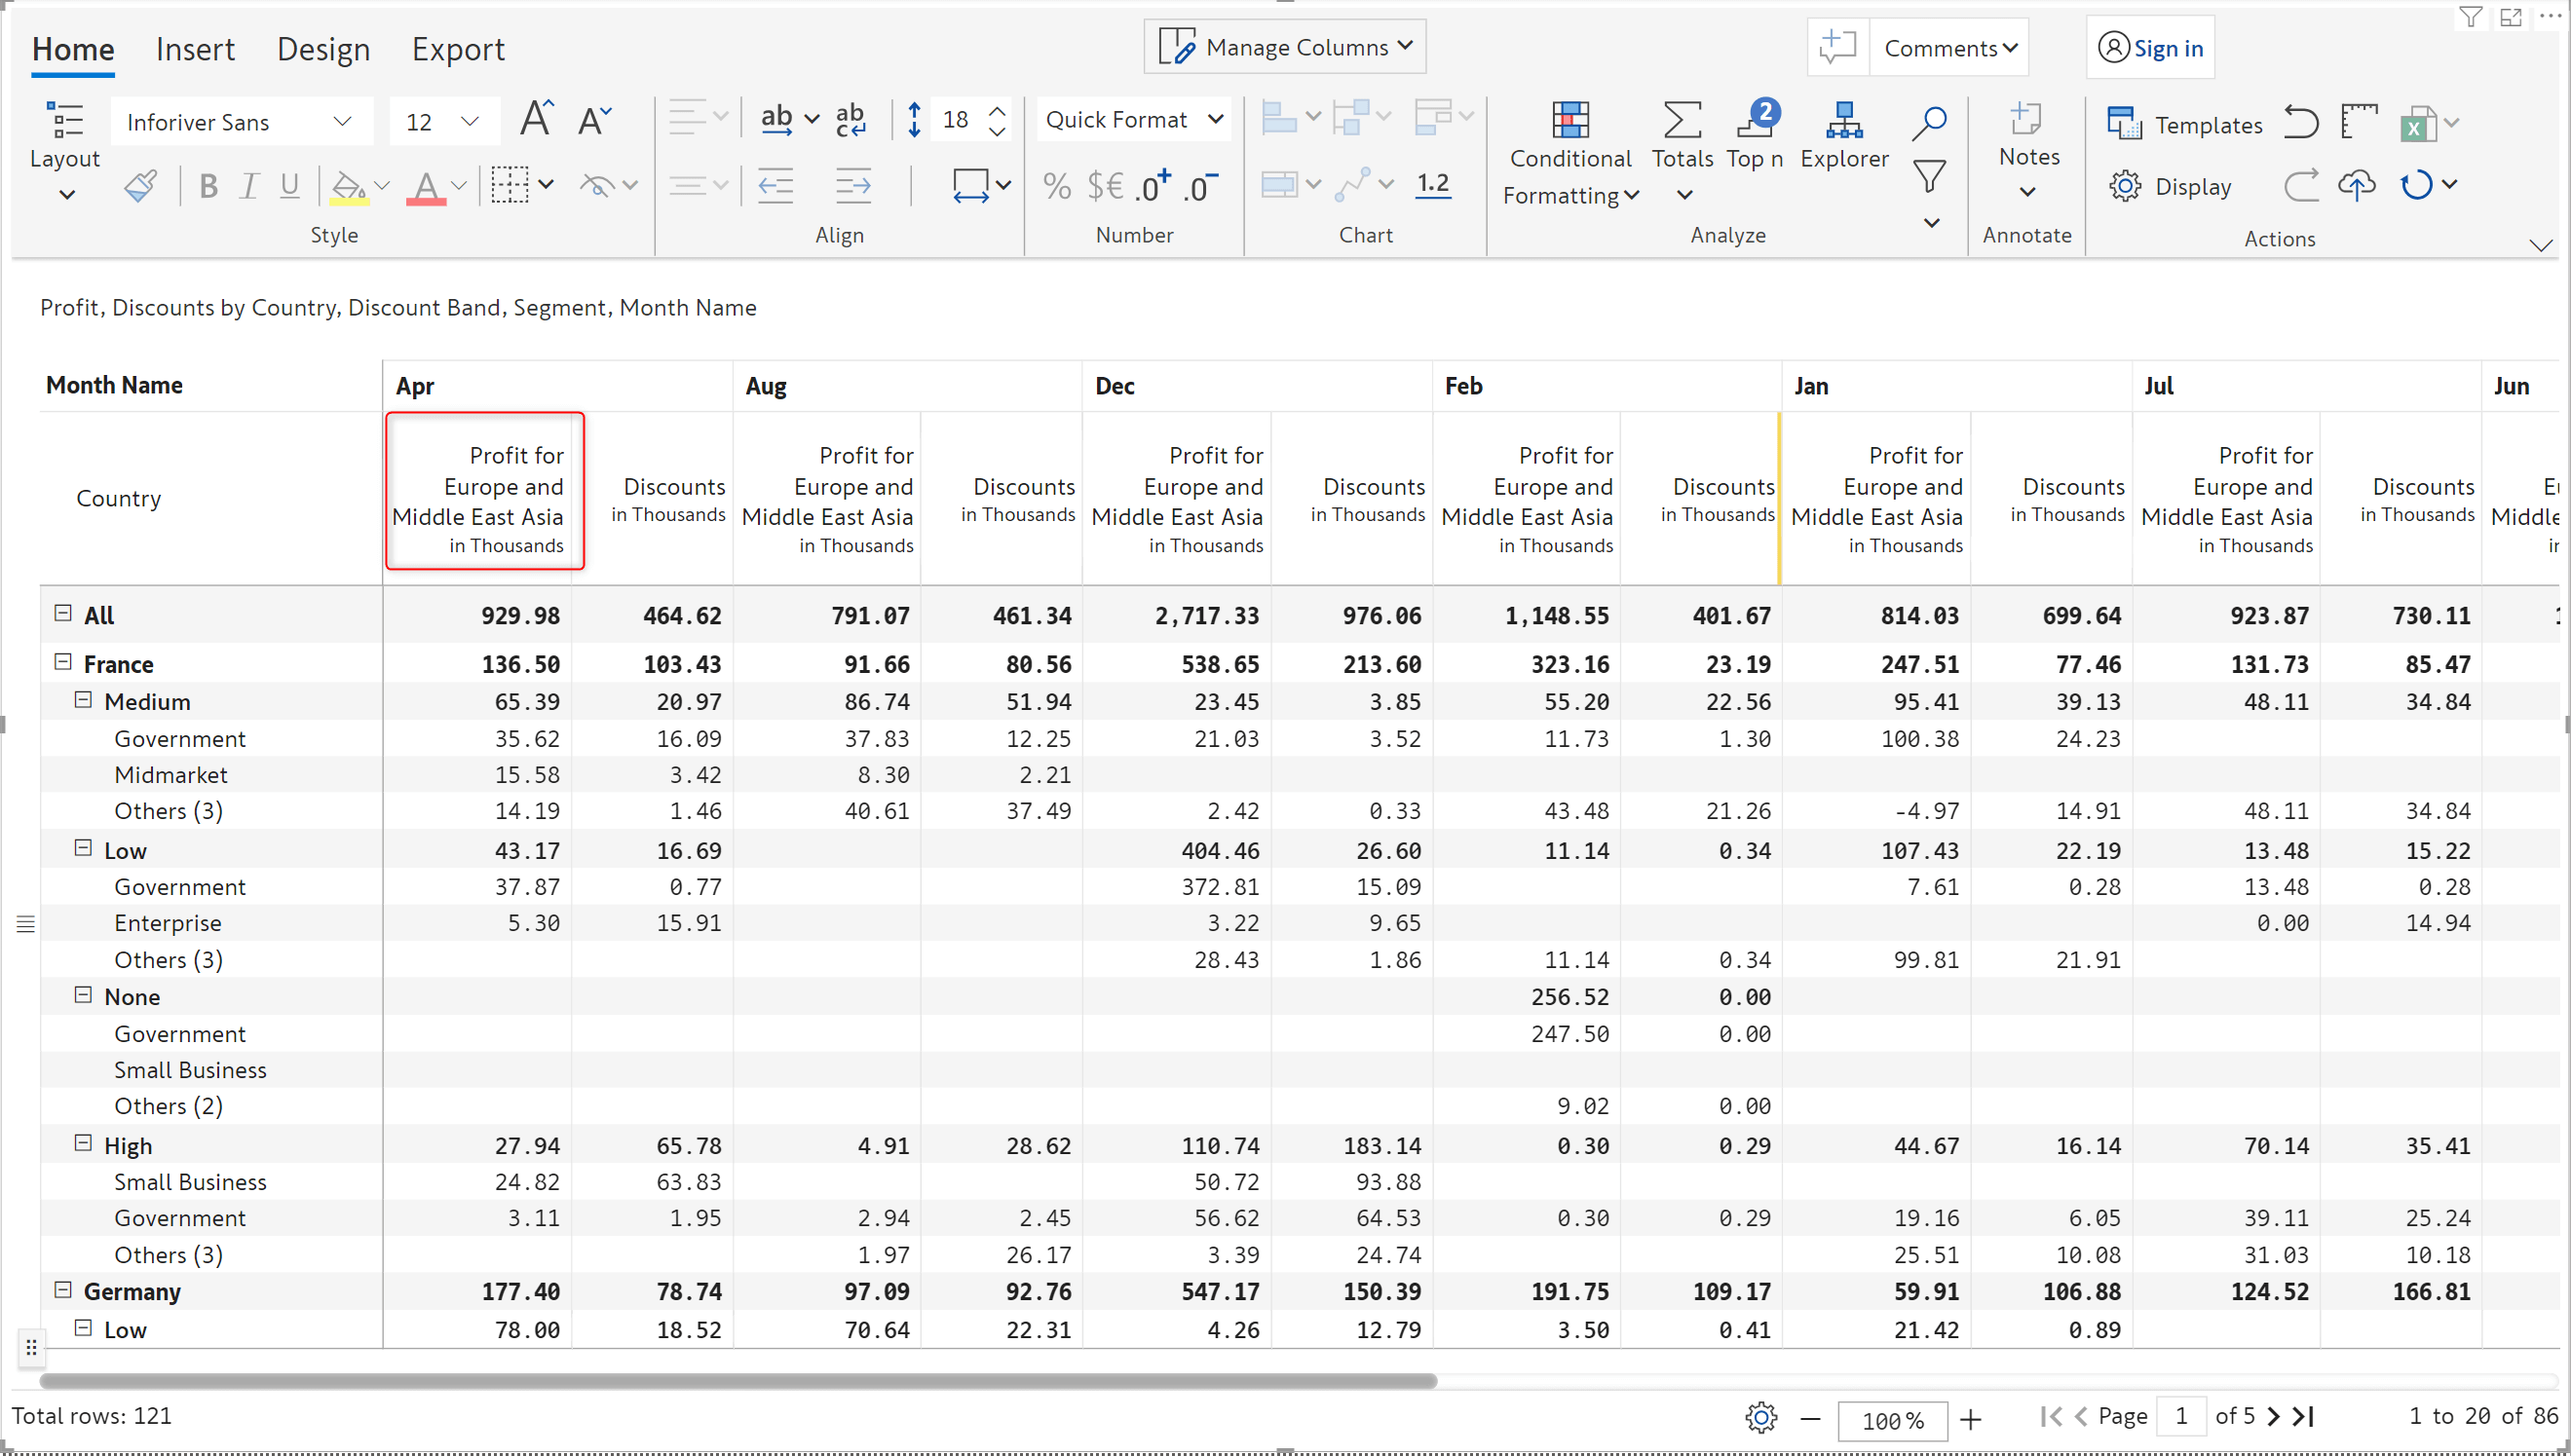
1. Long field header names can be word wrapped and displayed fully.
2. Measure on rows layout has been augmented to support word wrap, auto fit and adding notes.
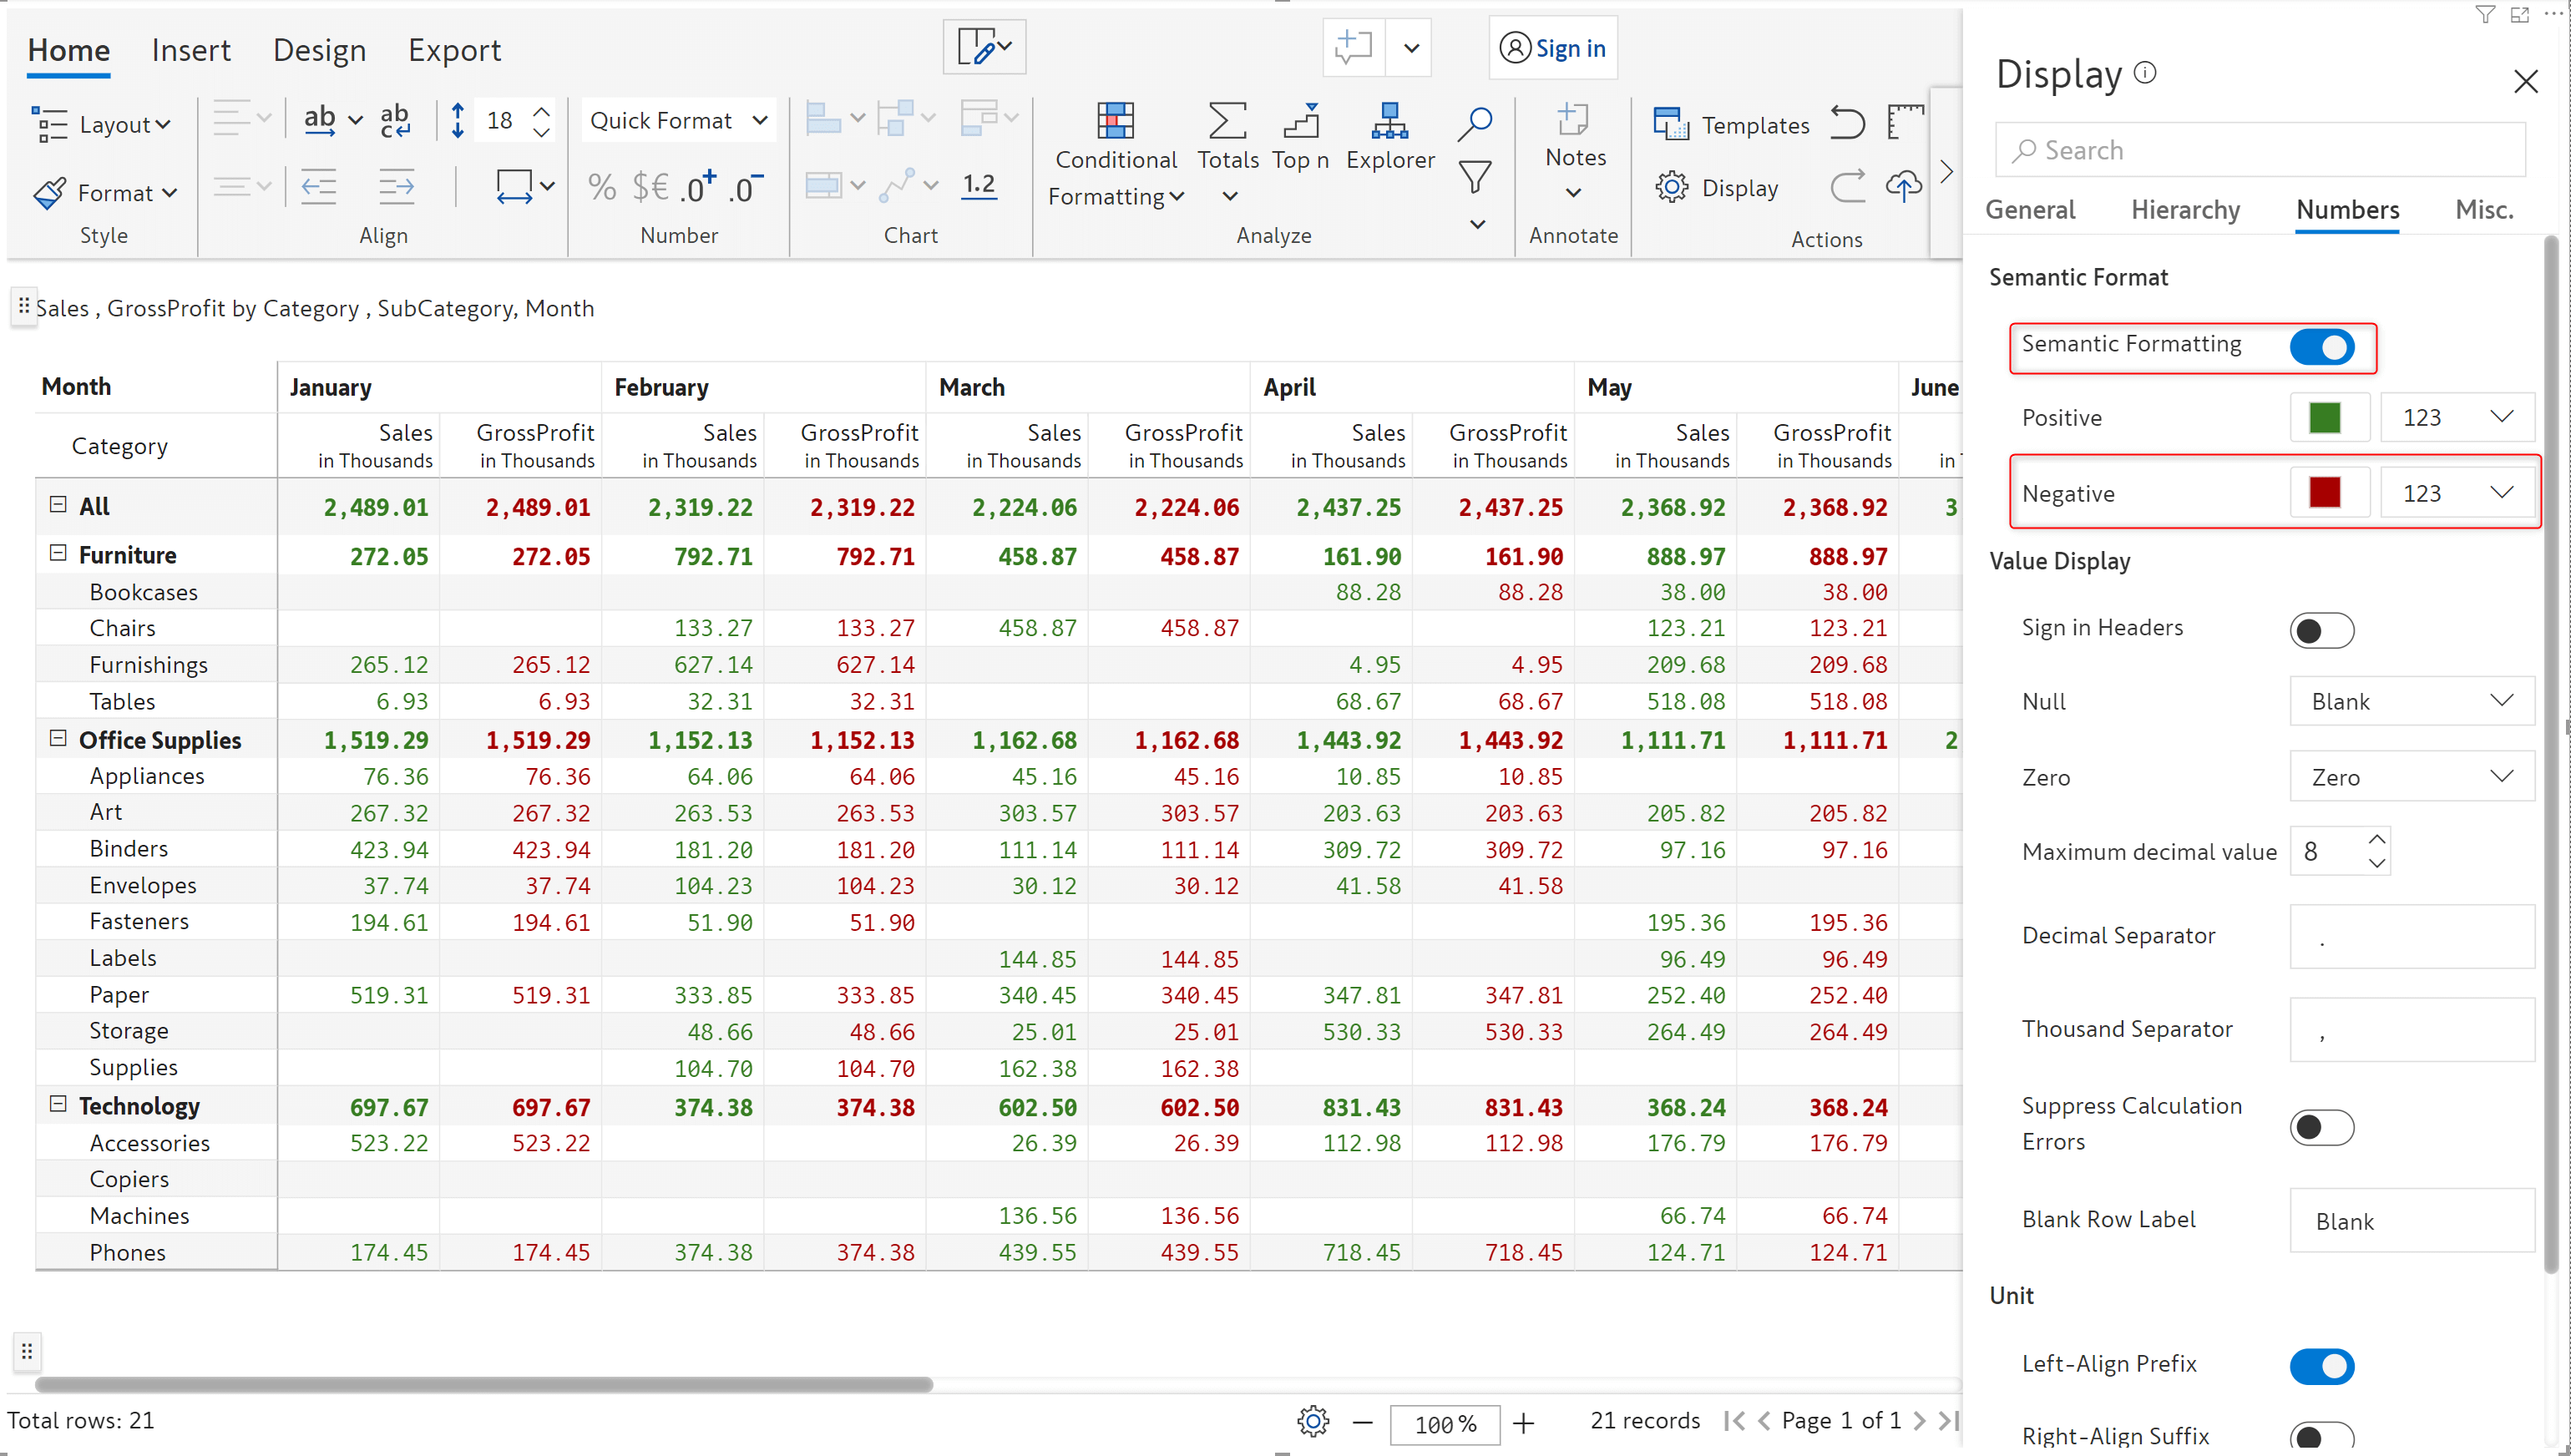
3. The semantic number formatting section has an additional option to display negative values as positive.
Licensing Updates:
A warning message will be displayed for passive and free license users after the number of auditable actions exceeds 15. Any operations beyond the threshold will be allowed but cannot be saved.

Inforiver helps enterprises consolidate planning, reporting & analytics on a single platform (Power BI). The no-code, self-service award-winning platform has been recognized as the industry’s best and is adopted by many Fortune 100 firms.
Inforiver is a product of Lumel, the #1 Power BI AppSource Partner. The firm serves over 3,000 customers worldwide through its portfolio of products offered under the brands Inforiver, EDITable, ValQ, and xViz.