
Upcoming webinar on 'Inforiver Charts : The fastest way to deliver stories in Power BI', Aug 29th , Monday, 10.30 AM CST. Register Now
Upcoming webinar on 'Inforiver Charts : The fastest way to deliver stories in Power BI', Aug 29th , Monday, 10.30 AM CST. Register Now
Typical reports consumed by enterprises contain table / matrix visuals that utilize a few columns (say 10), and a huge number of rows (say, 100, 500, or 2000).
However, it is not uncommon for business users to utilize wide tables (say tables with 365 columns, tracking each day in a year) in spreadsheets and other BI tools. Unfortunately, the Power BI matrix supports only up to 100 columns.
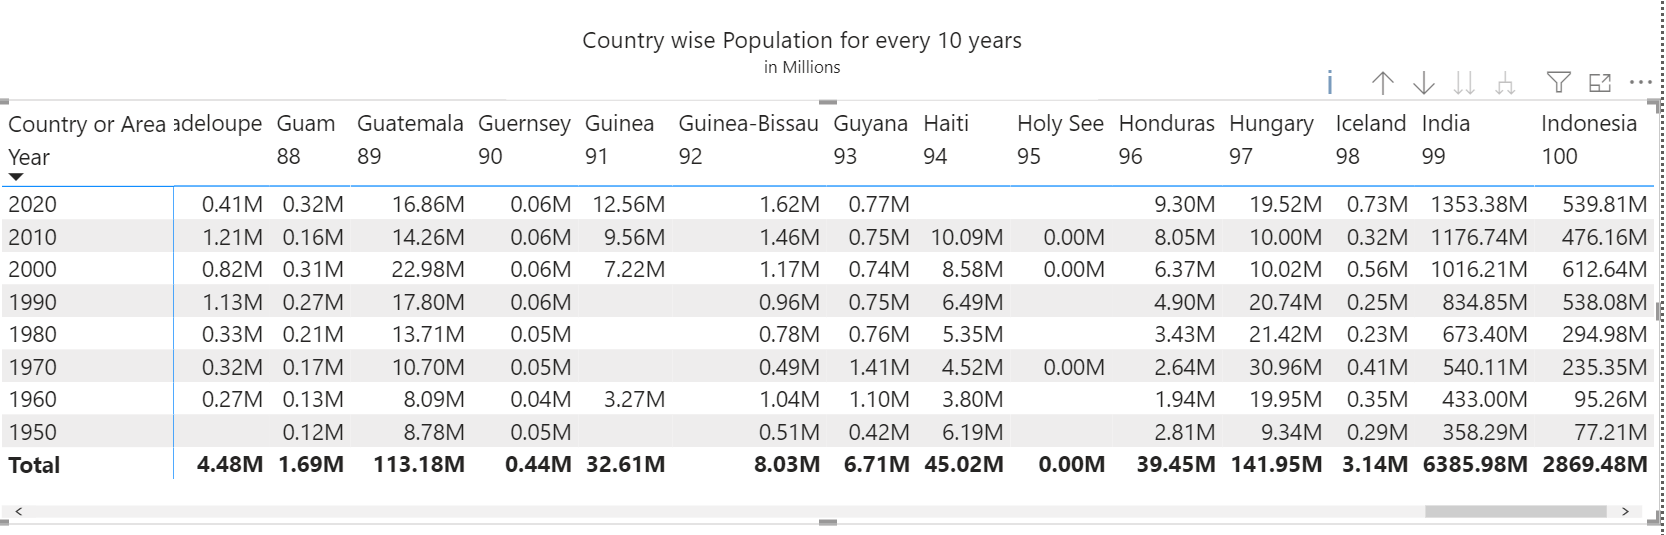
When you cross this threshold, the additional columns get truncated, and an “i” icon appears with a warning message. Here is an example of a Power Bi matrix with a dataset that contains 240 countries.
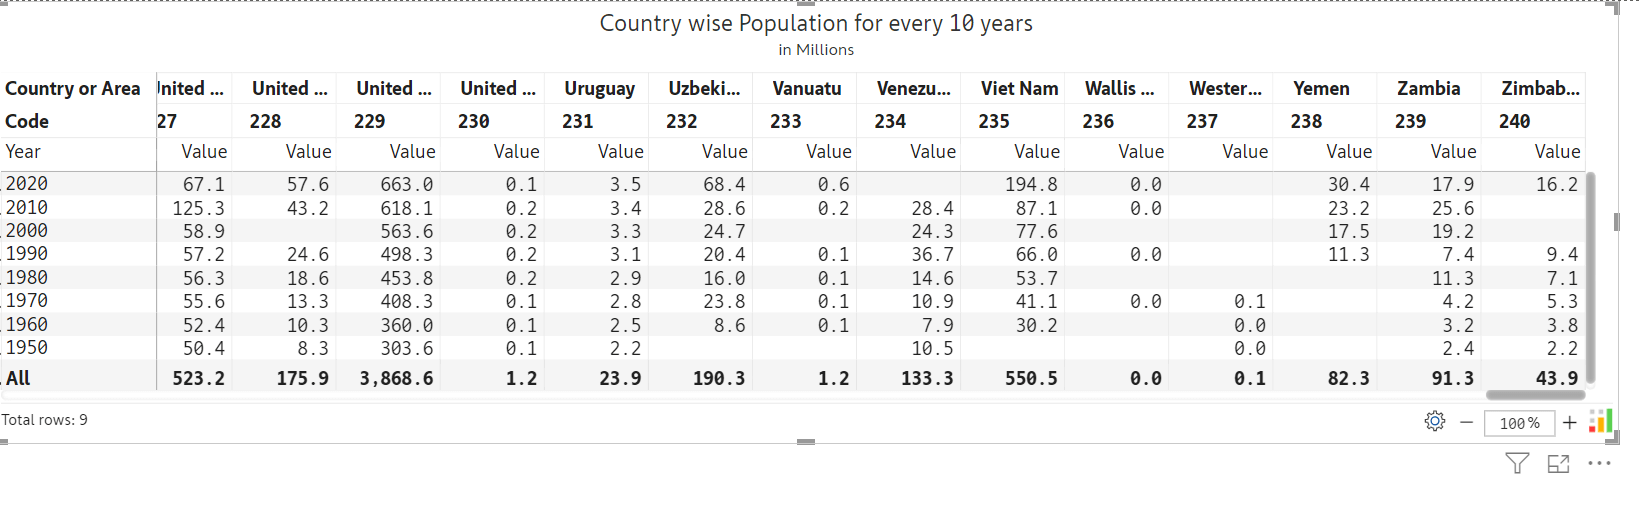
When you render the same data using Inforiver, you get all the countries in the table.
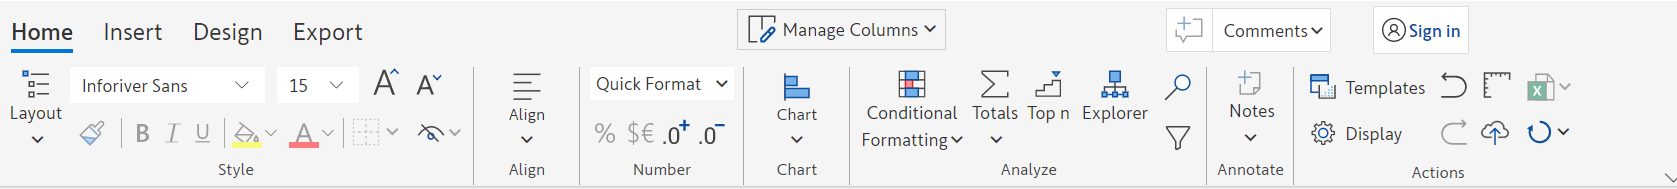
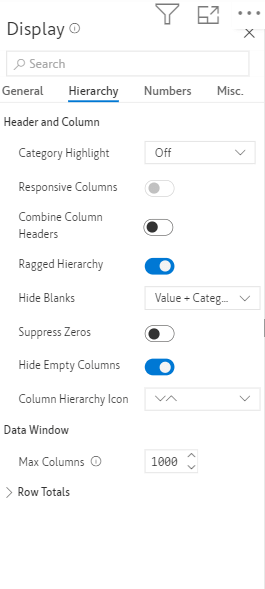
By default, Inforiver supports up to 60 columns. You can go to the Home à Display à Hierarchy and set ‘Max columns’ to up to 1000. (If you do not change this setting, your additional columns will be truncated, and you will see the same ‘i’ icon that you come across in a native matrix visual)
Here is a detailed video of wide table support in Inforiver.
Try out your own wide tables in Power BI using Inforiver.

Inforiver helps enterprises consolidate planning, reporting & analytics on a single platform (Power BI). The no-code, self-service award-winning platform has been recognized as the industry’s best and is adopted by many Fortune 100 firms.
Inforiver is a product of Lumel, the #1 Power BI AppSource Partner. The firm serves over 3,000 customers worldwide through its portfolio of products offered under the brands Inforiver, EDITable, ValQ, and xViz.


