Upcoming webinar on 'Inforiver Charts : The fastest way to deliver stories in Power BI', Aug 29th , Monday, 10.30 AM CST. Register Now
Upcoming webinar on 'Inforiver Charts : The fastest way to deliver stories in Power BI', Aug 29th , Monday, 10.30 AM CST. Register Now
Understanding trends, patterns, and performance over time within an organization’s data is a vital component of data analysis. Whether you’re analyzing sales, website traffic, or user behaviour, mastering time-related calculations can significantly enhance insights.
In this blog post, we’ll explore how time intelligence functions in Power BI can be a powerful tool in gaining meaningful insights. Observing the data trends over a specific period is crucial for making strategic decisions. From year-to-date sales to rolling averages, we’ll cover practical examples to help you understand and apply time intelligence functions in Power BI.
Time intelligence functions allow you to manipulate and analyse data based on time-related contexts. They empower you to gain deeper insights from your data. Here are a few common questions that arise when decision makers need valuable insights:
So, let's demystify these functions with examples:
The Year-To-Date calculation is fundamental for tracking cumulative performance over the course of a year. It aggregates a metric from the start of the year up to a specified date. It is useful for analyzing metrics such as sales, revenue, or any other metric within the current year, especially to track the cumulative performance over time. The YTD calculation is commonly used in finance, business, and other fields to assess performance over time. By aggregating data from the start of the year to the present, we gain insights into overall progress.
Suppose we’re analyzing Sales Data for a product. We have an “OrderDate” column (representing the date of each order) and an “OrderAmount” column (representing the sales amount).
To calculate YTD sales, we sum up the sales from January 1st to the current date. We use the DAX Expression – TOTALYTD. Here is an example,

The TOTALYTD function takes two arguments: The metric which in this case is (′Sales′[OrderAmount]) which we want to aggregate. The date column is the ′Date table′[OrderDate]) which defines the time. The above expression computes the cumulative total from the start of the year up to the specified date.
The YTD sales value shows how well the product has performed up to the current date. It considers seasonality, growth, and any fluctuations over time.
In summary, the YTD calculation helps us track cumulative performance, identify trends, and make informed decisions based on aggregated data. Remember that the YTD approach is flexible and can be adapted to various metrics and time frames.
Similarly, DAX functions like TOTALMTD and TOTALQTD are used to evaluate the value of the expression for the month-to-date, and quarter-to-date, in the current context respectively.
Year-over-year (YOY) analysis is a useful calculation commonly used in data analysis and financial reporting to compare a specific metric or performance indicator such as sales, or profit between two consecutive years.
YoY comparisons allow you to assess whether a particular measure (such as sales, revenue, or profit) has increased or decreased from one year to the next. By comparing the metrics for the same period (e.g., Q1 of this year vs. Q1 of the previous year), you can identify KPIs and understand overall growth or decline.
For example, the YoY growth percentage can be used to evaluate the success of marketing campaigns, year-to-year revenue, etc. Here is the DAX implementation of this concept,
Using DAX, you can create YoY measures using SUM, CALCULATE, and DATEADD.
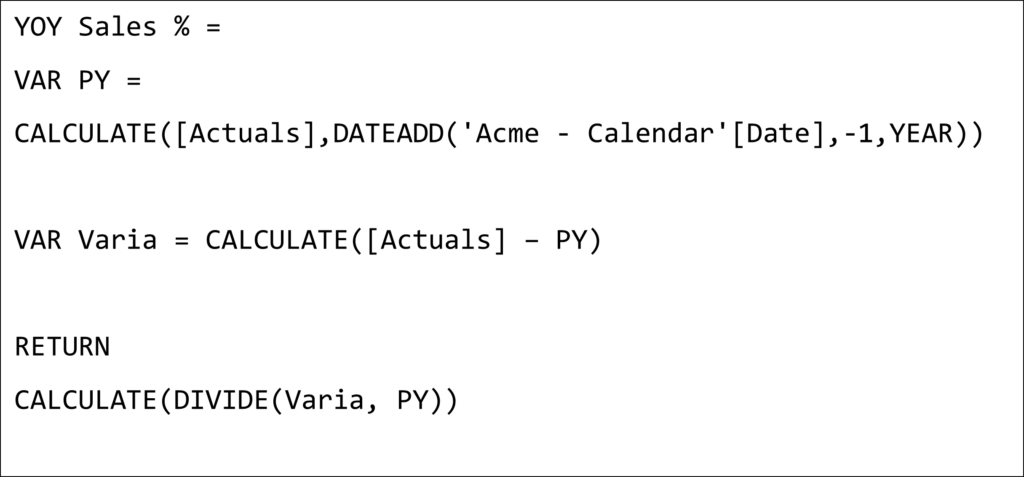
Here’s an example of a YoY Sales percentage:
To calculate the YoY Sales percentage, we first calculate the year-to-date sales using TOTALYTD:

Now we will calculate the prior year's sales using DATEADD:

Now we create a measure to calculate the YoY sales percentage:
Rolling averages or moving averages, are ideal for smoothing out the short-term fluctuations in the data and identifying long-term trends. Power BI has powerful time intelligence DAX functions to calculate the rolling averages effectively. To understand the rolling averages, in the below example, we will be calculating a 10-day rolling average. Let’s assume you have a sales table with a ‘Sales’[OrderAmount] column and you want to calculate a 10-day rolling average of sales.

First, we create a measure to calculate the total sales:
Now, we calculate the rolling averages using the ‘CALCULATE’ and ‘DATESINPERIOD’ functions. The DATESINPERIOD is an important time intelligence function that defines the date range and CALCULATE applies the total sales calculation over this range.
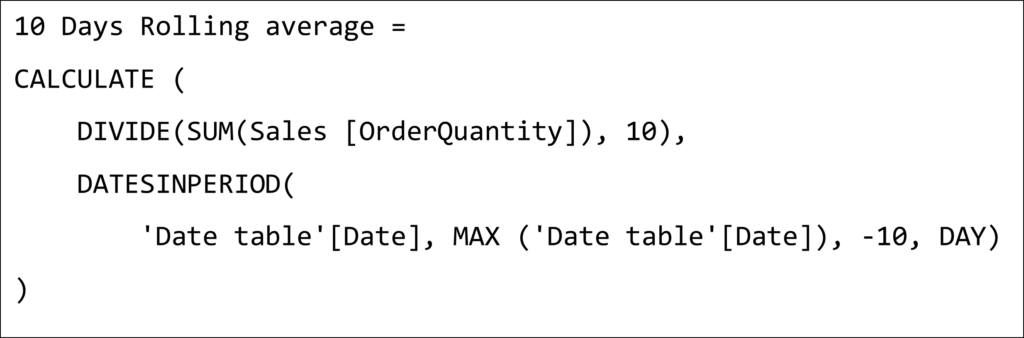
In the above DAX query, DATESINPERIOD creates a date range starting from the maximum date in the current context and going back to 10 days.
Running totals or cumulative totals are essential for analyzing patterns and trends. They help in understanding the accumulated values of a metric up to a certain point in time. A running total sums up the values of a measure up to a given date, providing a cumulative view of the data. For example, a running total of sales up to a specified date shows the aggregate sales from the beginning of the period to that date. Running totals are particularly useful for financial reporting, progress tracking, etc.
To calculate a running sales total, we assume a sales table with a ‘Sales’[OrderDate] column. We use CALCULATE and DATESBETWEEN functions to create a running total measure. The DATESBETWEEN function defines the date range from the beginning of the period to the current date in the context.
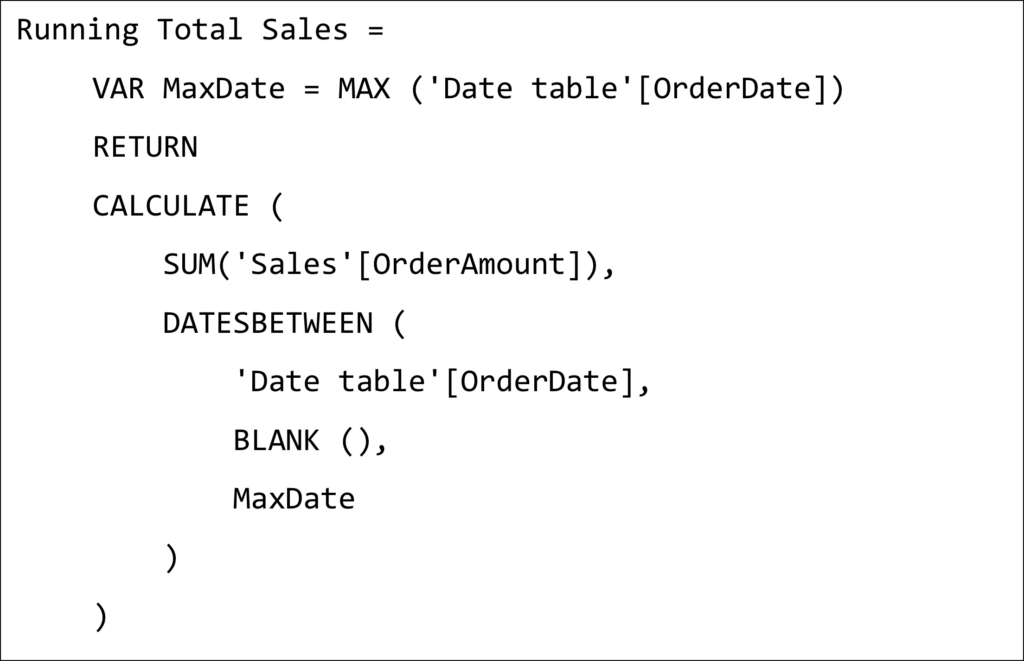
In the above example, MaxDate captures the latest date in the current context. The DATESBETWEEN creates a date range from the start of your data to MaxDate and finally, the CALCULATE sums the sales amounts within this date range.
This measure will dynamically calculate the running sales total up to each date in the sales table.
In conclusion, utilizing time intelligence functions in Power BI can enhance your data analysis capabilities and support better decisions based on better insights. Whether for financial analysis, sales tracking, or inventory management, the time intelligence functions offer a clear view of how values change over time, making them indispensable for comprehensive data analysis.
To learn more about the latest from Inforiver and why we are garnering recognition from industry experts, check out our newest brochure.
Inforiver and all our planning and analytics products continue to be updated to provide a diverse range of users with optimal performance. With continual improvements and innovations planned, we welcome your feedback.

Inforiver helps enterprises consolidate planning, reporting & analytics on a single platform (Power BI). The no-code, self-service award-winning platform has been recognized as the industry’s best and is adopted by many Fortune 100 firms.
Inforiver is a product of Lumel, the #1 Power BI AppSource Partner. The firm serves over 3,000 customers worldwide through its portfolio of products offered under the brands Inforiver, EDITable, ValQ, and xViz.