Upcoming webinar on 'Inforiver Charts : The fastest way to deliver stories in Power BI', Aug 29th , Monday, 10.30 AM CST. Register Now
Upcoming webinar on 'Inforiver Charts : The fastest way to deliver stories in Power BI', Aug 29th , Monday, 10.30 AM CST. Register Now
Power BI is a great tool for creating interactive and insightful dashboards to analyse and visualize your data. However, to maximize the capabilities of Power BI, you need to understand the language of DAX (Data Analysis Expressions), a formula expression language that includes functions, operators, and values to perform advanced calculations and data queries on your data.
This blog post explores some of the DAX tips and tricks that can be used to make Power BI dashboards more effective and user friendly. These tips will help you improve the performance, readability, and functionality of your DAX formulas and measures:
One of the most useful tips for DAX is using variables to store intermediate results into a measure or a column to improve efficiency and performance. Variables can be considered temporary containers that can be used to store values and expressions that can be reused in the DAX formula later. This helps to write complex and efficient calculations, improving performance and decreasing redundant calculations.
For example, suppose you want to calculate the average sales per customer for each product category. You can use a variable to store the total sales for each product category and then use it to calculate the average sales per customer. Here is what the DAX formula would look like:
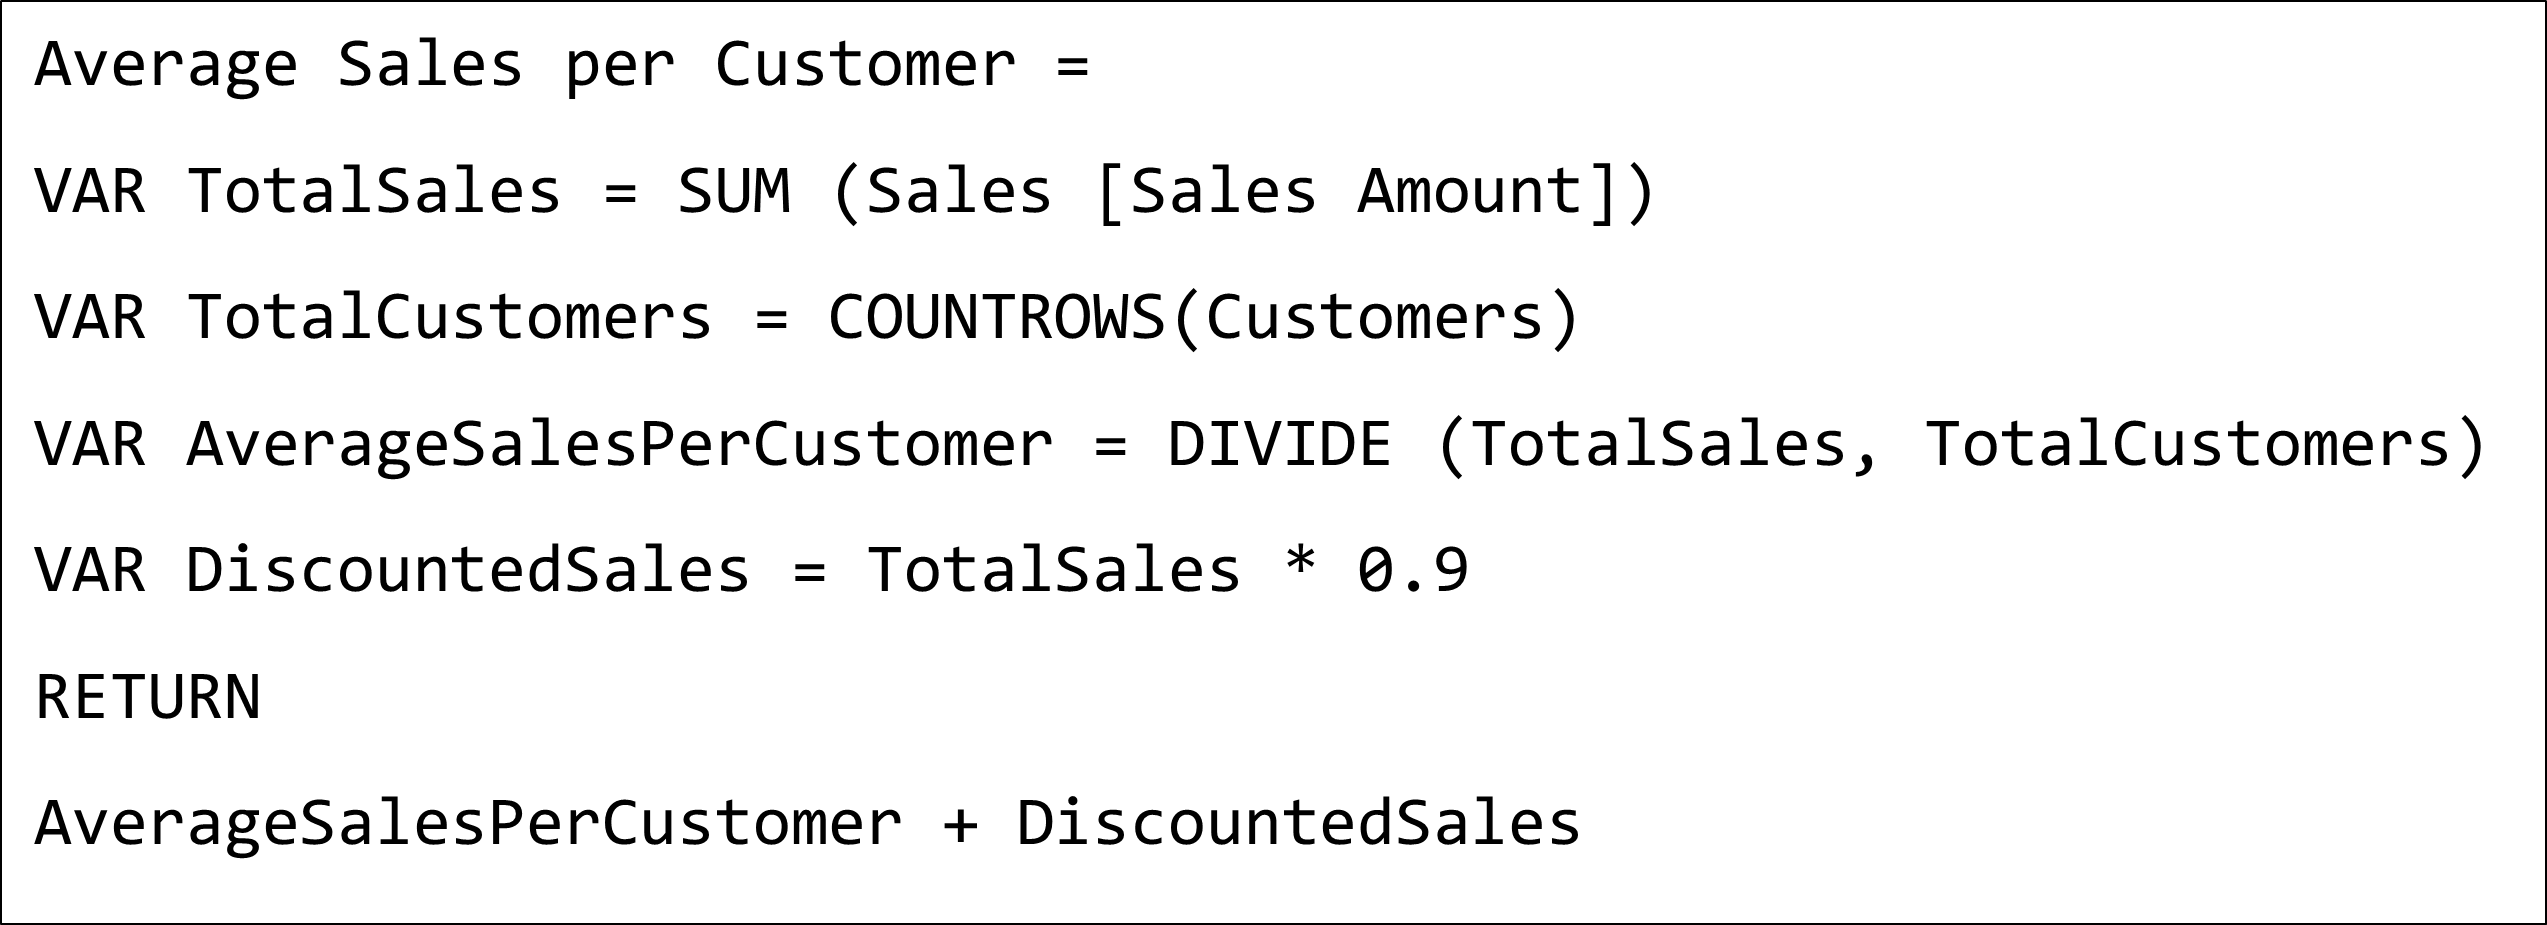
Declaring the variable TotalSales avoids repetition of the same calculation (SUM(Sales[Sales Amount])) simplifying the code and making it easier to read and understand, as well as faster to execute. Without the variable, the original query would calculate SUM(Sales[Sales Amount]) twice. Reusing this variable ensures the calculation is performed only once, improving the performance, and maintaining consistent results across different parts of the query.
Another DAX tip that is widely used is the CALCULATE function. It is used to modify the Filter Context of a measure and create more complex calculations. The Filter Context is the filter set applied to the data model when a measure or visual is created. It is crucial for evaluating measure formulas in Power BI. It defines the context in which a measure operates, based on filters applied to visuals or slicers.
To demonstrate how CALCULATE is used to modify the Filter Context of a Measure. Let’s consider a scenario where we have a sales dataset as shown below:
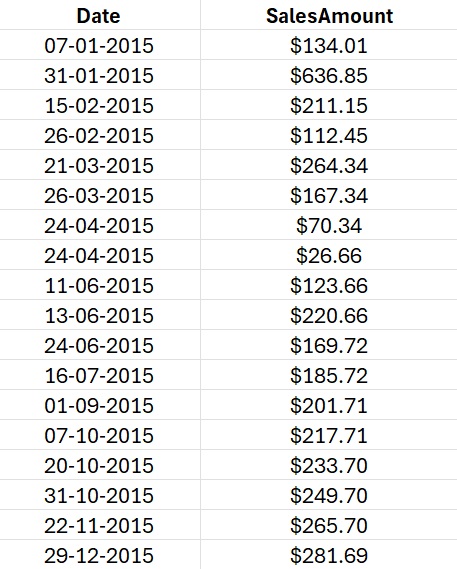
Our goal is to calculate the total sales for the previous month. To achieve this, we first create a new measure called “Previous Month Sales”.
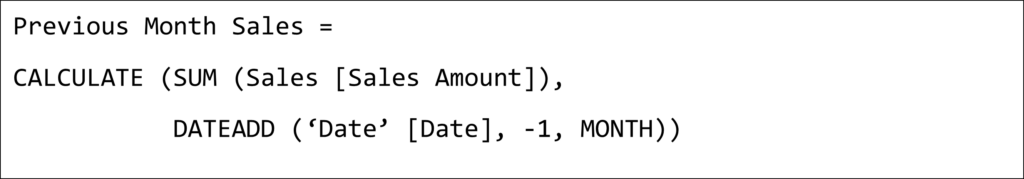
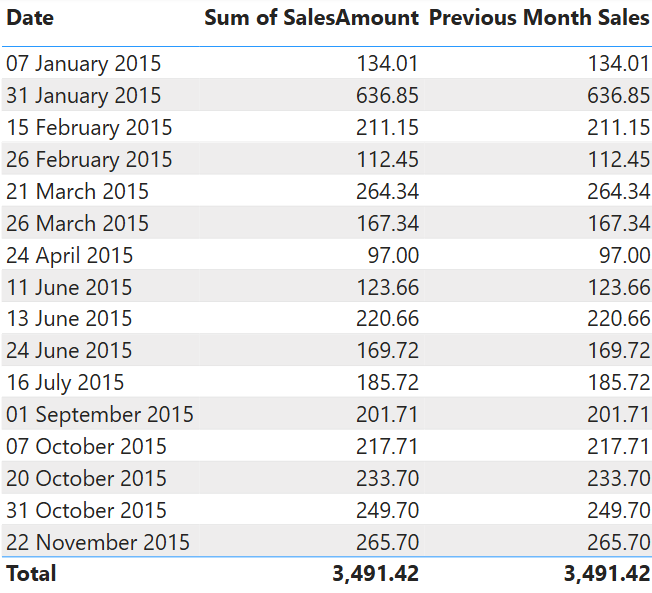
In the above example, SUM(Sales[SalesAmount] calculates the total sales amount. However, DATEADD(‘DATE’[‘Date’[Date], -1, MONTH) is used to modify the filter context to include only the dates from the previous month. The CALCULATE function evaluates the expression SalesAmount within the modified filter context. It temporarily adjusts the filter context based on the specified criteria, which is the previous month’s date. The result is we now have a measure that can be used to display the month, total sales, and previous month's sales as shown below.
One of the most common errors that is encountered when working with DAX is the division by zero error. This happens when you try to divide a number by zero, which is not possible in mathematics. For instance, if you have two columns, Numerator and Denominator, and you want to find the ratio, the formula will look like this:
Ratio = Numerator / Denominator
This might lead to the Division by Zero Error if the denominator column contains zeros (or null values). In such cases, DAX does not stop the calculation. Instead, it continues, displaying the NaN (Not a Number) value.
For example, if you try to calculate the profit margin of a product that has zero sales, you will get a division by zero error.
ProfitMargin = SUM(Sales[Profit]) / SUM(Sales[SalesAmount])
To handle this error, you can use the DIVIDE function instead of the regular division operator (/). It’s a better alternative that allows you to specify an alternative value when the division results in an error. DIVIDE takes three arguments: the numerator, the denominator, and an optional alternative result. If the denominator is zero, DIVIDE will return the alternative result instead of an error. If you do not specify the alternative result, DIVIDE will return blank.
For example, suppose you want to calculate the profit margin of each product as the ratio of the profit to the sales. You can use DIVIDE to handle the division with zero errors. Here is what the DAX formula would look like:
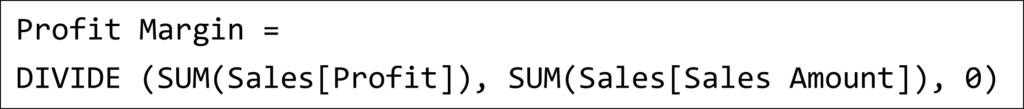
Using DIVIDE makes your DAX formulas more robust and error-free, as well as consistent with the expected behavior of Power BI.
Another DAX tip that is used frequently is SWITCH. This is used to create conditional logic based on multiple criteria. Conditional logic is used when you want to perform different actions or calculations based on certain conditions or criteria. For example, you may want to assign a colour, or an icon based on the value of a measure or a column.
You can use the IF function to create conditional logic in DAX, but it can get cumbersome and complex when you have multiple criteria or nested conditions. A better alternative is to use the SWITCH function, which lets you evaluate an expression and return different results based on the outcome.
SWITCH takes an expression and a list of value-result pairs. It evaluates the expression and compares it with each value in the list. If it finds a match, it returns the corresponding result. If it does not find a match, it returns an optional default result. If you do not specify the default result, SWITCH will return blank.
For example, suppose you want to assign a colour based on the profit margin of each product. You can use SWITCH to create a conditional logic based on multiple criteria. Here is what the DAX formula would look like:
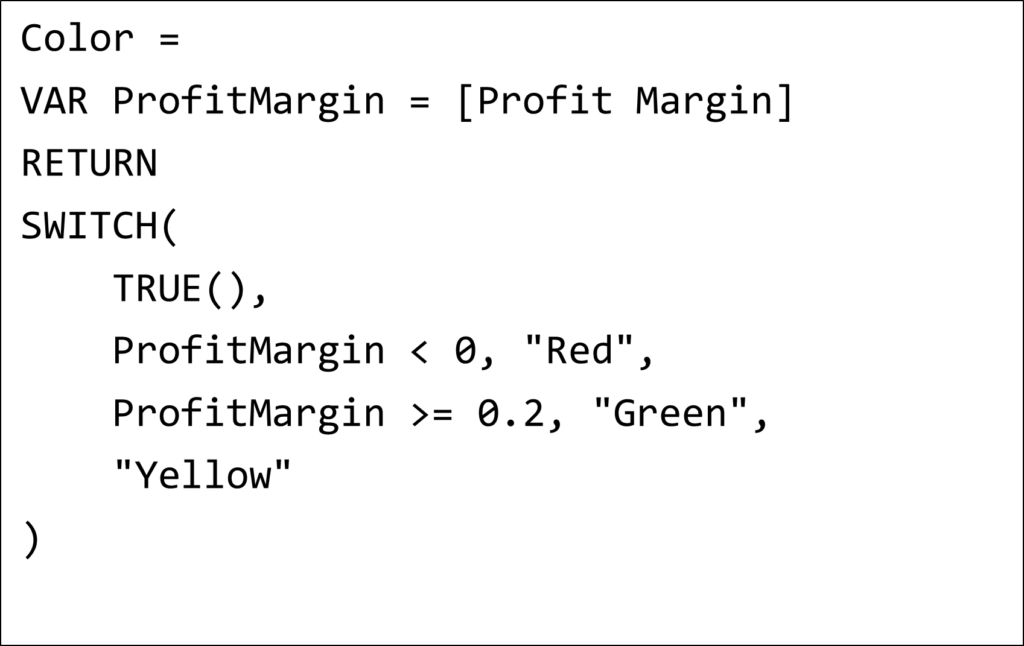
Using SWITCH makes your DAX formulas more concise and readable, as well as easier to maintain and modify.
The last DAX tip that is crucial in building insightful reports is ALLSELECTED. It is used to ignore slicer selections in a measure. As mentioned before, slicers are one of the elements that affect the filter context of a measure. However, sometimes you may want to ignore the slicer selections and calculate the measure based on the entire data set or a different filter context. For example, you may want to calculate the total of a measure regardless of the slicer selections.
To achieve this, you can use the ALLSELECTED function, which removes all the filters from the filter context except for the ones that are applied by the slicers. You can use ALLSELECTED as an argument for the CALCULATE function to change the filter context of a measure.
When you use ALLSELECTED as an argument within the CALCULATE function, it adjusts the filter context for that specific calculation. Common use cases for ALLSELECTED include calculating percentages, ratios, or totals based on the entire dataset or specific dimensions regardless of the slicer selections. Unlike, ALLSELECTED, CALCULATE does not automatically retain slicer selections. You need to explicitly define the filters that you require. If you want to ignore slicer selections while considering other filters, ALLSELECTED is the go-to function.
For example, suppose you want to calculate the percentage of the total sales for each product category, ignoring the slicer selections. You can use ALLSELECTED to ignore the slicer selections in the measure of the total sales. Here is how the DAX formula would look like:
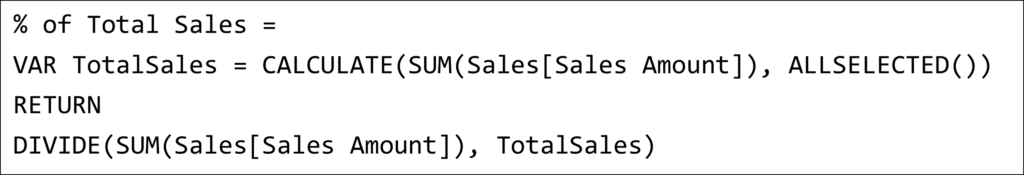
Using ALLSELECTED gives you more flexibility and control over the filter context of your measures, especially when you have slicers in your Power BI dashboard.
These are some of the most popular DAX tips and tricks that are used to make Power BI dashboards more effective and user-friendly.
To learn more about the latest from Inforiver and why we are garnering recognition from industry experts, check out our newest brochure.
Inforiver and all our planning and analytics products continue to be updated to provide a diverse range of users with optimal performance. With continual improvements and innovations planned, we welcome your feedback.
If you’re ready to level up your planning, reporting, and analytics, try our products for free today.

Inforiver helps enterprises consolidate planning, reporting & analytics on a single platform (Power BI). The no-code, self-service award-winning platform has been recognized as the industry’s best and is adopted by many Fortune 100 firms.
Inforiver is a product of Lumel, the #1 Power BI AppSource Partner. The firm serves over 3,000 customers worldwide through its portfolio of products offered under the brands Inforiver, EDITable, ValQ, and xViz.