Upcoming webinar on 'Inforiver Charts : The fastest way to deliver stories in Power BI', Aug 29th , Monday, 10.30 AM CST. Register Now
Upcoming webinar on 'Inforiver Charts : The fastest way to deliver stories in Power BI', Aug 29th , Monday, 10.30 AM CST. Register Now
I get it. You love your Business Intelligence tool, whether it’s Tableau, Qlik, Spotfire, Crystal, WebI or any other one. You have invested years in mastering it, building complex reports, crafting beautiful dashboards, and creating elegant solutions that have transformed how your organization makes data-driven decisions. You may even be your team’s “go-to” person and have been recognized for your ability to deliver insights that matter.
Now, some senior executives have decided to replace your beloved BI tool with Microsoft Power BI. And, probably you weren’t consulted. They didn’t ask you if it will provide the same features and functions. Yet, here you are, tasked with re-creating all your reports, maintaining the functionality, and preserving the look and feel that your users rely on—all within Power BI.
It's natural to feel a sense of loss, frustration, and possibly even resentment. I know, because I've been there too. Twice, in fact, over the course of my career. I’ve stood in your shoes, grappling with similar transitions.
I was a BI developer who was deeply connected to my tools and my role. I was the one writing reports, supporting users, helping the company thrive through better decision-making. I took pride in being the person who delivered insights, especially when I could craft the perfect dashboard for an executive in very quickly. Now, I am on the other side of the table. I'm one of those executives making decisions that can sometimes seem disconnected from the day-to-day realities you face. These changes can feel top-down and uninformed. My experience on both sides of this table may offer unique perspective that can help you navigate this shift. In this post, I’ll share some tips for overcoming the challenges of Power BI migrations.

Power BI’s integration with other Microsoft tools, its scalability, and the potential cost efficiencies are just some of the reasons leaders are drawn to it as part of their long-term strategy and vision. In my own journey, moving to a new BI tool meant I was able to stretch myself, learn new features, and adapt quickly. But in doing so, I became more versatile, and ultimately more valuable to my organization.
Finally, and possibly most importantly, this migration is not just about technology, it’s about mindset. Embracing the new opportunity can help pave the way forward for your team.
As a BI developer, I quickly learned that user satisfaction is everything. But as an executive, I’ve come to understand that the key to success is keeping the main thing the main thing. It sounds simple, but in practice, it’s anything but. Without a conscious effort, we risk losing sight of the fundamental goals that drive the business forward.
In fact, it’s one of the most critical roles of leadership. We make decisions that shape the entire company, and while we value thorough analysis, we can’t afford to get stuck in “analysis paralysis.” Instead, we must embrace a broader, high-level view and act decisively, even if that means making tough choices with limited information.
Take, for example, the transition many companies are making to Power BI. It is robust, reliable, cost-effective, and seamlessly integrates with other Microsoft tools like Office, Teams, and Azure—tools your company likely already uses. The decision to consolidate to Power BI wasn’t made to complicate your life, but to keep the company aligned with strategic priorities, so don’t take it personally.
Every choice we make has consequences, and this is especially true when selecting new tools and technologies for BI, planning, and analytics. As someone who has both worked through major BI transitions and now makes decisions at the executive level, I can tell you firsthand: the way you respond to these changes will absolutely be a game changer.
When your organization makes the move to Power BI, it can feel disruptive. It is natural to feel a sense of loss, but what’s more important is how you handle this shift. Do you cling to the past or do you seize the opportunity to adapt, learn, and grow?
On the other hand, embracing the new BI tool opens up new opportunities. While others are focused on what they’ve lost, you can focus on what you can gain. Become an expert in the new system. Dive deep into its capabilities and figure out how to leverage its strengths to deliver even better insights and reports. In doing so, you position yourself as a leader and someone who helps drive the company forward.
I completely understand the feeling of attachment to a specific BI tool. You’ve mastered it to the point where you can navigate it effortlessly—probably with one hand tied behind your back. You might feel like a beginner again with a new tool. And yes, it takes courage to make that leap, but it’s also one of the most powerful ways to grow.
Power BI, while an excellent platform, comes with limitations. All BI tools have limitations. Not all aspects of your old tool will translate perfectly to Power BI. Features like dual-axis charts, waterfall charts, or advanced storytelling visuals aren’t readily available, and writing financial reports can be a pain. Even recreating complex reports requires learning DAX, Power BI’s coding language, which has a steep learning curve and it takes a lot of time to write custom DAX code for each report.
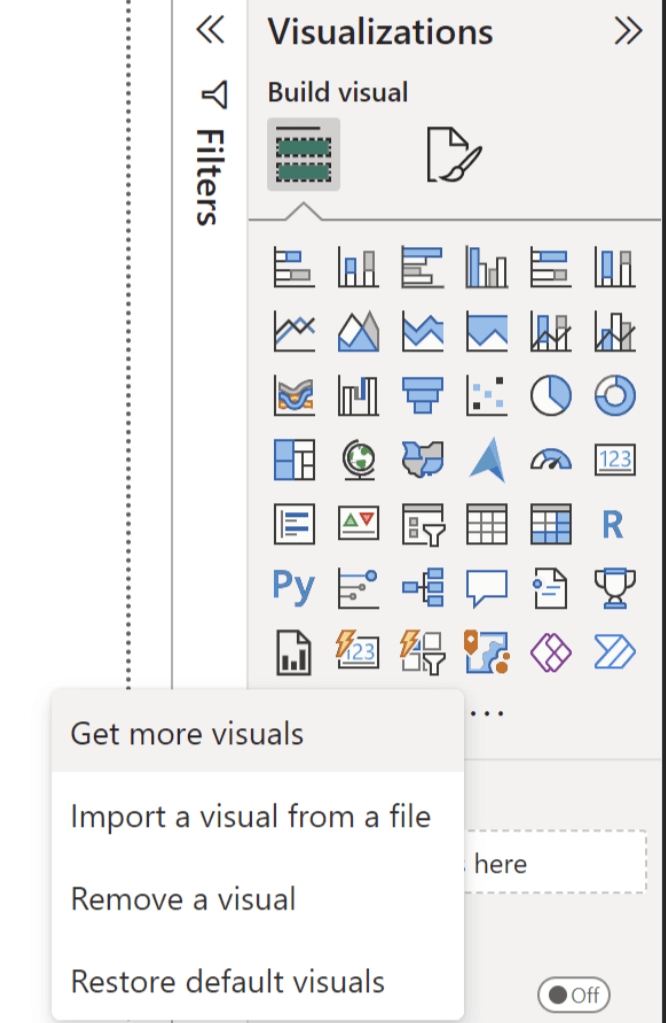
So, what can you do? Taking advantage of “custom visuals” empowered by Microsoft is the first step. This makes Power BI a very versatile and powerful tool because custom visuals greatly extend Power BI’s capabilities and bridge the gap in its limitations. You’ll find them in the “Visualizations” section when selecting “Get more visuals.”

Choose your custom visuals carefully, from reputable organizations, to ensure your data and systems are safe, and check whether or not it is a Microsoft certified visual.
Inforiver by Lumel is the #1 Microsoft Power BI AppSource partner with more than 3,000 customers. We are a best-in-class solution that empowers enterprises to look forward and think ahead with an innovative suite of products for real-time integrated BI, planning, reporting, and analytics. Designed for business users, it delivers cutting-edge, no-code, self-service user experience to leverage your modern data platform investments, reduce TCO, and retire legacy solutions.
Carefully designed to extend Power BI’s capabilities, our products like Inforiver Matrix and Analytics+, are more than just visuals—they're your key to a smooth transition.
Take Inforiver Matrix, for example. It provides reporting tool capabilities within Power BI, offering Excel-like functionality through a simple drag-and-drop interface. This means you won’t have to spend months coding in DAX to recreate your reports. Similarly, Analytics+ offers over 100 components, from charts to graphs, all highly configurable to meet your specific needs.
What’s more, both of these visuals are Power BI certified, ensuring that your data remains secure. By using Inforiver Matrix and Analytics+, you can skip the frustration of having to rebuild everything from scratch and quickly regain your status as the go-to Power BI expert in your company. What’s more, both of these visuals are Power BI certified, ensuring that your data remains secure. By using Inforiver Matrix and Analytics+, you can skip the frustration of having to rebuild everything from scratch and quickly regain your status as the go-to Power BI expert in your company.
To learn more about the latest from Inforiver, and why we are garnering recognition from industry experts, check out our newest brochure.
Inforiver and all our planning and analytics products continue to be updated to provide a diverse range of users with optimal performance. With continual improvements and innovations planned, we welcome your feedback.
If you’re ready to level up your planning, reporting and analytics, try it for free today.
Inforiver helps enterprises consolidate planning, reporting & analytics on a single platform (Power BI). The no-code, self-service award-winning platform has been recognized as the industry’s best and is adopted by many Fortune 100 firms.
Inforiver is a product of Lumel, the #1 Power BI AppSource Partner. The firm serves over 3,000 customers worldwide through its portfolio of products offered under the brands Inforiver, EDITable, ValQ, and xViz.