
Upcoming webinar on 'Inforiver Charts : The fastest way to deliver stories in Power BI', Aug 29th , Monday, 10.30 AM CST. Register Now
Upcoming webinar on 'Inforiver Charts : The fastest way to deliver stories in Power BI', Aug 29th , Monday, 10.30 AM CST. Register Now
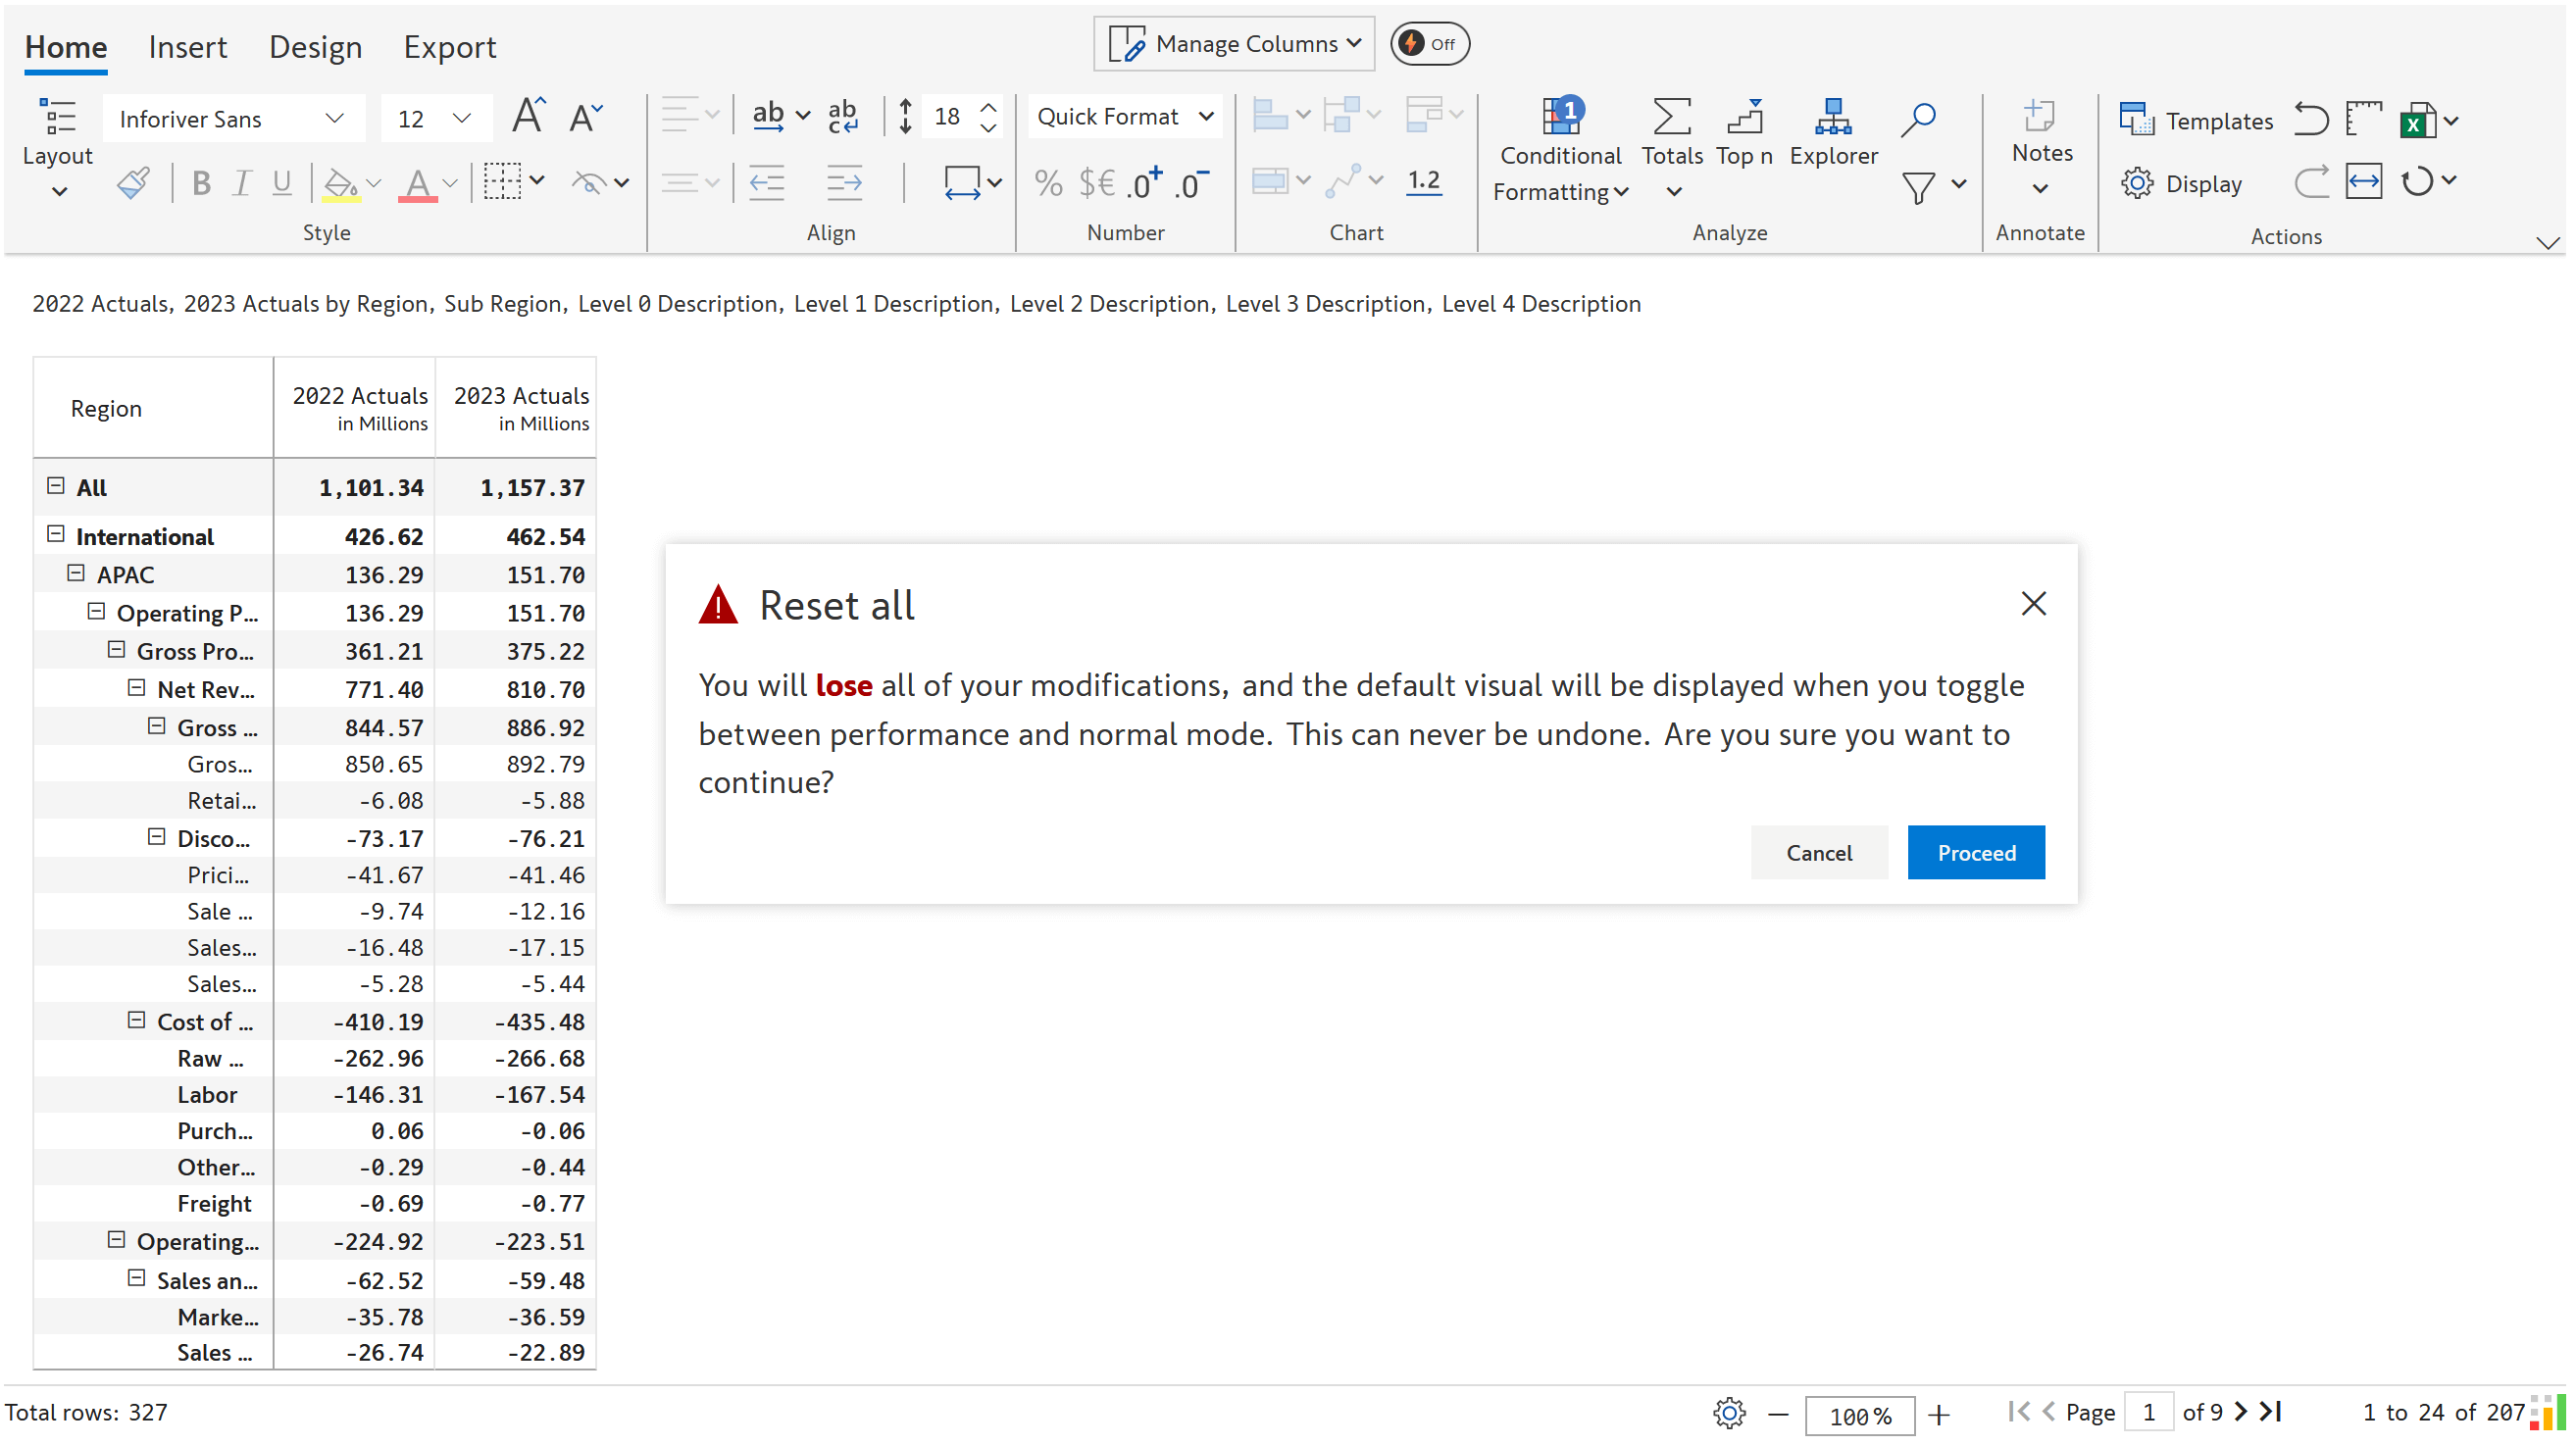
Important: Performance mode needs to be used only on brand-new reports. Turning on the performance mode in an existing report will result in losing all the changes and revert the visual to its default state. Similarly, turning off the performance mode also results in losing all the changes. However, as this upcoming 2.7 release has minor code changes only for few bug fixes with no other feature enhancements – we don’t anticipate any regression issues when you migrate to 2.7 from older Inforiver Premium Matrix versions.
Inforiver Premium Matrix offers an impressive 100 times more features than the native Power BI matrix. This is partly because of Inforiver's differentiated architecture where all hierarchy levels are loaded at once in the visual so as to provide you with advanced capabilities that the native matrix can't match. The native matrix offers better performance by loading only one level at a time and using a windowing technique with scroll, i.e., the rows are loaded only as you scroll beyond the initial rows visible on the screen.
But why choose between performance and advanced capabilities when you can have both? This is where the upcoming Inforiver Premium Matrix 2.7 's Performance Mode comes in. With this new feature, you can initially load the first two levels as the default level of the hierarchy and then drill down to the lower levels as needed on demand, giving you the best of both worlds. Performance mode is recommended when using large datasets, especially if there are more than 100k cells.
Note that Performance Mode is available only for Inforiver Premium and not Inforiver Enterprise. It is also recommended that you make this decision before building a brand-new report upfront, as there are trade-offs between performance vs a complete set of features.
In the above video, you can see that Inforiver now offers drill up, drill down, show next level, and expand one level options like the native Power BI matrix. You can also use the row gripper to move up or down one level at a time.
To reiterate, when the performance mode is enabled or disabled, all changes will be reset, and the report will be restored to the default configuration. Similarly, turning off the performance mode also results in losing all the changes. So, it is recommended that you decide which mode to set before configuring the report. And we strongly recommend that you make a copy of the report before trying this on an existing report.
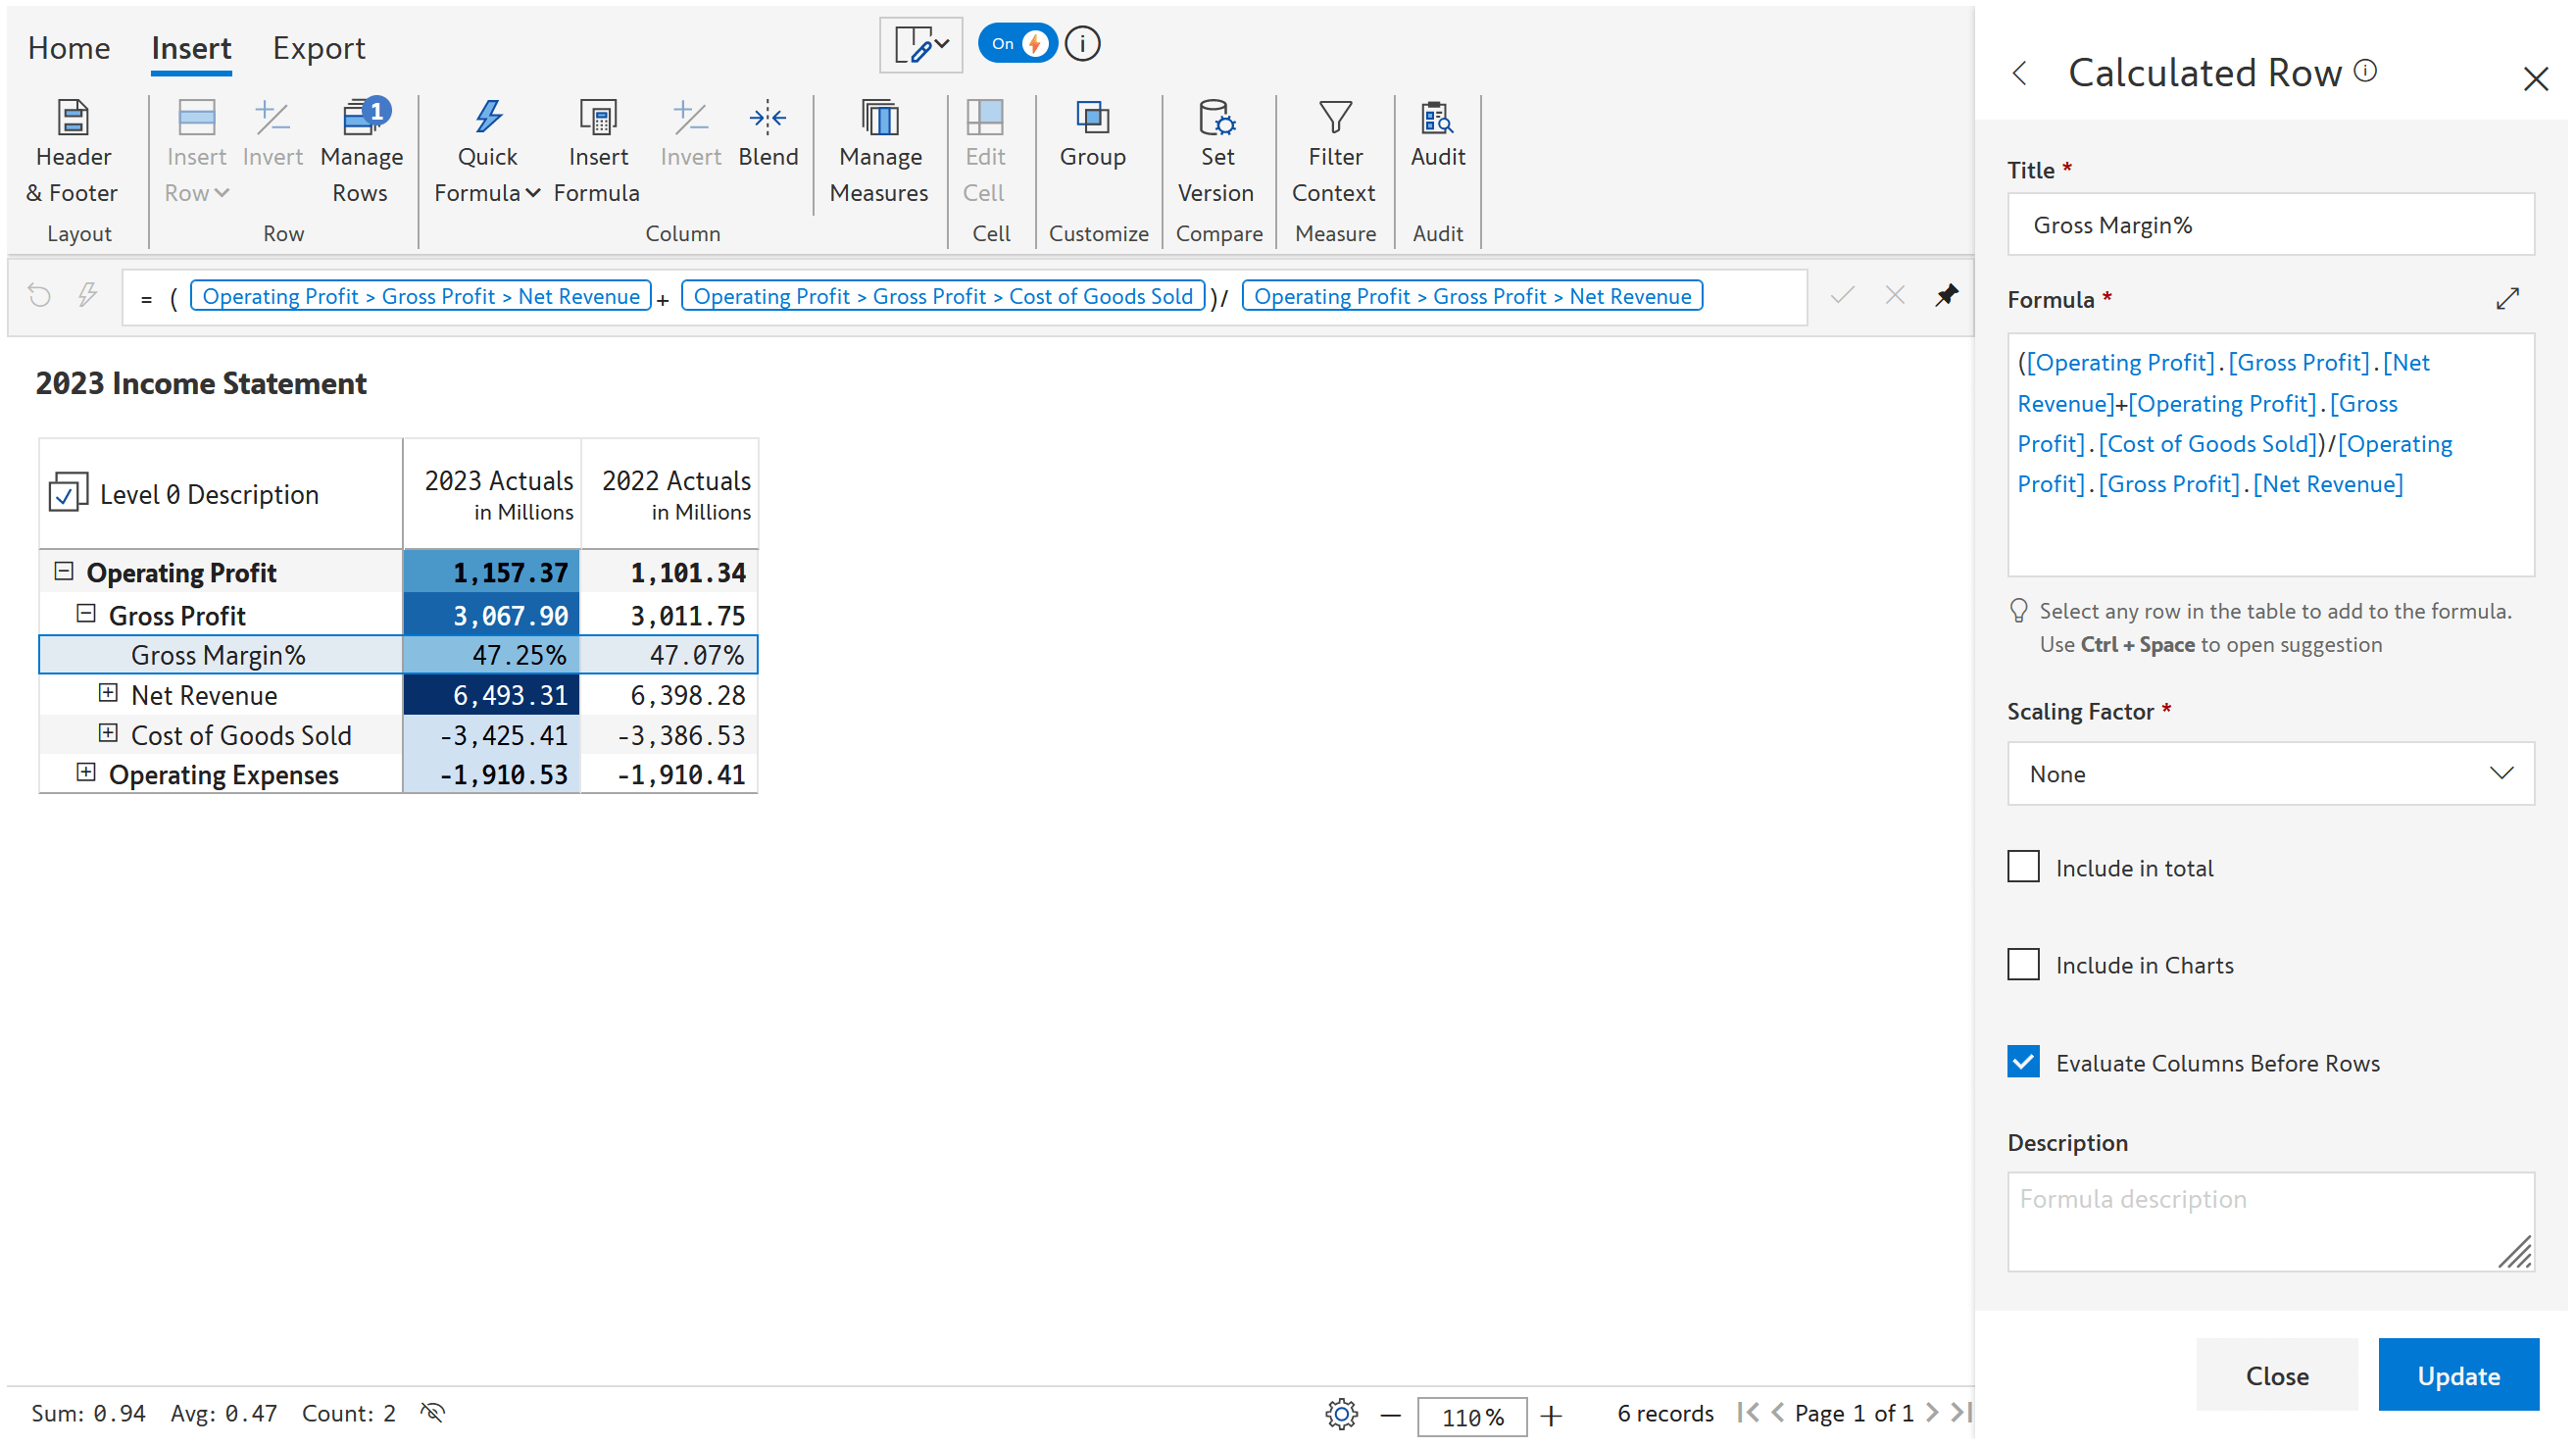
You can configure the report just as usual – even insert calculations in rows or columns as long as only the levels available in the visual are referred to. In the image below, we have applied conditional formatting and inserted a calculated row in the performance mode.
It should be noted that certain features are not supported in Performance mode, as not all levels are loaded initially.
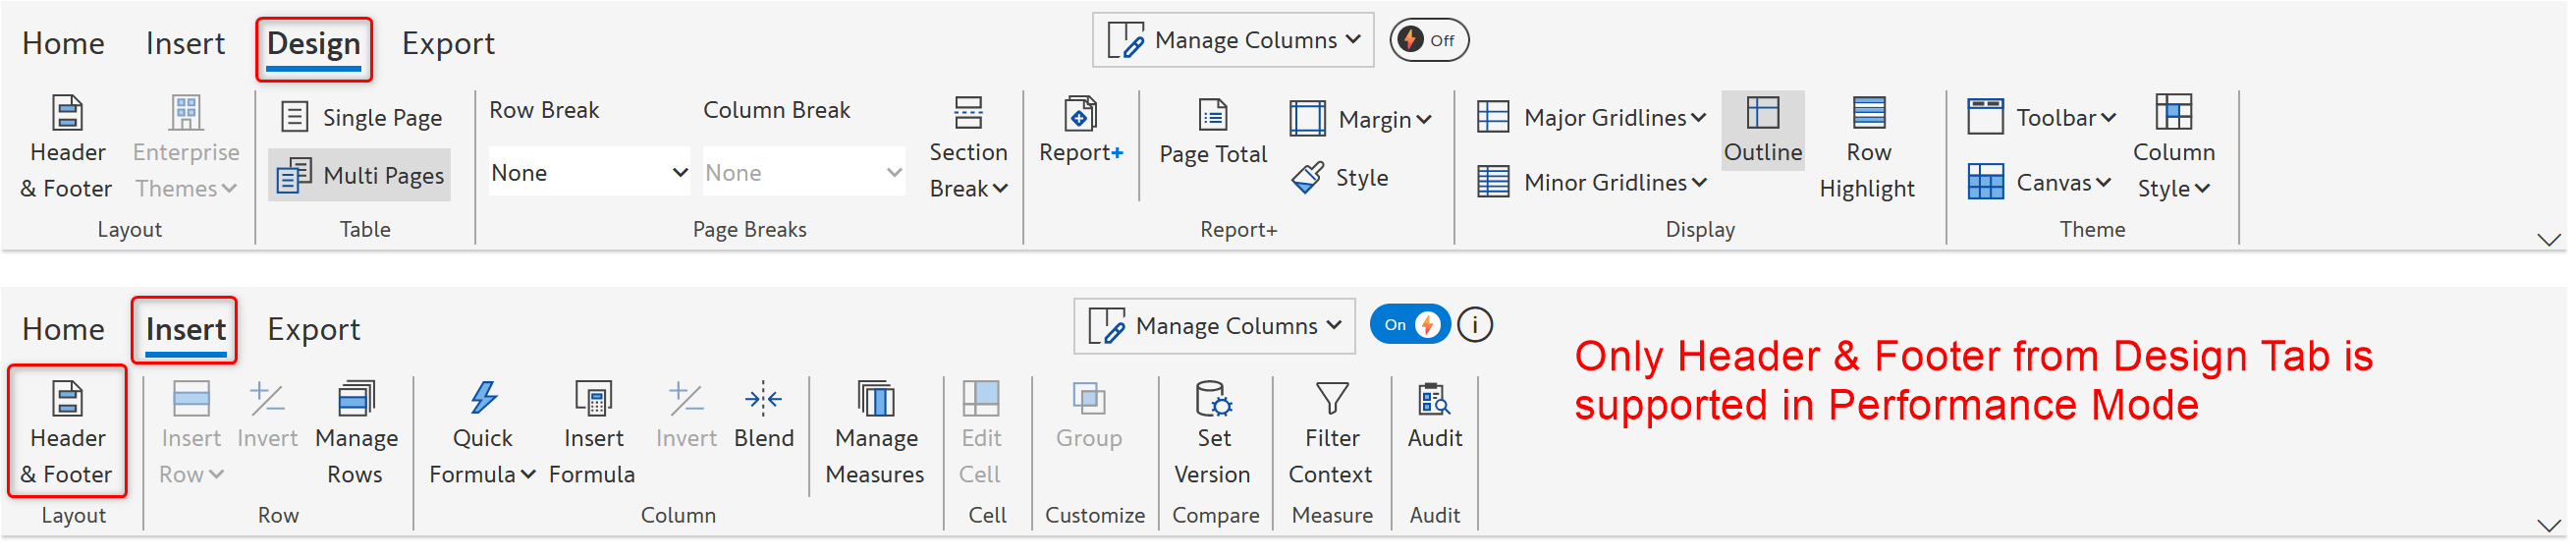
1. Design tab is missing since Pagination, Row, Column, Section Breaks, and Report+ are not supported. Only the Header & Footer option is available, and this can be accessed from the Insert tab instead. Display and Theme sections can be accessed from the Display Settings in the Home tab.
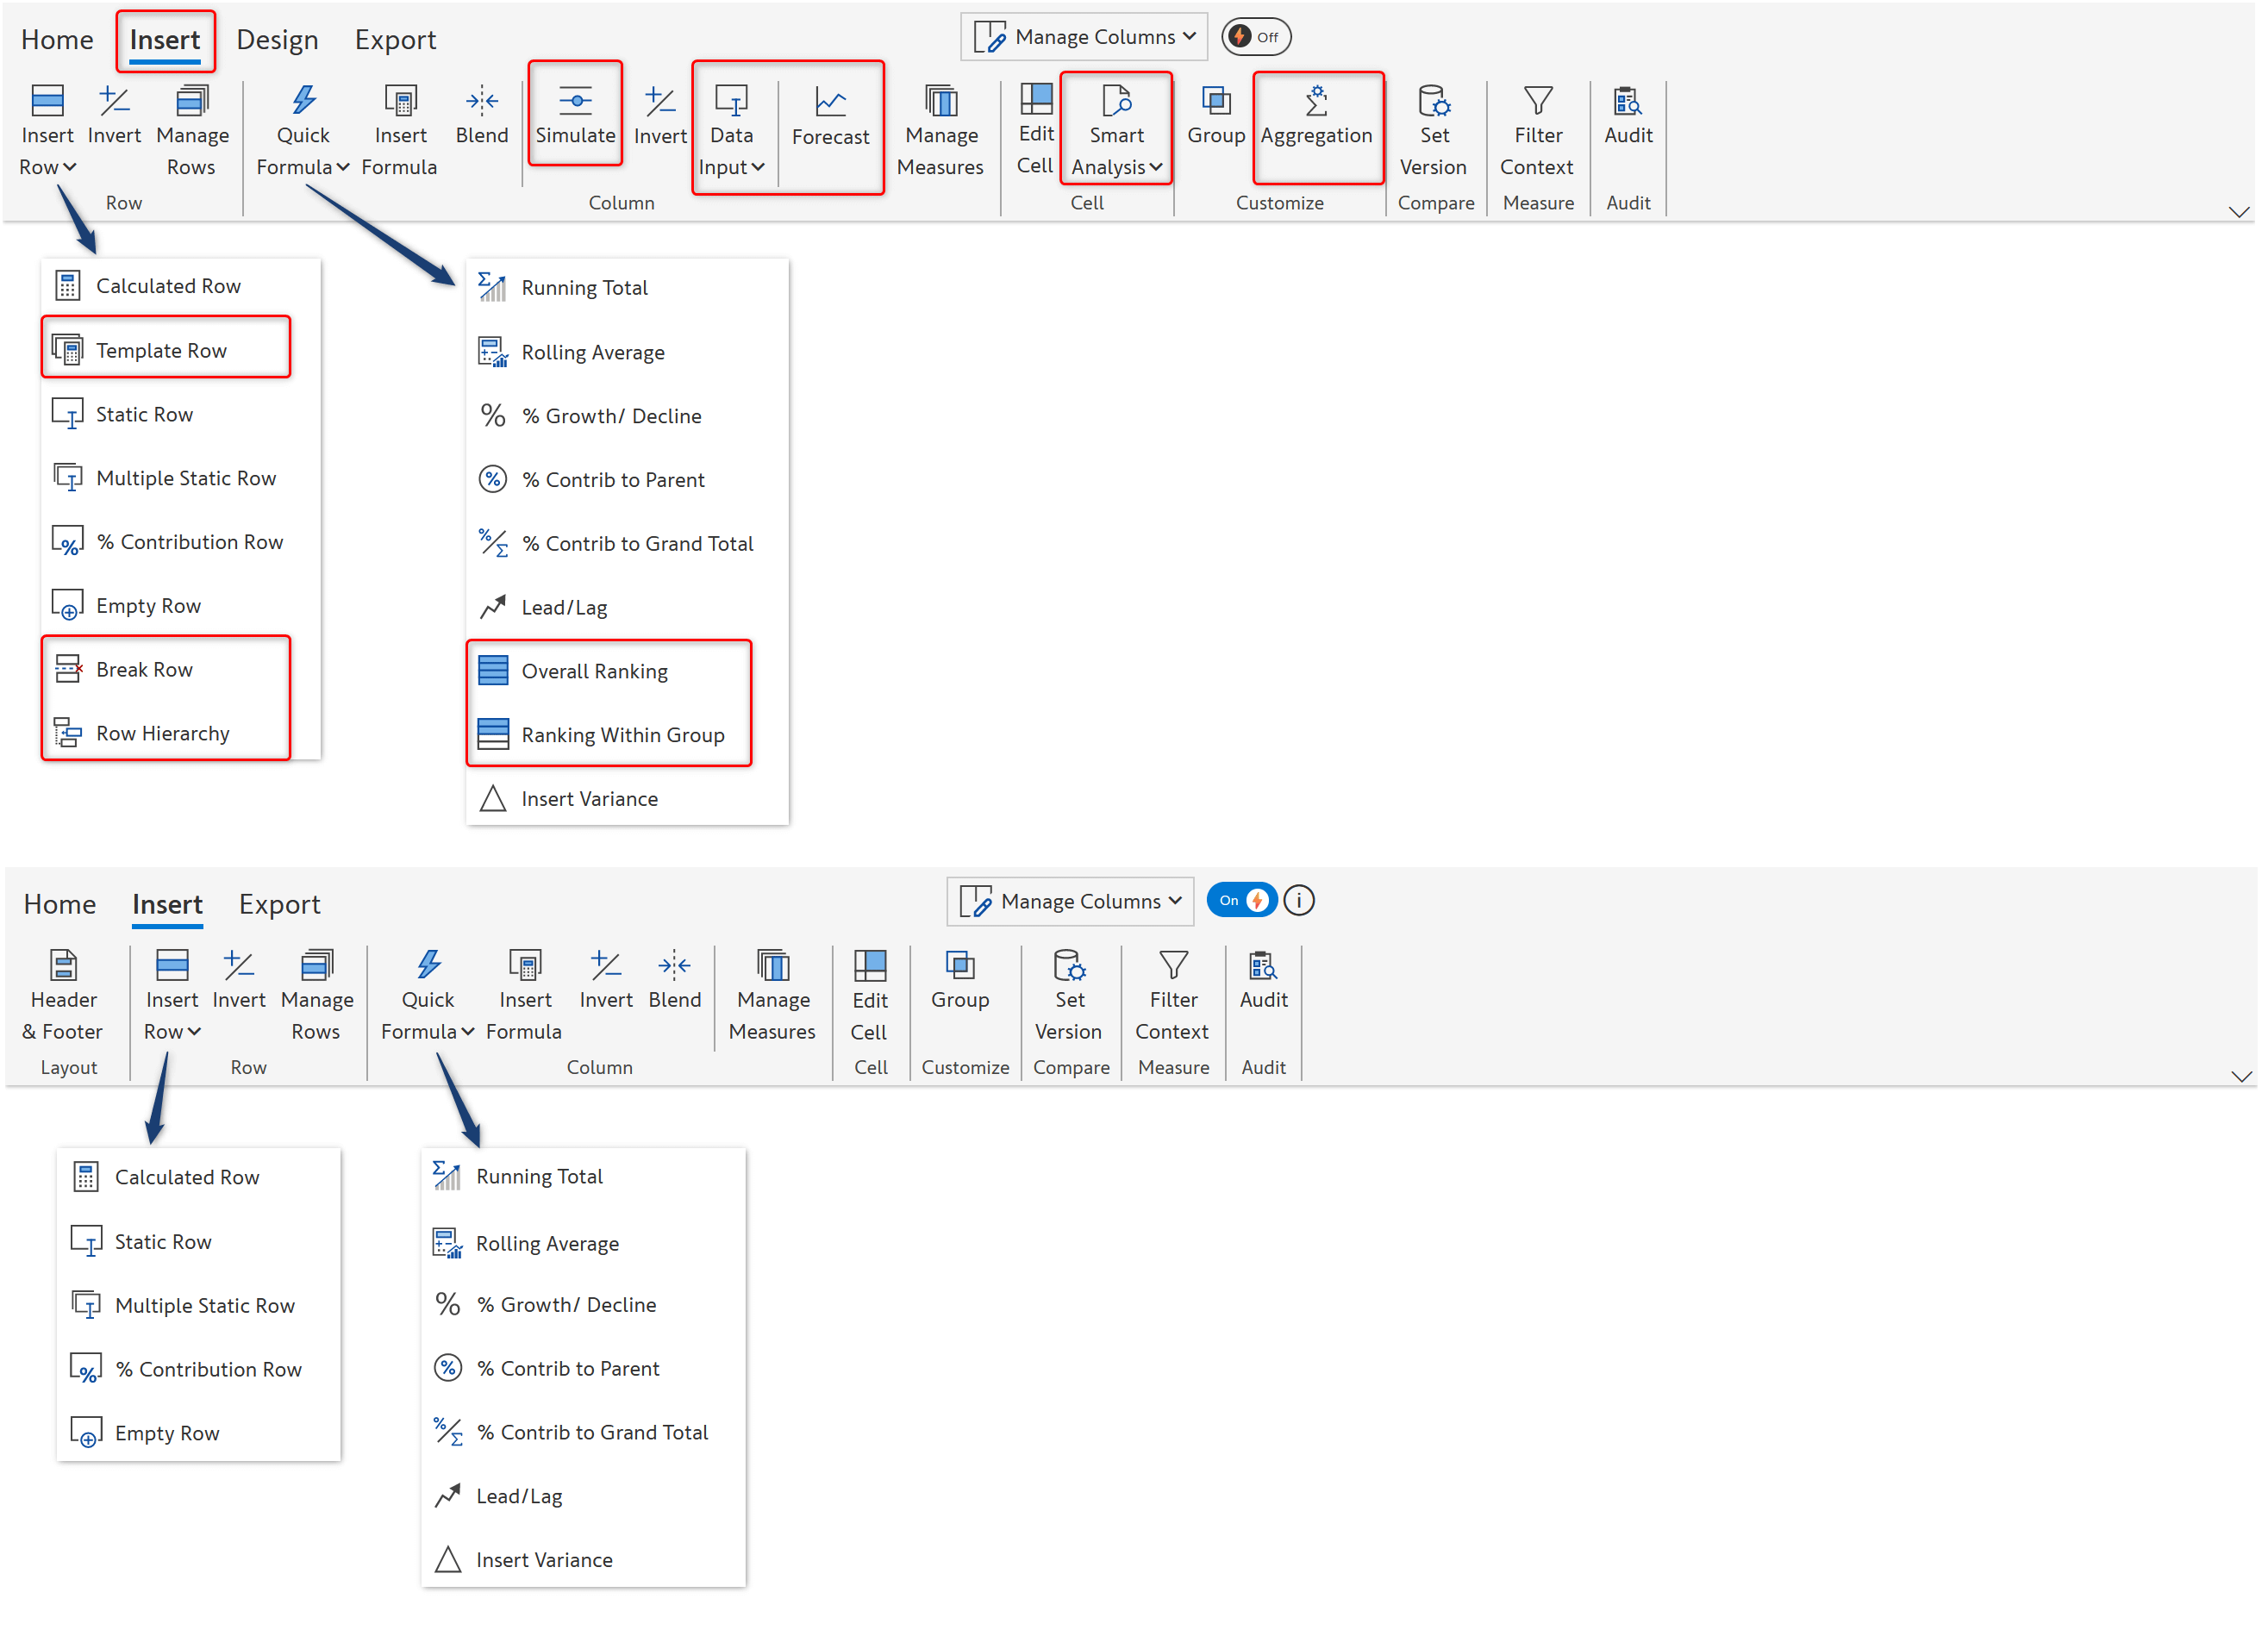
2. Several features are not supported in the Insert tab - Data input, Simulate, Smart Analysis, Aggregation, Template Row, Break Row, and Row Hierarchy in Insert Row, Overall Ranking, and Ranking within Group in Quick Formula.
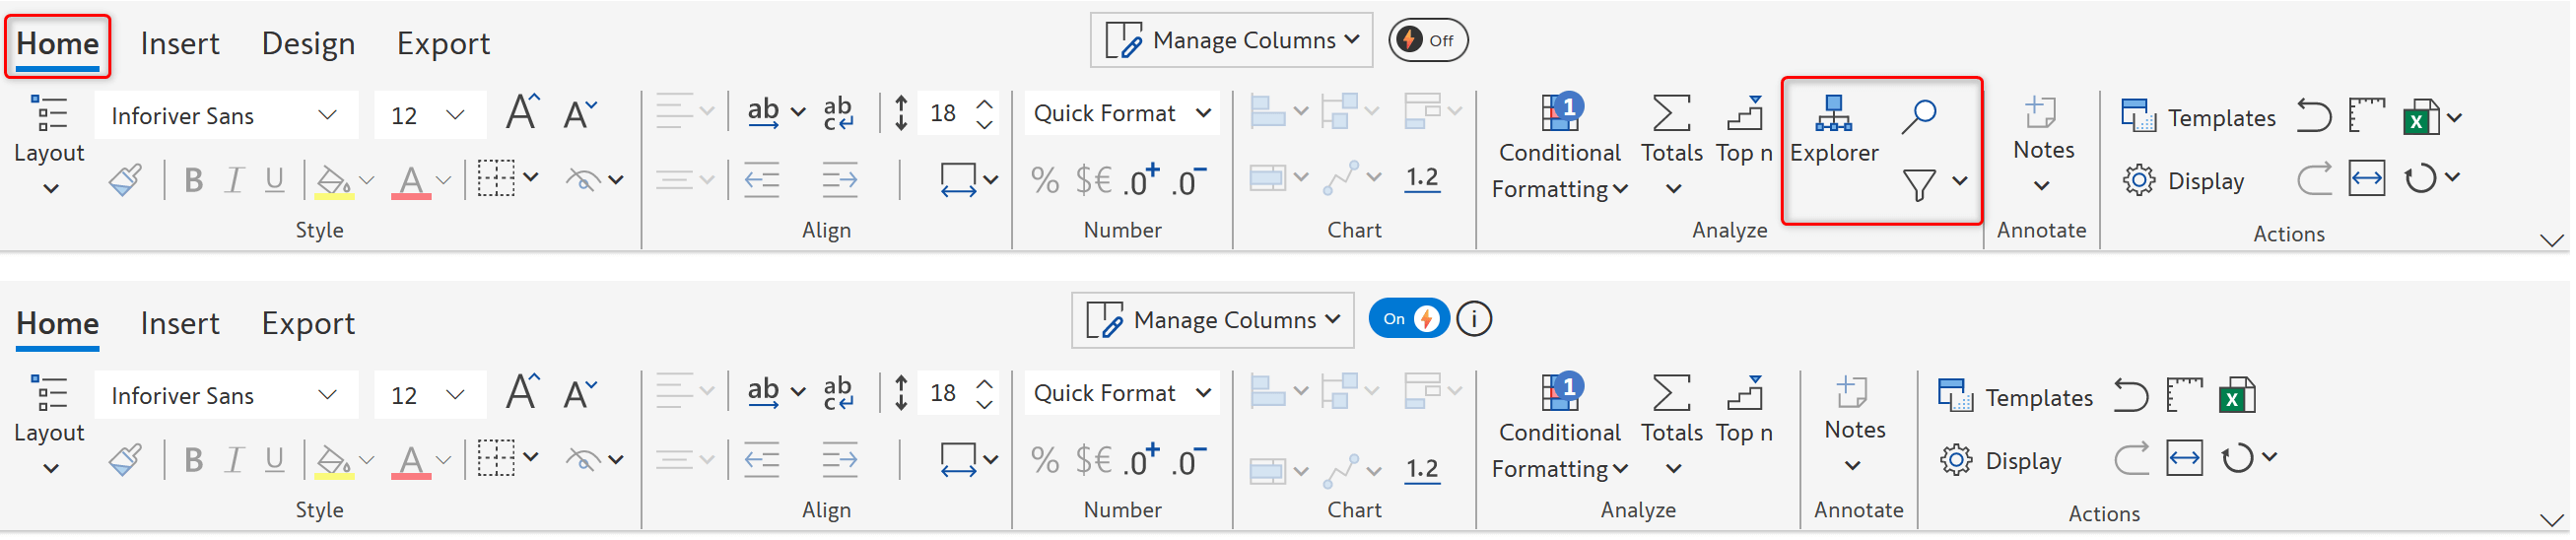
3. In the Home tab, Explorer, Search, and Filter options are not supported.
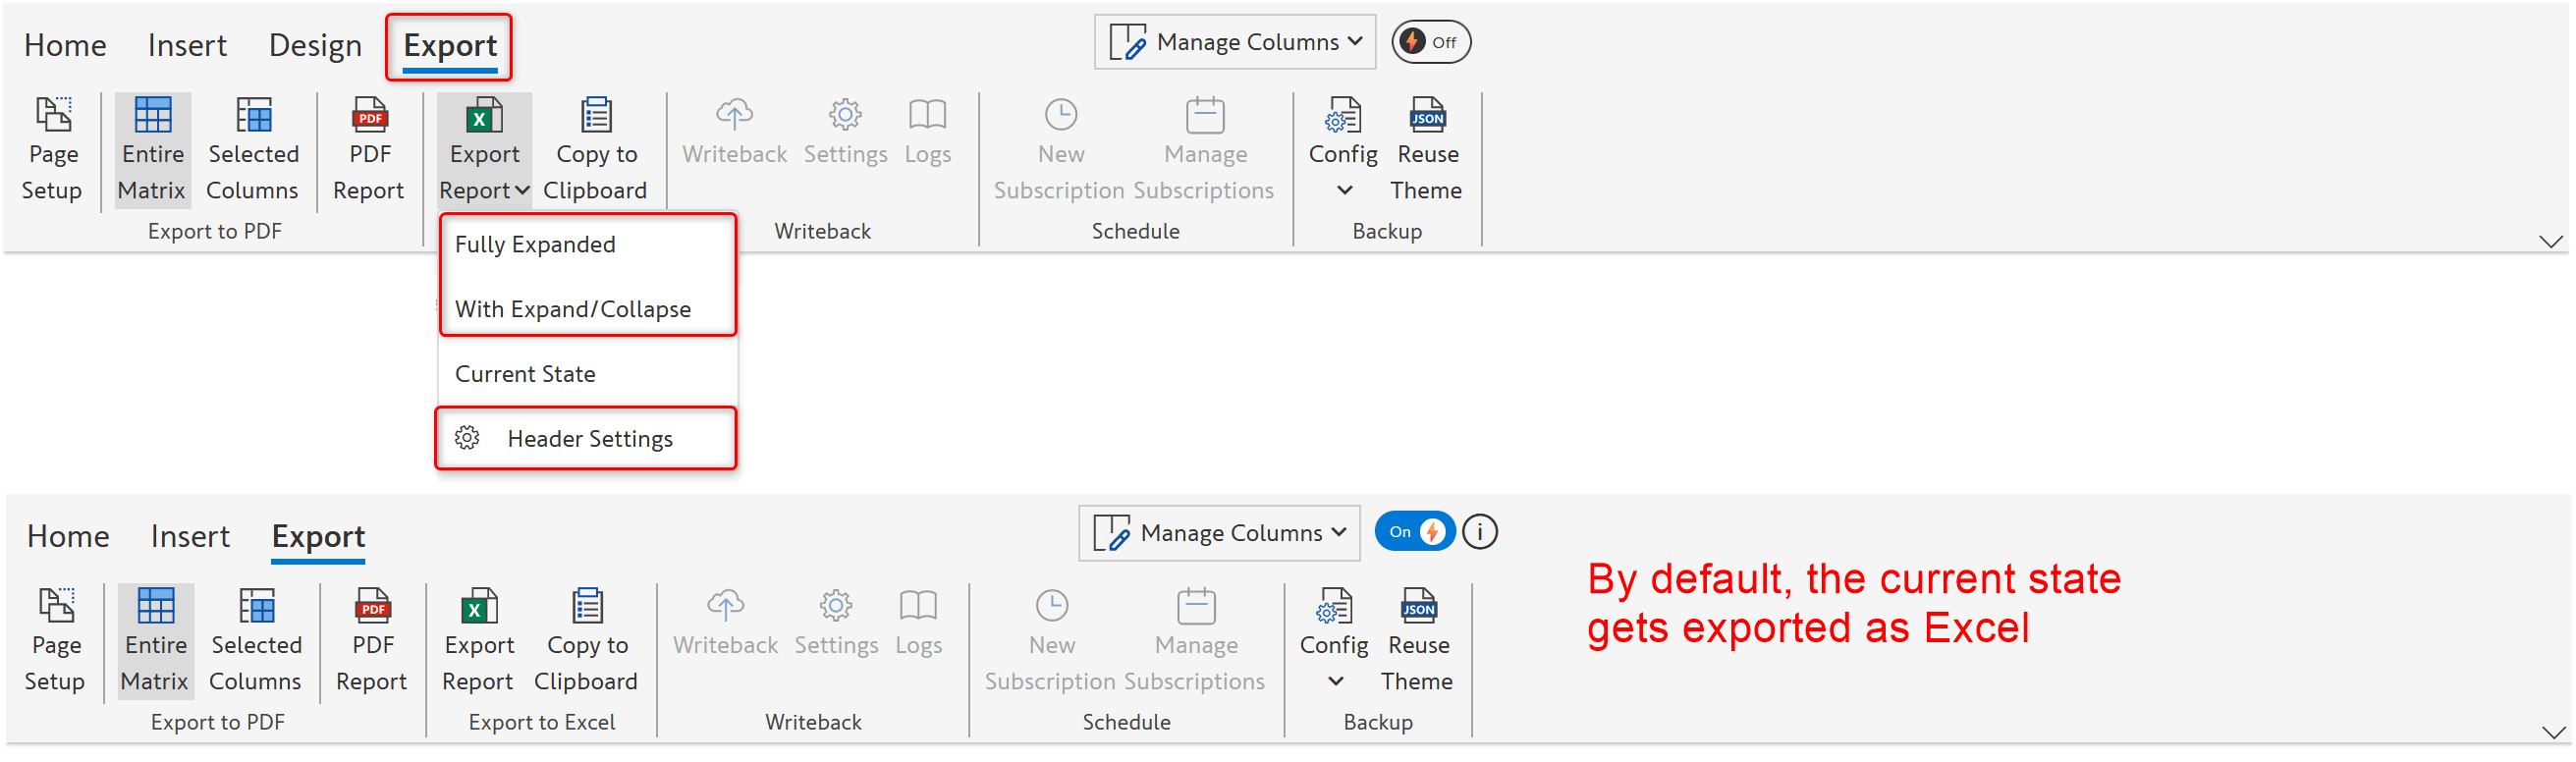
4. In the Export tab, Fully Expanded, With Expand/Collapse, and Header Settings are not supported under Export to Excel.
Reporting Matrix offers powerful capabilities for handling hierarchical data without compromising on performance. Register for a free trial to experience Inforiver in action.
If you have any questions, feel free to contact us through the Inforiver community.

Inforiver helps enterprises consolidate planning, reporting & analytics on a single platform (Power BI). The no-code, self-service award-winning platform has been recognized as the industry’s best and is adopted by many Fortune 100 firms.
Inforiver is a product of Lumel, the #1 Power BI AppSource Partner. The firm serves over 3,000 customers worldwide through its portfolio of products offered under the brands Inforiver, EDITable, ValQ, and xViz.


