
Upcoming webinar on 'Inforiver Charts : The fastest way to deliver stories in Power BI', Aug 29th , Monday, 10.30 AM CST. Register Now
Upcoming webinar on 'Inforiver Charts : The fastest way to deliver stories in Power BI', Aug 29th , Monday, 10.30 AM CST. Register Now
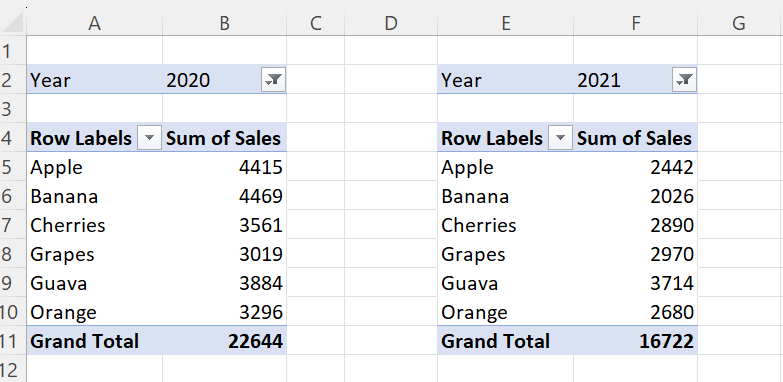
A comparison report is one that helps users list two tables side by side to compare performance. For example, the user may list sales data for two years side by side as follows.
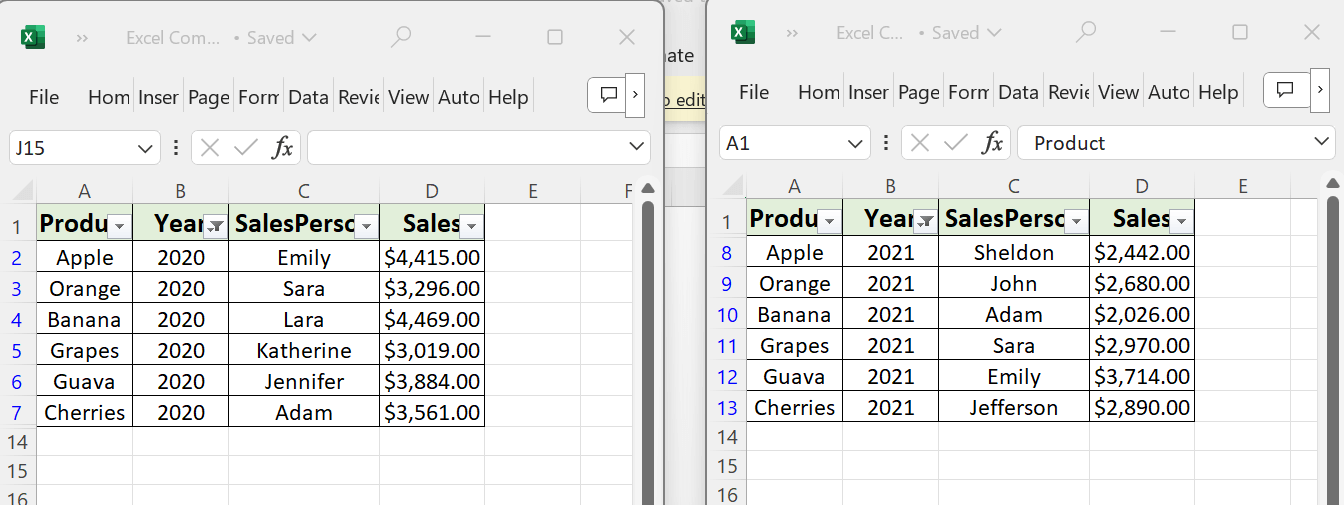
Sometimes this extends to users comparing two workbooks side by side too.
In Power BI, you will have to utilize multiple tables and filters and customize interactions to achieve this. And yet, you may still run into some issues with each table having its own sort order.
Inforiver helps you build seamless comparison reports in a few clicks within a single visual. You can go beyond two tables in your comparison report as shown below.
Inforiver provides you with two options to create a comparison report.
Option 1: Using Report+ capability.
Option 2: Using IBCS table templates.
Let's get into the details of each approach:
To build a comparison report, create a table/matrix with all the categories and measures that you need. In this example, we have sales data for US & International geographies, broken down into sub-regions and product category.
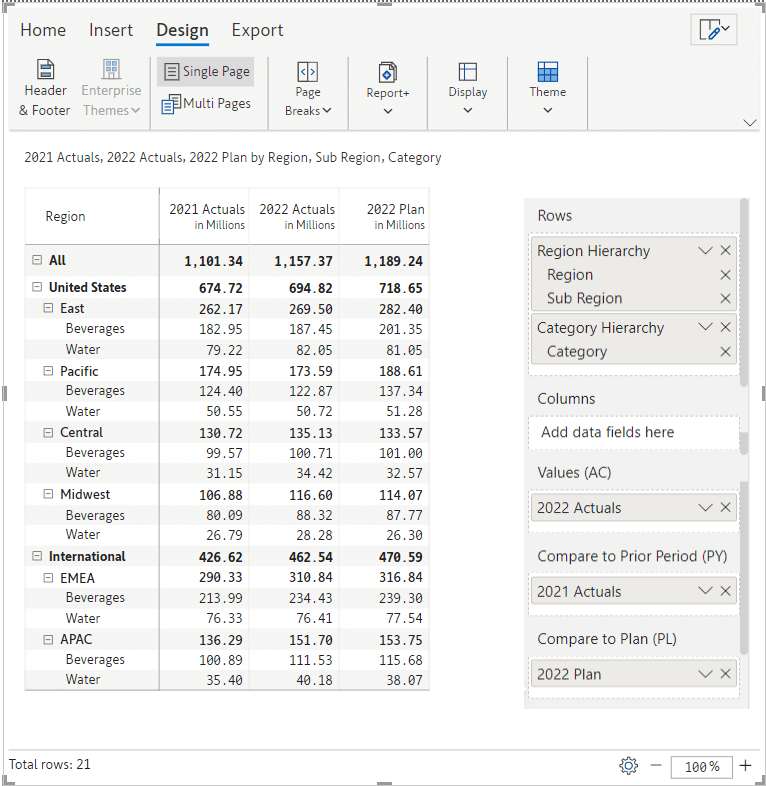
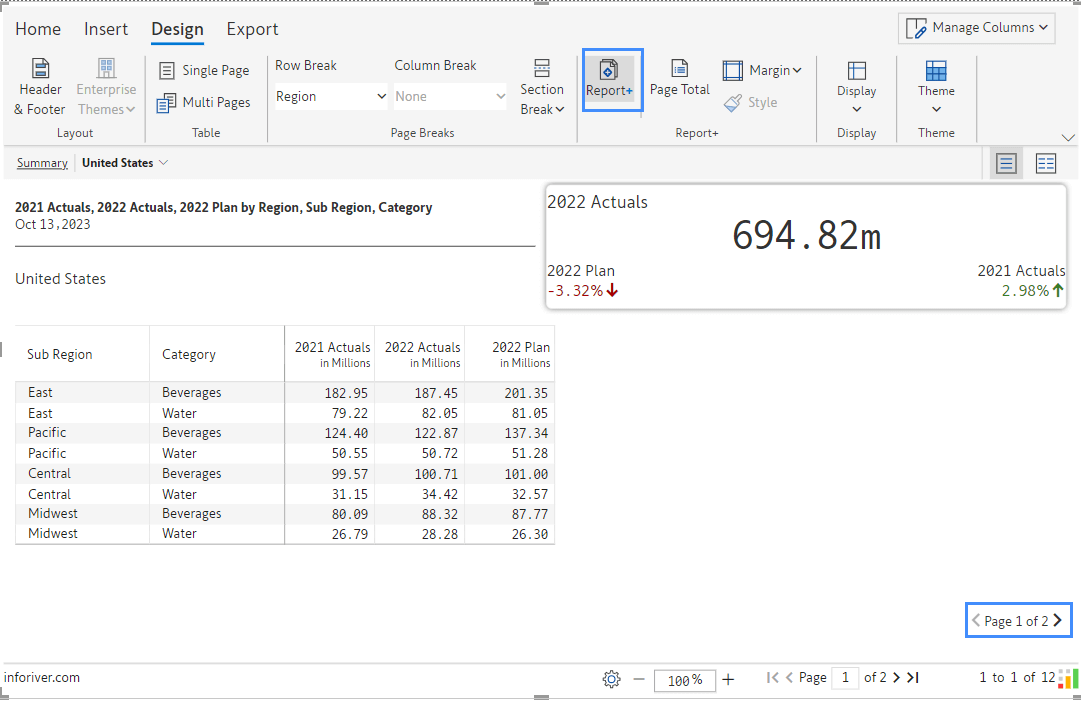
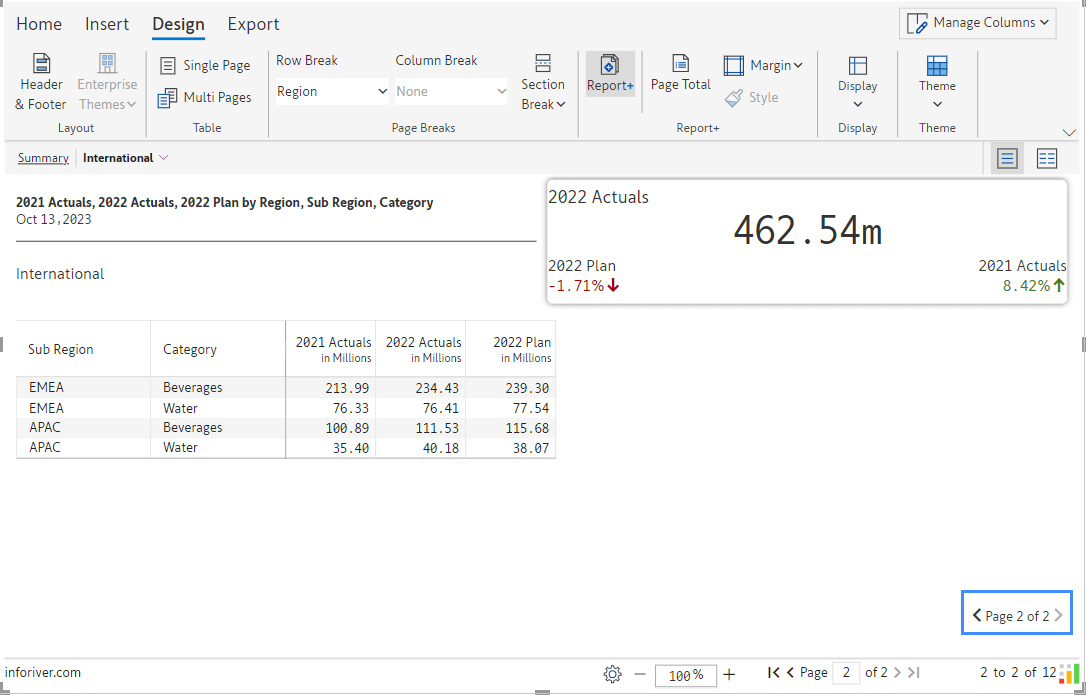
Step 1> Click on Report+ and you will see a paginated report with two pages, one each for US and International regions. The subregion and category values are listed in the form of a table.
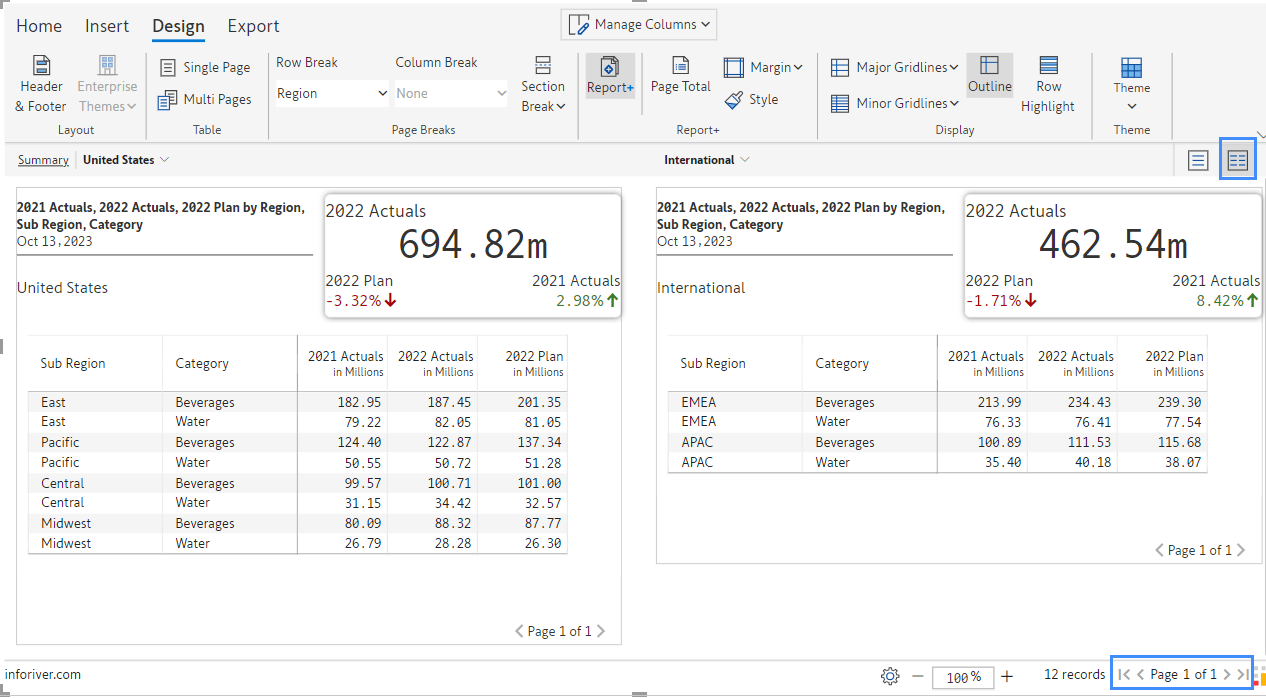
Step 2> Now click on the Compare view on the top right of the canvas (highlighted in blue). Inforiver delivers both pages side by side for an easier comparison.
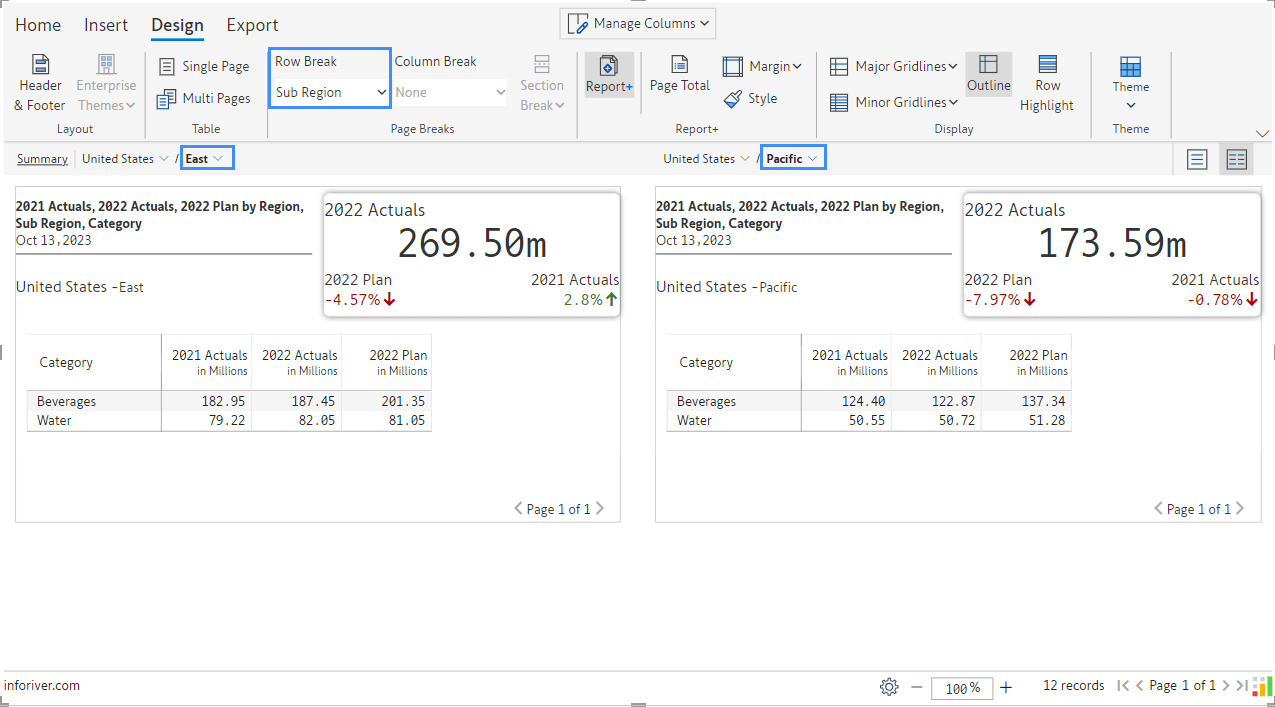
Step 3> Let’s say we want to go further and list US-East in table 1 and International-EMEA in table 2. How do we achieve it?
In the toolbar, visit Design 🡪 Page Breaks 🡪 Row Break, and change the selection from Region to Sub Region. By default, Inforiver here chooses to compare US-East and US-Pacific.
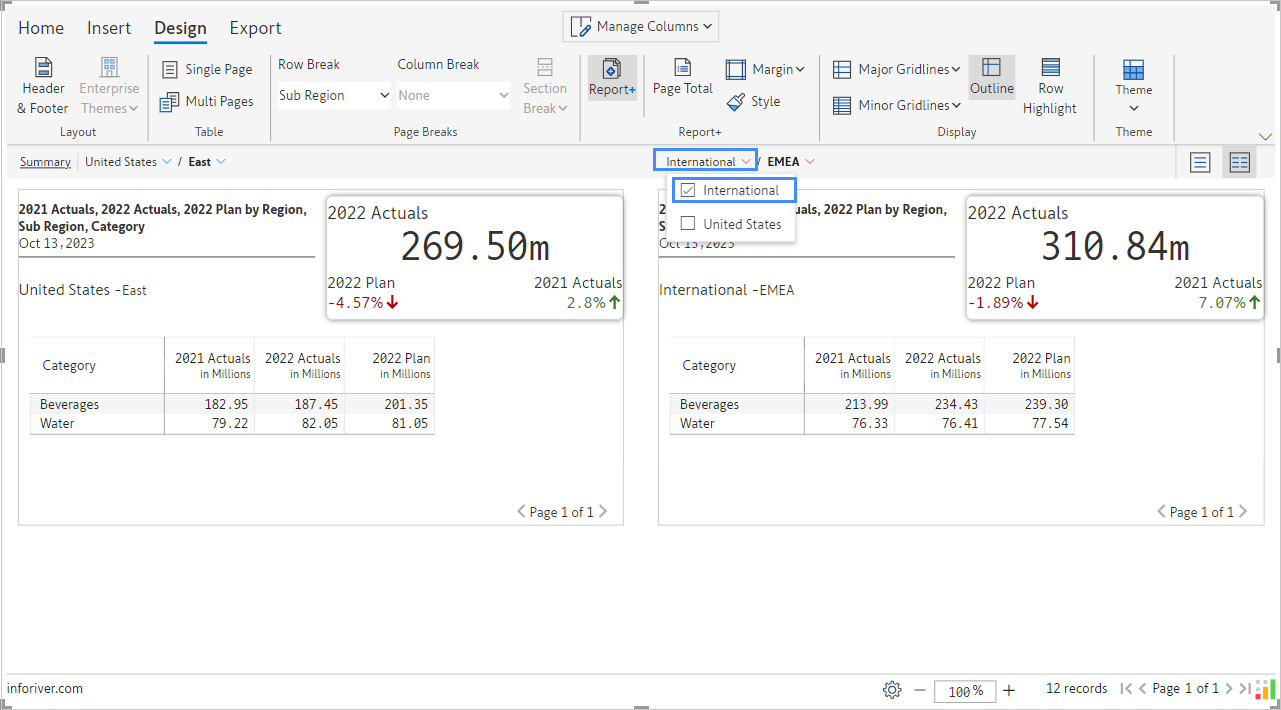
Step 4> We already have the first table that we needed. In the second table, change the selection to International-EMEA.
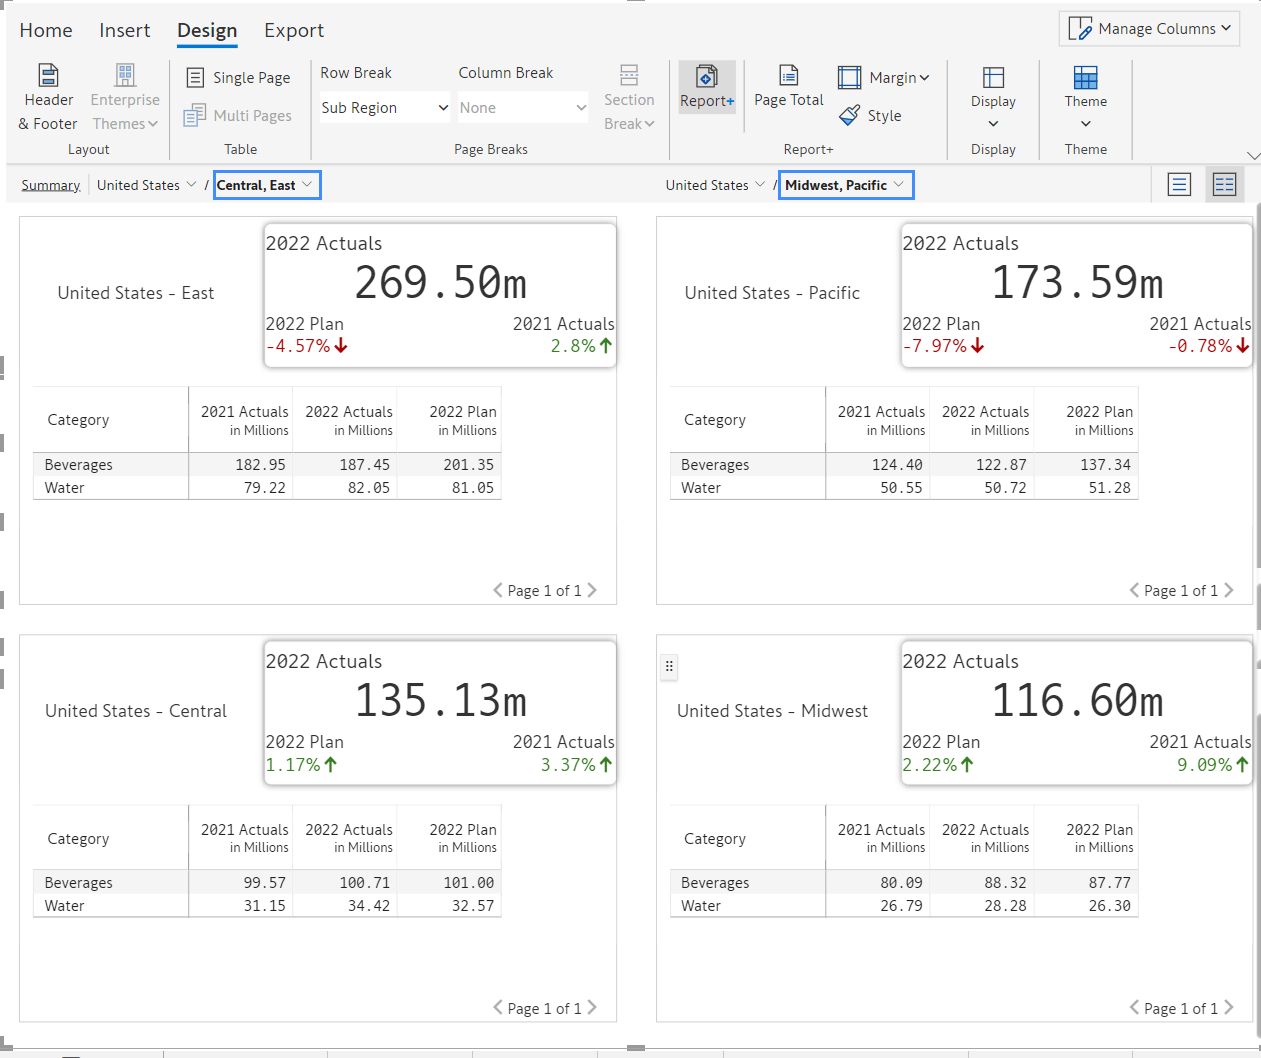
Step 5> Can we perform a comparison of more than 2 tables?
Absolutely. Select multiple subregions from the dropdown, and Inforiver will list those subregions on the left or the right (depending on the side in which you selected the subregion).
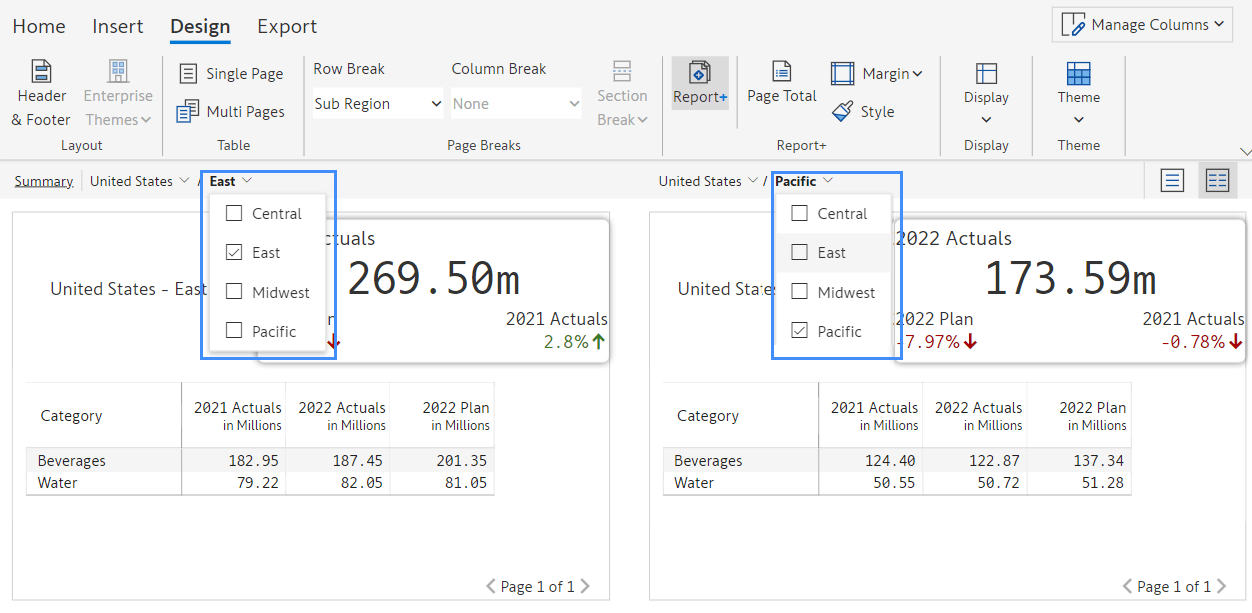
We opted to display Central and East on the left, and Midwest and Pacific on the right.
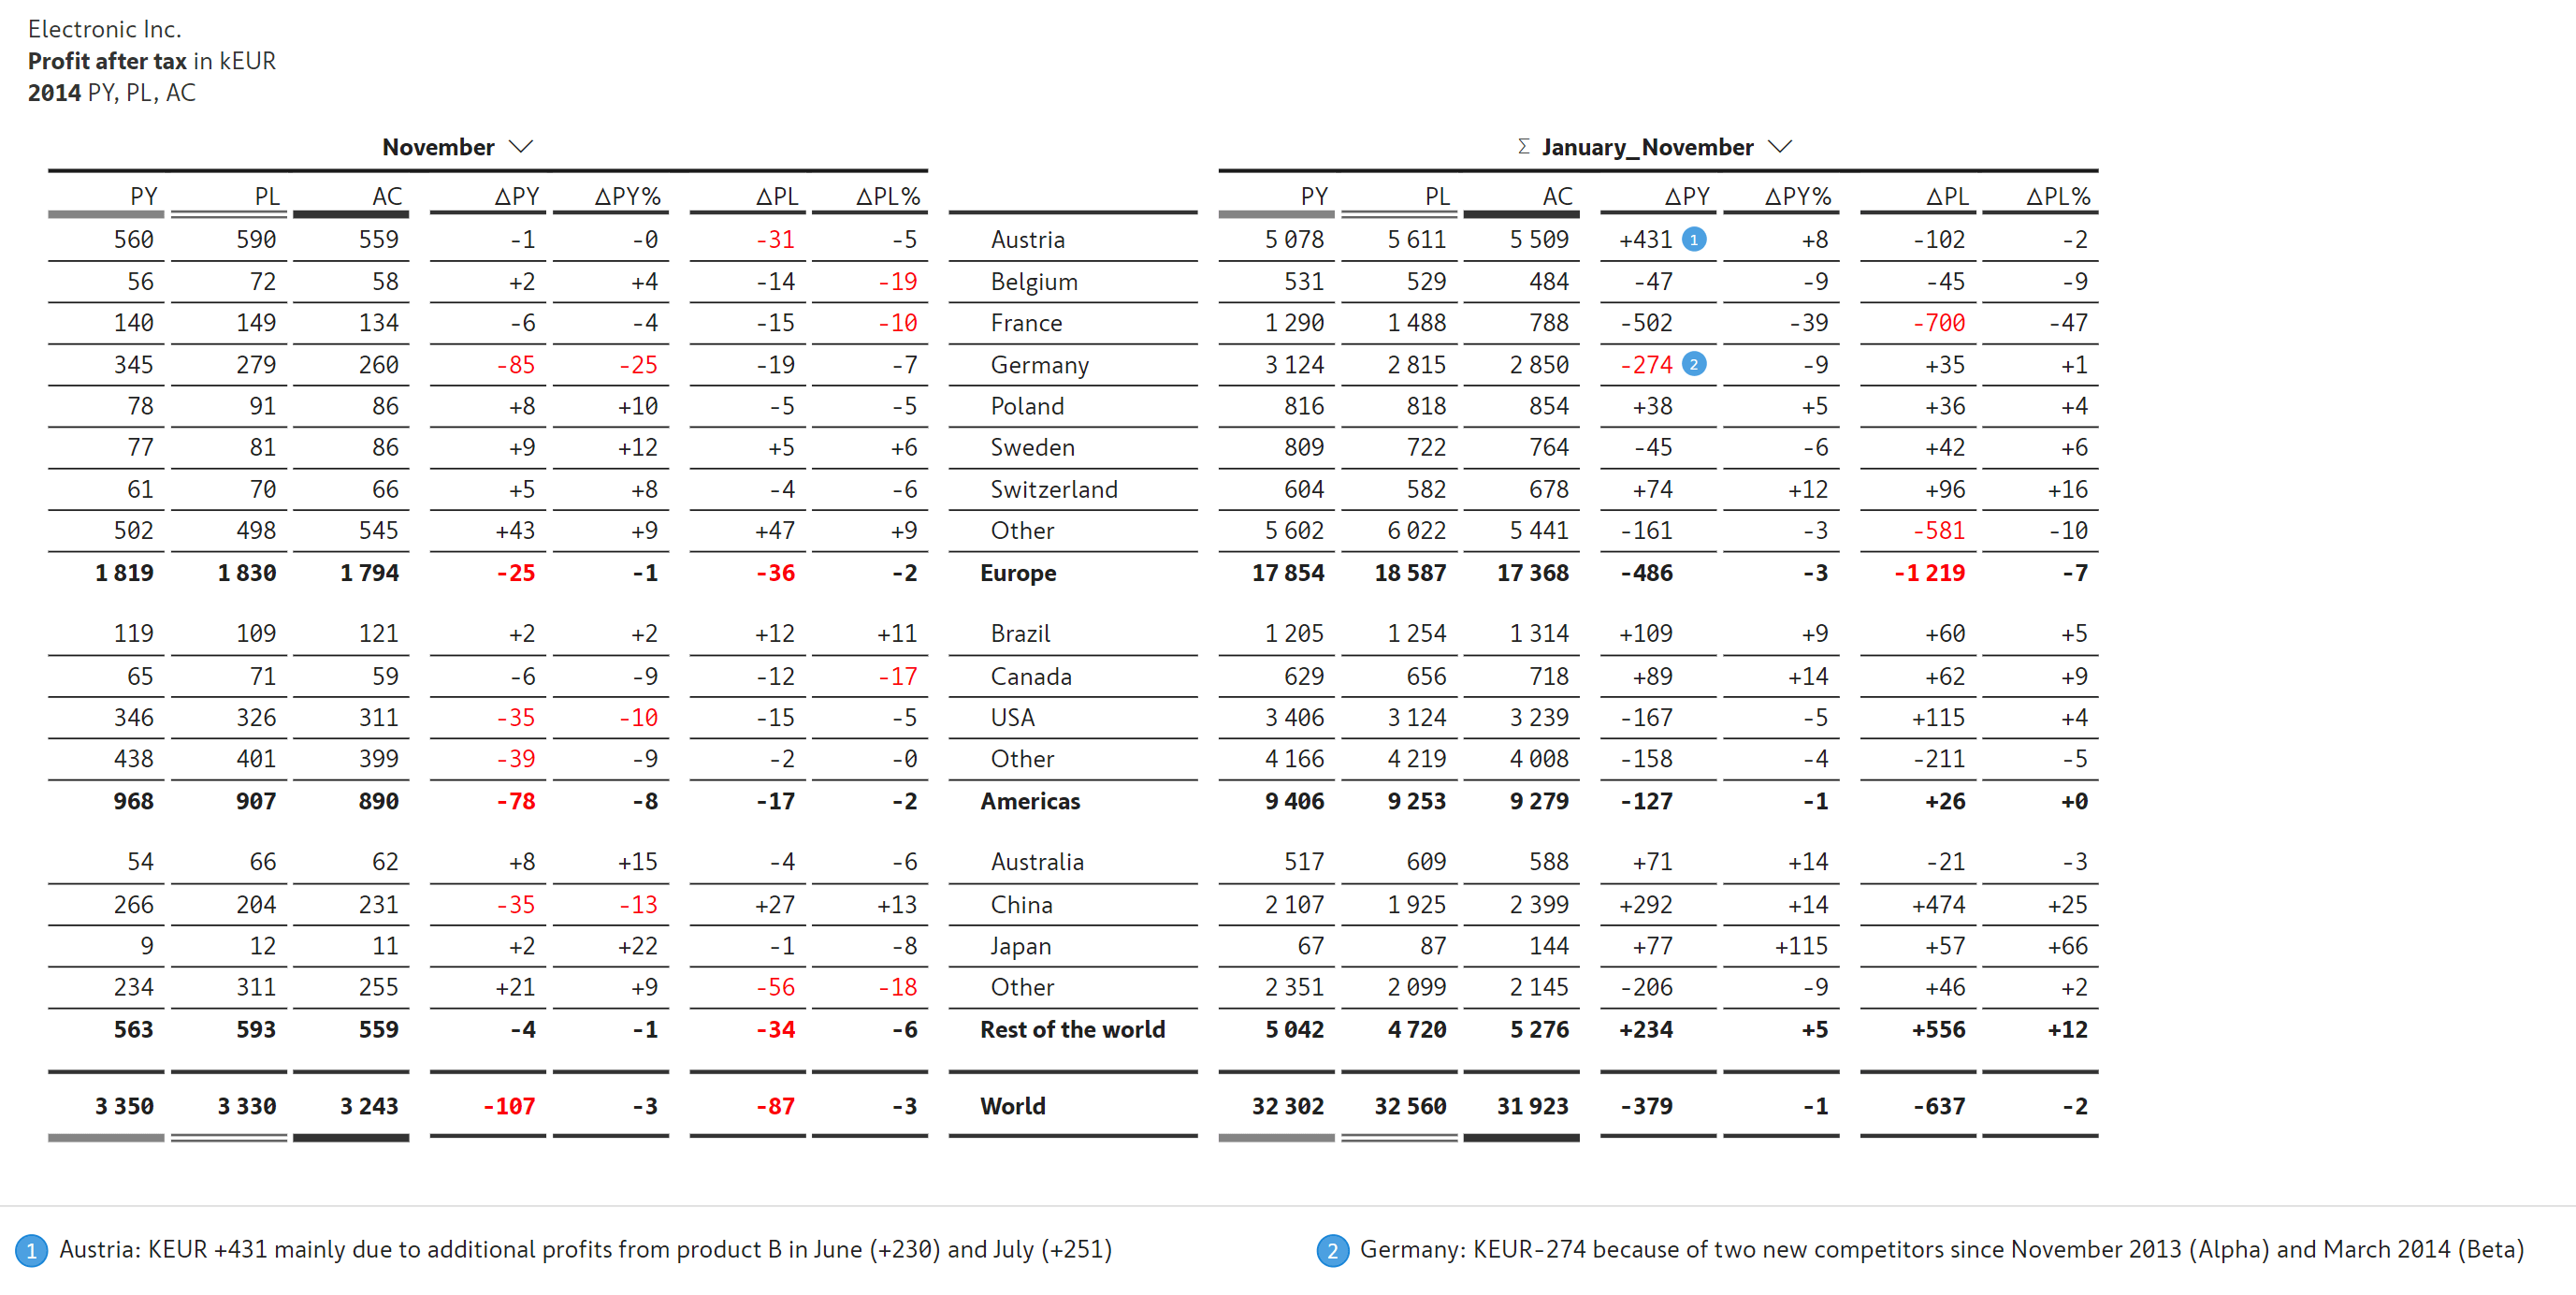
You can also build side-by-side comparison reports using IBCS (International Business Communication Standards) templates.
Inforiver offers five (5) types of IBCS-certified templates. Two (2) of those templates - T01 &T02 - facilitate side-by-side comparison.
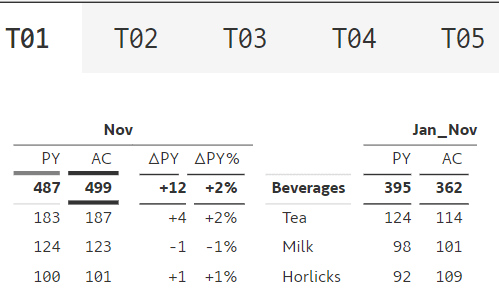
Let’s take a quick look at T01 & T02 templates.
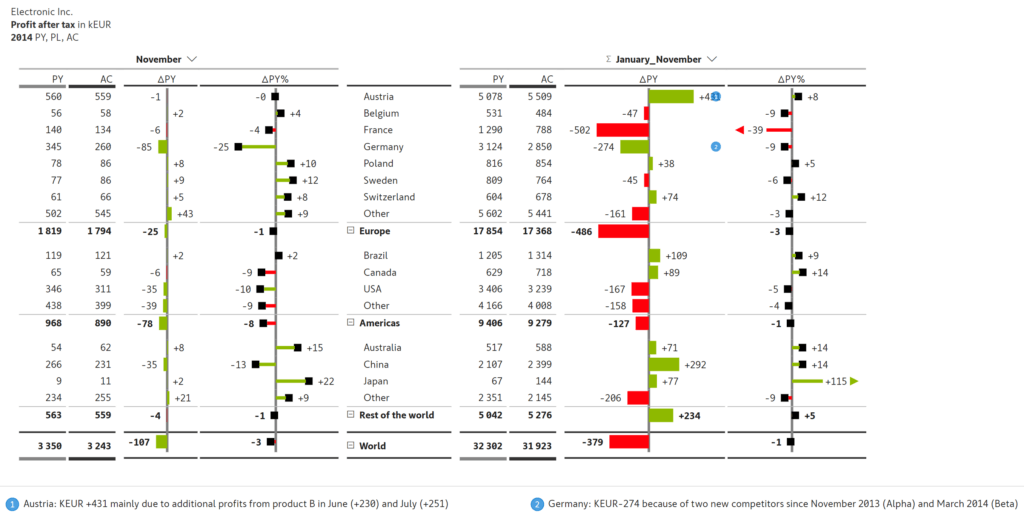
This template is ideal for tracking current period performance vs. till date performance – e.g., Nov vs. Jan to Nov. A unique feature of this template is that it has the categories listed in the middle.
This is similar to the T01 template above, except that the variances are shown in graphs.
Check out our latest video tutorial: Create Side-by-Side Comparison Reports in Power BI
For more information about Report+, please check here.

Inforiver helps enterprises consolidate planning, reporting & analytics on a single platform (Power BI). The no-code, self-service award-winning platform has been recognized as the industry’s best and is adopted by many Fortune 100 firms.
Inforiver is a product of Lumel, the #1 Power BI AppSource Partner. The firm serves over 3,000 customers worldwide through its portfolio of products offered under the brands Inforiver, EDITable, ValQ, and xViz.


