Inforiver

Upcoming webinar on 'Inforiver Charts : The fastest way to deliver stories in Power BI', Aug 29th , Monday, 10.30 AM CST.    Register Now

Beyond Pie Charts: Visualize Power BI Hierarchies with Inforiver Analytics+ Treemap 

by Ashish Chandulal Babaria | Apr 22, 2025 |

The Challenge: Navigating Hierarchical Data Complexity in Power BI 

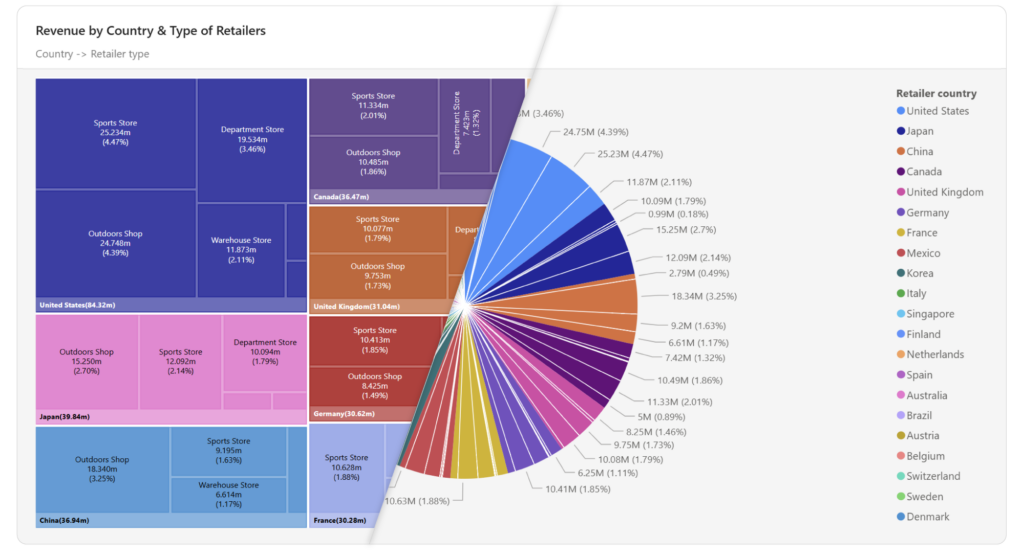
As Power BI Developers and Data Visualizers, you understand the power of effective data storytelling. When visualizing complex hierarchical data in Power BI, standard tools often fall short. However, Treemap in Power BI, especially with custom visuals like Inforiver Analytics+, offers a powerful alternative to cluttered bar and confusing pie charts. These traditional methods struggle with multiple nested categories, making it difficult for Enterprise Decision Makers to discern true proportions and key contributors within their Power BI hierarchy visualization

This limitation hinders the ability to discern true proportions across different hierarchical levels, quickly identify significant drivers within specific tiers, and spot crucial trends that span the entire data structure – all essential for effective analysis and decision-making when you create hierarchy in Power BI

power-bi-hierarchy-visualization-treemap-inforiver

Introducing Inforiver Analytics+ Treemap for Power BI: Elevating Hierarchical Visualization 

Imagine a custom visual for Power BI that effortlessly transforms complex hierarchical data into clear, intuitive, and insightful visualizations. Inforiver Analytics+ Treemap does just that, offering an advanced hierarchy visualization within your familiar Power BI environment. Leveraging the principle of nested rectangles, where the area of each rectangle directly corresponds to its value, Inforiver Analytics+ Treemap provides an immediate and impactful understanding of part-to-whole relationships directly within your Power BI reports. 

Going beyond basic treemap functionality, Inforiver Analytics+ incorporates recursive nesting, enabling the elegant display of multiple hierarchical levels. Visualize intricate structures, from high-level summaries down to granular details, all within a single, easily digestible visual in Power BI. Whether analyzing sales hierarchies, organizational structures, or budget allocations, Inforiver Analytics+ Treemap brings a new level of clarity to your Power BI dashboards, offering a powerful hierarchy chart in Power BI

Key Features Designed for Power BI Professionals: 

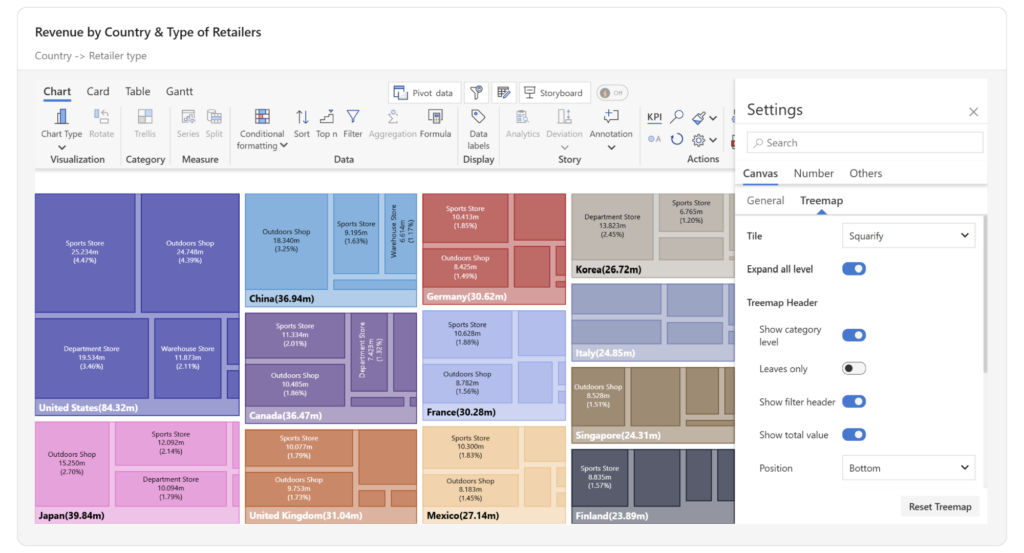
inforiver-analyticsplus-treemap-power-bi-hierarchy-chart

Inforiver Analytics+ Treemap is built with the needs of Power BI Developers and Data Visualizers in mind, offering advanced features to enhance your reporting capabilities for visual hierarchy in Power BI

  • Robust Multi-Level Hierarchy Support: Visualize unlimited nested categories directly within Power BI, providing a comprehensive view of even the most complex hierarchical datasets. 
  • Flexible and Intelligent Tile Layouts: Choose from optimized layouts like Squarify, Slice, and Dice within Power BI to ensure optimal readability and visual appeal for your hierarchical data. 
  • Advanced Color Encoding Options: Utilize Power BI's color palettes or define custom rules to effectively highlight categories and attributes within your hierarchical structure. 
  • Customizable Data Labels within Power BI: Display precise values, percentages, or both directly on the treemap segments, leveraging Power BI's formatting options for optimal presentation. 
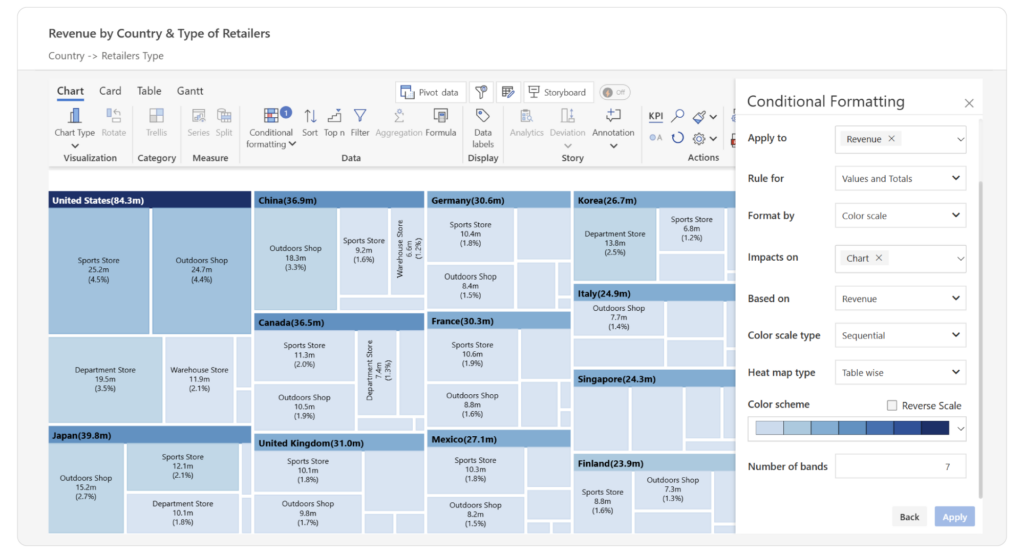
  • Dynamic Conditional Formatting Rules:  Leverage Power BI's conditional formatting capabilities to highlight key performance indicators and outliers within your hierarchical data based on rules or color scales. 
power-bi-inforiver-treemap-hierarchy-visual-features
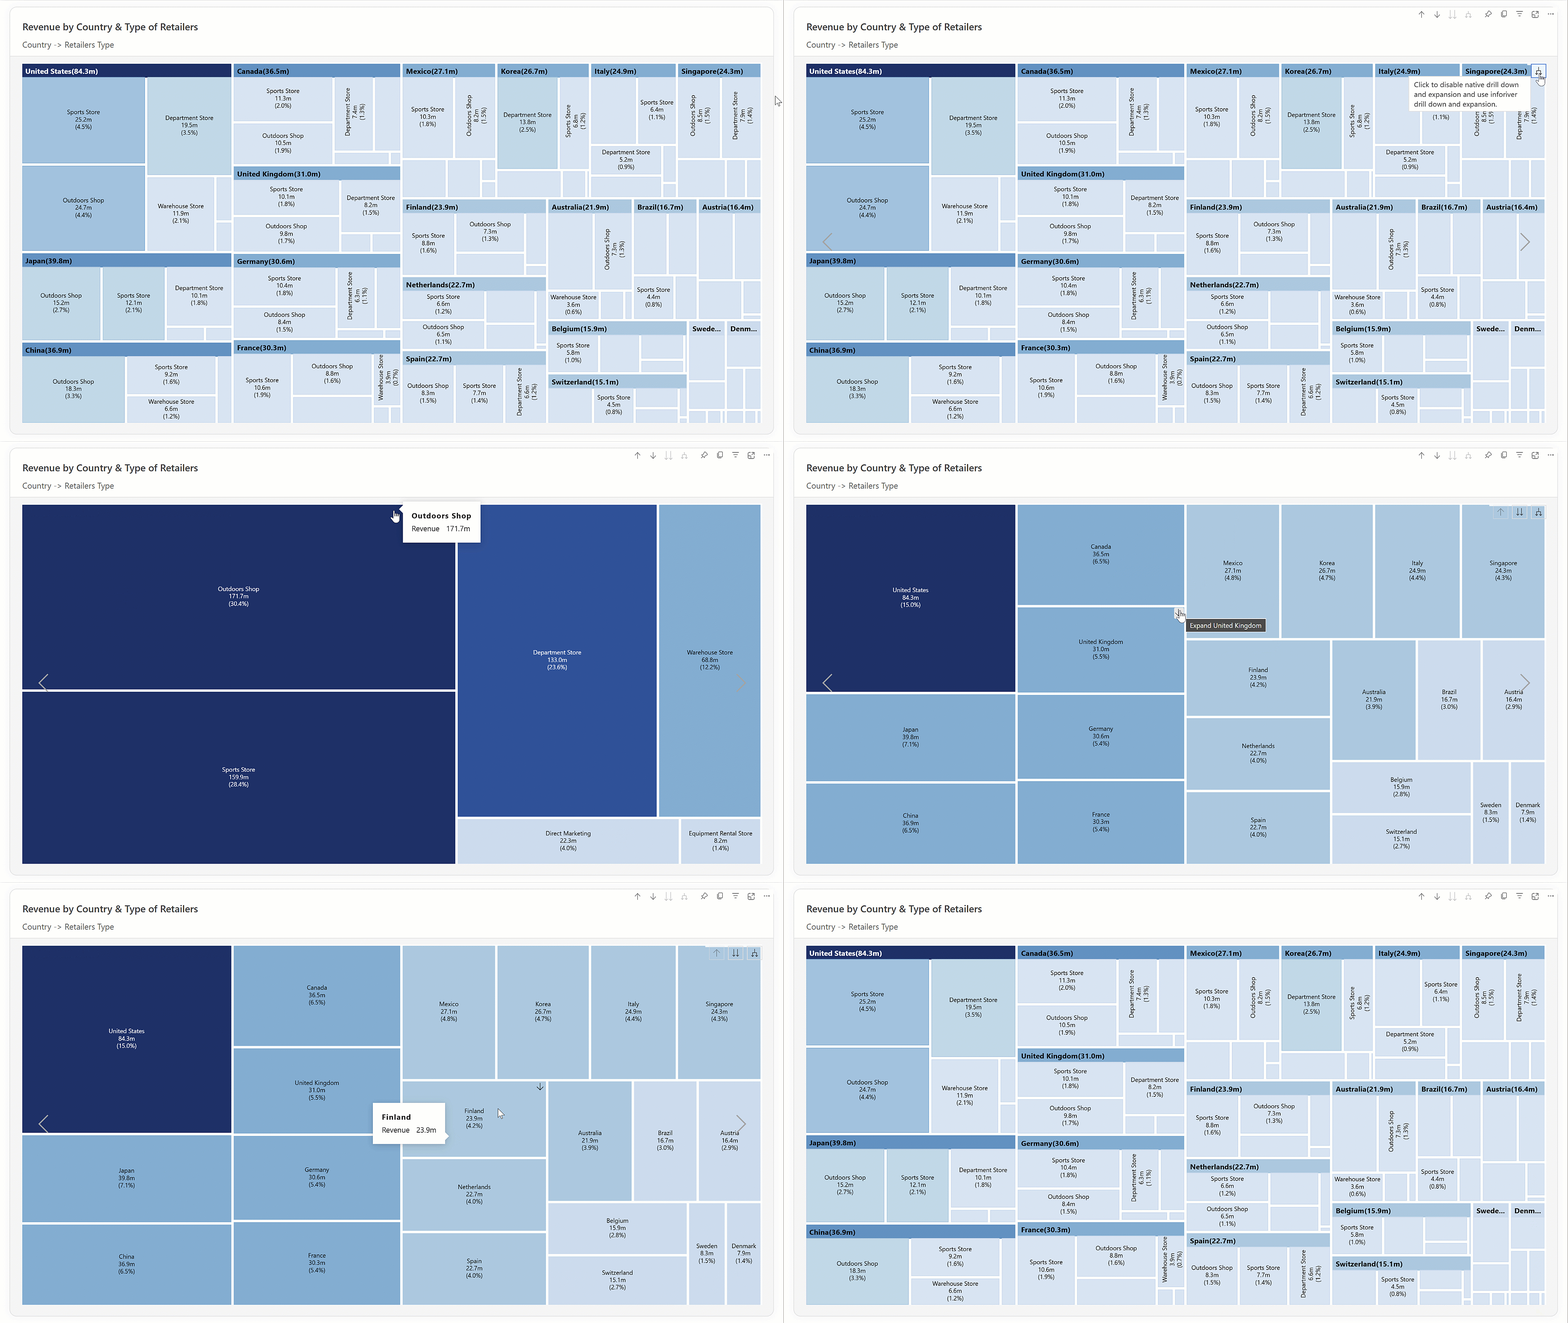
  • Seamless Interactive Drill-Down within Power BI:  Empower end-users (including Enterprise Decision Makers) to explore hierarchical data at their own pace directly within the Power BI report, uncovering deeper insights with simple clicks, offering a truly interactive hierarchy Power BI experience. 
interactive-hierarchy-drilldown-power-bi-inforiver
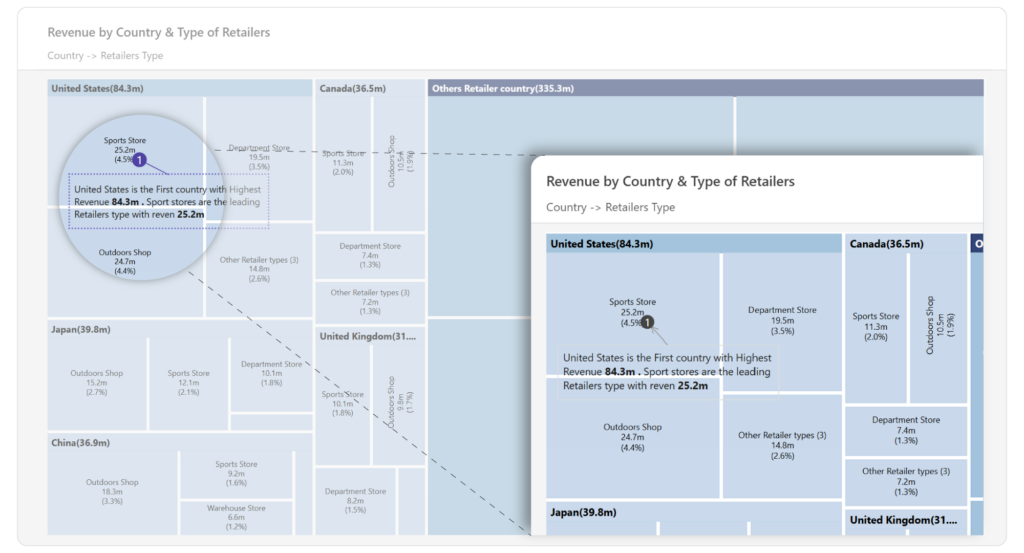
  • Contextual Annotations for Enhanced Storytelling:  Add insightful comments and annotations directly within the Inforiver Analytics+ Treemap in Power BI to provide context and guide interpretation for your audience. 
power-bi-treemap-contextual-annotations-inforiver
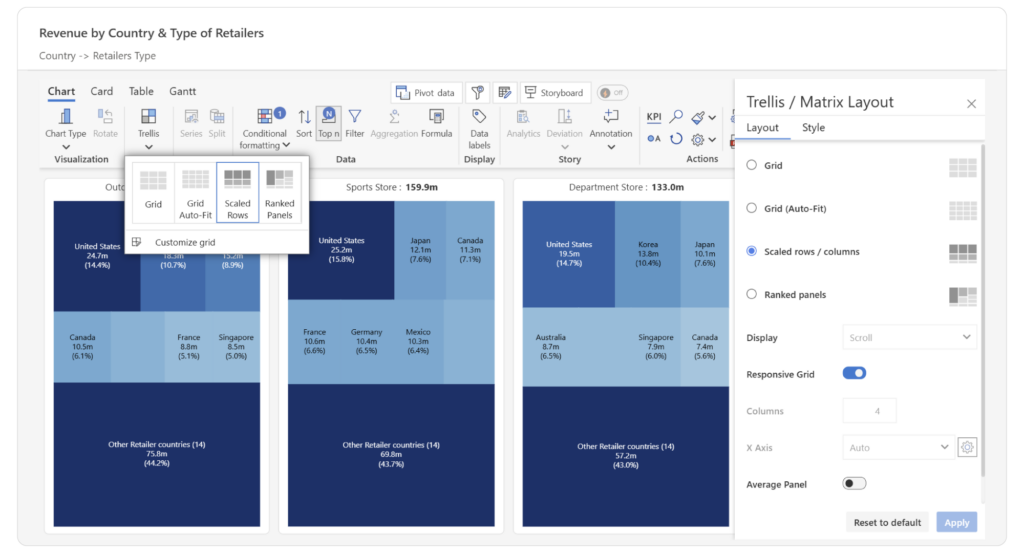
  • Powerful Trellis (Small Multiples) for Comparative Analysis: Break down complex hierarchical treemaps into a series of smaller, comparable panels within Power BI, facilitating easy analysis across different segments. 
power-bi-treemap-small-multiples-inforiver
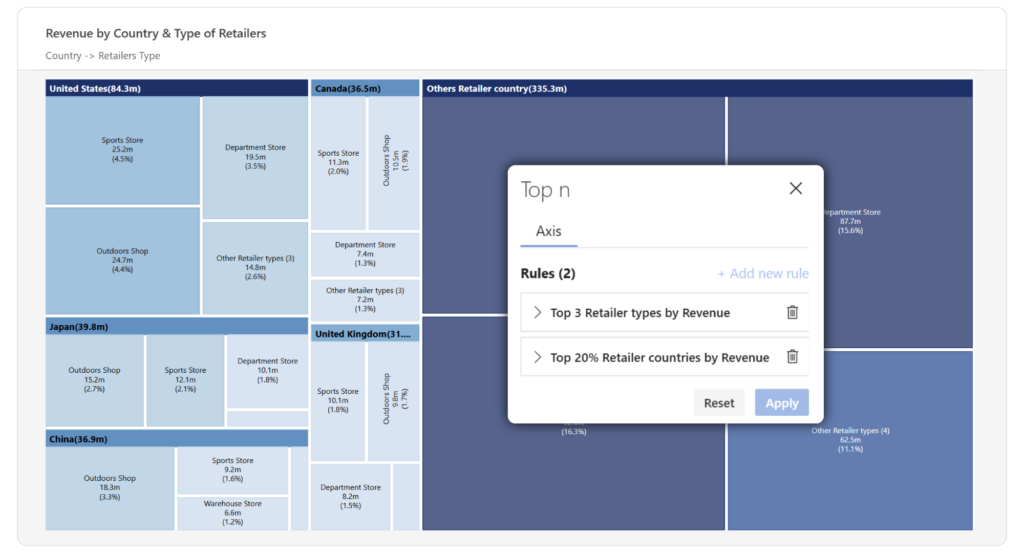
  • Flexible Ranking and "Others" Grouping:  Focus on the most significant contributors within your Power BI data by ranking and grouping less significant categories into an "Others" segment for clearer visualization. 
power-bi-treemap-ranking-others-grouping-inforiver


(For detailed guidance on integrating and utilizing Inforiver Analytics+ Treemap within Power BI, refer to our comprehensive documentation, showing a no-code way to build hierarchy in Power BI for this visual.

Benefits for Power BI Users and Enterprise Decision Makers: 

By leveraging Inforiver Analytics+ Treemap within Power BI, you can achieve significant advantages: 

  • Clear Identification of Key Drivers: Quickly pinpoint the largest and smallest contributors within your hierarchical data directly within Power BI reports. 
  • Intuitive Understanding of Proportions: Gain a clear grasp of part-to-whole relationships at every level of your Power BI hierarchy levels, leading to more informed analysis. 
  • Efficient Visualization of Complex Data: Display large amounts of hierarchical data in a space-efficient and organized manner within Power BI dashboards, reducing visual clutter. 
  • Improved Comprehension of Interrelationships: Understand how different categories relate within the overall hierarchy in your Power BI data models, potentially even exploring Power BI hierarchy levels with drill-through capabilities offered by Inforiver Analytics+. 
  • Empowered Self-Service Exploration: Enable Enterprise Decision Makers to interactively explore hierarchical data within Power BI, uncovering insights without relying solely on static reports. 
     
benefits-power-bi-users-enterprise-treemap-inforiver


Stop struggling with the limitations of standard Power BI visuals for hierarchical data. Embrace the power and flexibility of Inforiver Analytics+ Treemap and transform your Power BI reports into insightful and actionable tools.

Power BI Developers and Data Visualizers, try Inforiver Analytics+ for FREE and explore the interactive demos. Enterprise Decision Makers, request a demo to see how Inforiver Analytics+ can unlock deeper understanding from your hierarchical Power BI data. Visit our website to learn more and experience the difference a dedicated hierarchical visual can make. 


Share this on:

Get Inforiver brochure

Maximize your business potential with Inforiver's paginated reporting, data entry, planning & budgeting capabilities
Download now
Inforiver

Inforiver helps enterprises consolidate planning, reporting & analytics on a single platform (Power BI). The no-code, self-service award-winning platform has been recognized as the industry’s best and is adopted by many Fortune 100 firms.

Inforiver is a product of Lumel, the #1 Power BI AppSource Partner. The firm serves over 3,000 customers worldwide through its portfolio of products offered under the brands Inforiver, EDITable, ValQ, and xViz.

linkedin facebook pinterest youtube rss twitter instagram facebook-blank rss-blank linkedin-blank pinterest youtube twitter instagram