Upcoming webinar on 'Inforiver Charts : The fastest way to deliver stories in Power BI', Aug 29th , Monday, 10.30 AM CST. Register Now
Upcoming webinar on 'Inforiver Charts : The fastest way to deliver stories in Power BI', Aug 29th , Monday, 10.30 AM CST. Register Now
Organizational data can grow at gigabytes or even petabytes per day, subject to the type of industry. Business reporting involves cross-referencing data from multiple tables and different semantic models, ensuring data integrity for massive data volumes is nearly impossible if the data is manually maintained. The Inforiver Lookup visual has been designed to help you seamlessly integrate data from different semantic models into your reports and ensure that the data is up-to-date and accurate.
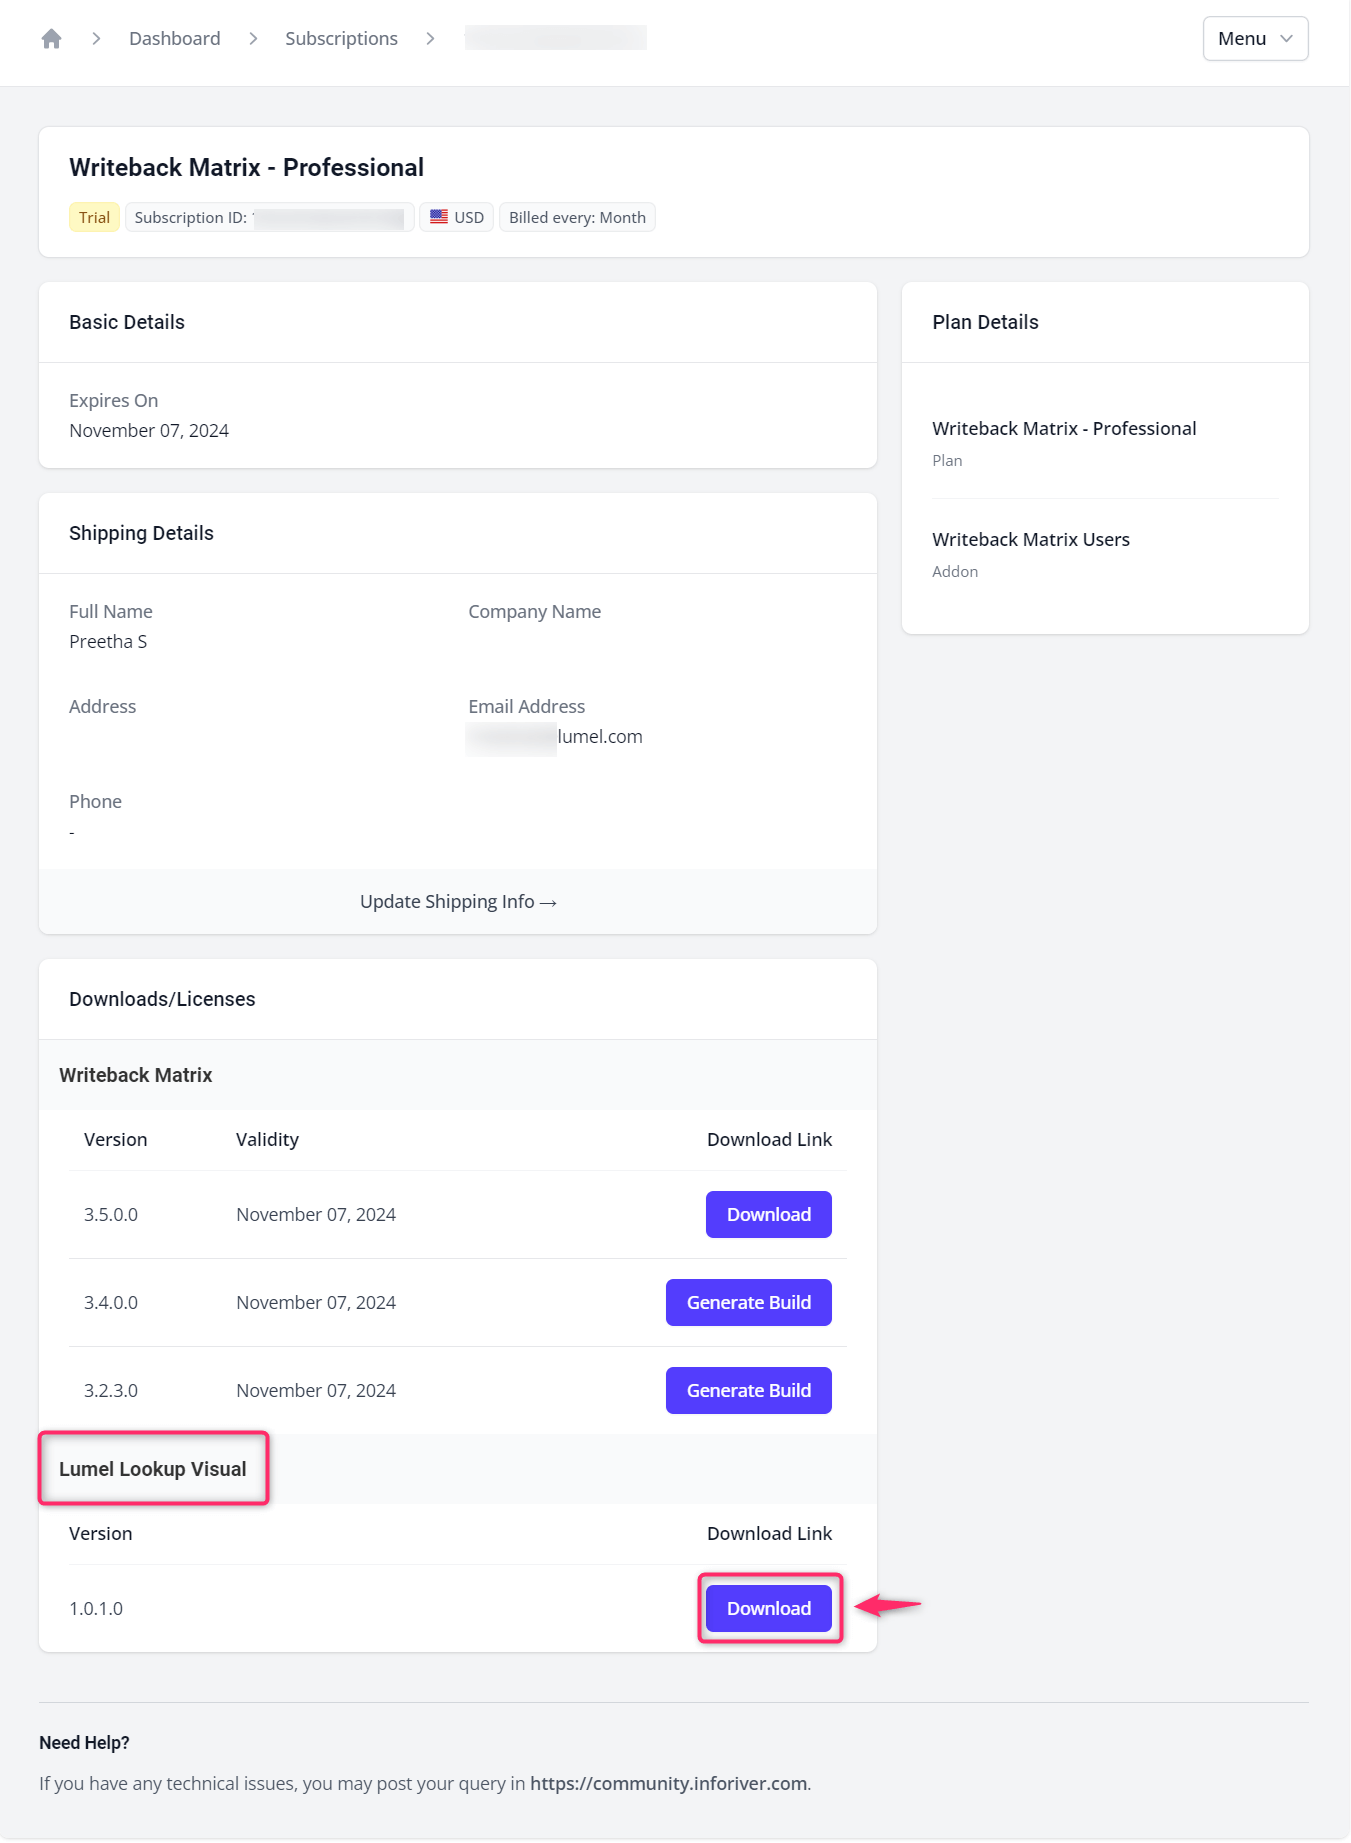
The Inforiver Lookup visual works in tandem with the Matrix visuals. It can be downloaded from our customer portal for free and then imported into Power BI.
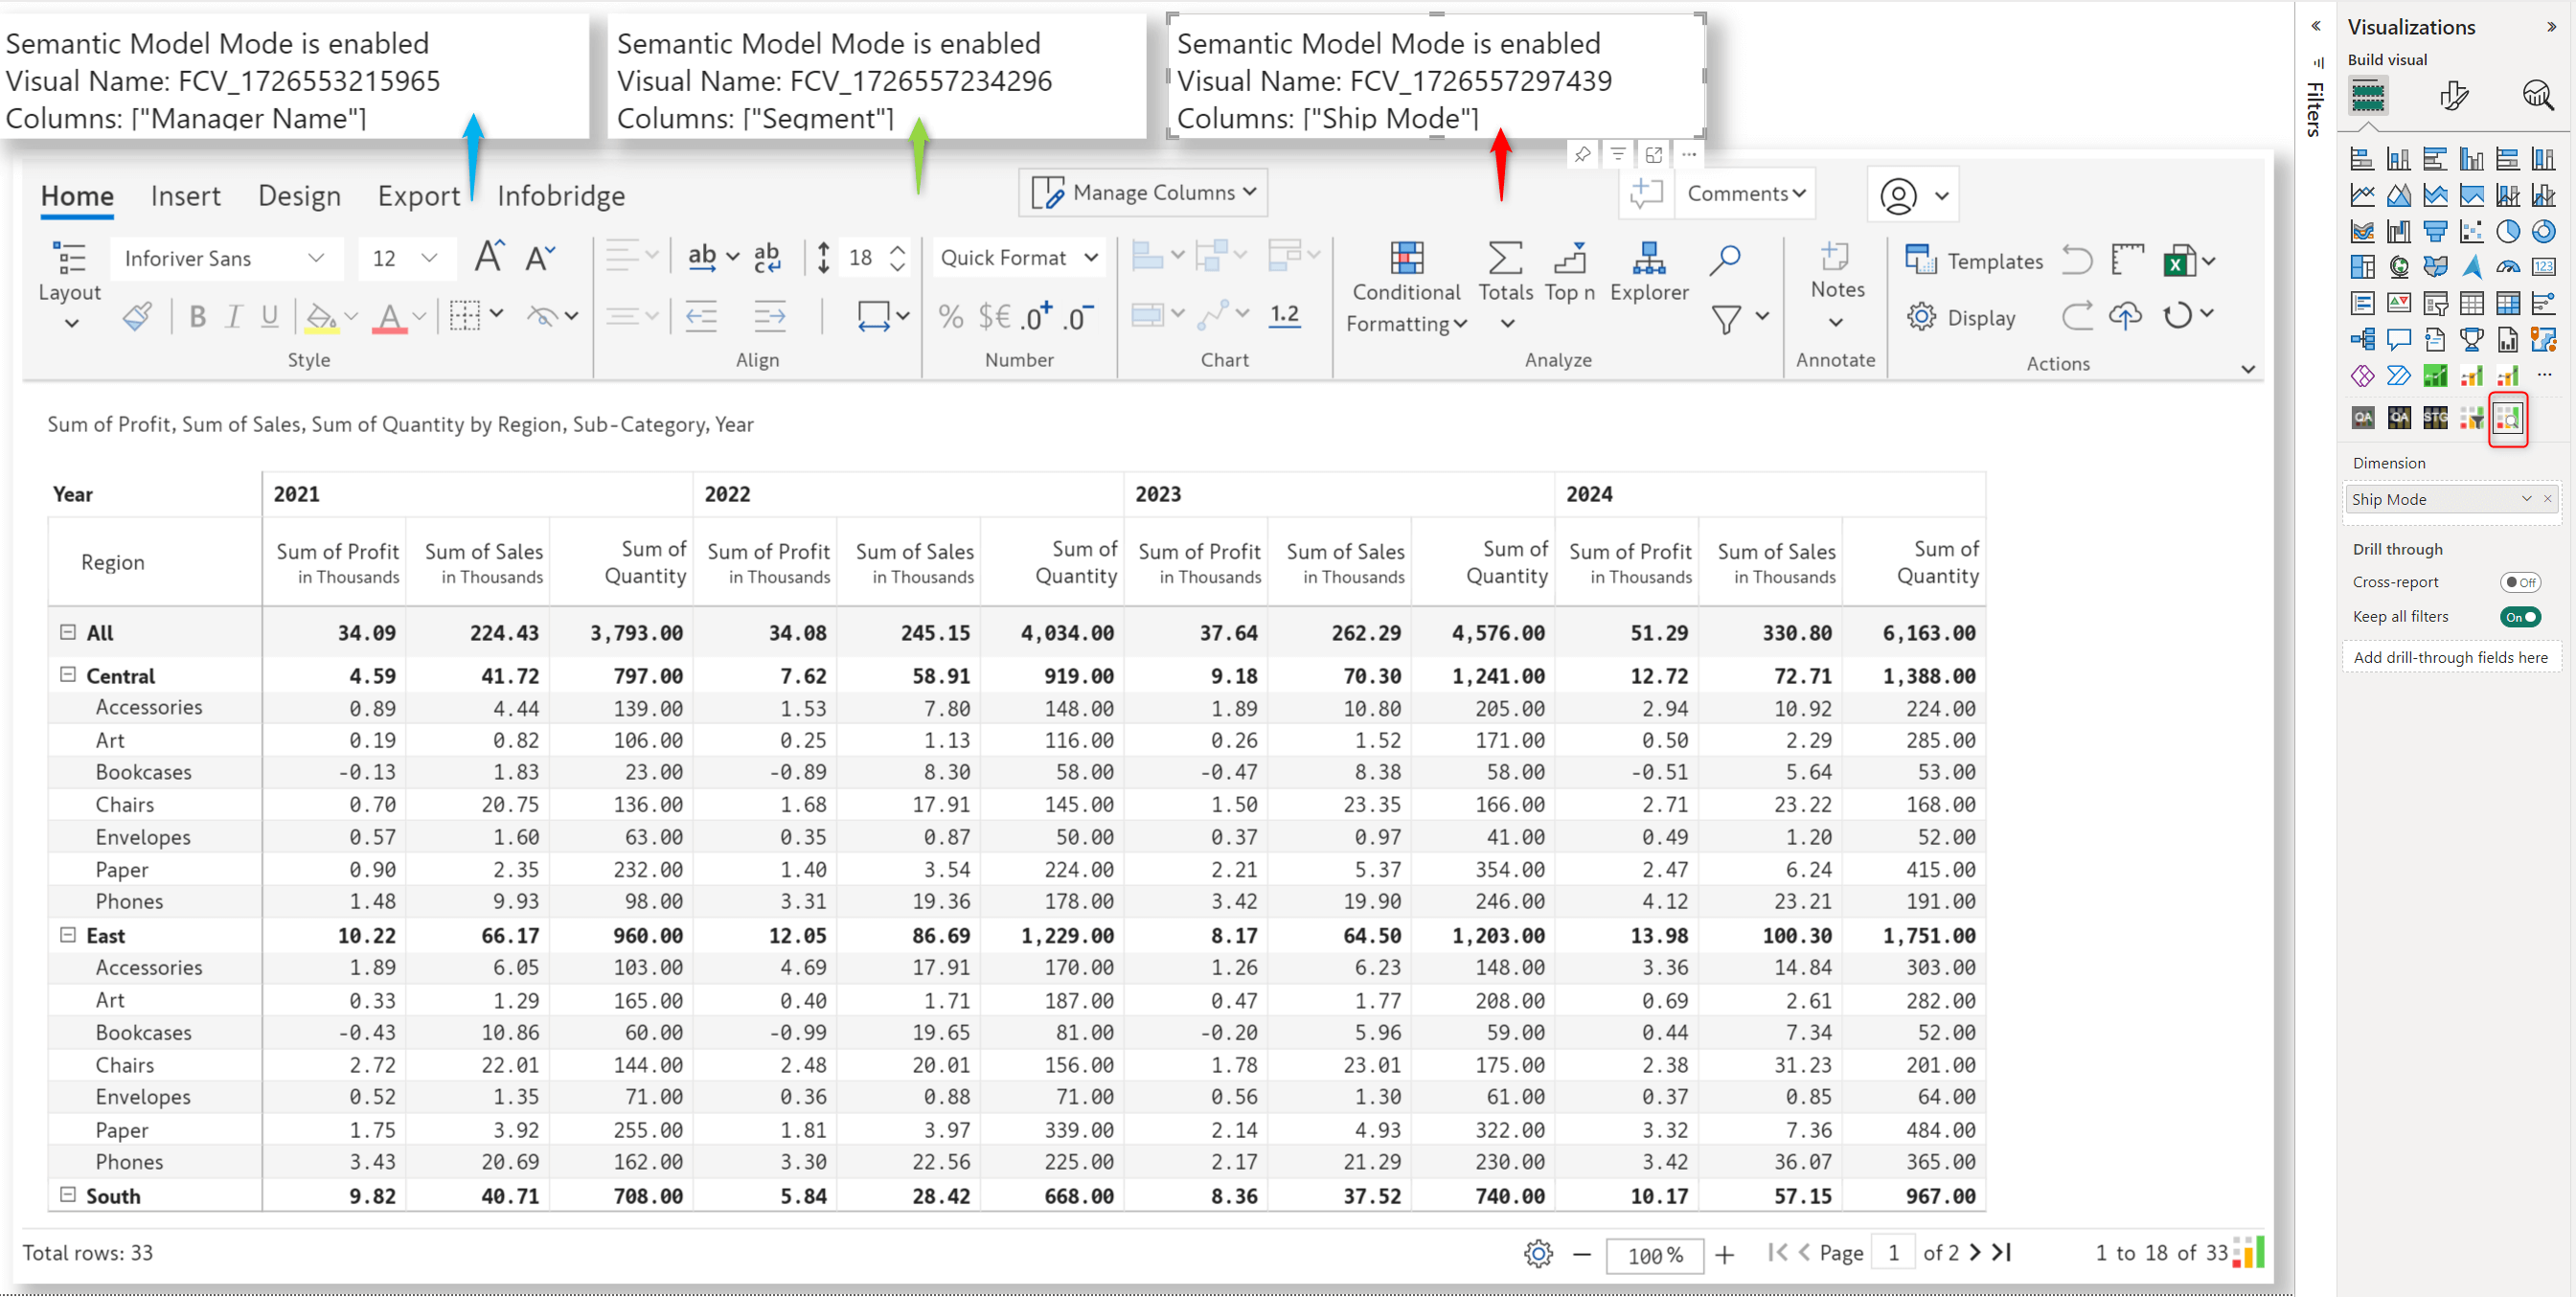
Configuring the visual is as simple as dragging the dimension you want to cross-reference into the Dimension field. Depending on the number of tables in your report, you can add multiple lookup visuals.
In earlier versions of Inforiver, dropdown options could only be sourced by connecting to semantic models within the Inforiver visual. This required extensive backend processing and explicit semantic model refreshes and did not adhere to RLS settings. This option is still available; however, the Lookup visual is recommended. It is a more efficient solution that overcomes the drawbacks of connecting directly to the semantic model from Inforiver – the data is refreshed automatically when the Power BI semantic model is refreshed, and RLS settings are honored.
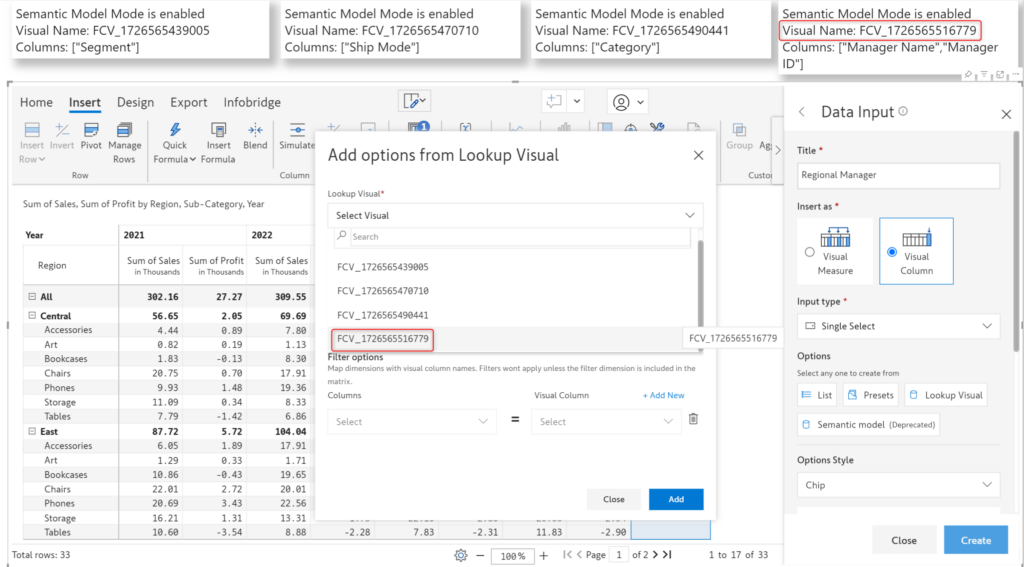
While creating data input dropdown fields, you can source options by defining a custom list, using Inforiver’s built-in presets, or using the Lookup Visual option. Note that the Semantic model option is still available but deprecated.
STEP 1: Specify the lookup visual name
When you choose the Lookup Visual option, you must specify the visual name in the configuration. In this case, we are populating dropdown options for the manager’s name – so we’ve selected the corresponding visual name.
STEP 2: Assign the field to source dropdown options
Next, select the Column Label field – the options in the dropdown will be sourced from this field. If you have a primary key or ID field associated with the label field, you can assign the ID field to the Column ID. If the column labels are updated, the ID field mapping ensures that the updated value will be reflected in your reports.
Note: If your lookup table has no ID field, use the same label field (in this example, Manager Name) as Column ID.
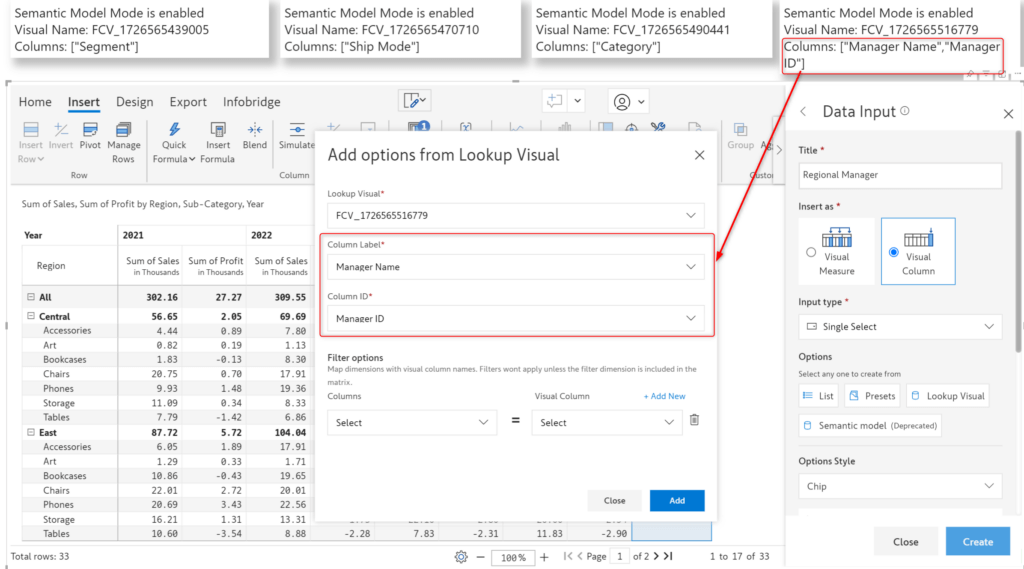
Click Add to apply the configuration and create the dropdown.
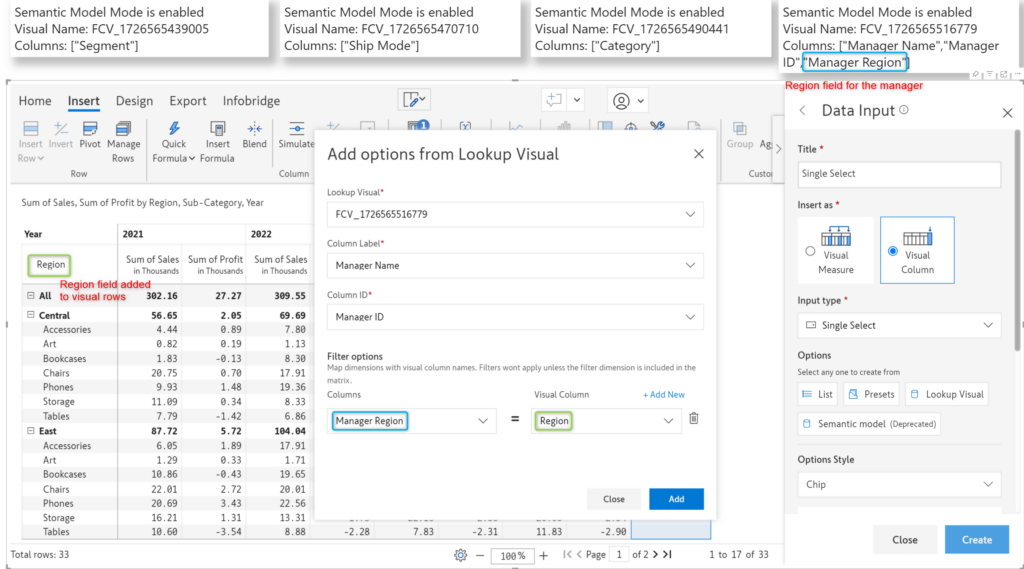
Let’s take a closer look at assigning a manager from the dropdown. Suppose a manager has jurisdiction over South and East regions only – but he is assigned as an approver for a product category in the Central region. An incorrect assignment like this could result in ambiguity, delays, and possible financial losses. When you deal with huge data volumes, such operational errors are inevitable.
With Inforiver, you can enforce data integrity by specifying filters while configuring dropdowns. Please be aware that to use filters, the dimension (in this case, Region) needs to be added to the Inforiver and Lookup visuals.
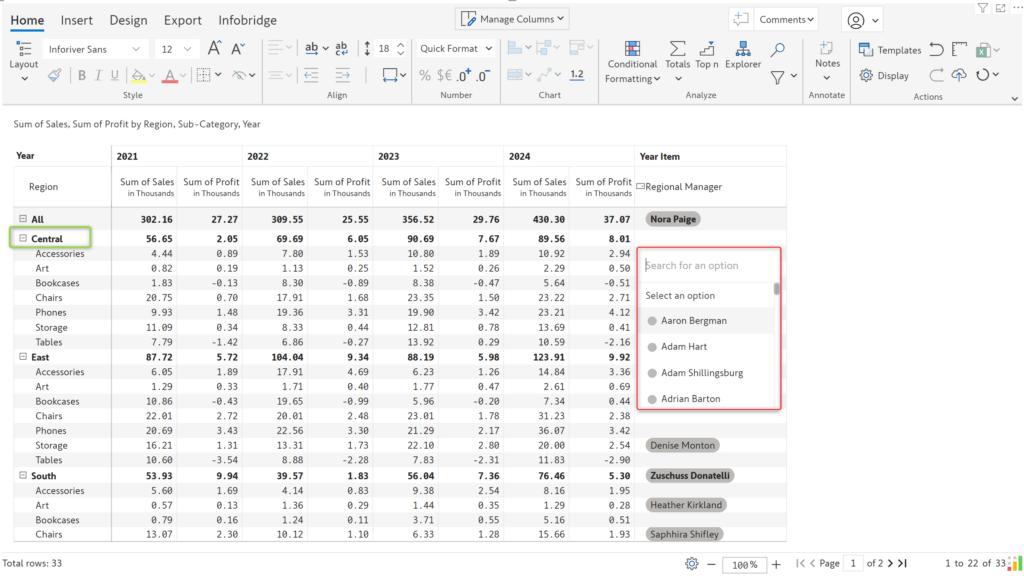
Let’s look at the dropdown in action. With filters applied, notice how the options change dynamically based on the region.
Options for central region:
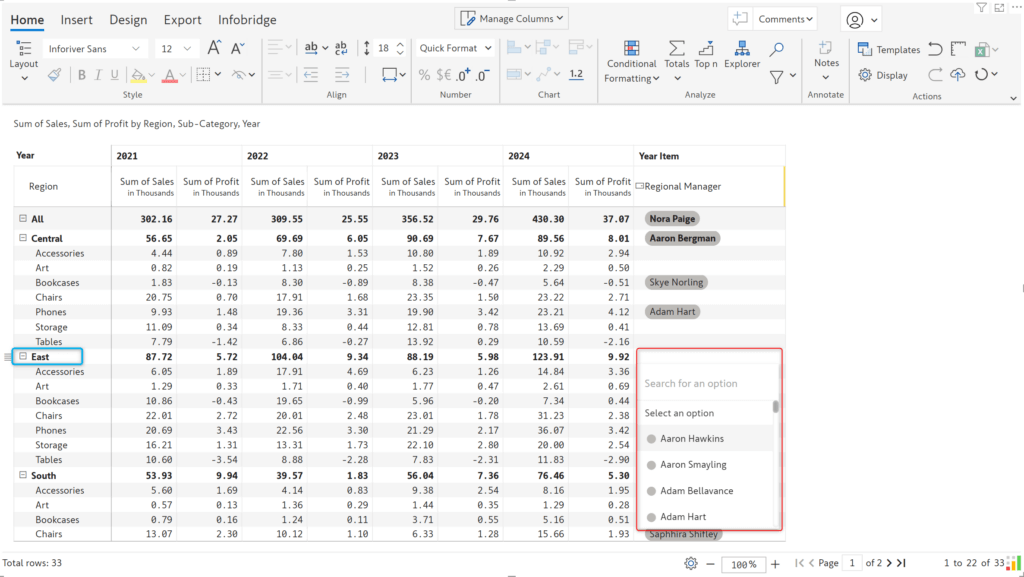
Options for South region:
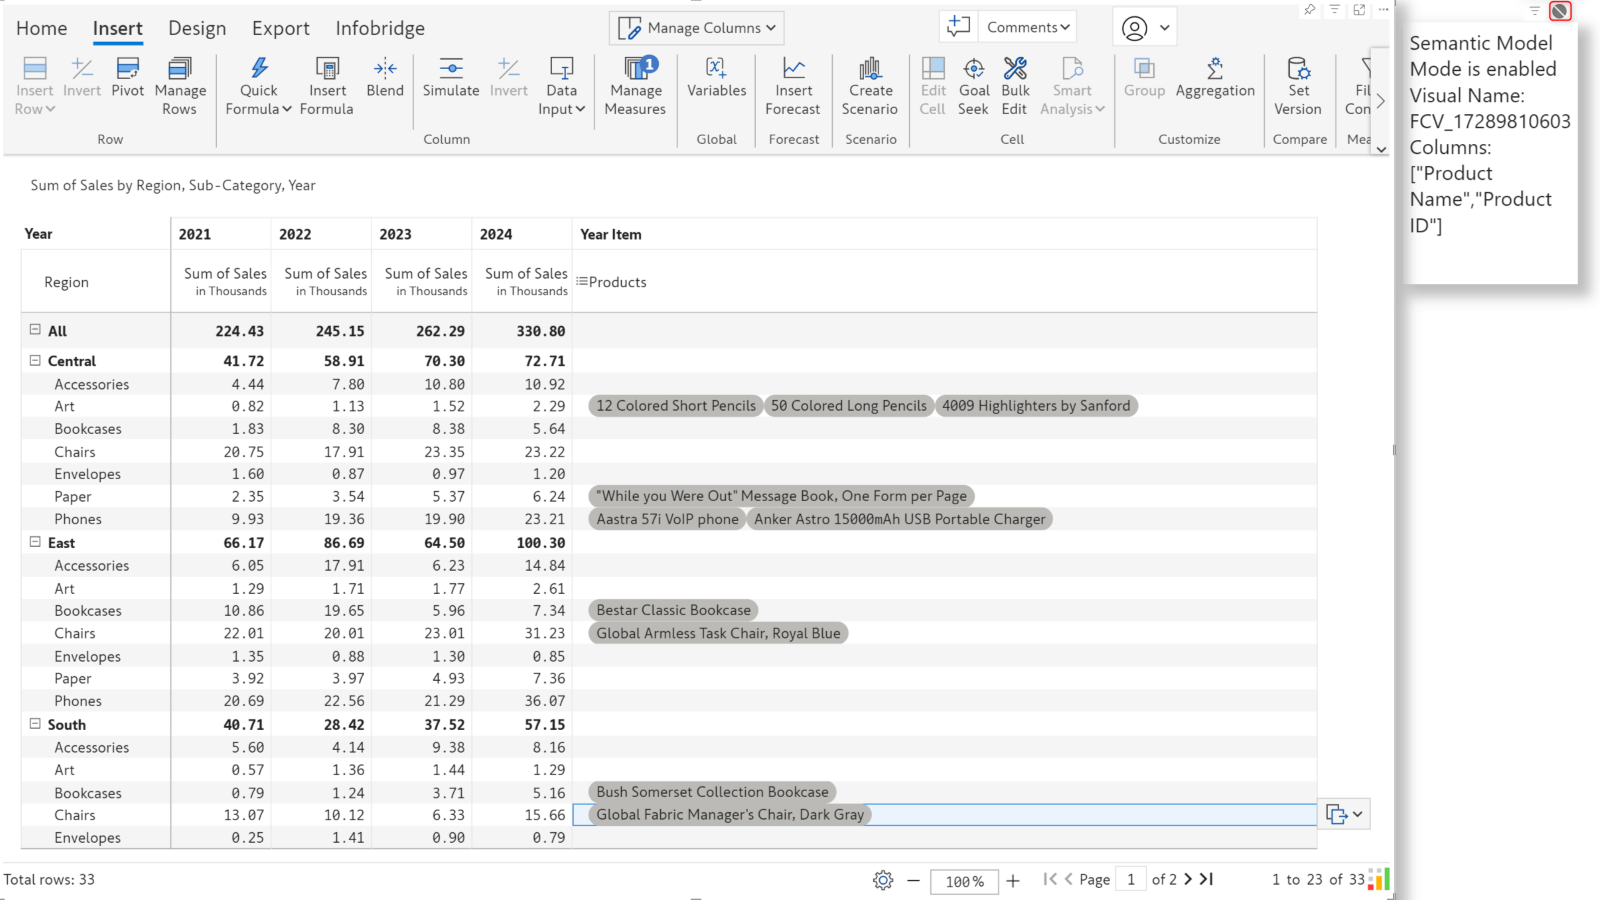
Automatic cross-filtering
The lookup visual is primarily intended to cross-reference data, but it has the added capability to cross-filter as well. The sample report shown below sources product data from a lookup visual. Notice how the product names change dynamically based on the product sub-category.
Please bear in mind that the Power BI Edit interactions toggle needs to be enabled for this feature to work correctly.
Disable the cross-filter option to pull all the data from the lookup visual, irrespective of the row dimension category in the matrix.
Although it has been deprecated, Inforiver will continue to support the semantic model option to source dropdown values. Existing reports will function without any issues. However, you will not be able to modify the semantic model configuration. You will need to replace the semantic model option with a lookup visual to make any updates to the dropdown values.
We encourage you to switch your Power BI slicers to the new Inforiver Lookup visual if you need to source additional data from semantic models. The Inforiver Matrix and Lookup visuals are designed to work together to provide a smooth reporting experience.
To learn more about the latest from Inforiver and why we are garnering recognition from industry experts, check out our newest brochure.
Inforiver and all our planning and analytics products continue to be updated to provide a diverse range of users with optimal performance. With continual improvements and innovations planned, we welcome your feedback.
If you’re ready to level up your planning, reporting, and analytics, try our products for free today.

Inforiver helps enterprises consolidate planning, reporting & analytics on a single platform (Power BI). The no-code, self-service award-winning platform has been recognized as the industry’s best and is adopted by many Fortune 100 firms.
Inforiver is a product of Lumel, the #1 Power BI AppSource Partner. The firm serves over 3,000 customers worldwide through its portfolio of products offered under the brands Inforiver, EDITable, ValQ, and xViz.