Inforiver

Upcoming webinar on 'Inforiver Charts : The fastest way to deliver stories in Power BI', Aug 29th , Monday, 10.30 AM CST.    Register Now
Waterfall Chart

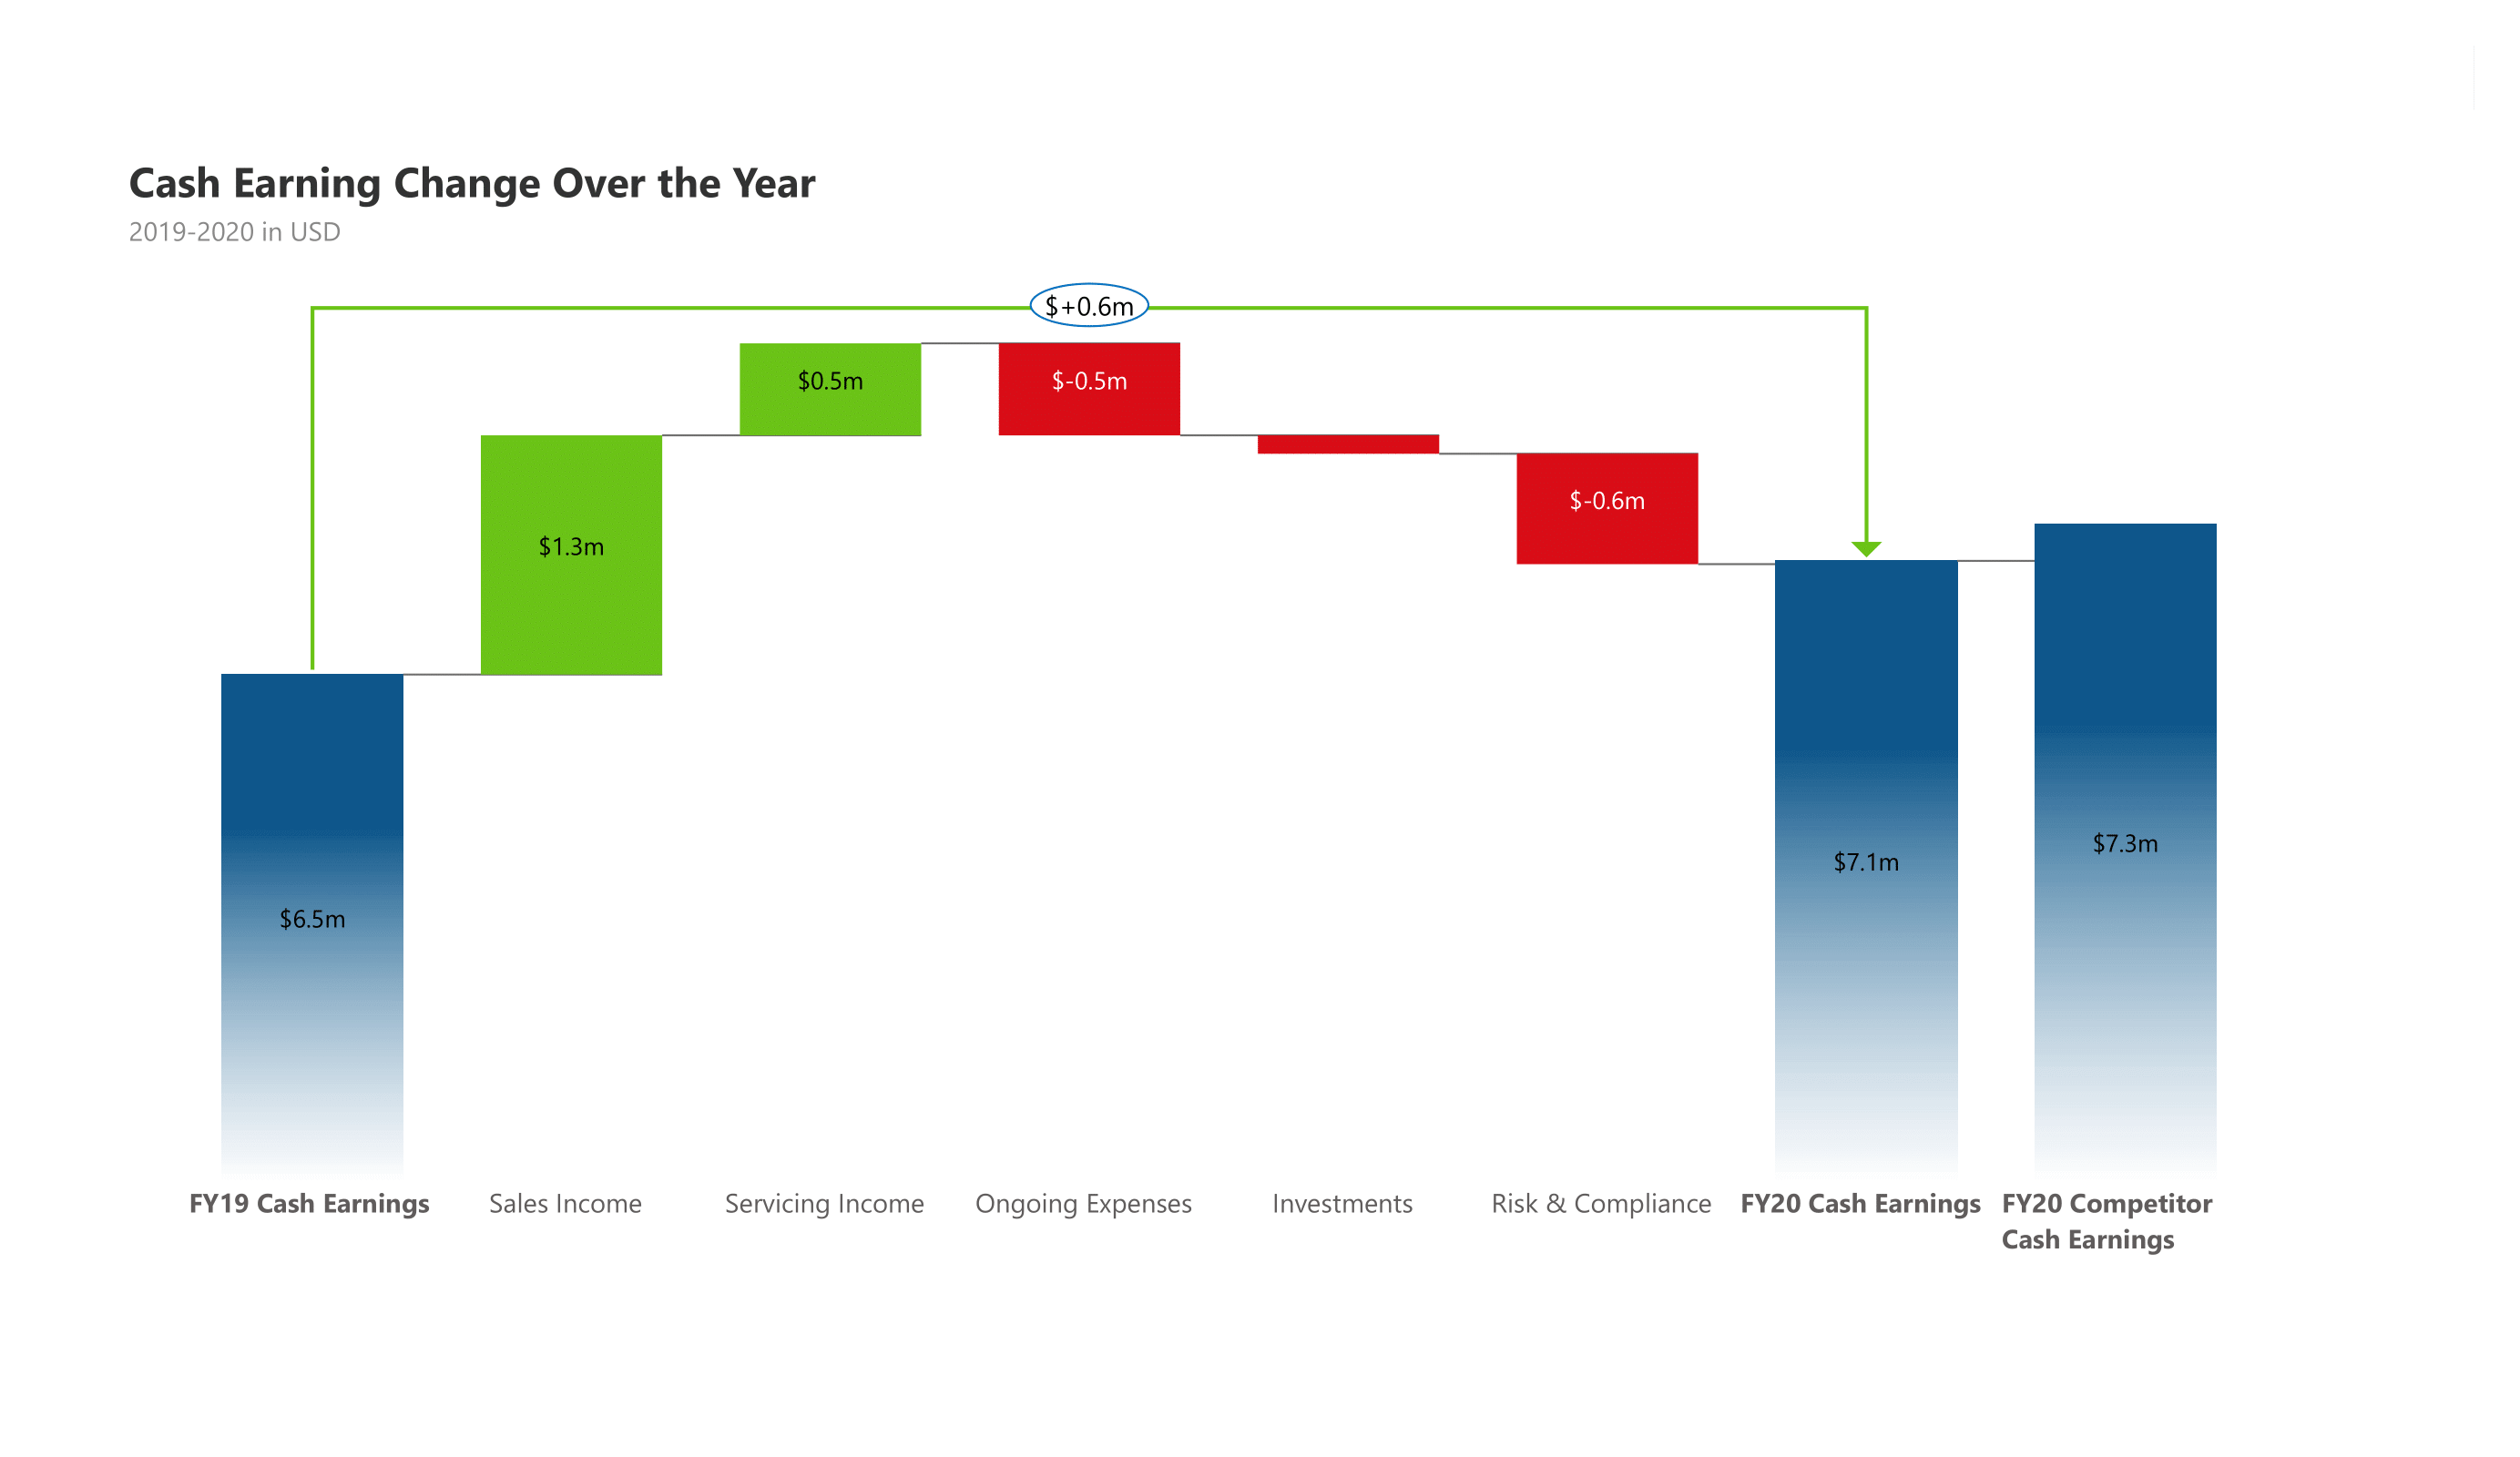
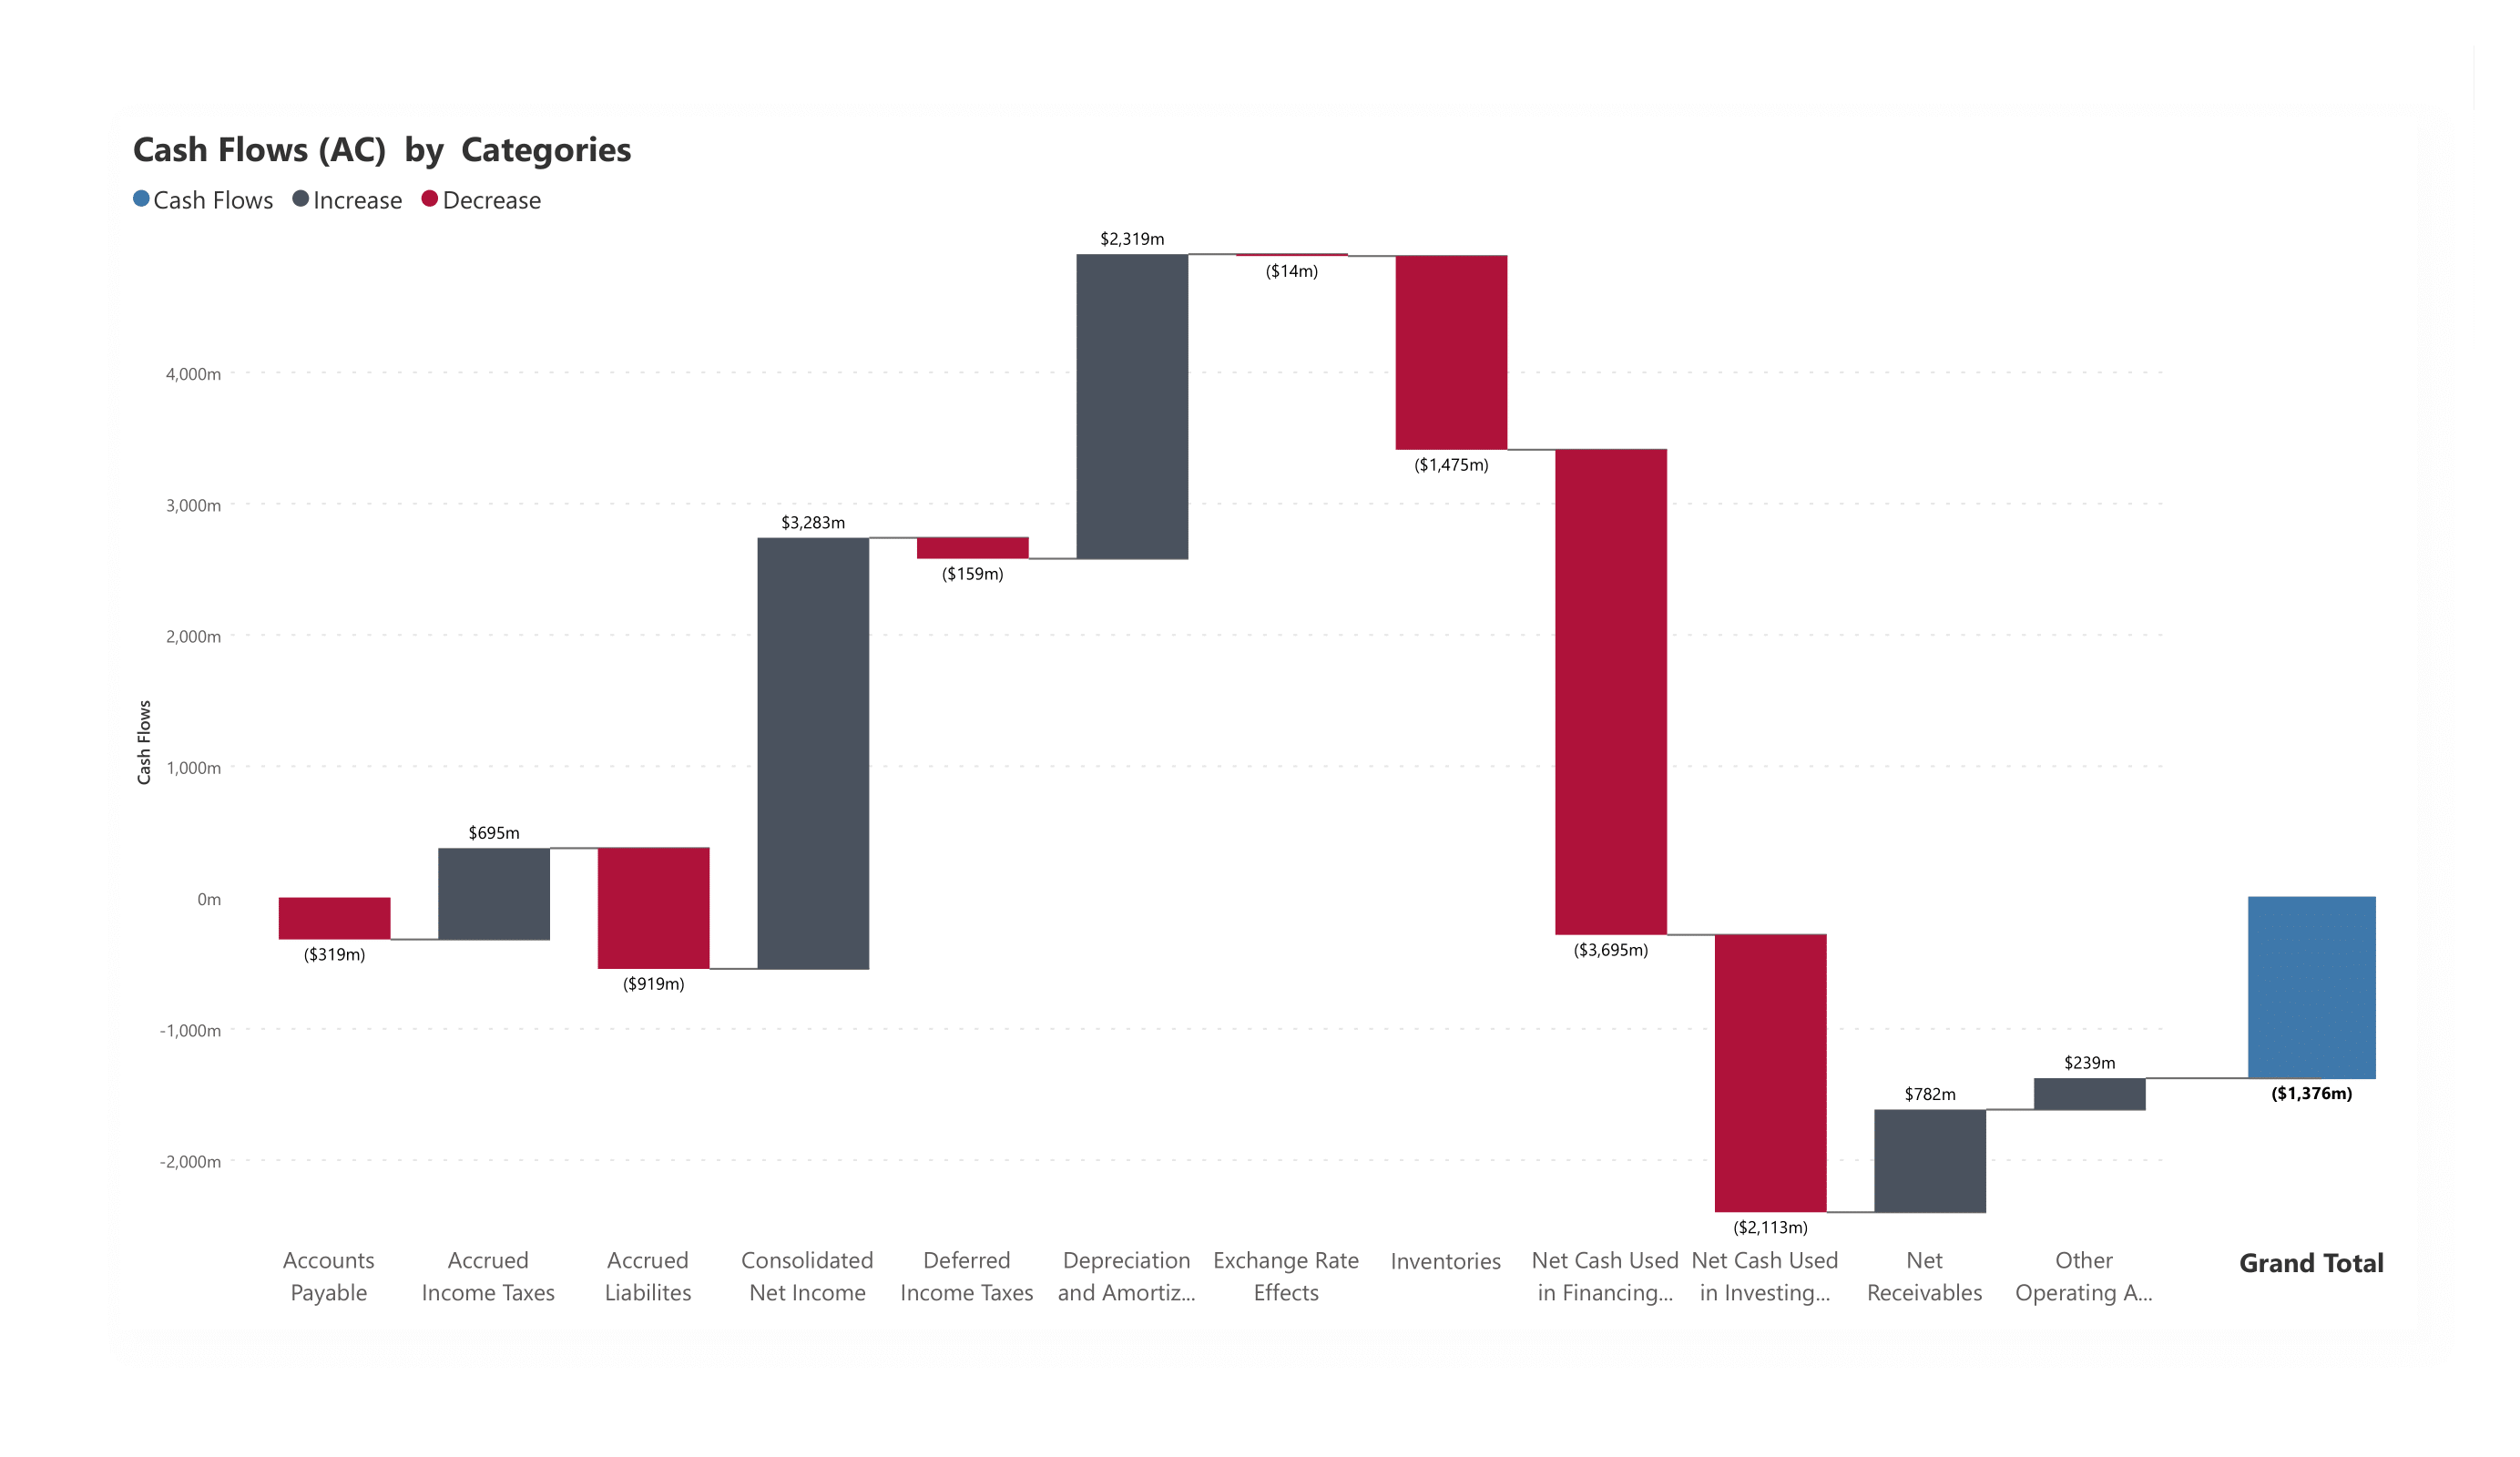
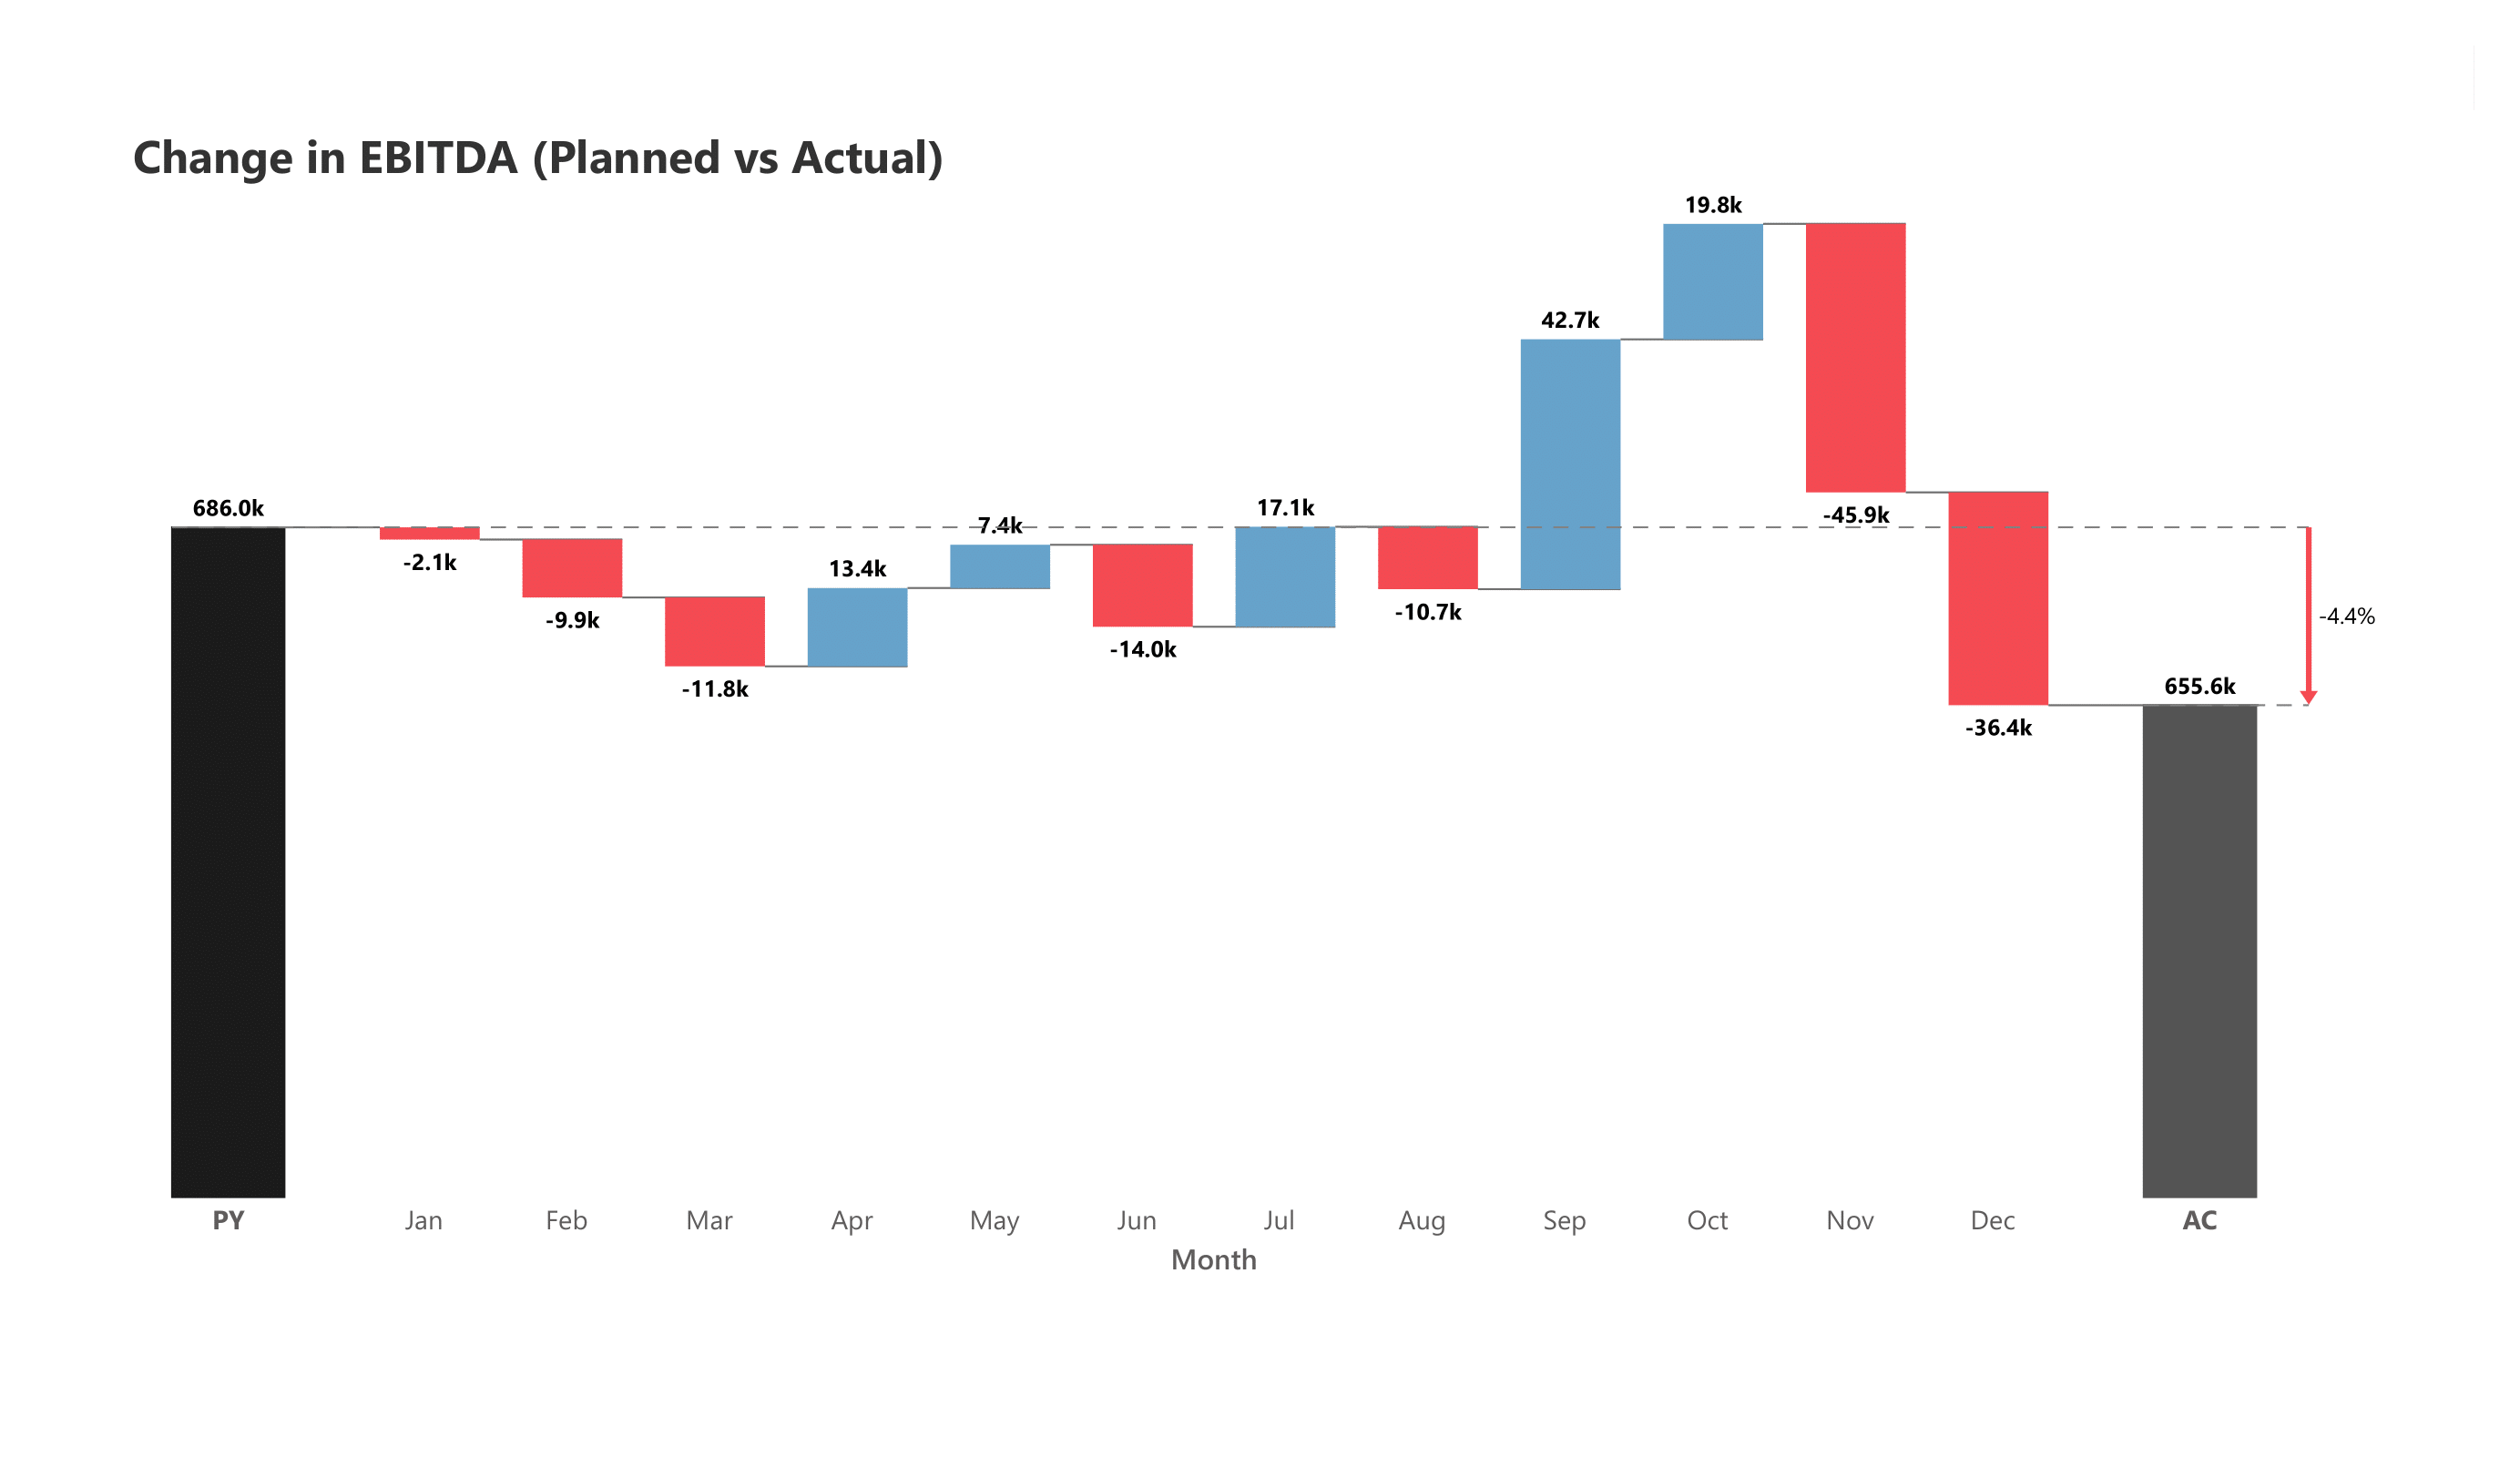
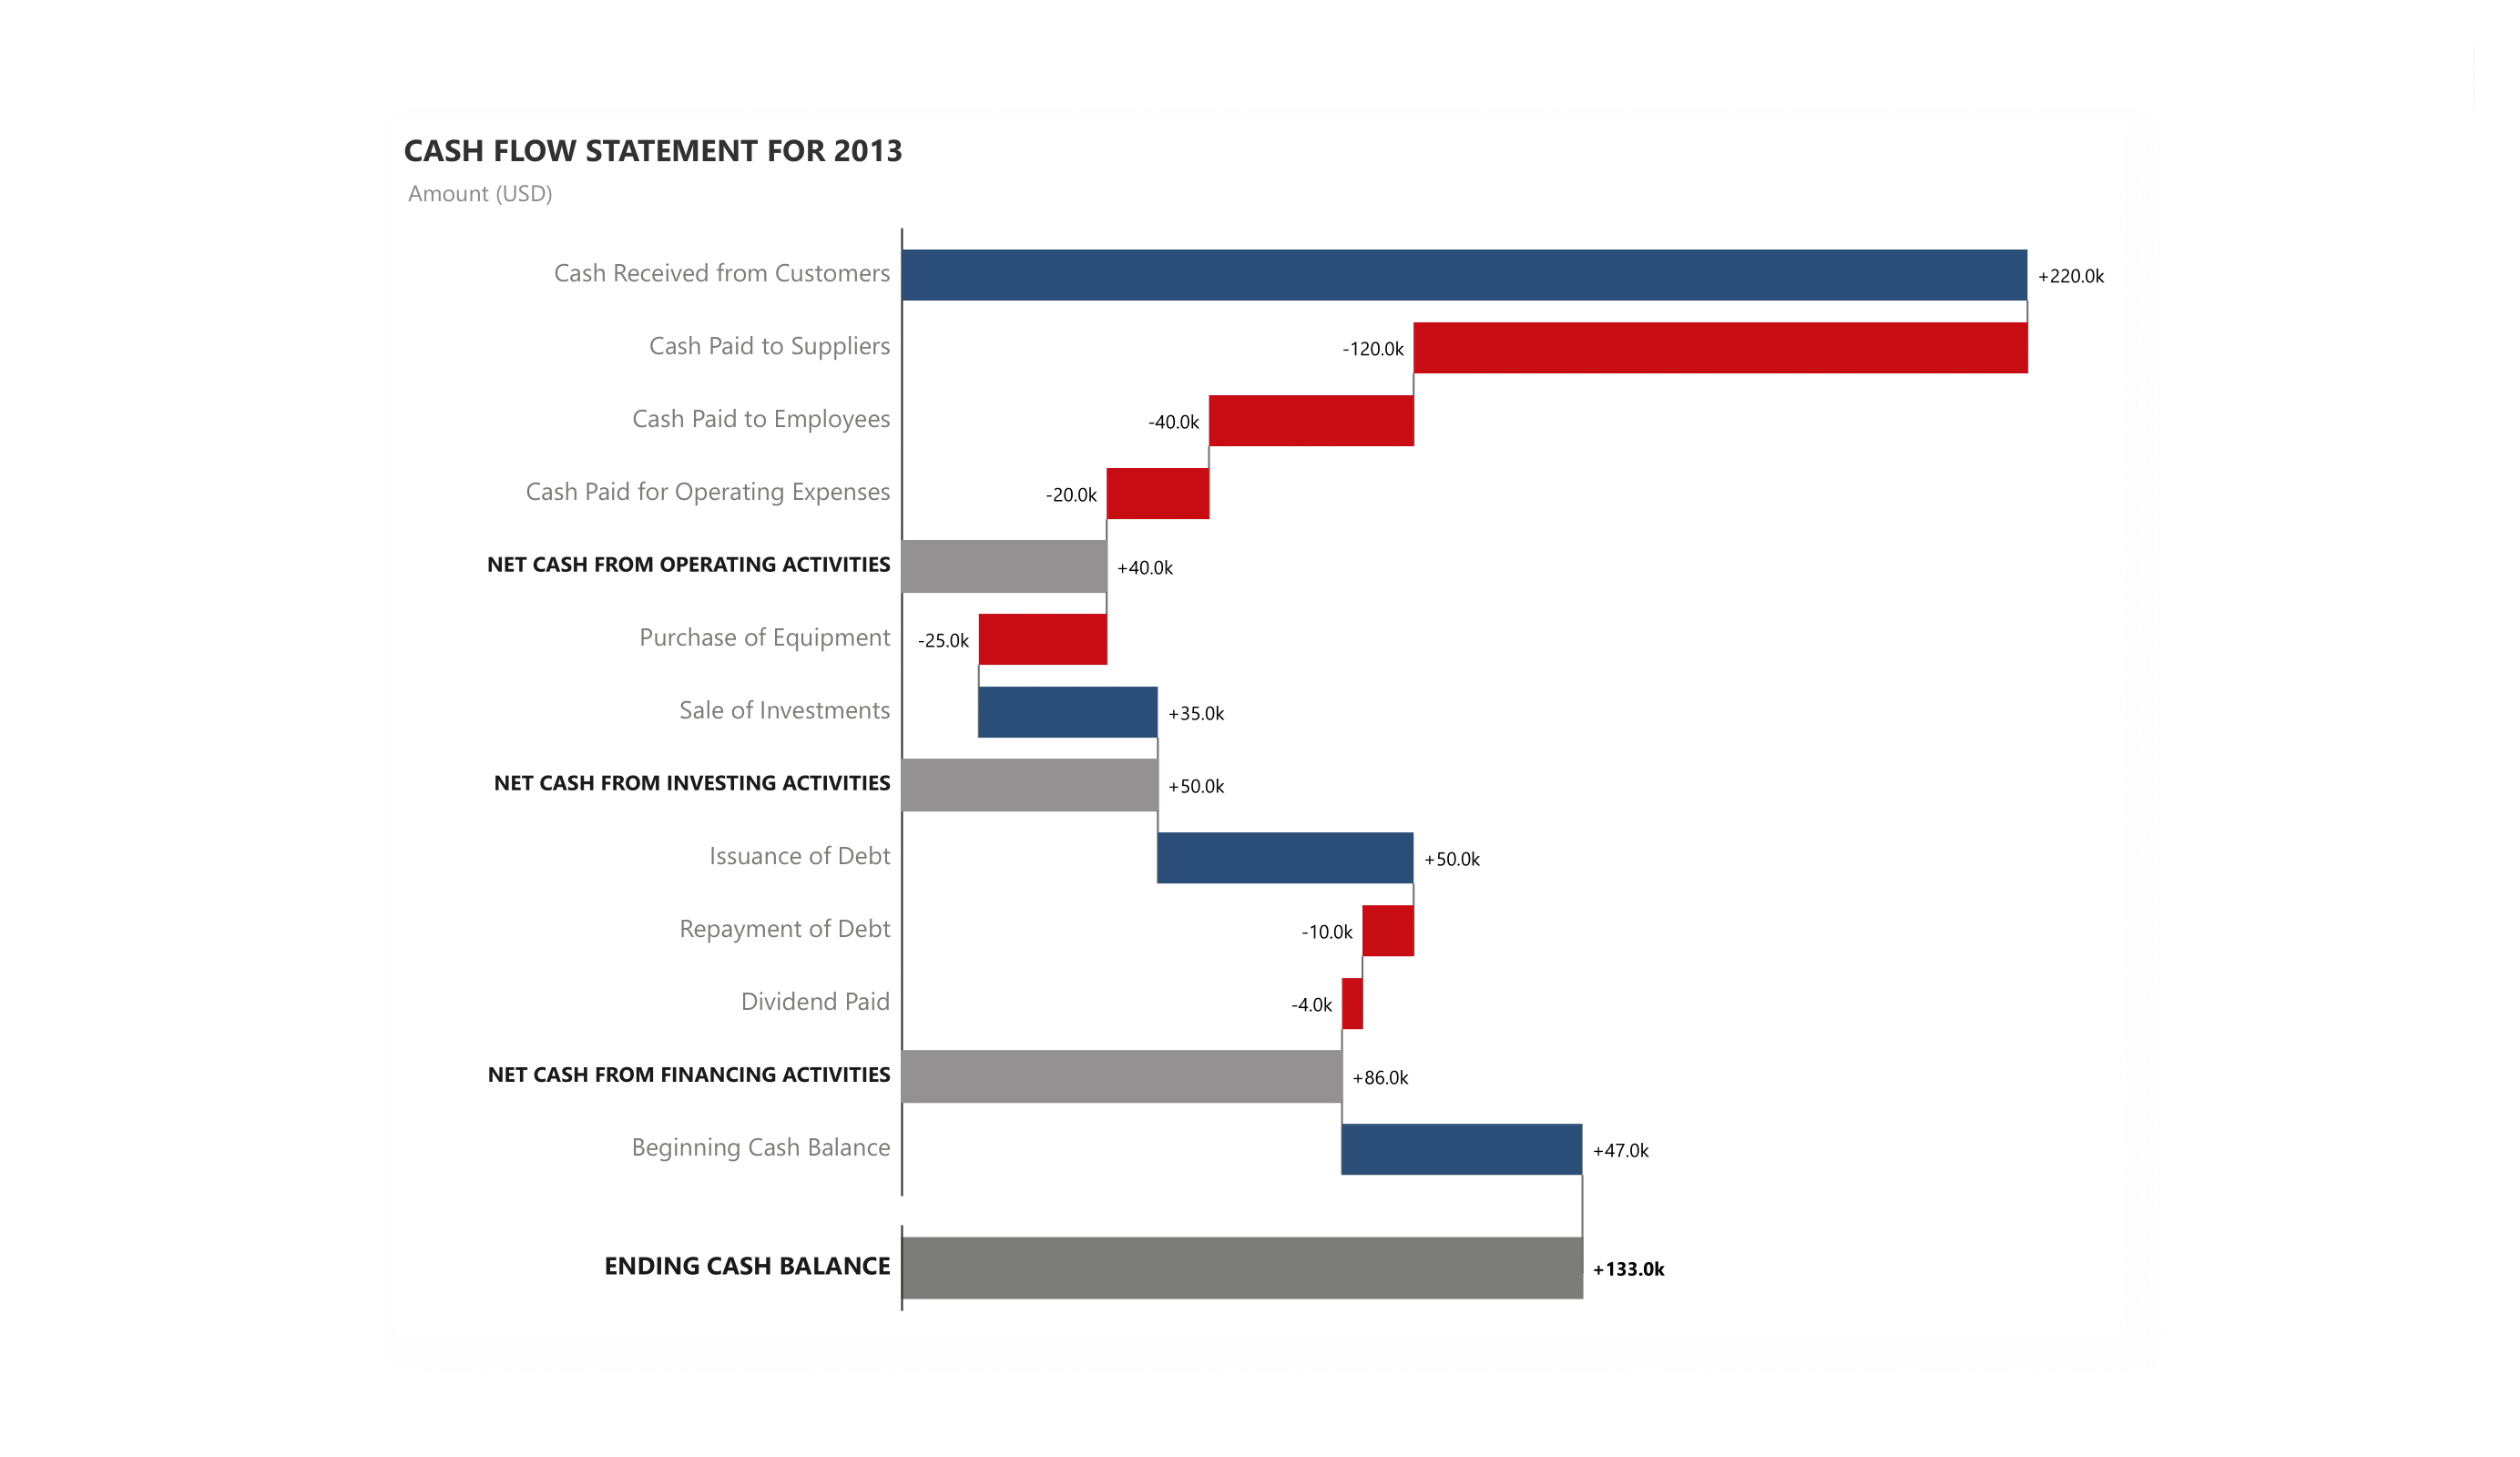
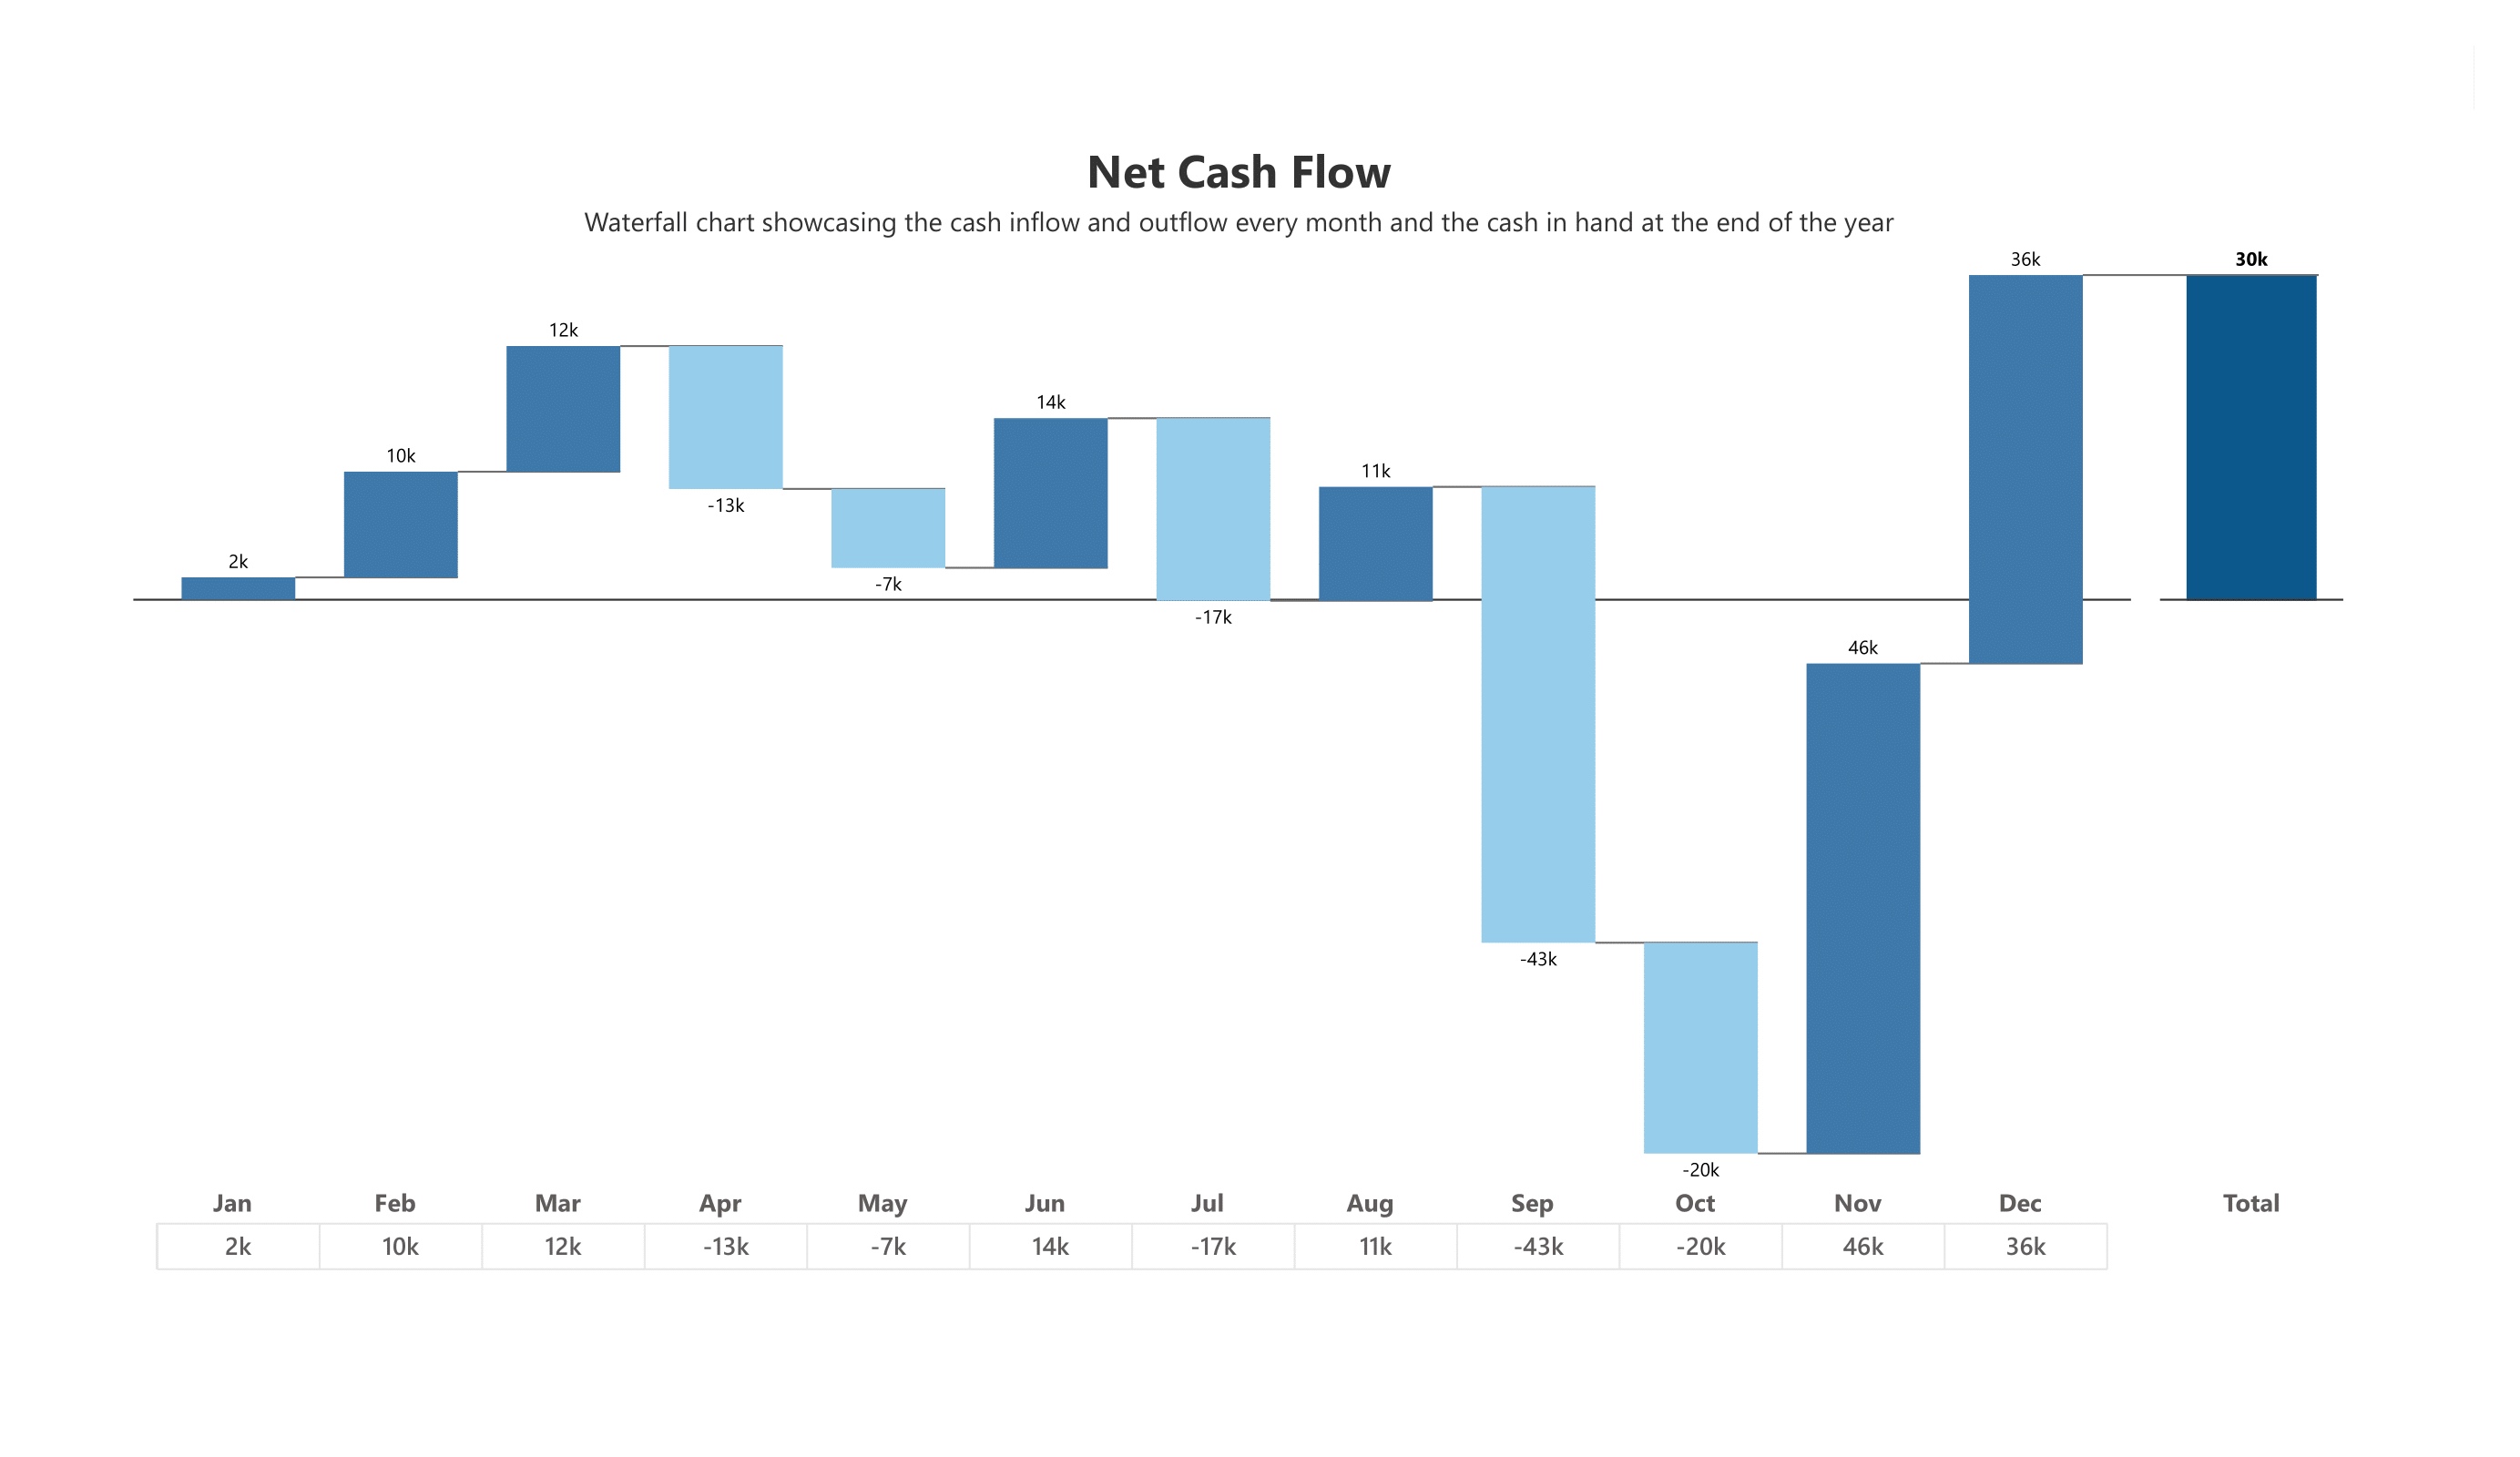
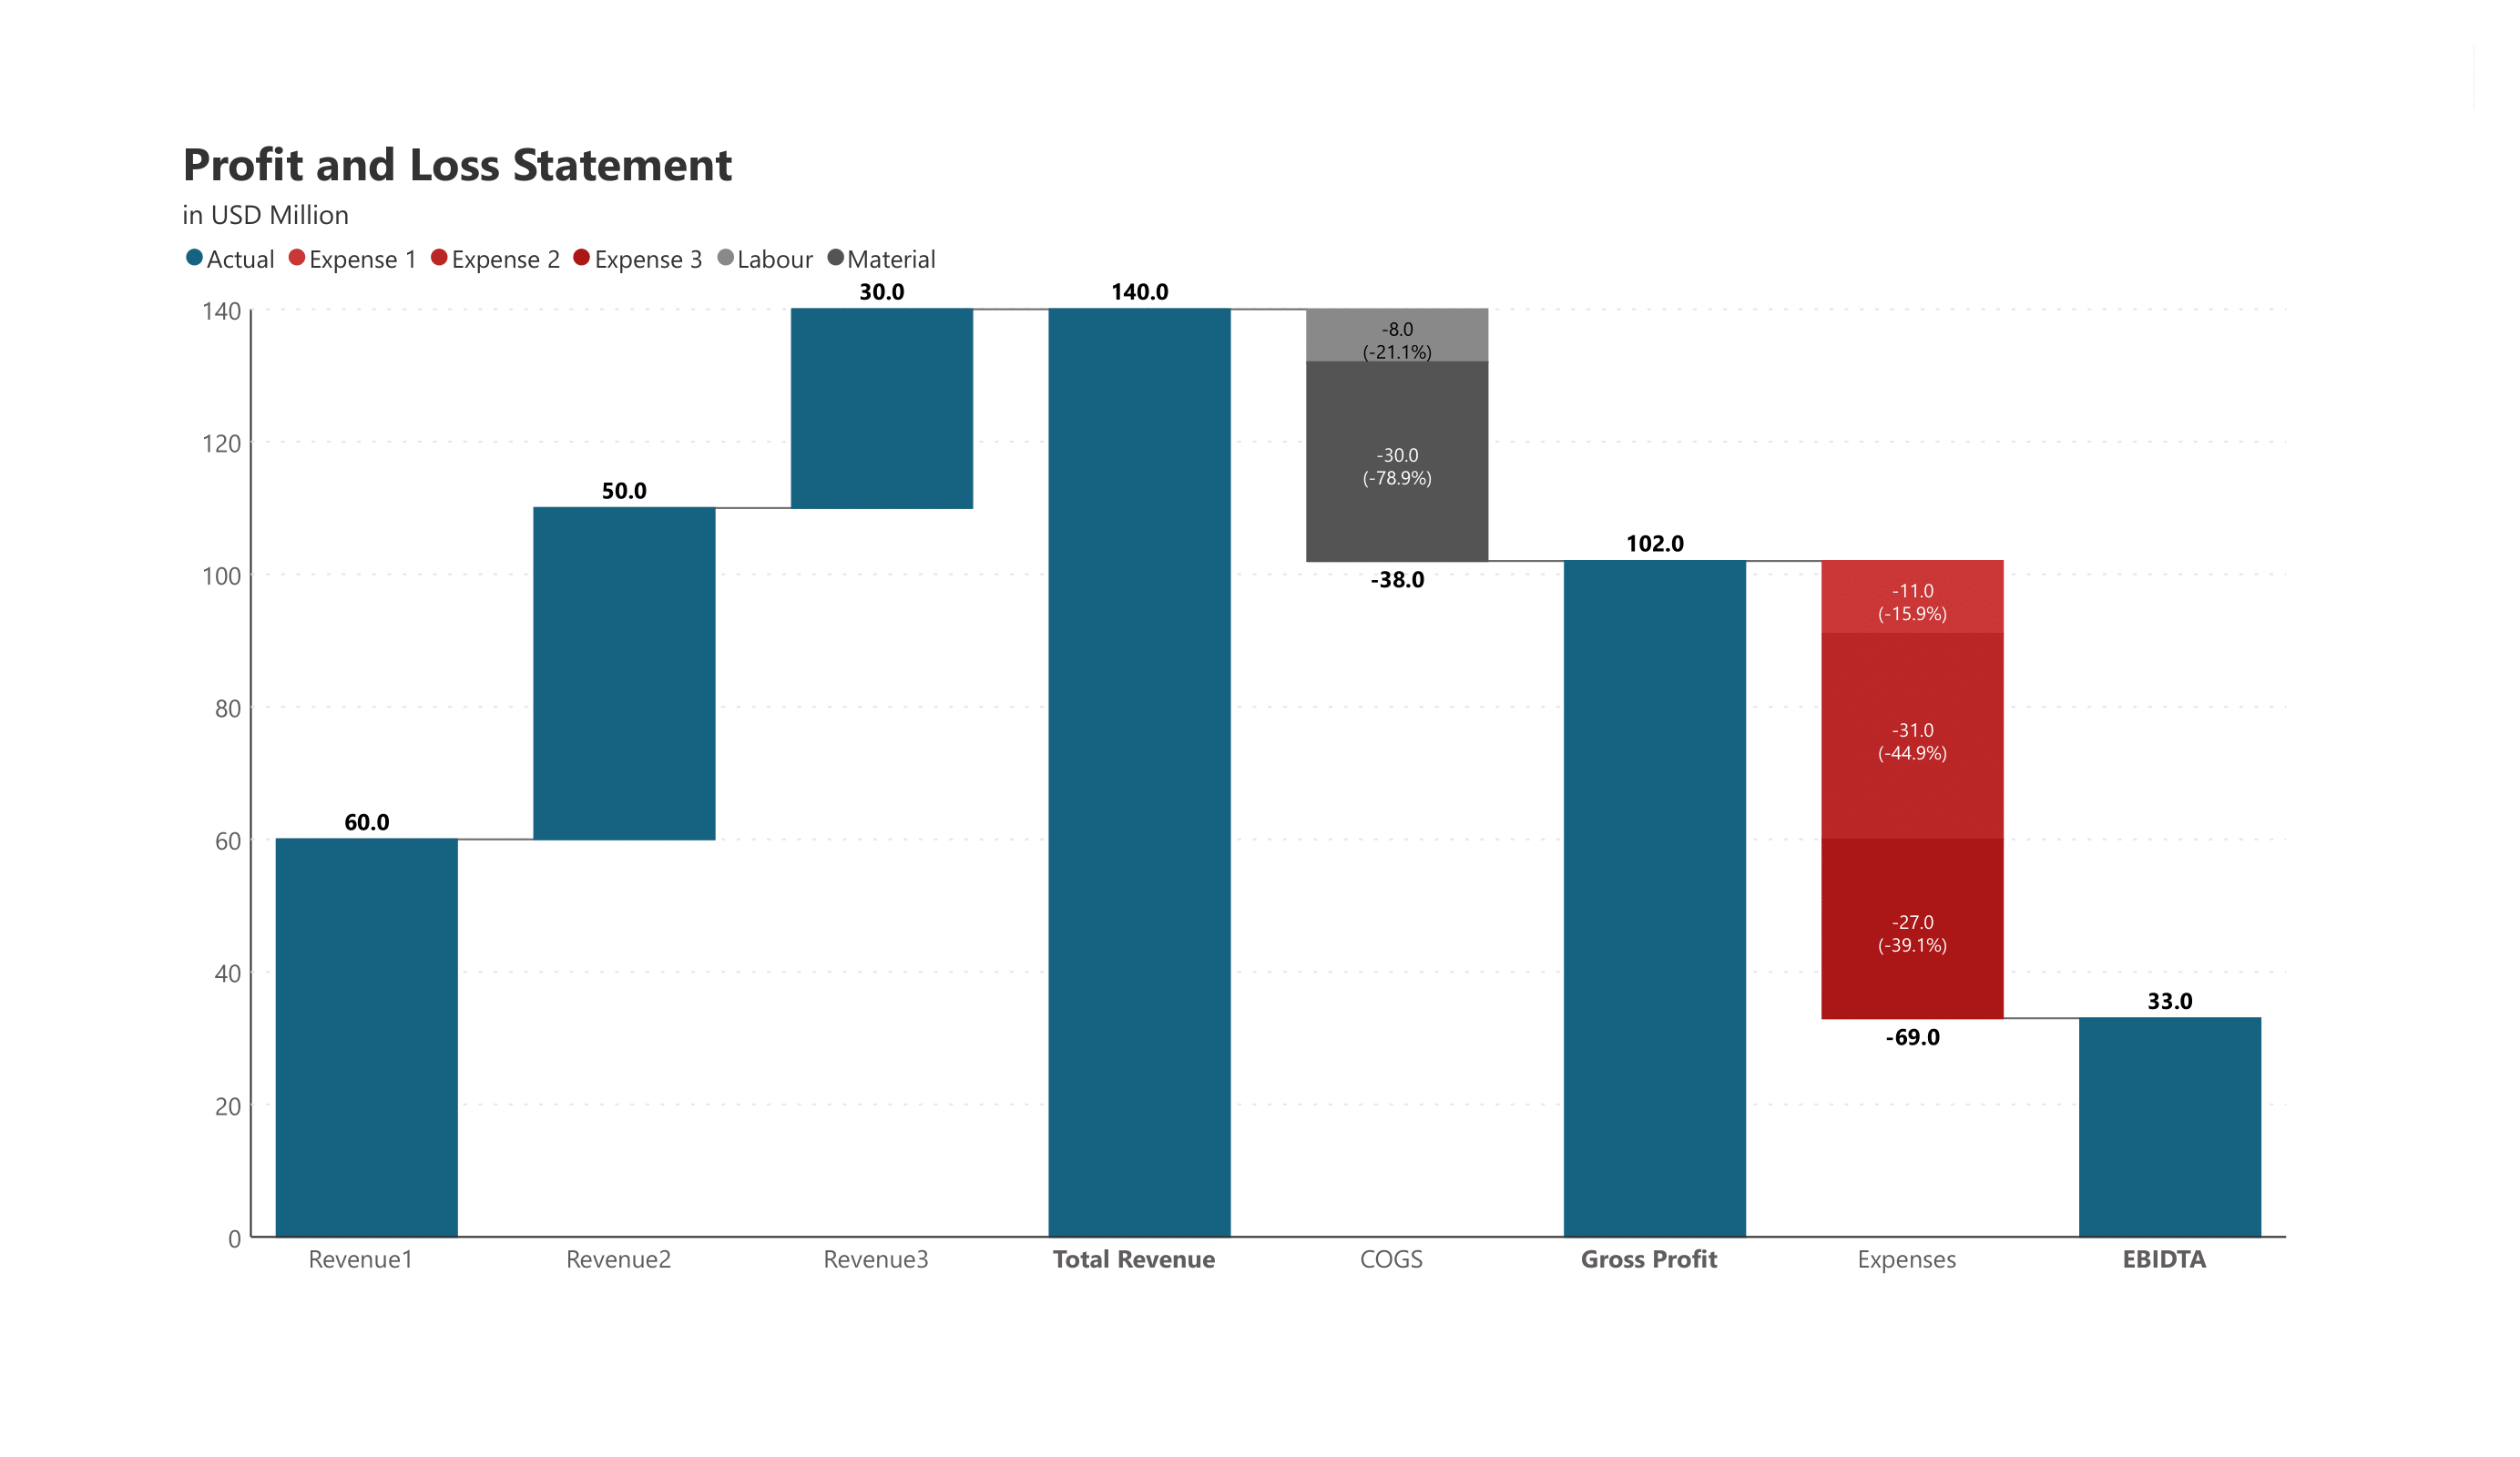
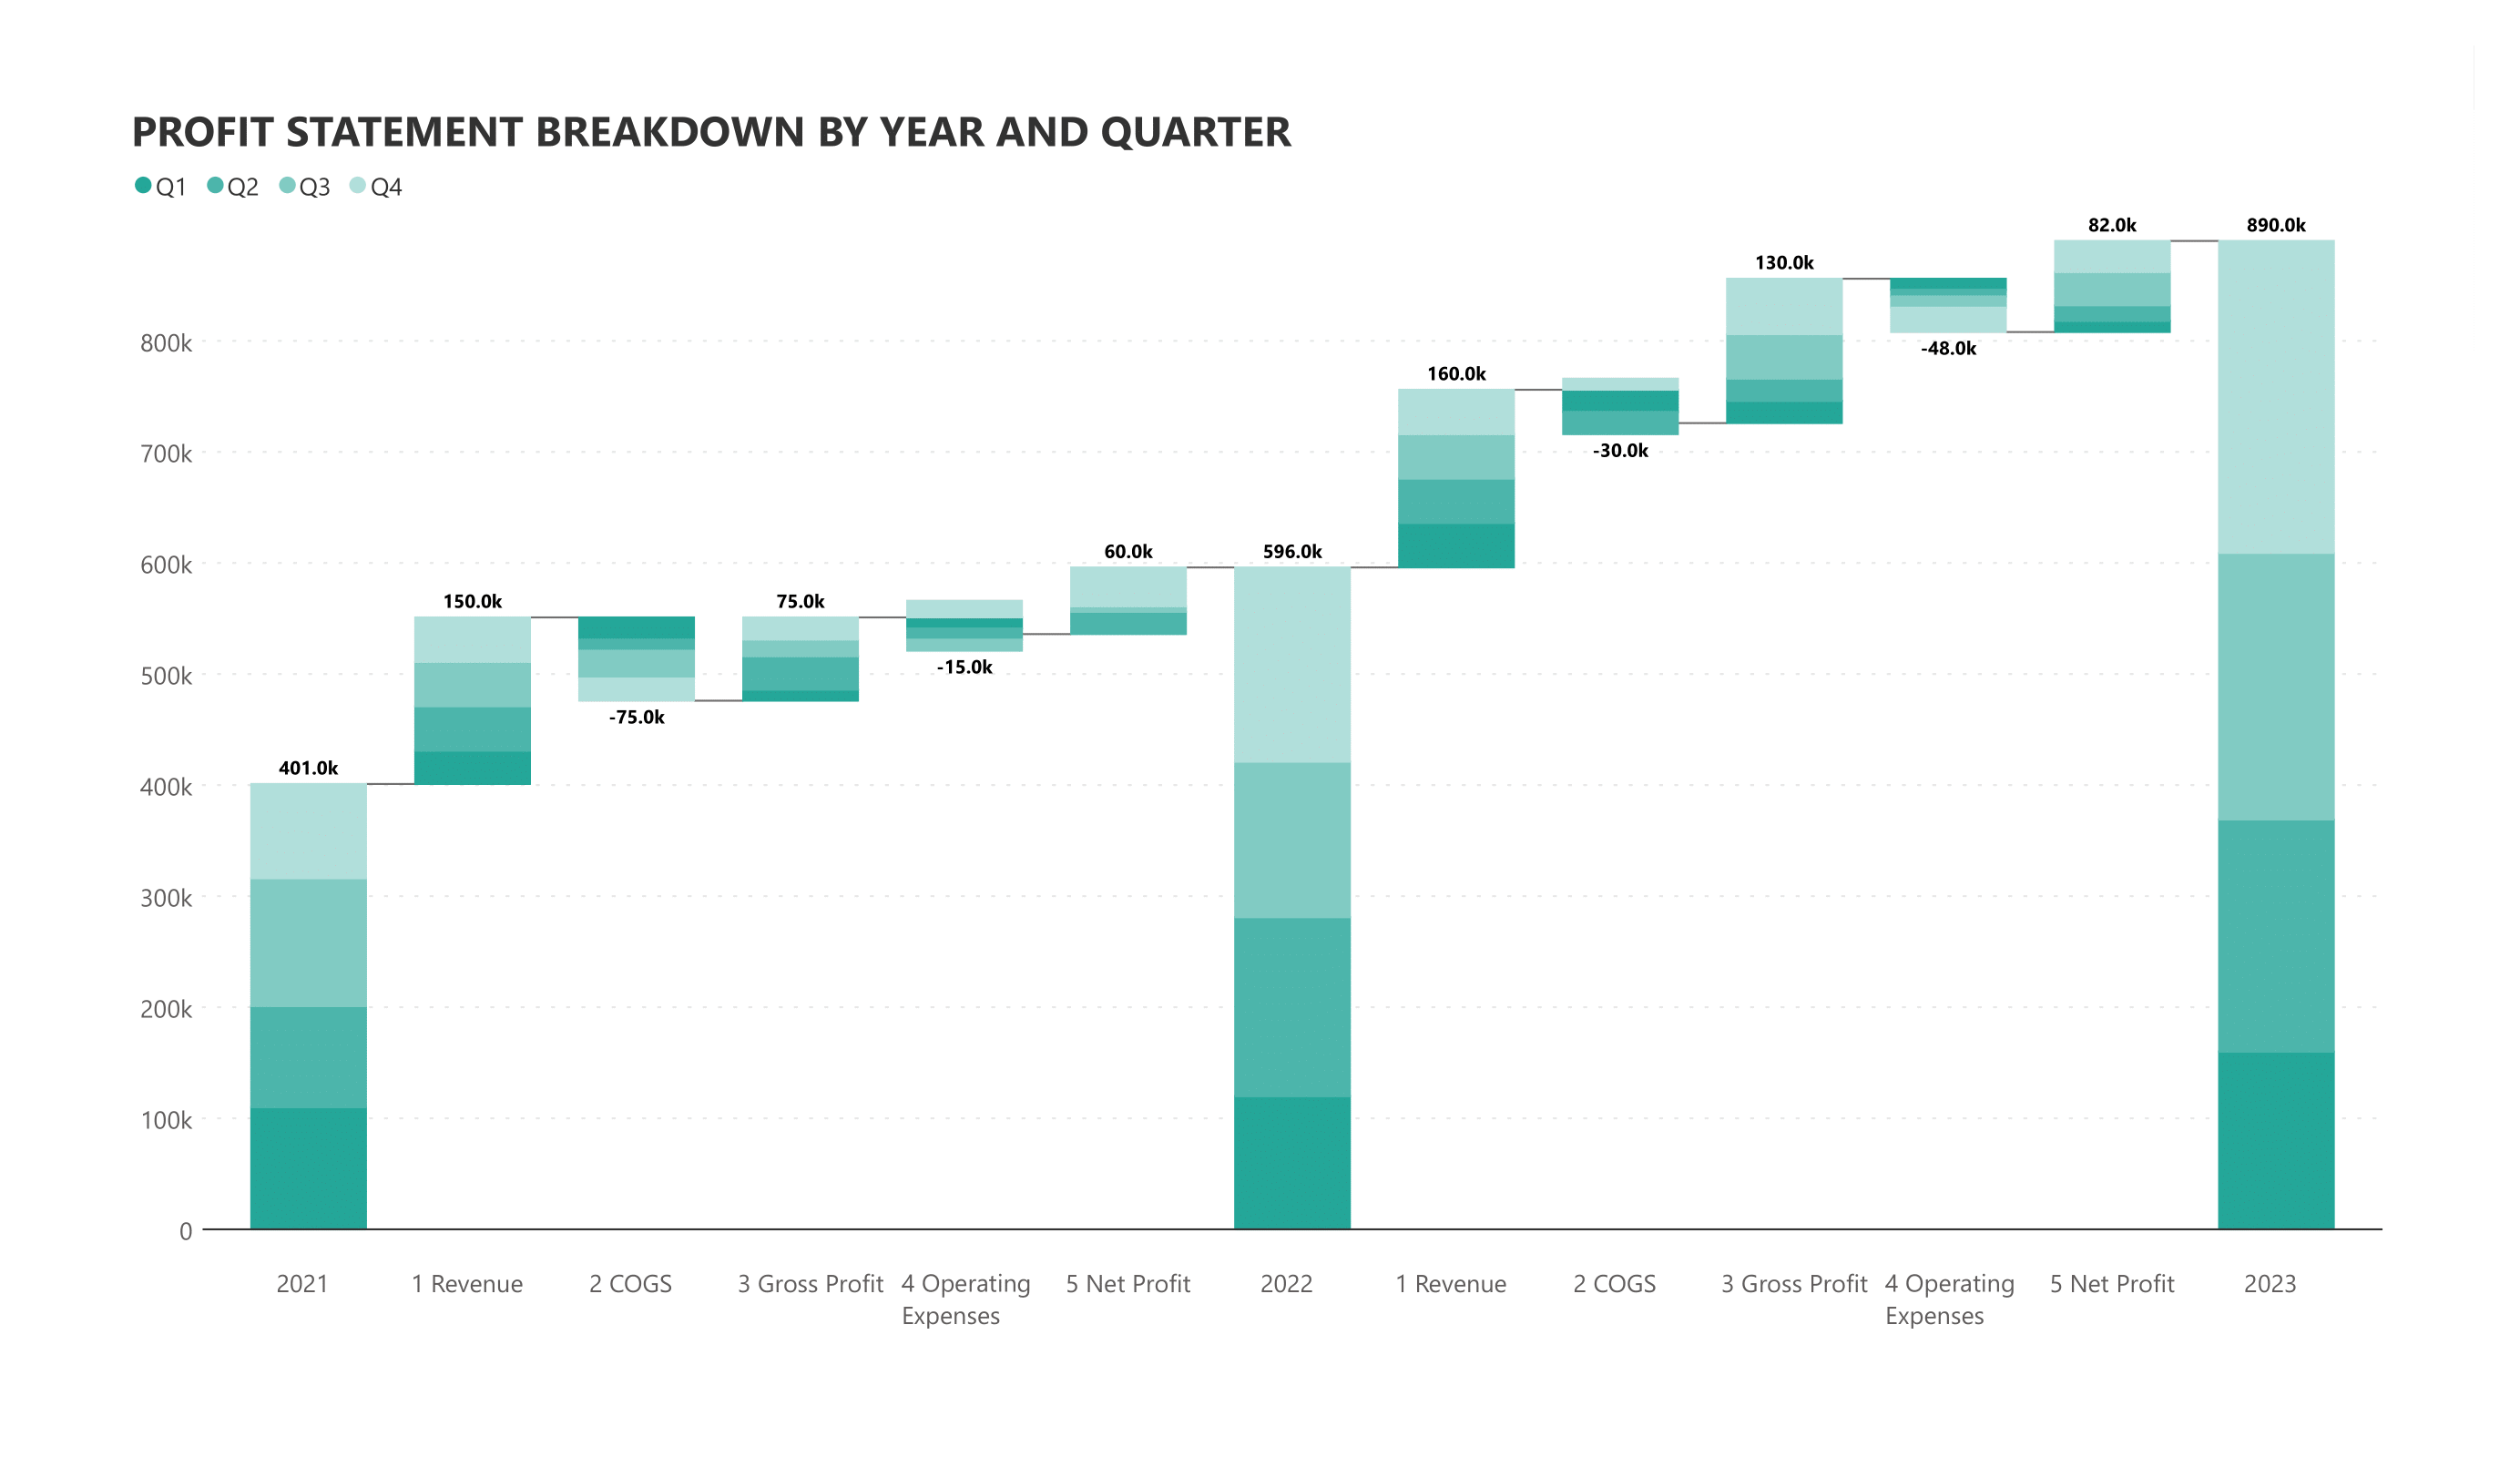
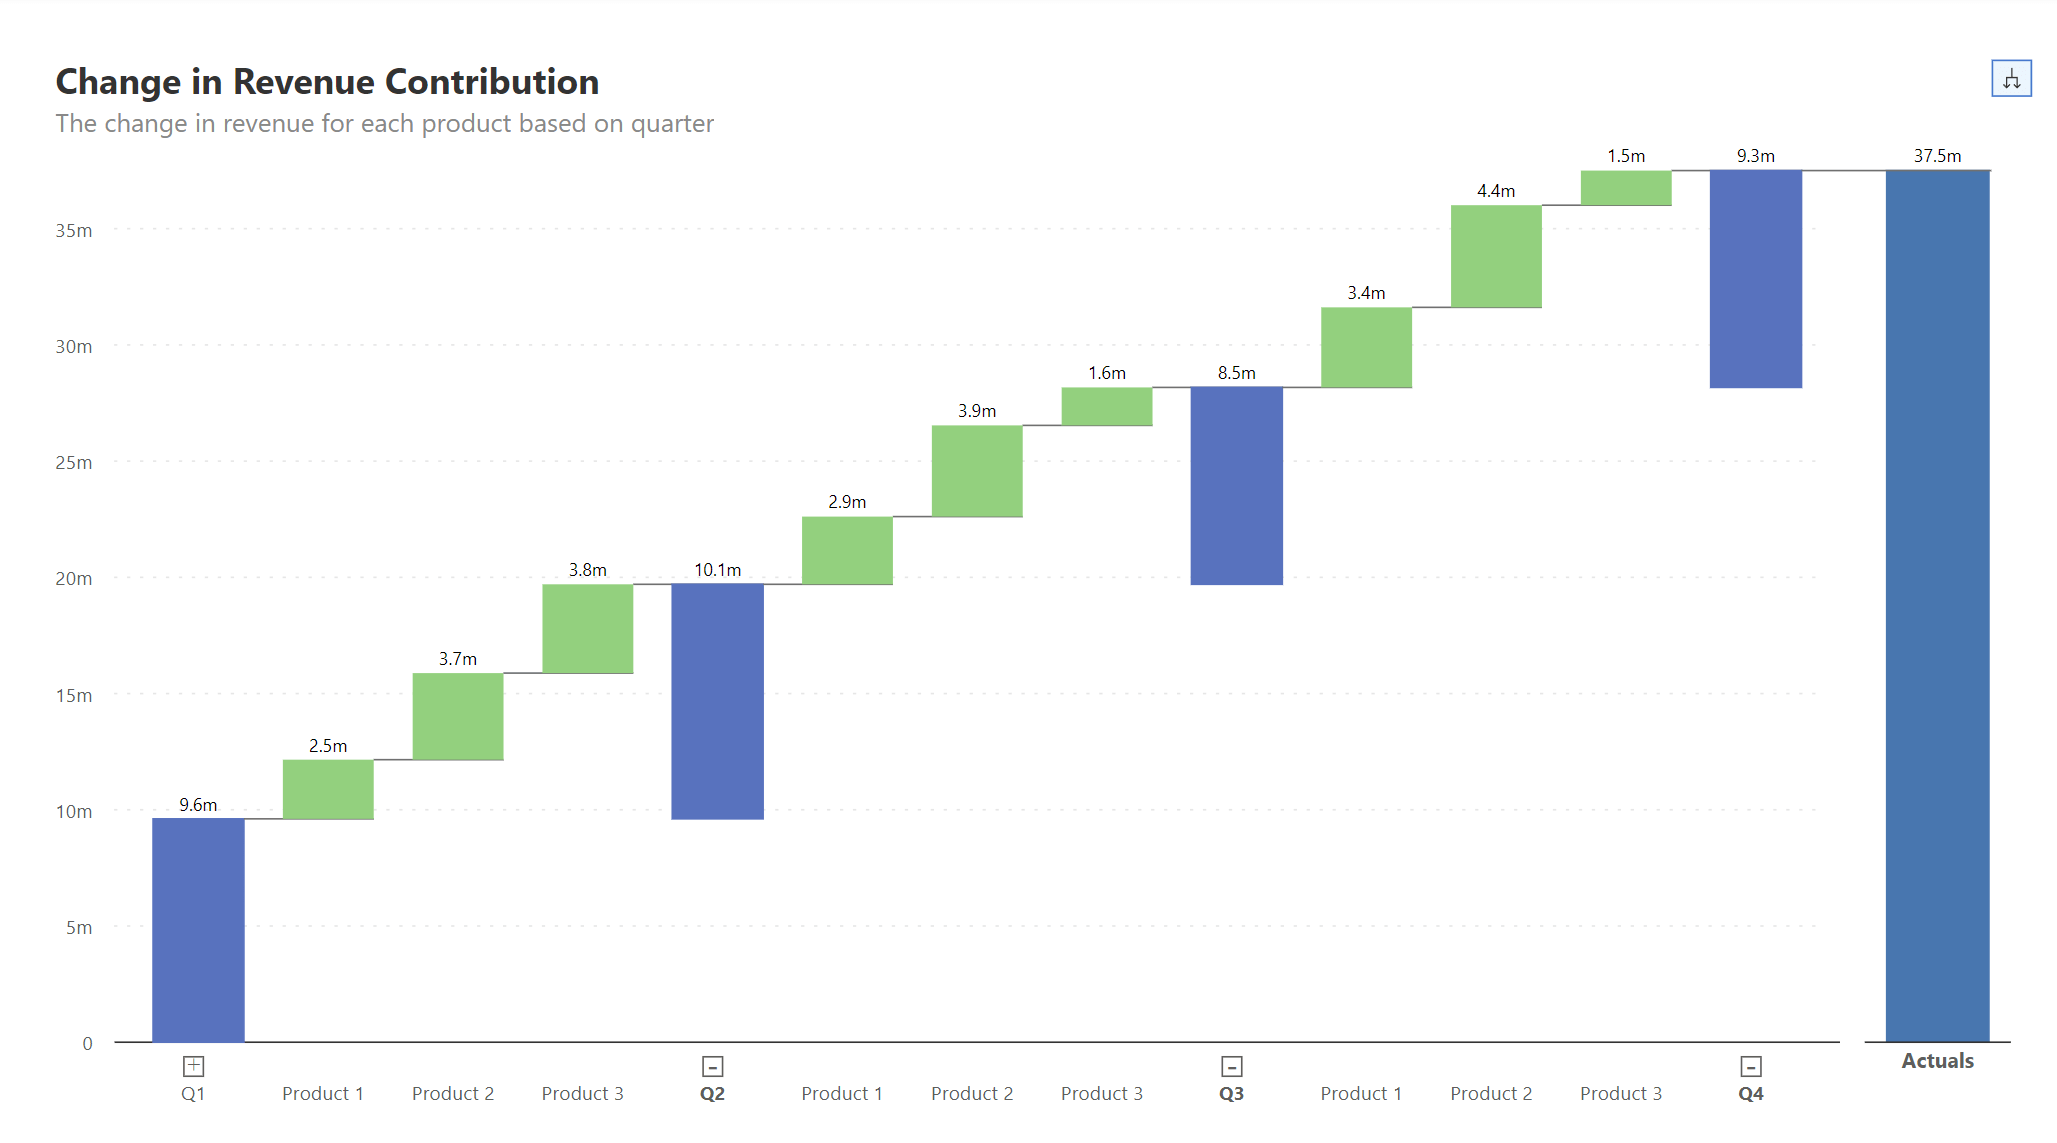
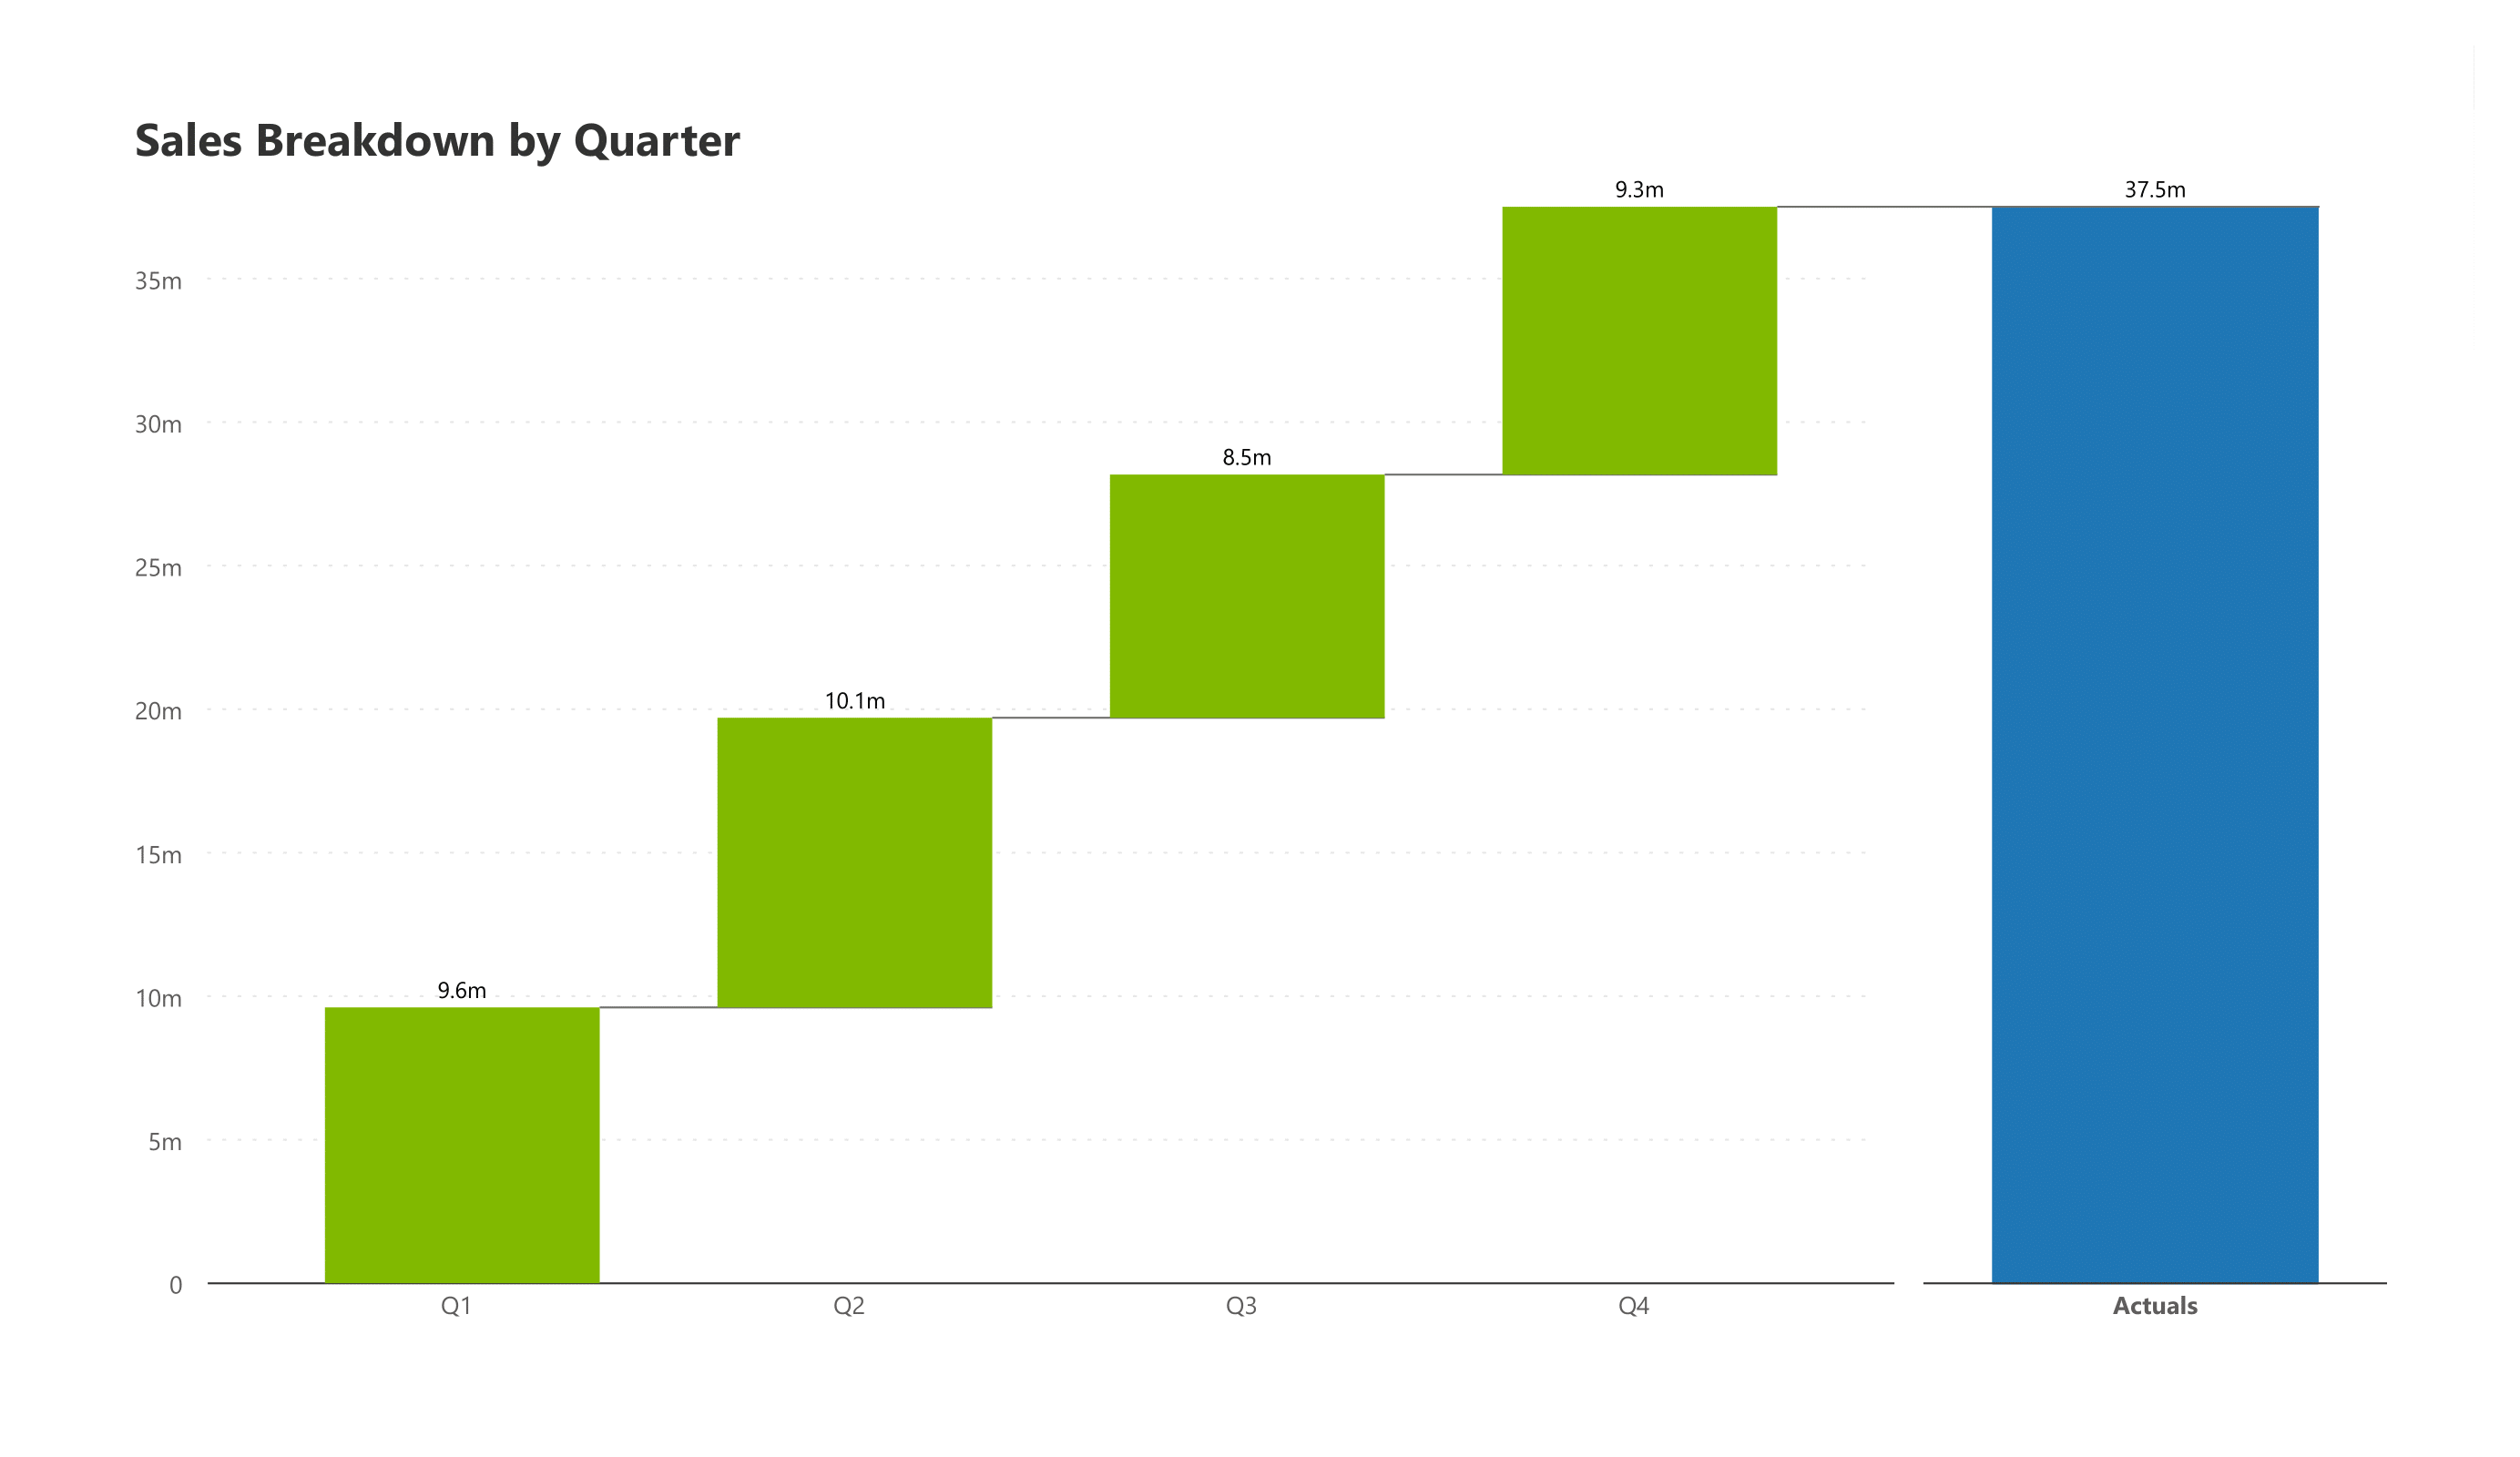
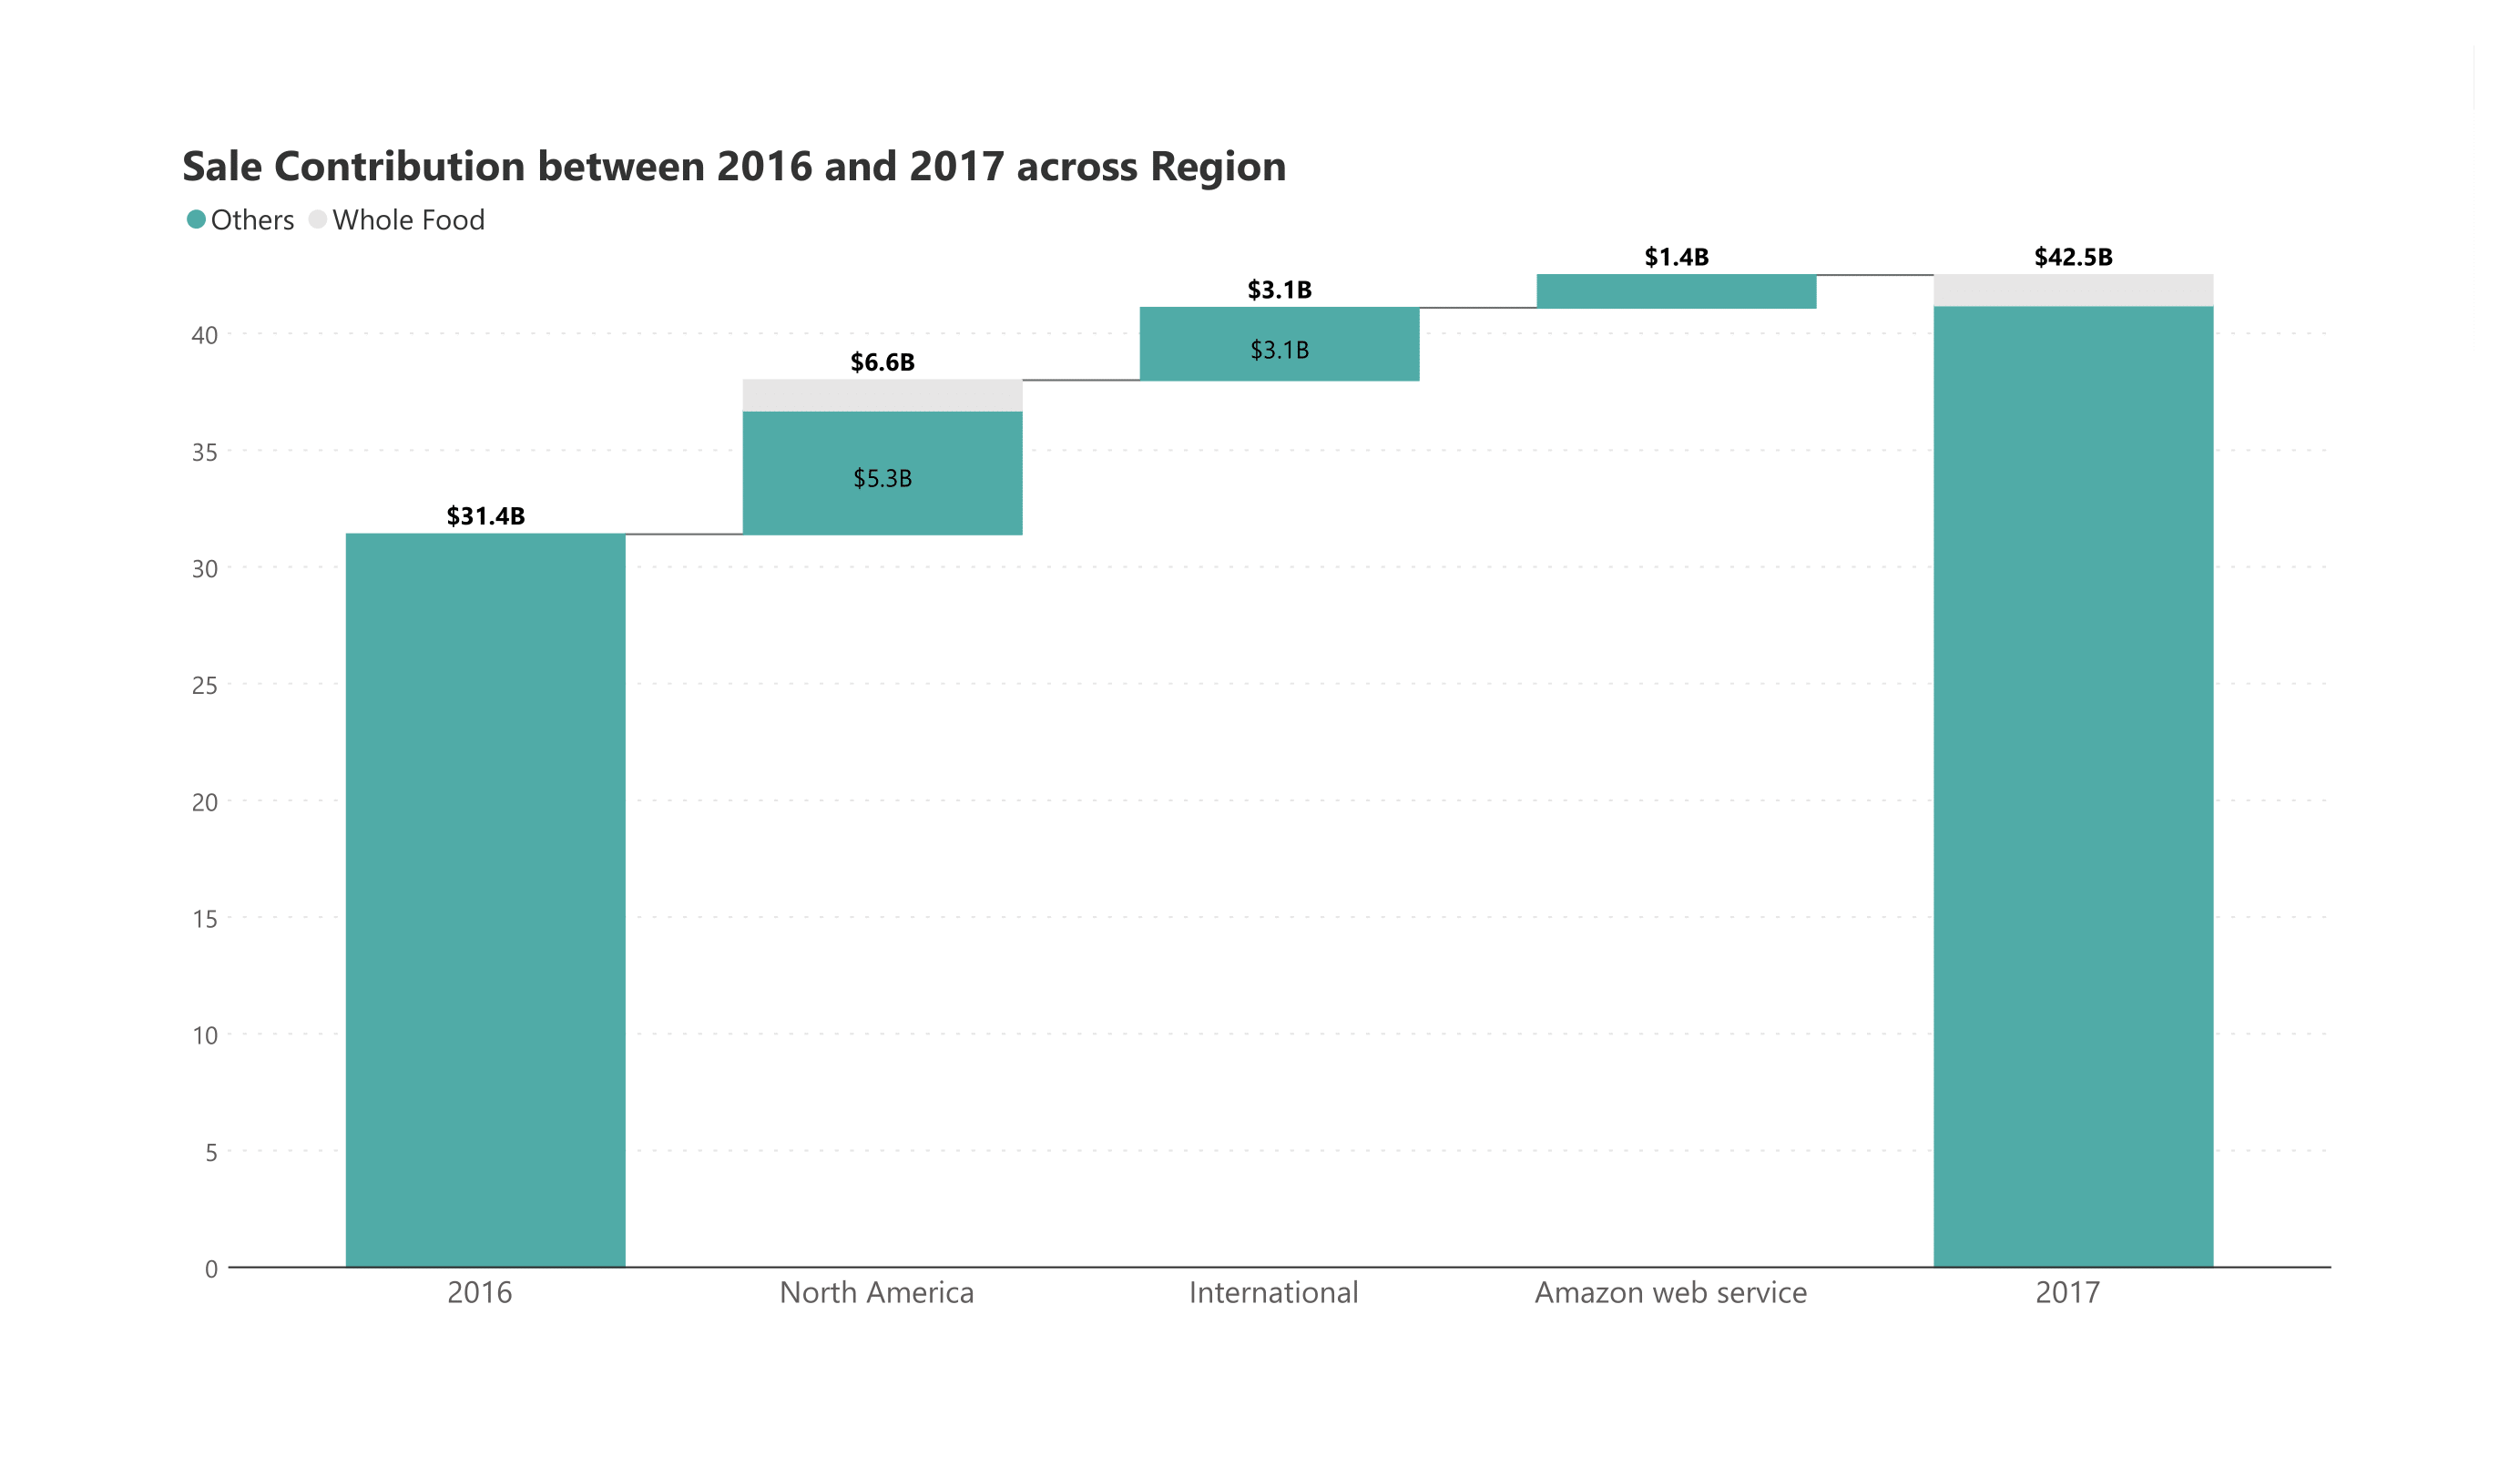
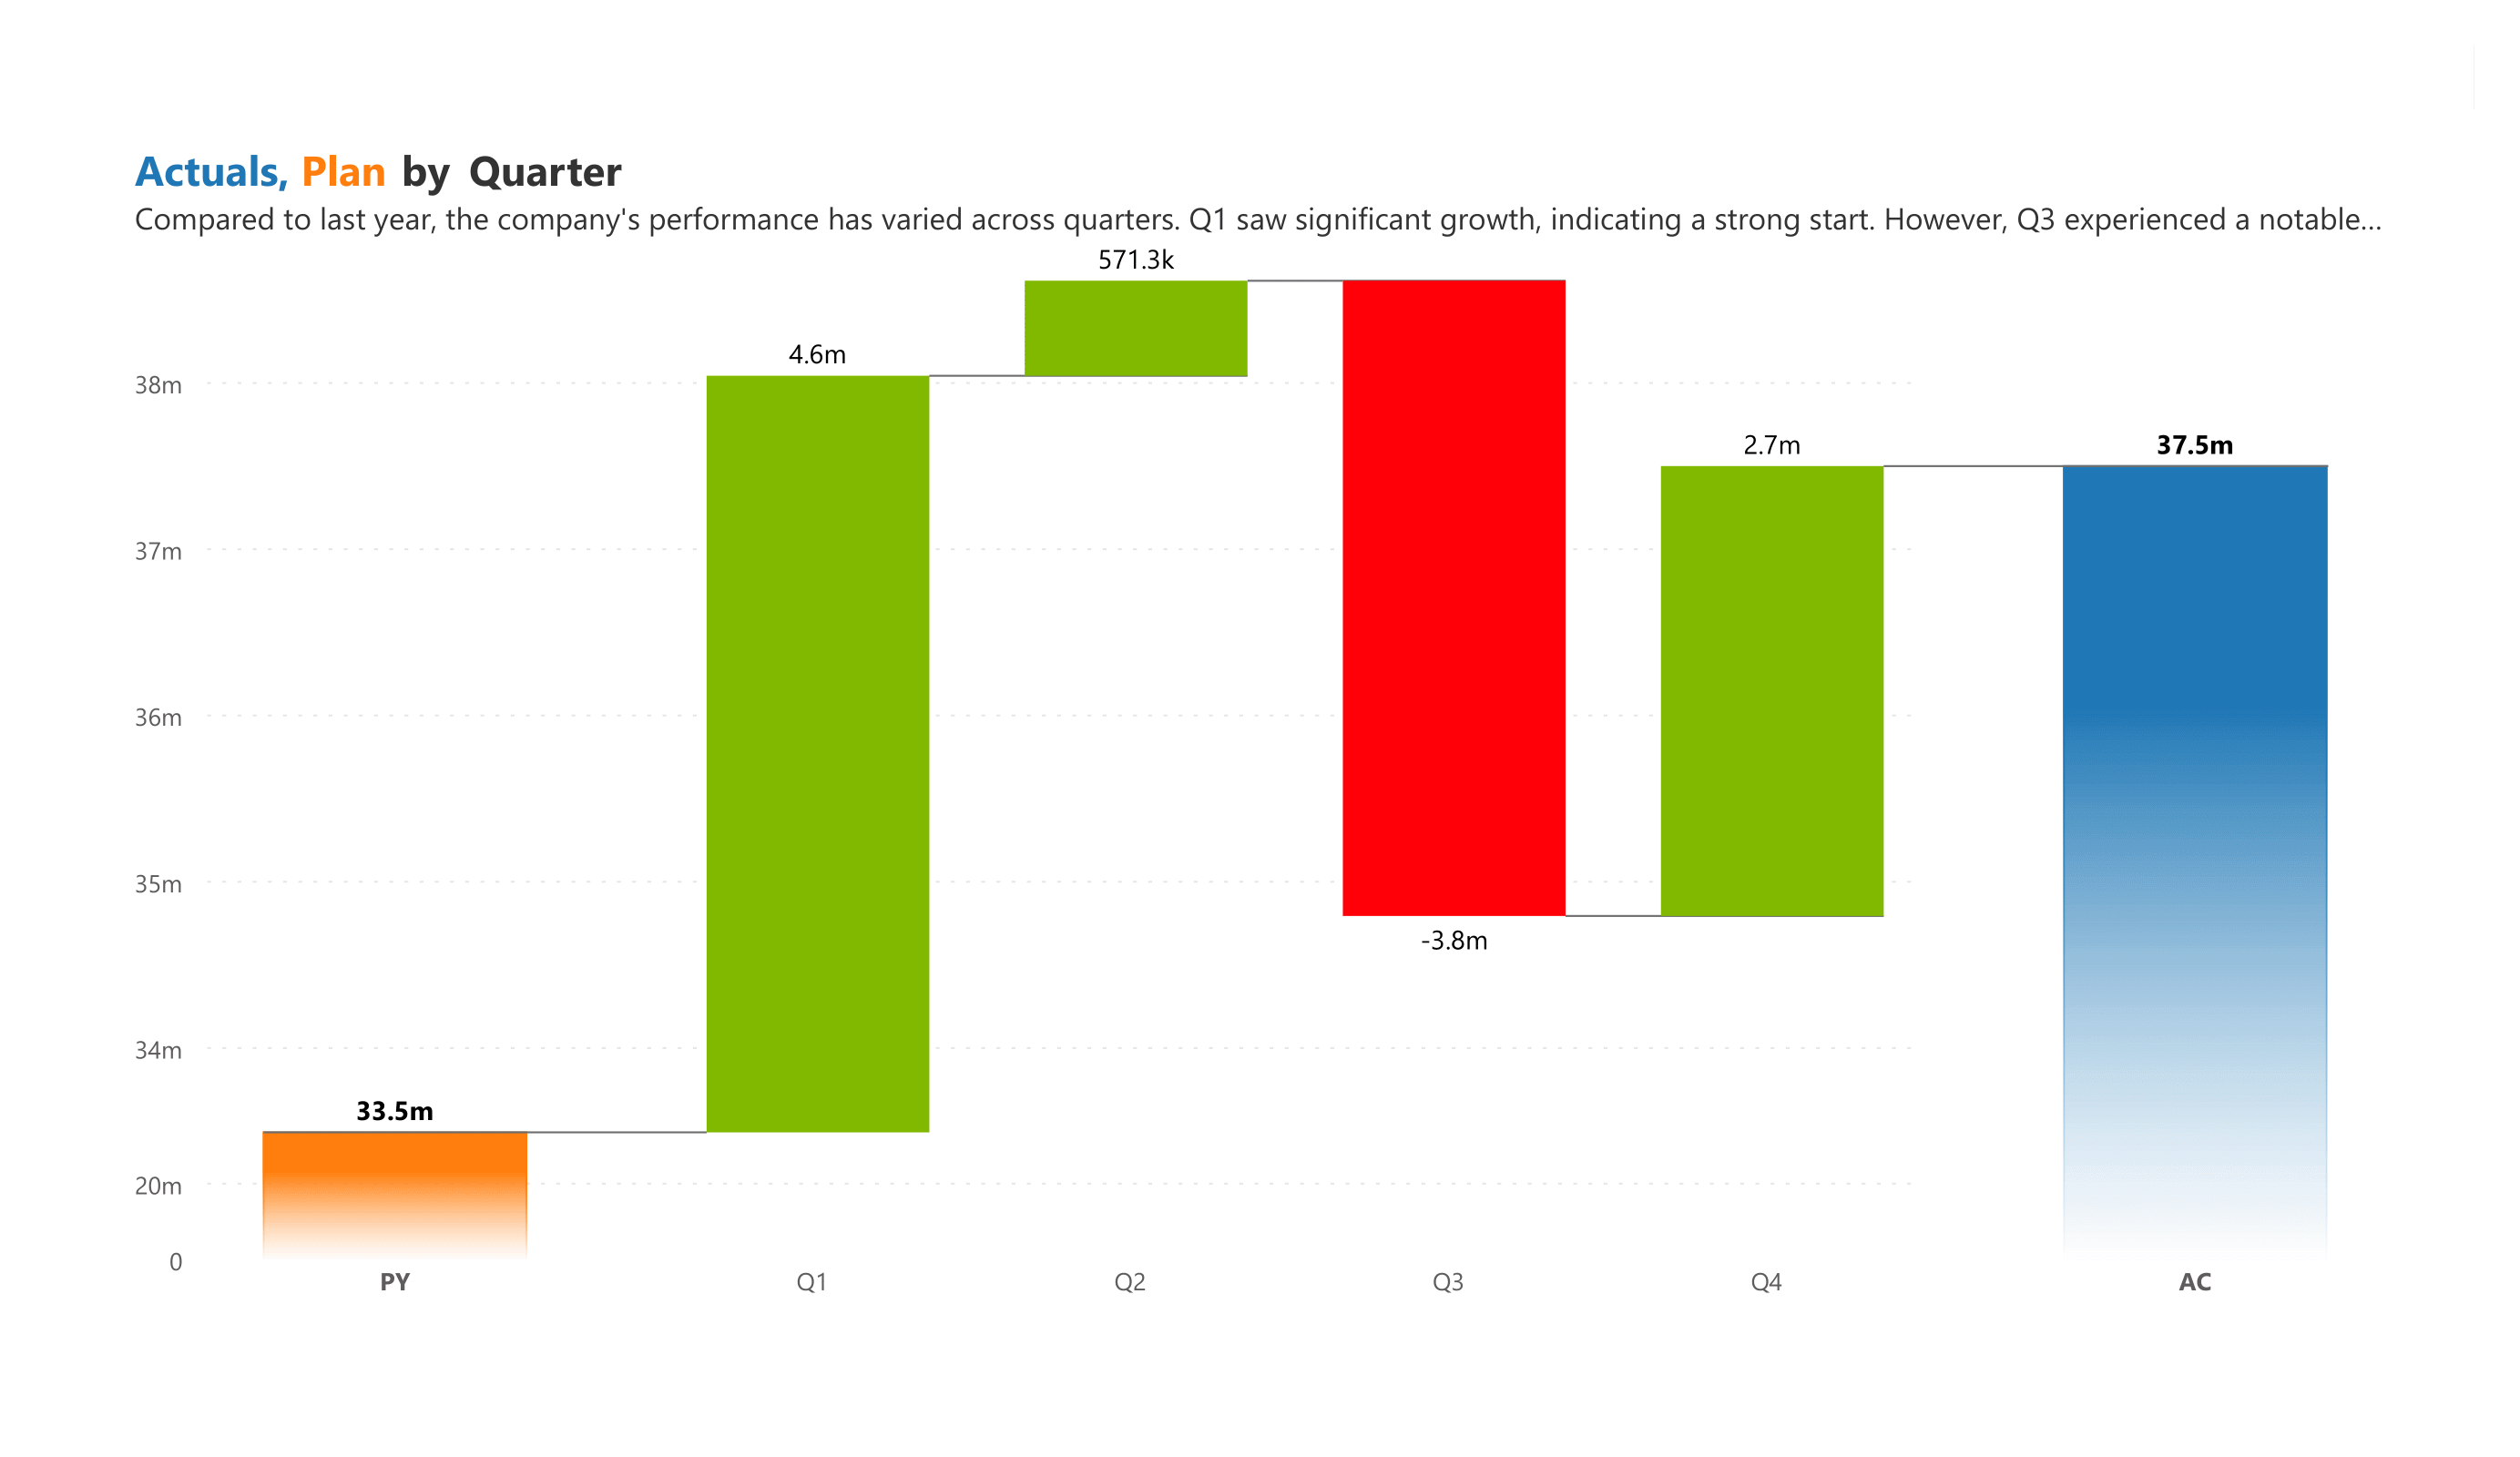
Inforiver Analytics+ Waterfall Suite is a powerful custom visual for Power BI. It offers over 20 types of waterfall charts, including segmented, stacked, breakdown and variance charts. This visual adheres to IBCS-certified templates. A waterfall chart helps you display how positive and negative values impact starting value, leading to a cumulative total. This visual is often used in trend, variance and financial analysis such as YoY growth, future projection, P&L statements, and cash flow statements.
Download PBIX
View interactive content

Key features

Multiple chart types

Multiple Chart Types

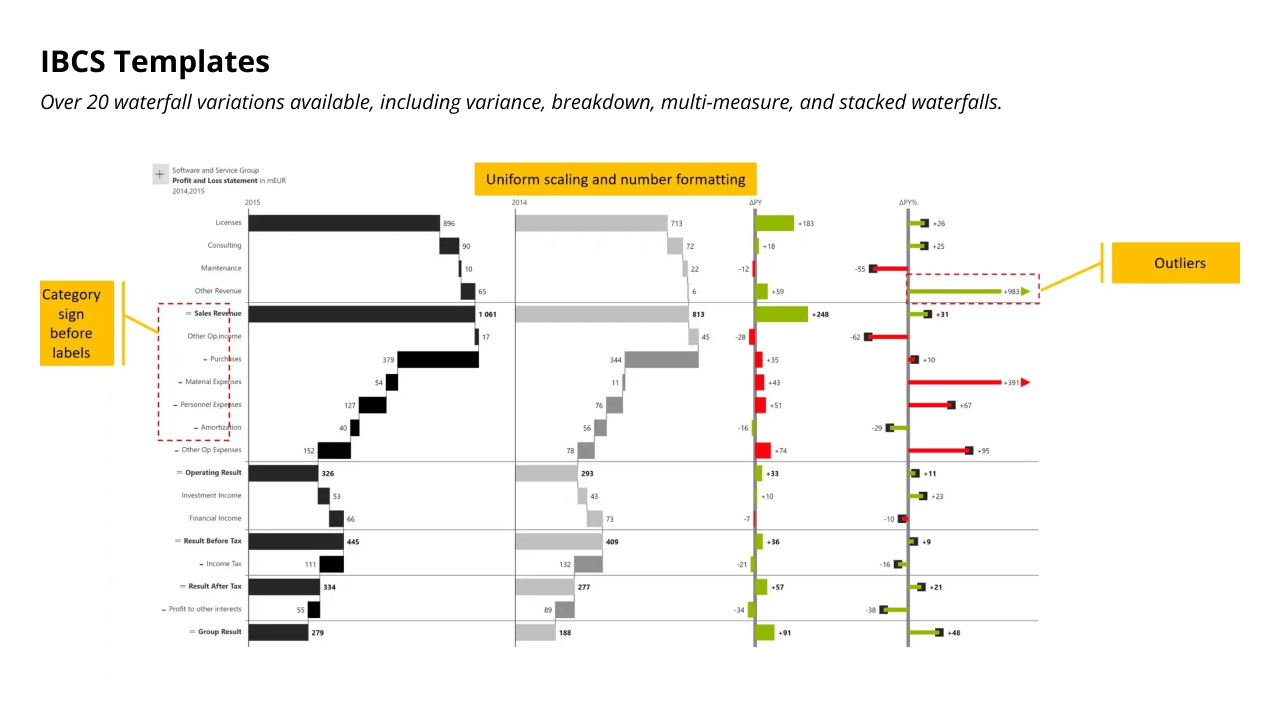
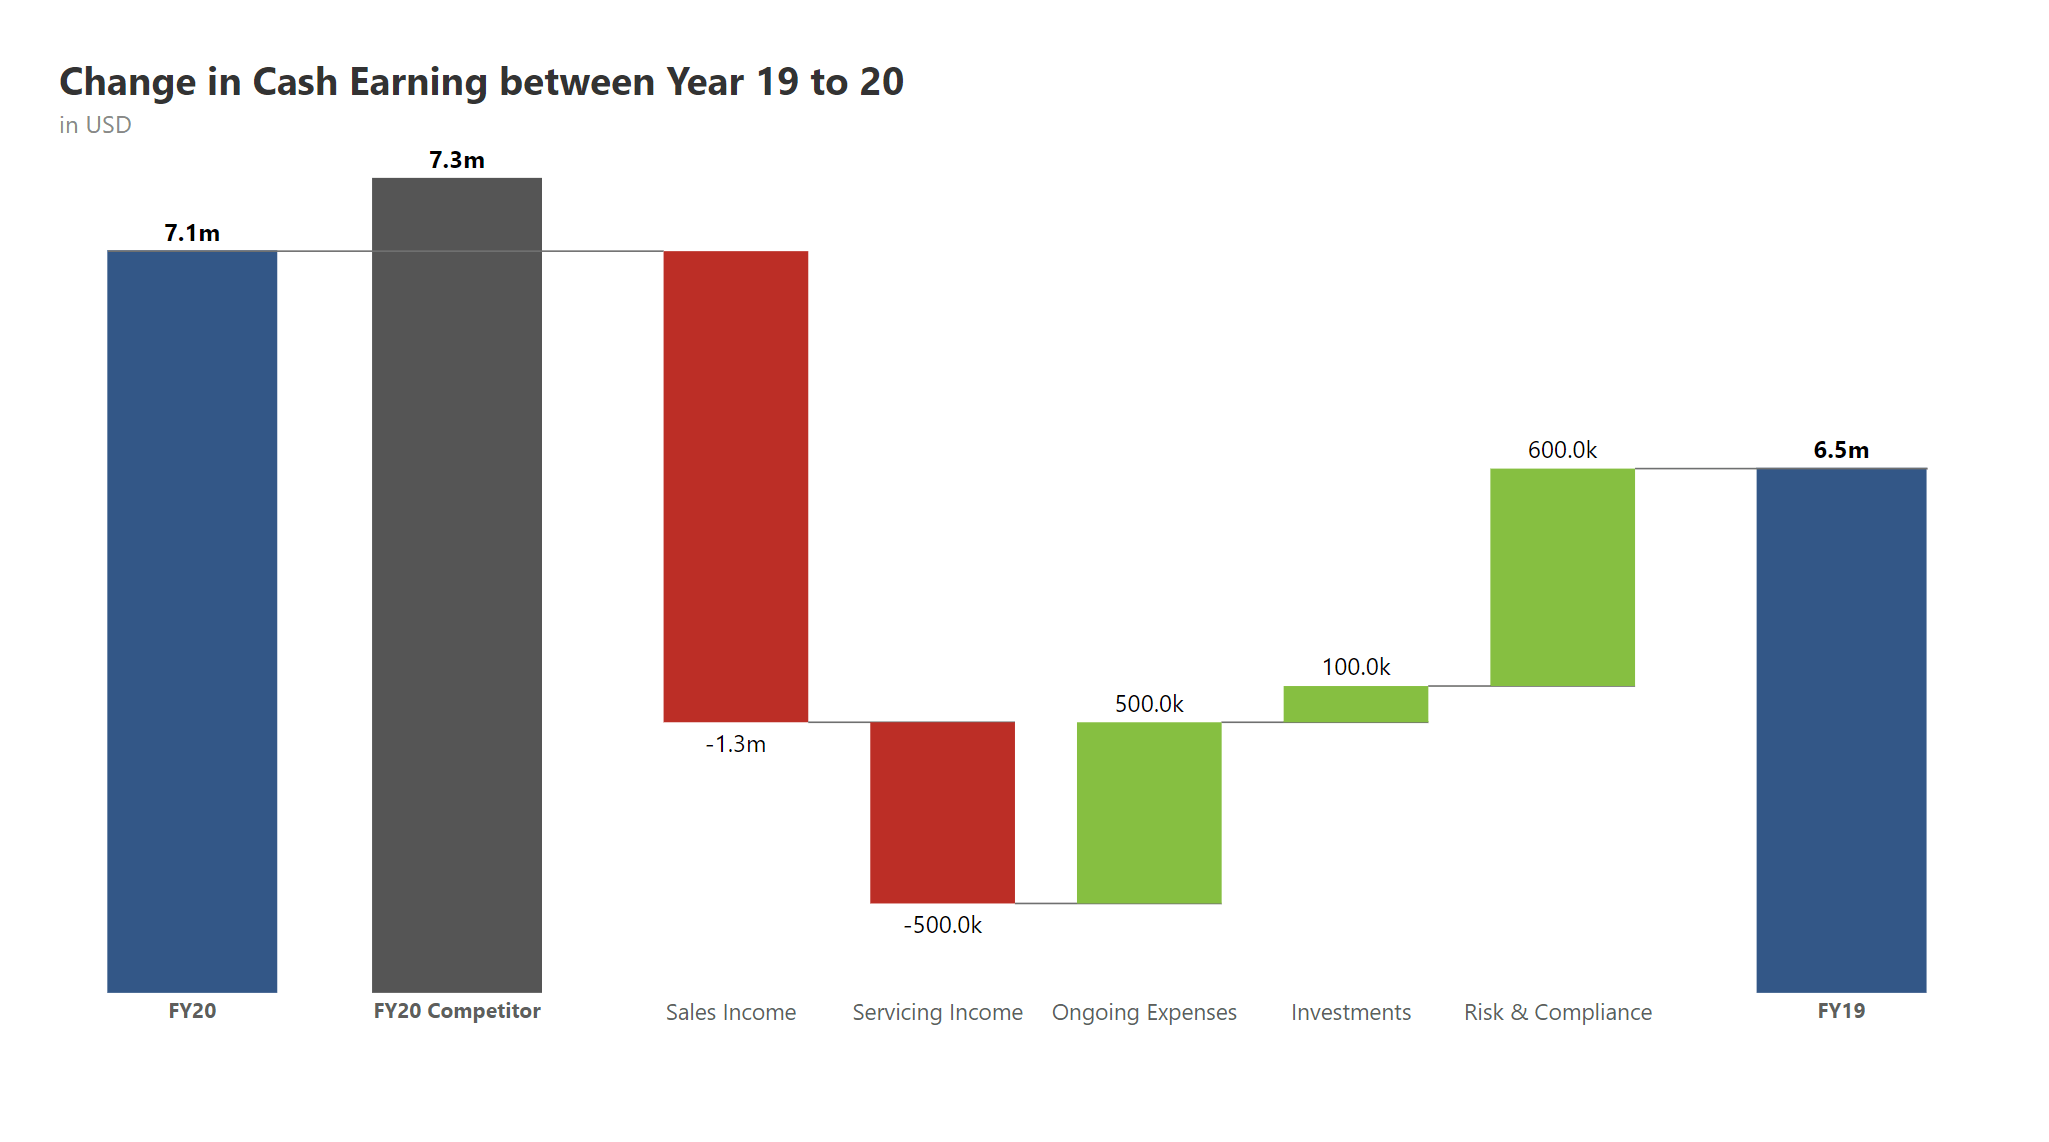
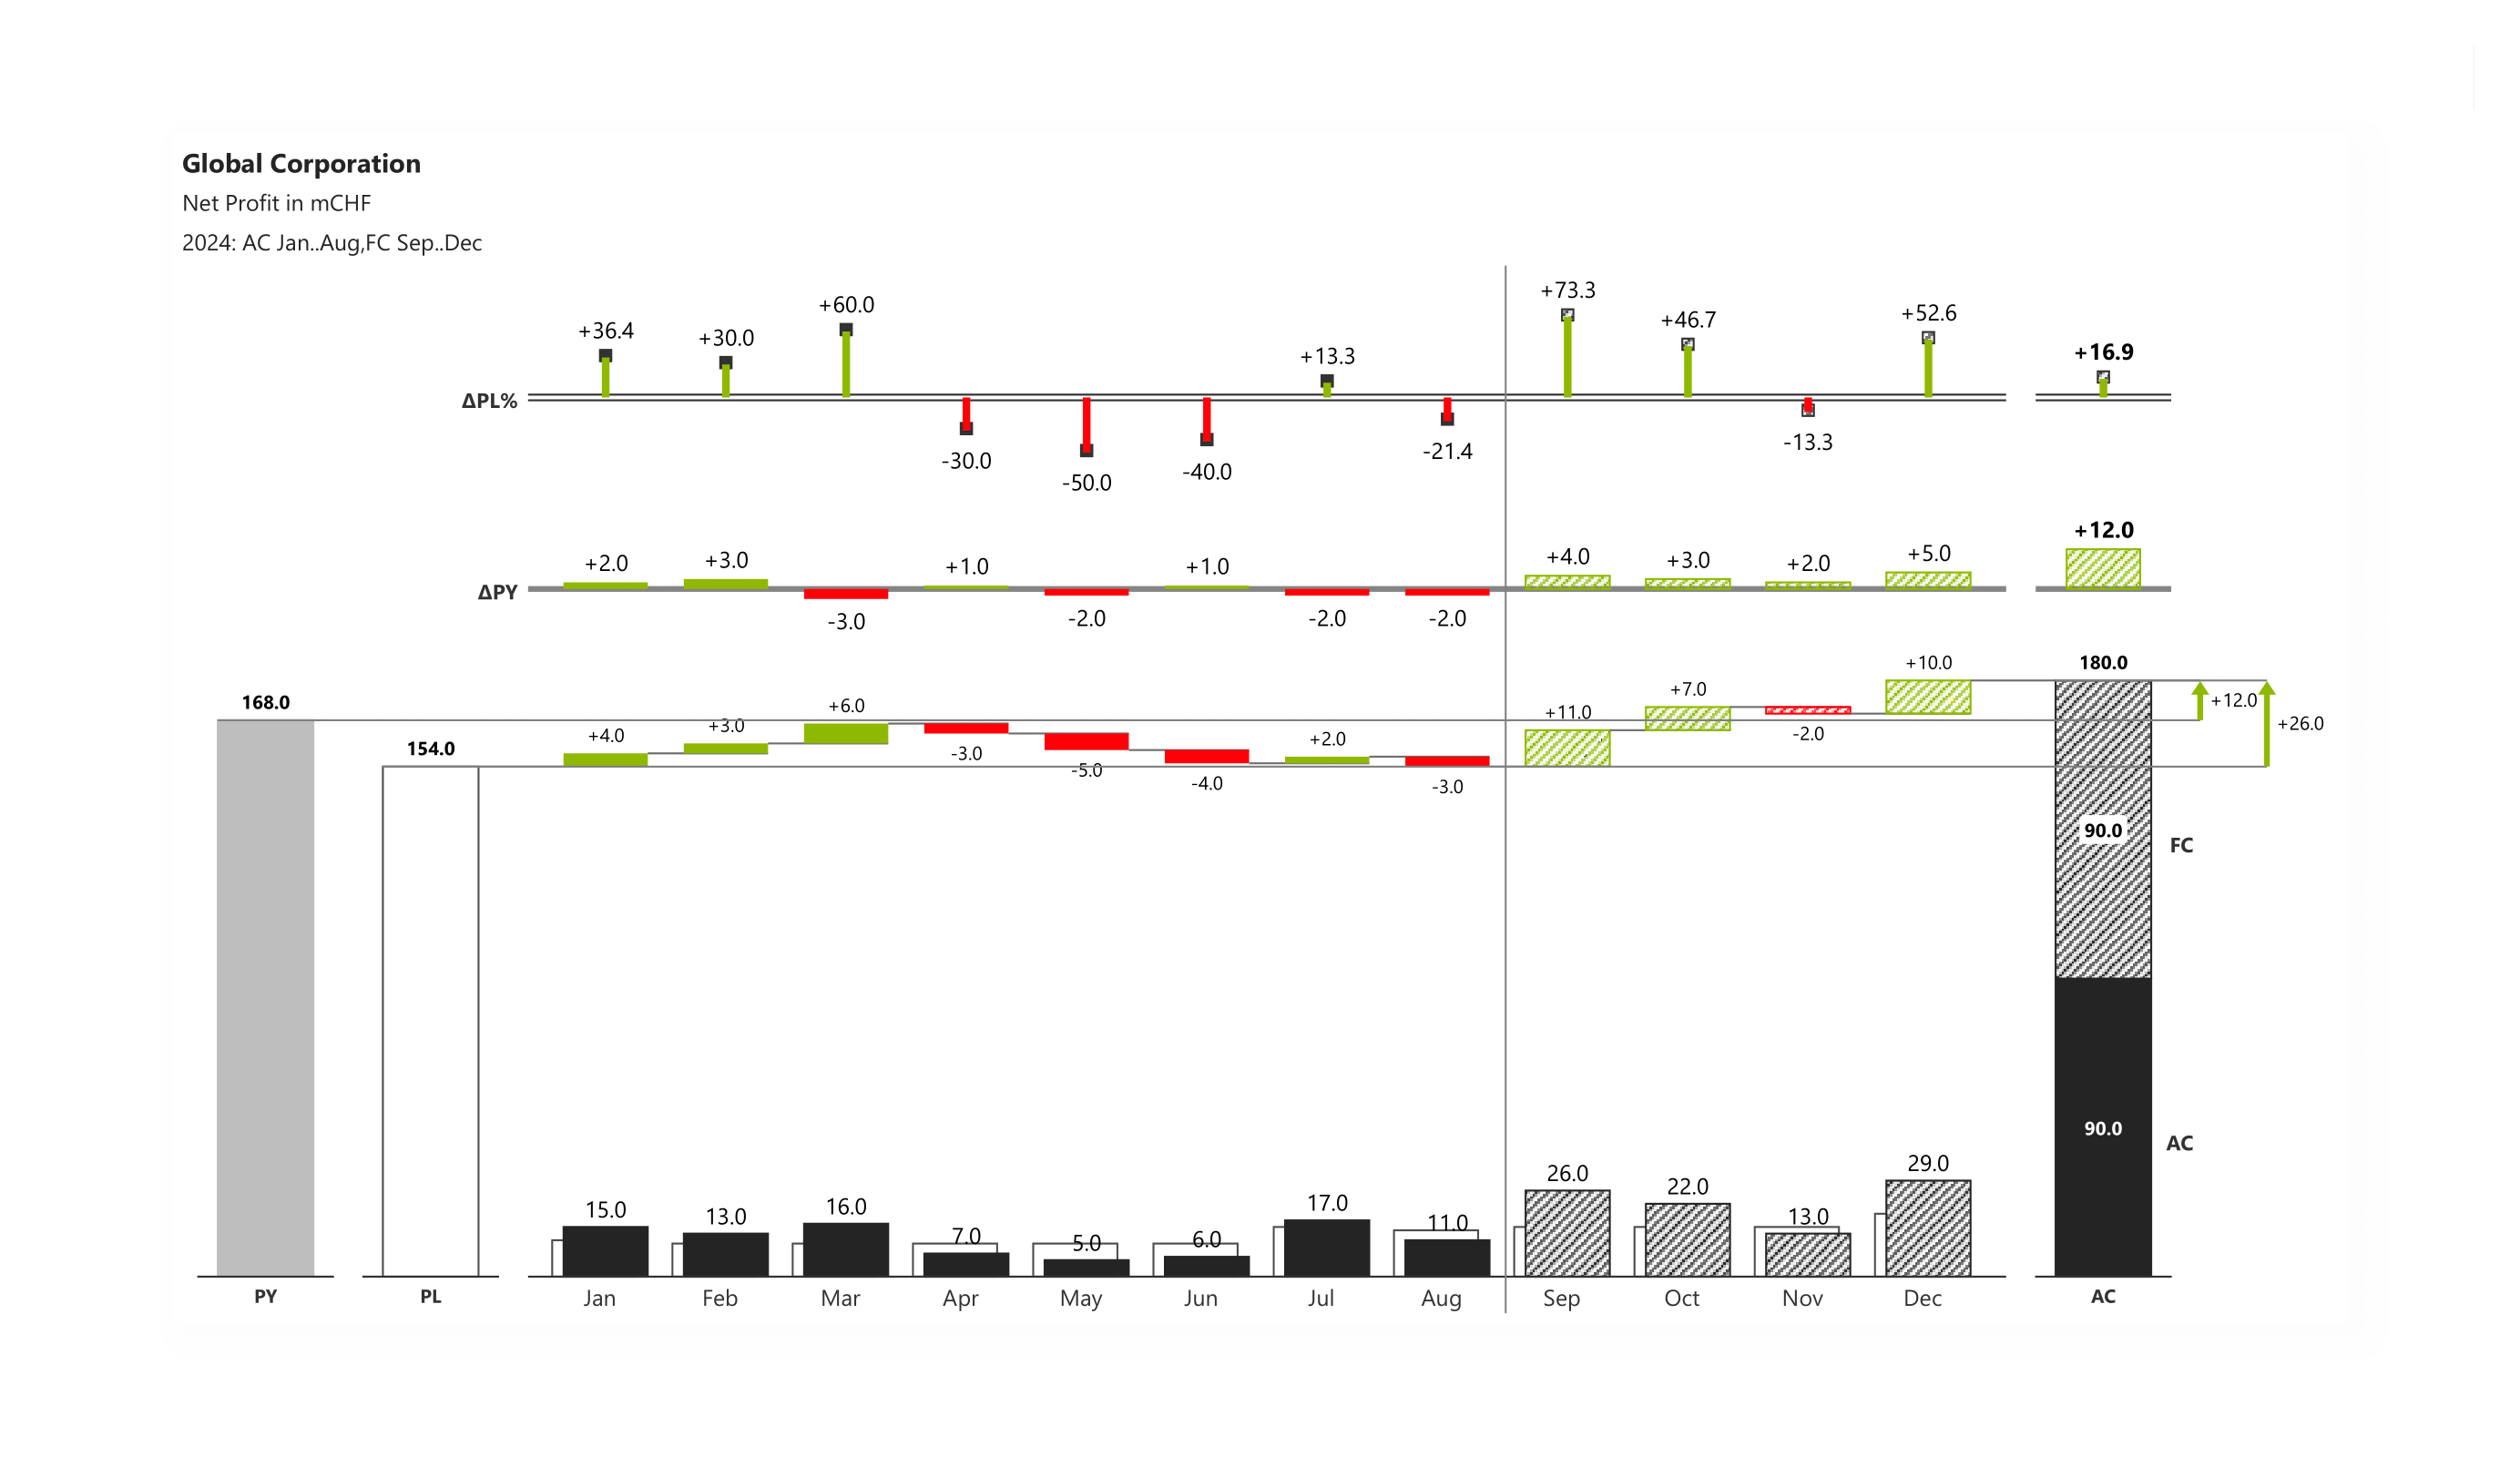
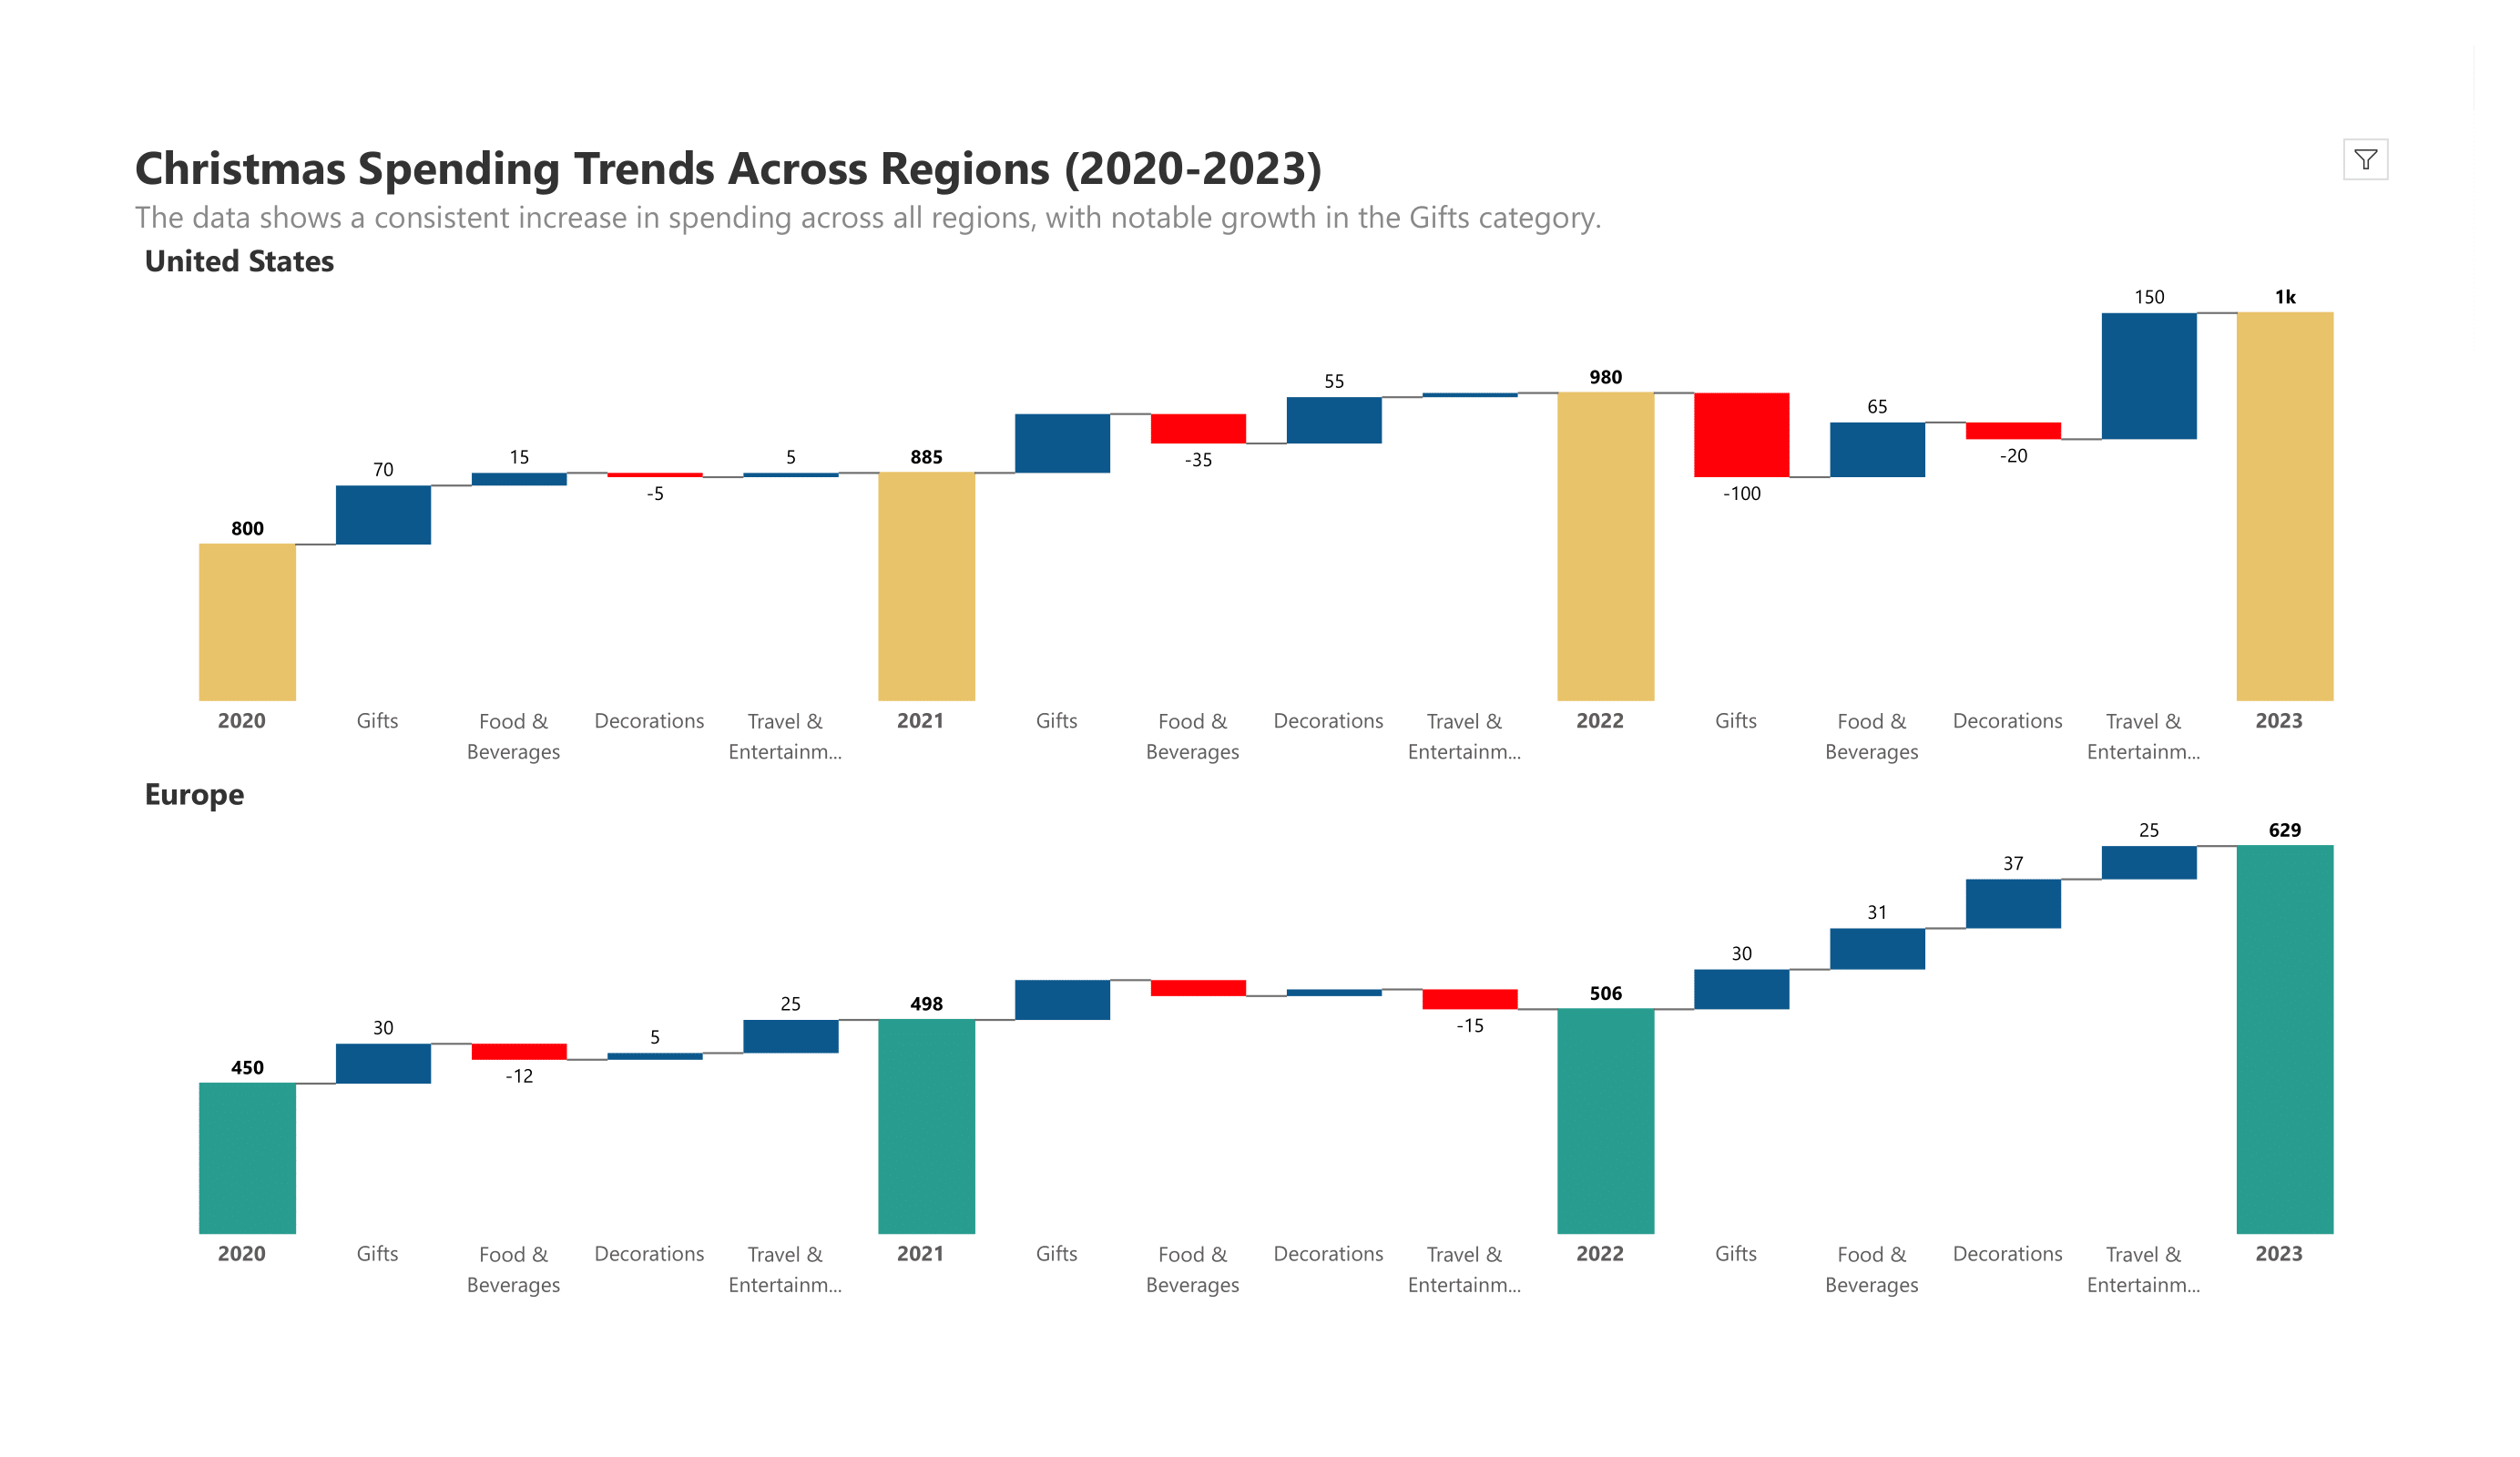
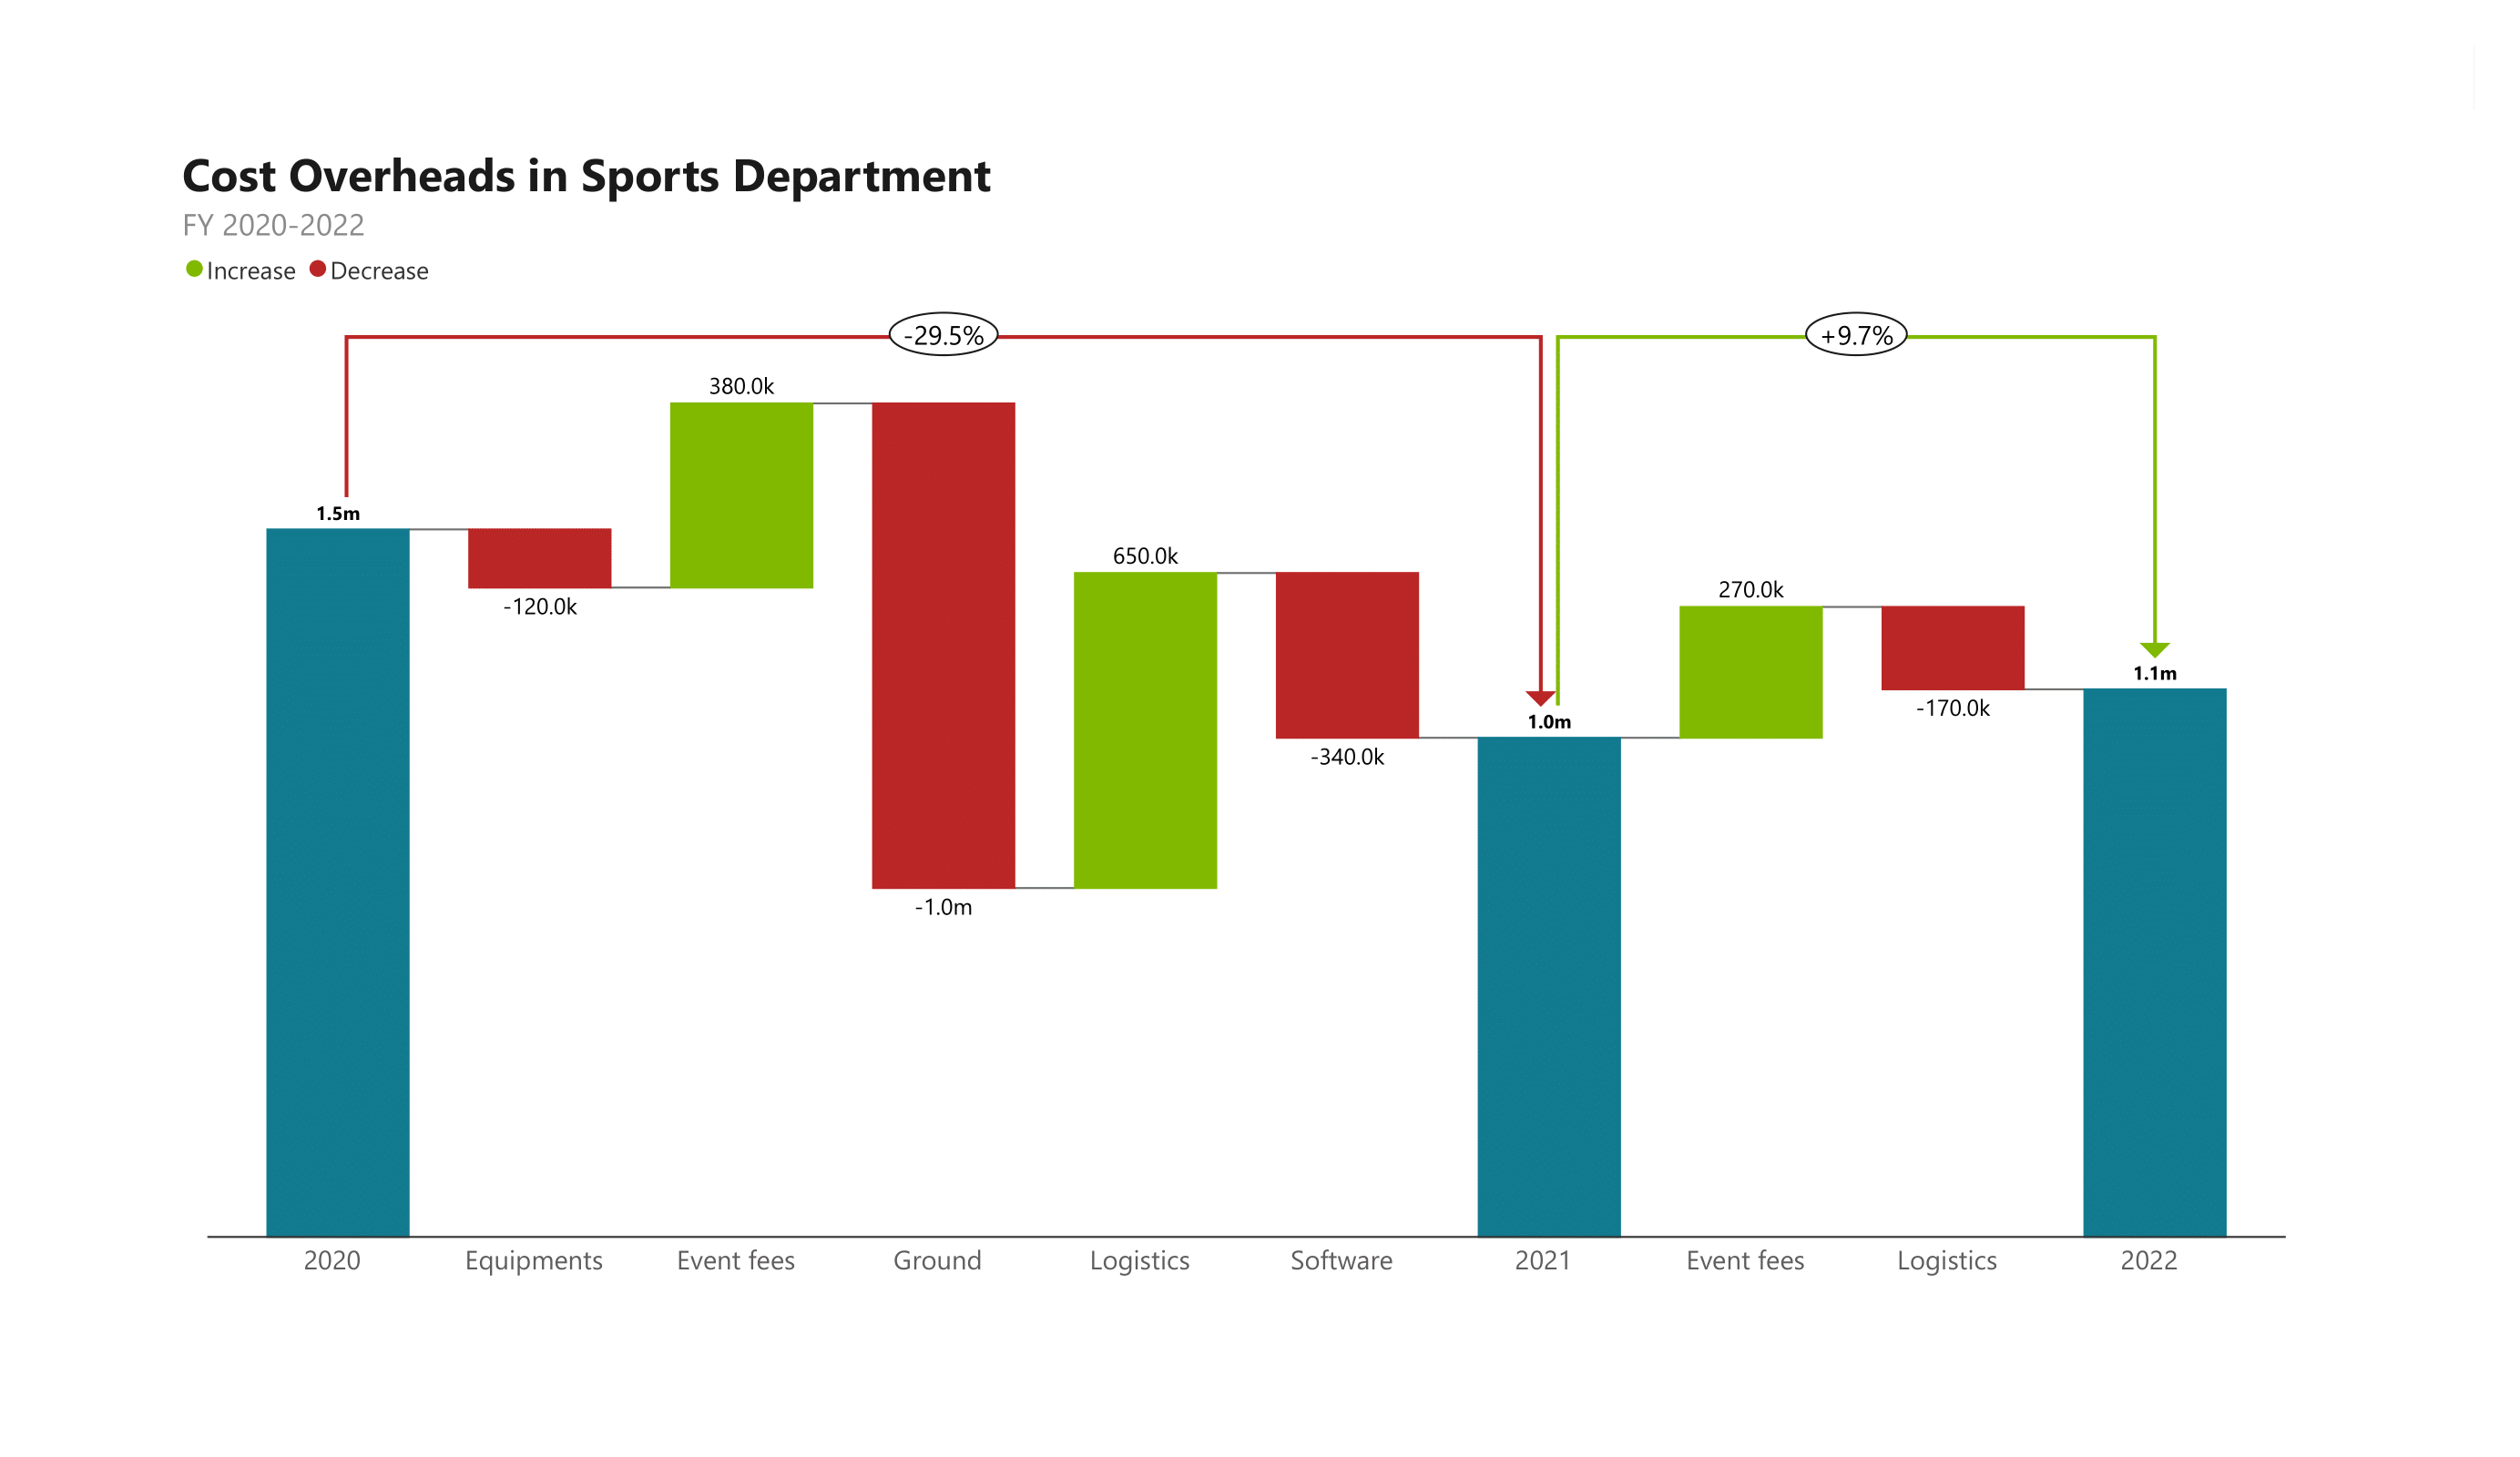
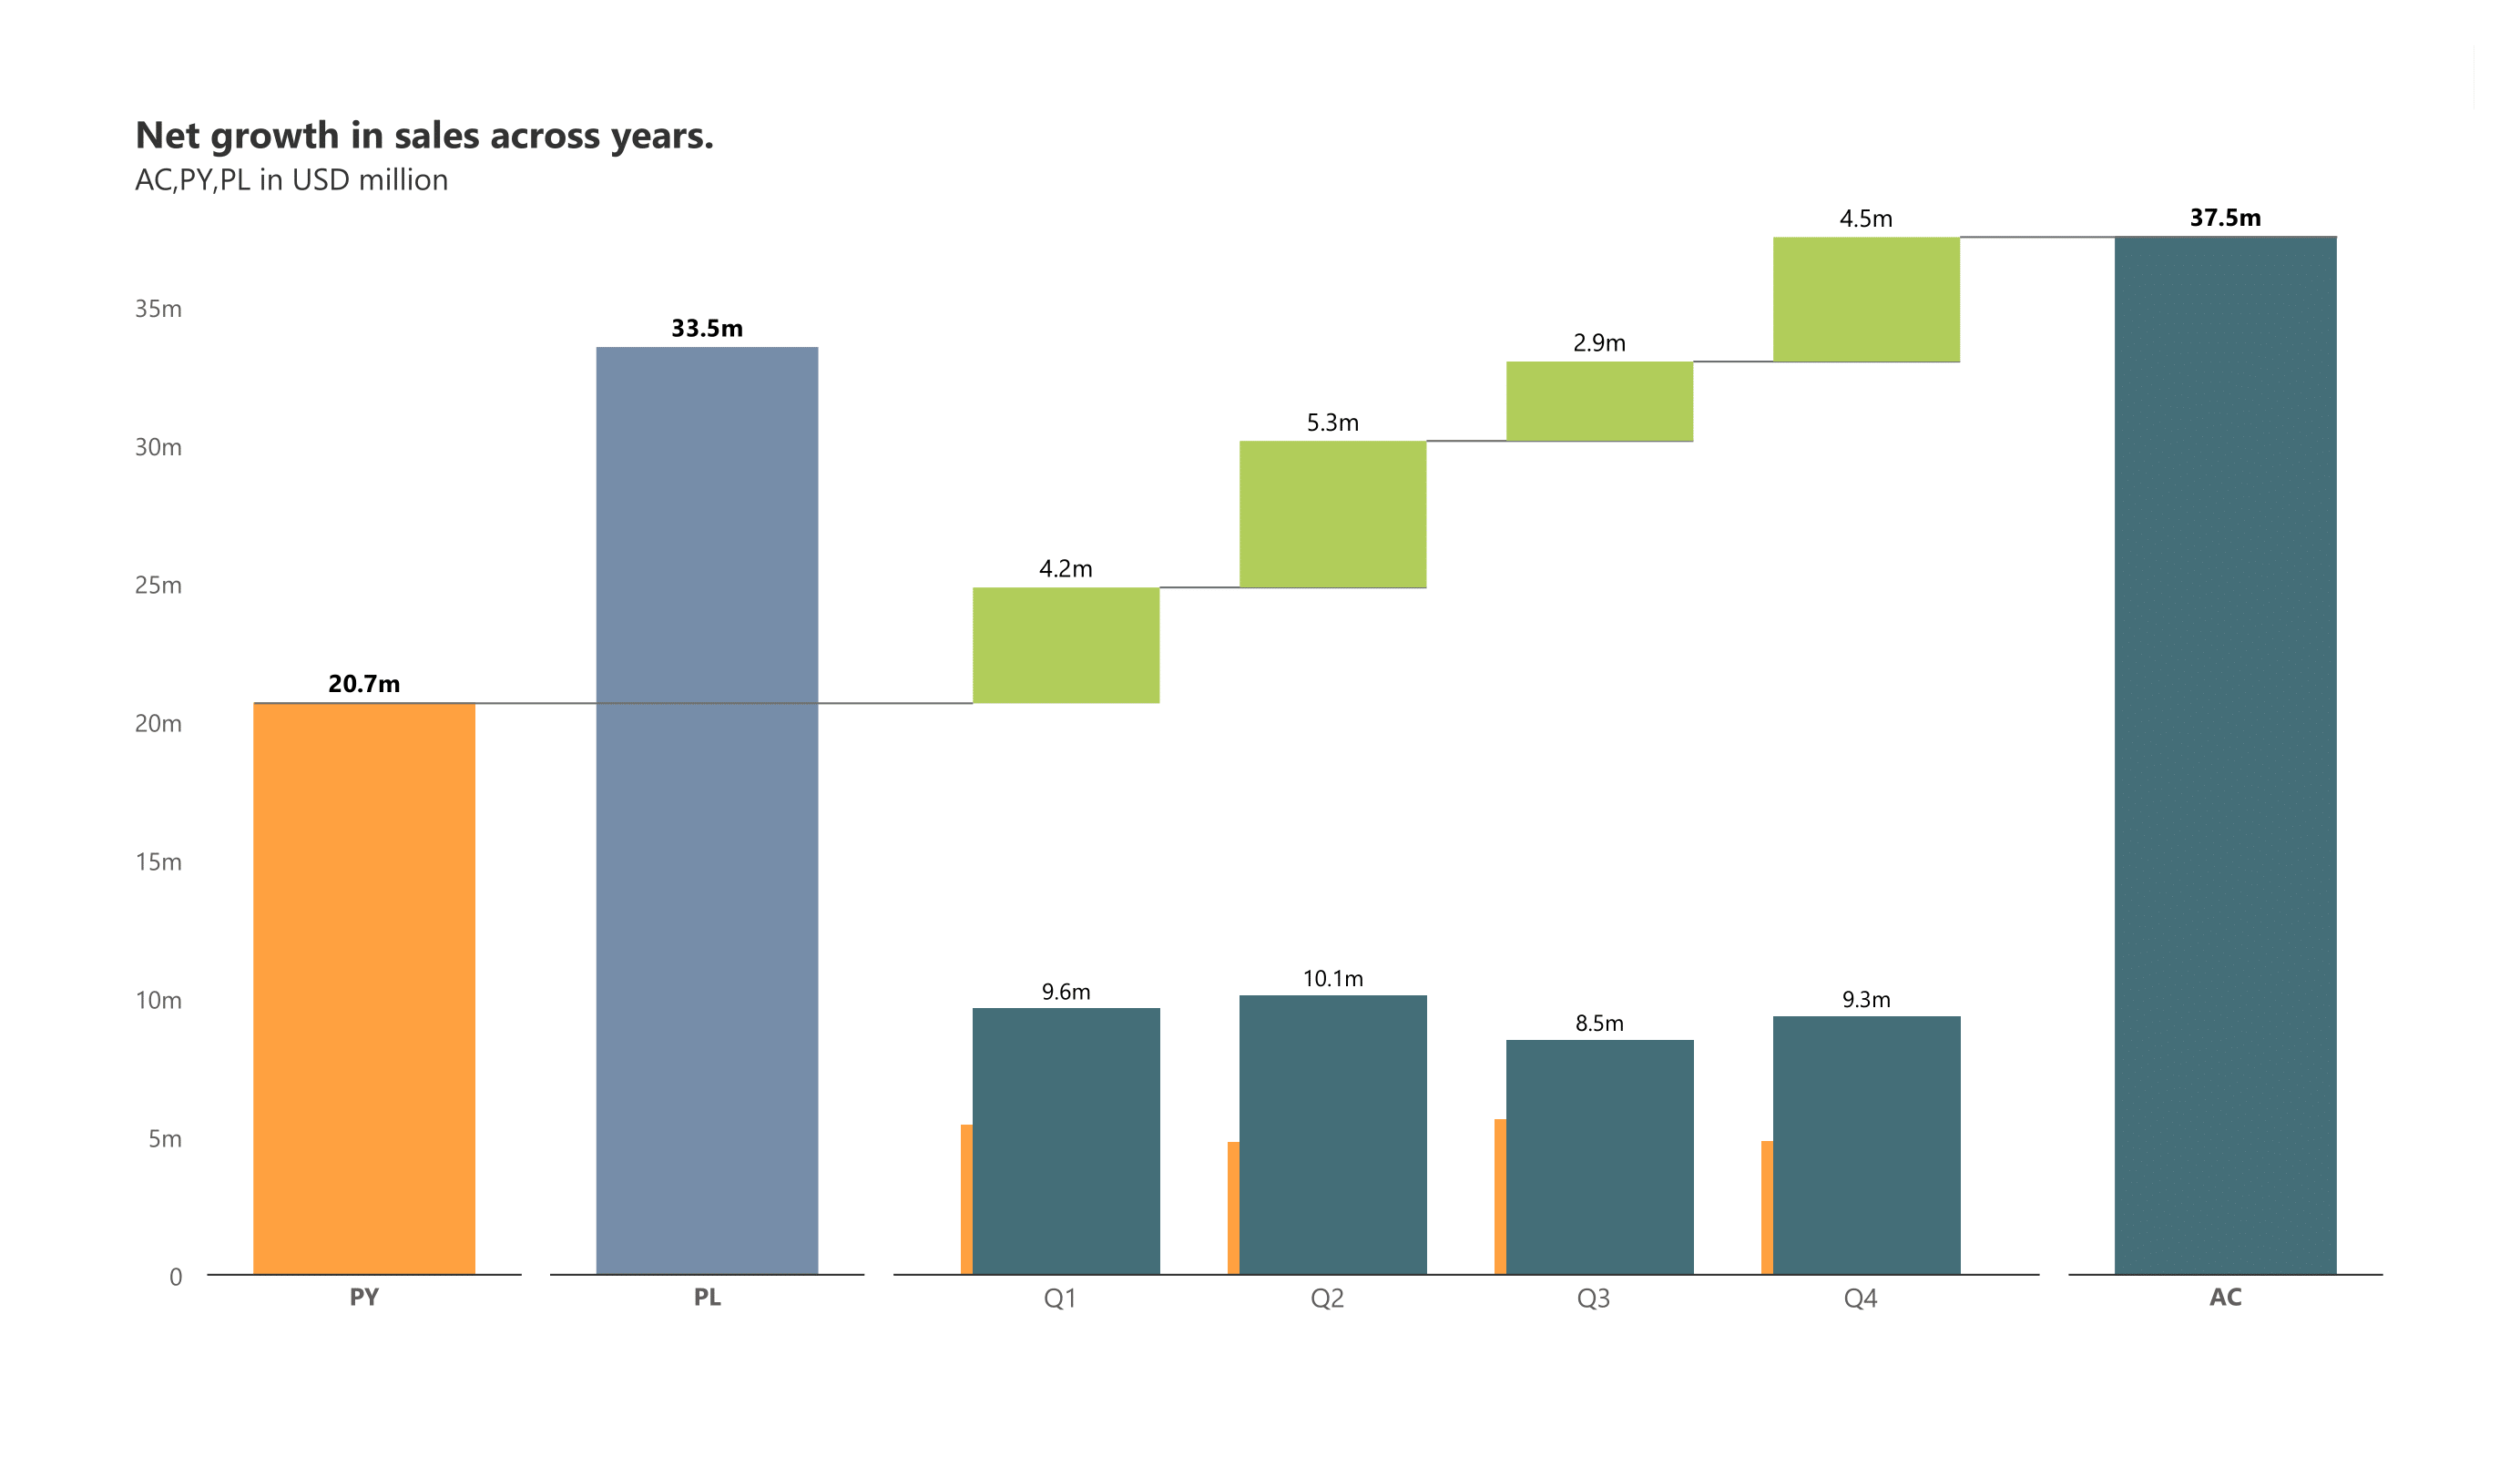
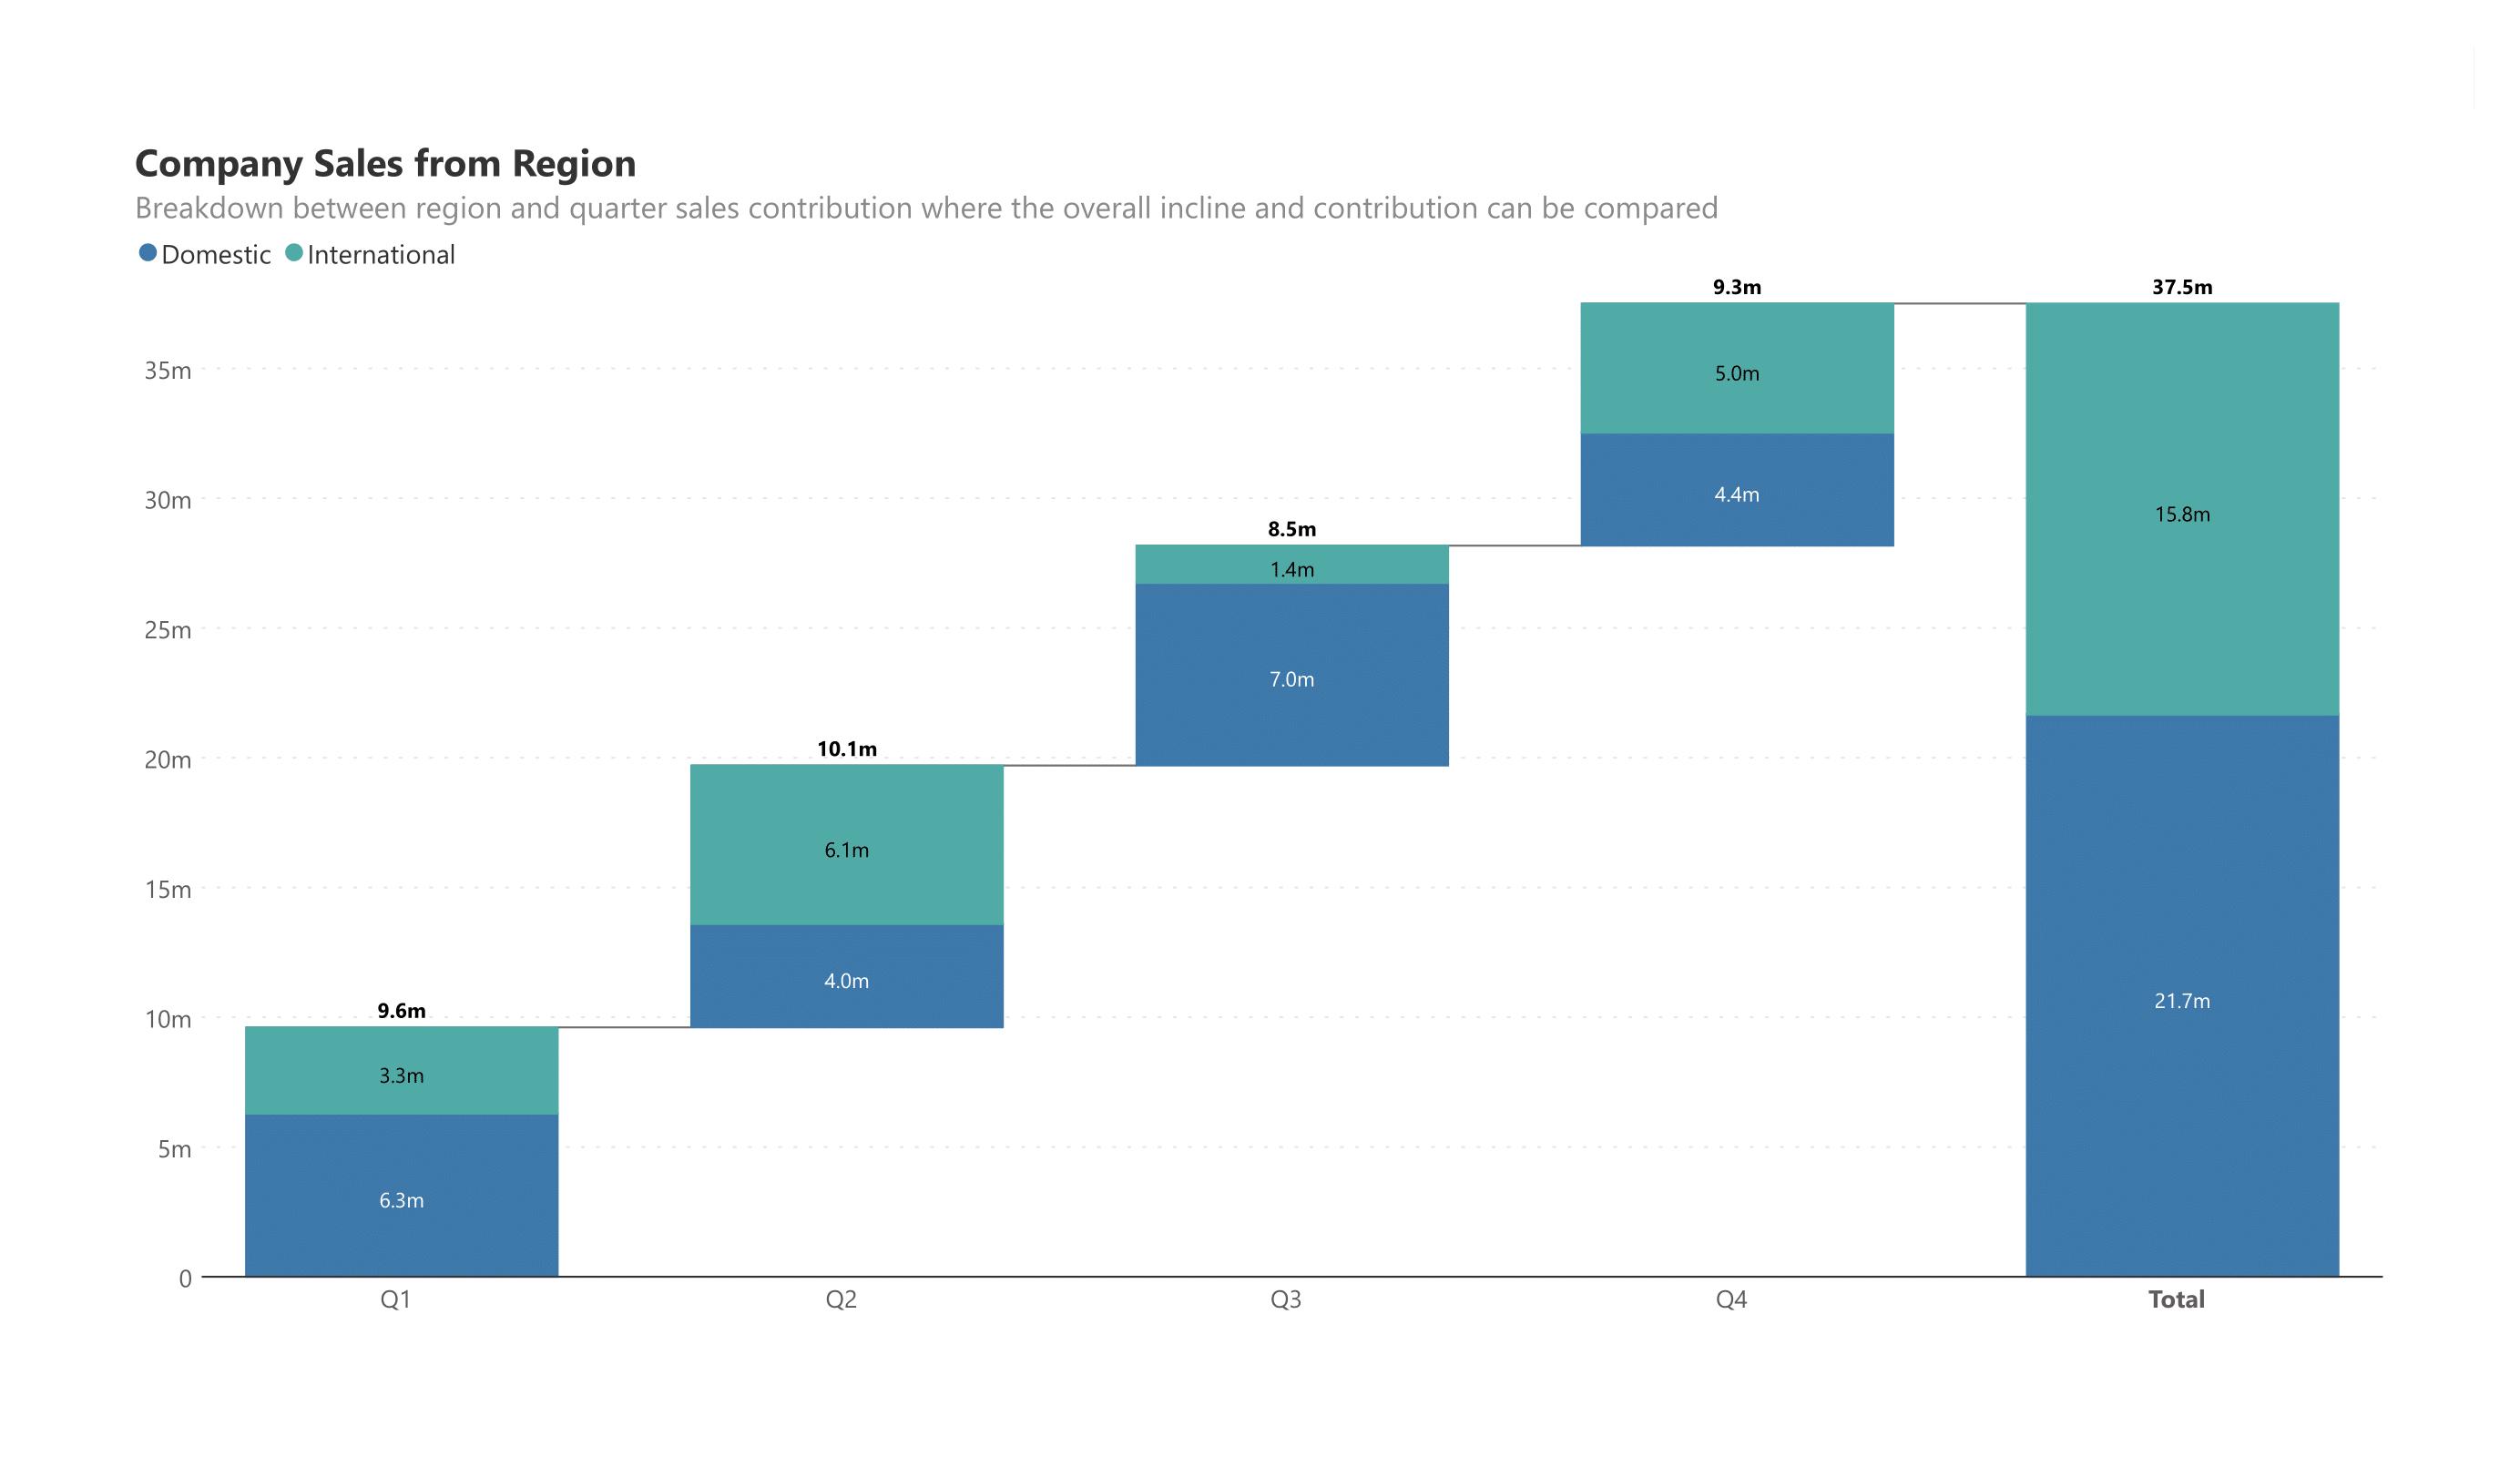
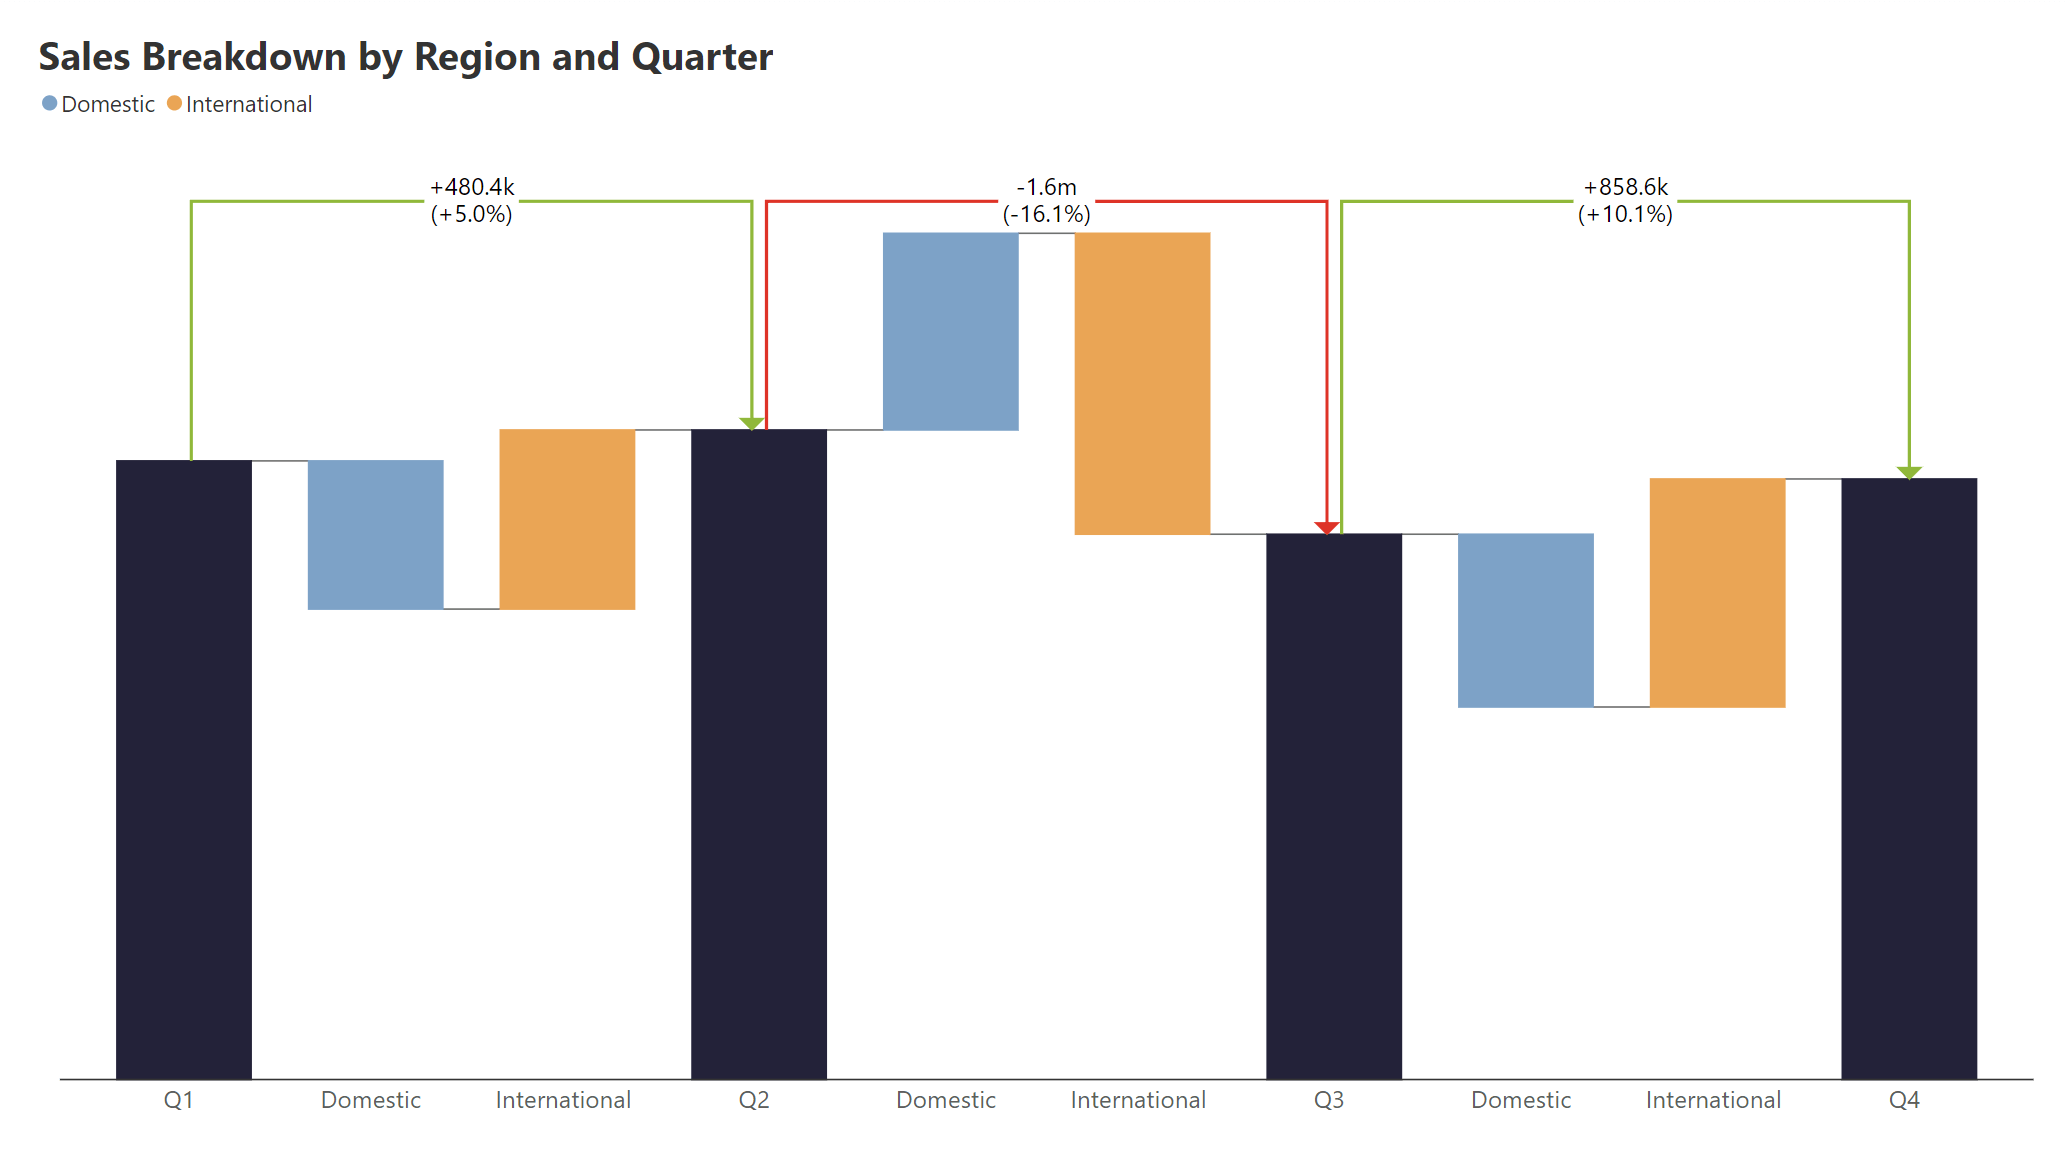
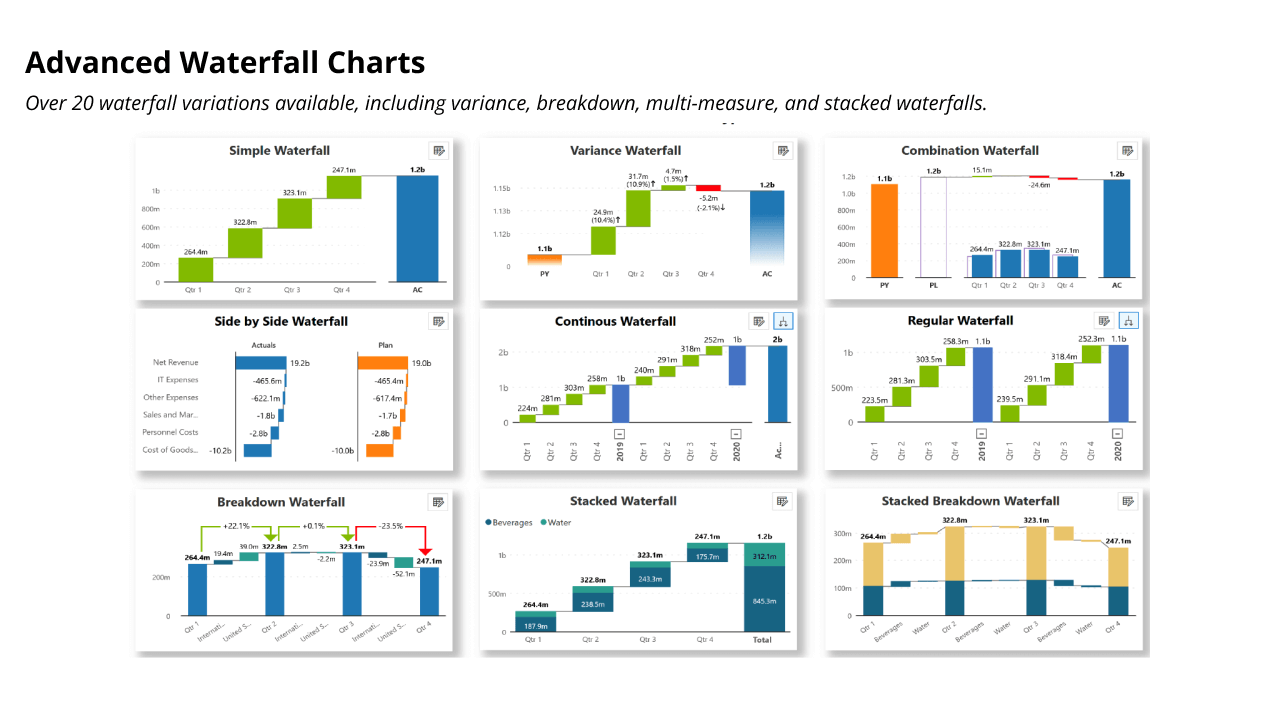
Over 20 waterfall variations, including variance, breakdown, multi-measure, and stacked waterfalls.
IBCS compliant charts

IBCS-Compliant Charts

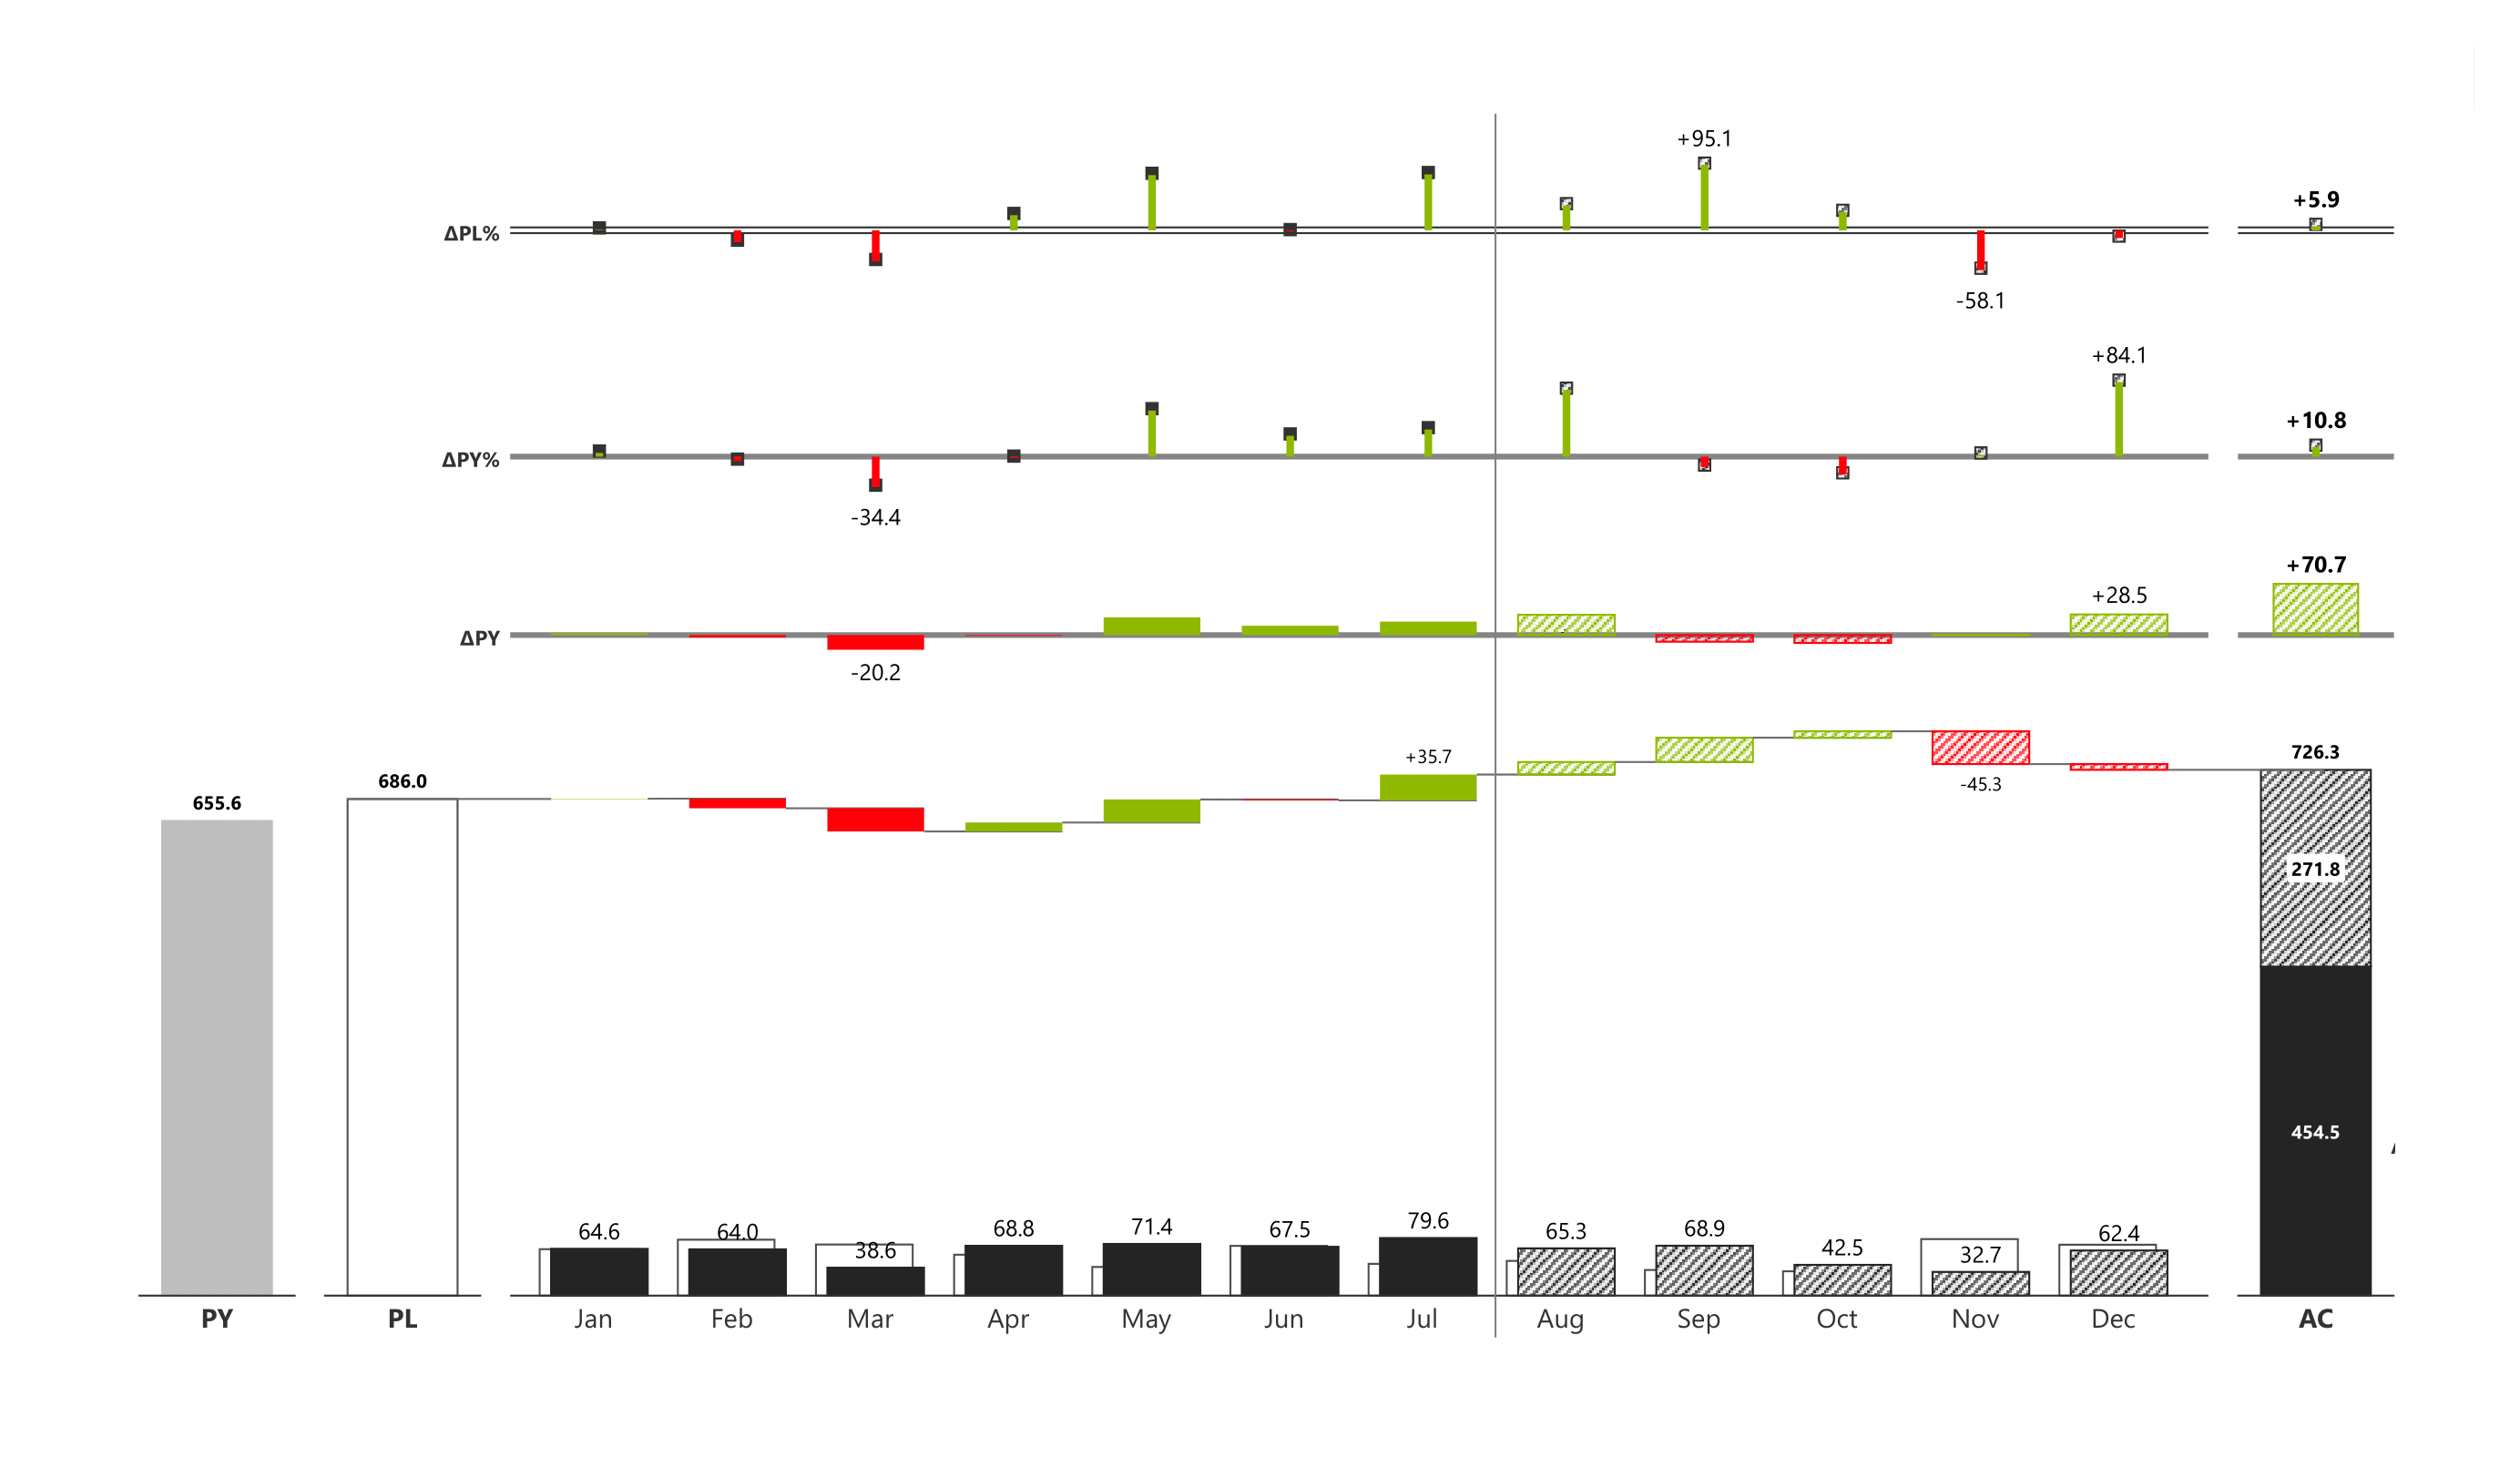
Includes all IBCS-compliant templates with features like segmented charts and multi-series control.
Pivot mode

Pivot Mode

Get excel-like pivot mode to switch data between categories, groups, measures, and trellis options without editing source data. 
Intermediate sum

Intermediate Sum

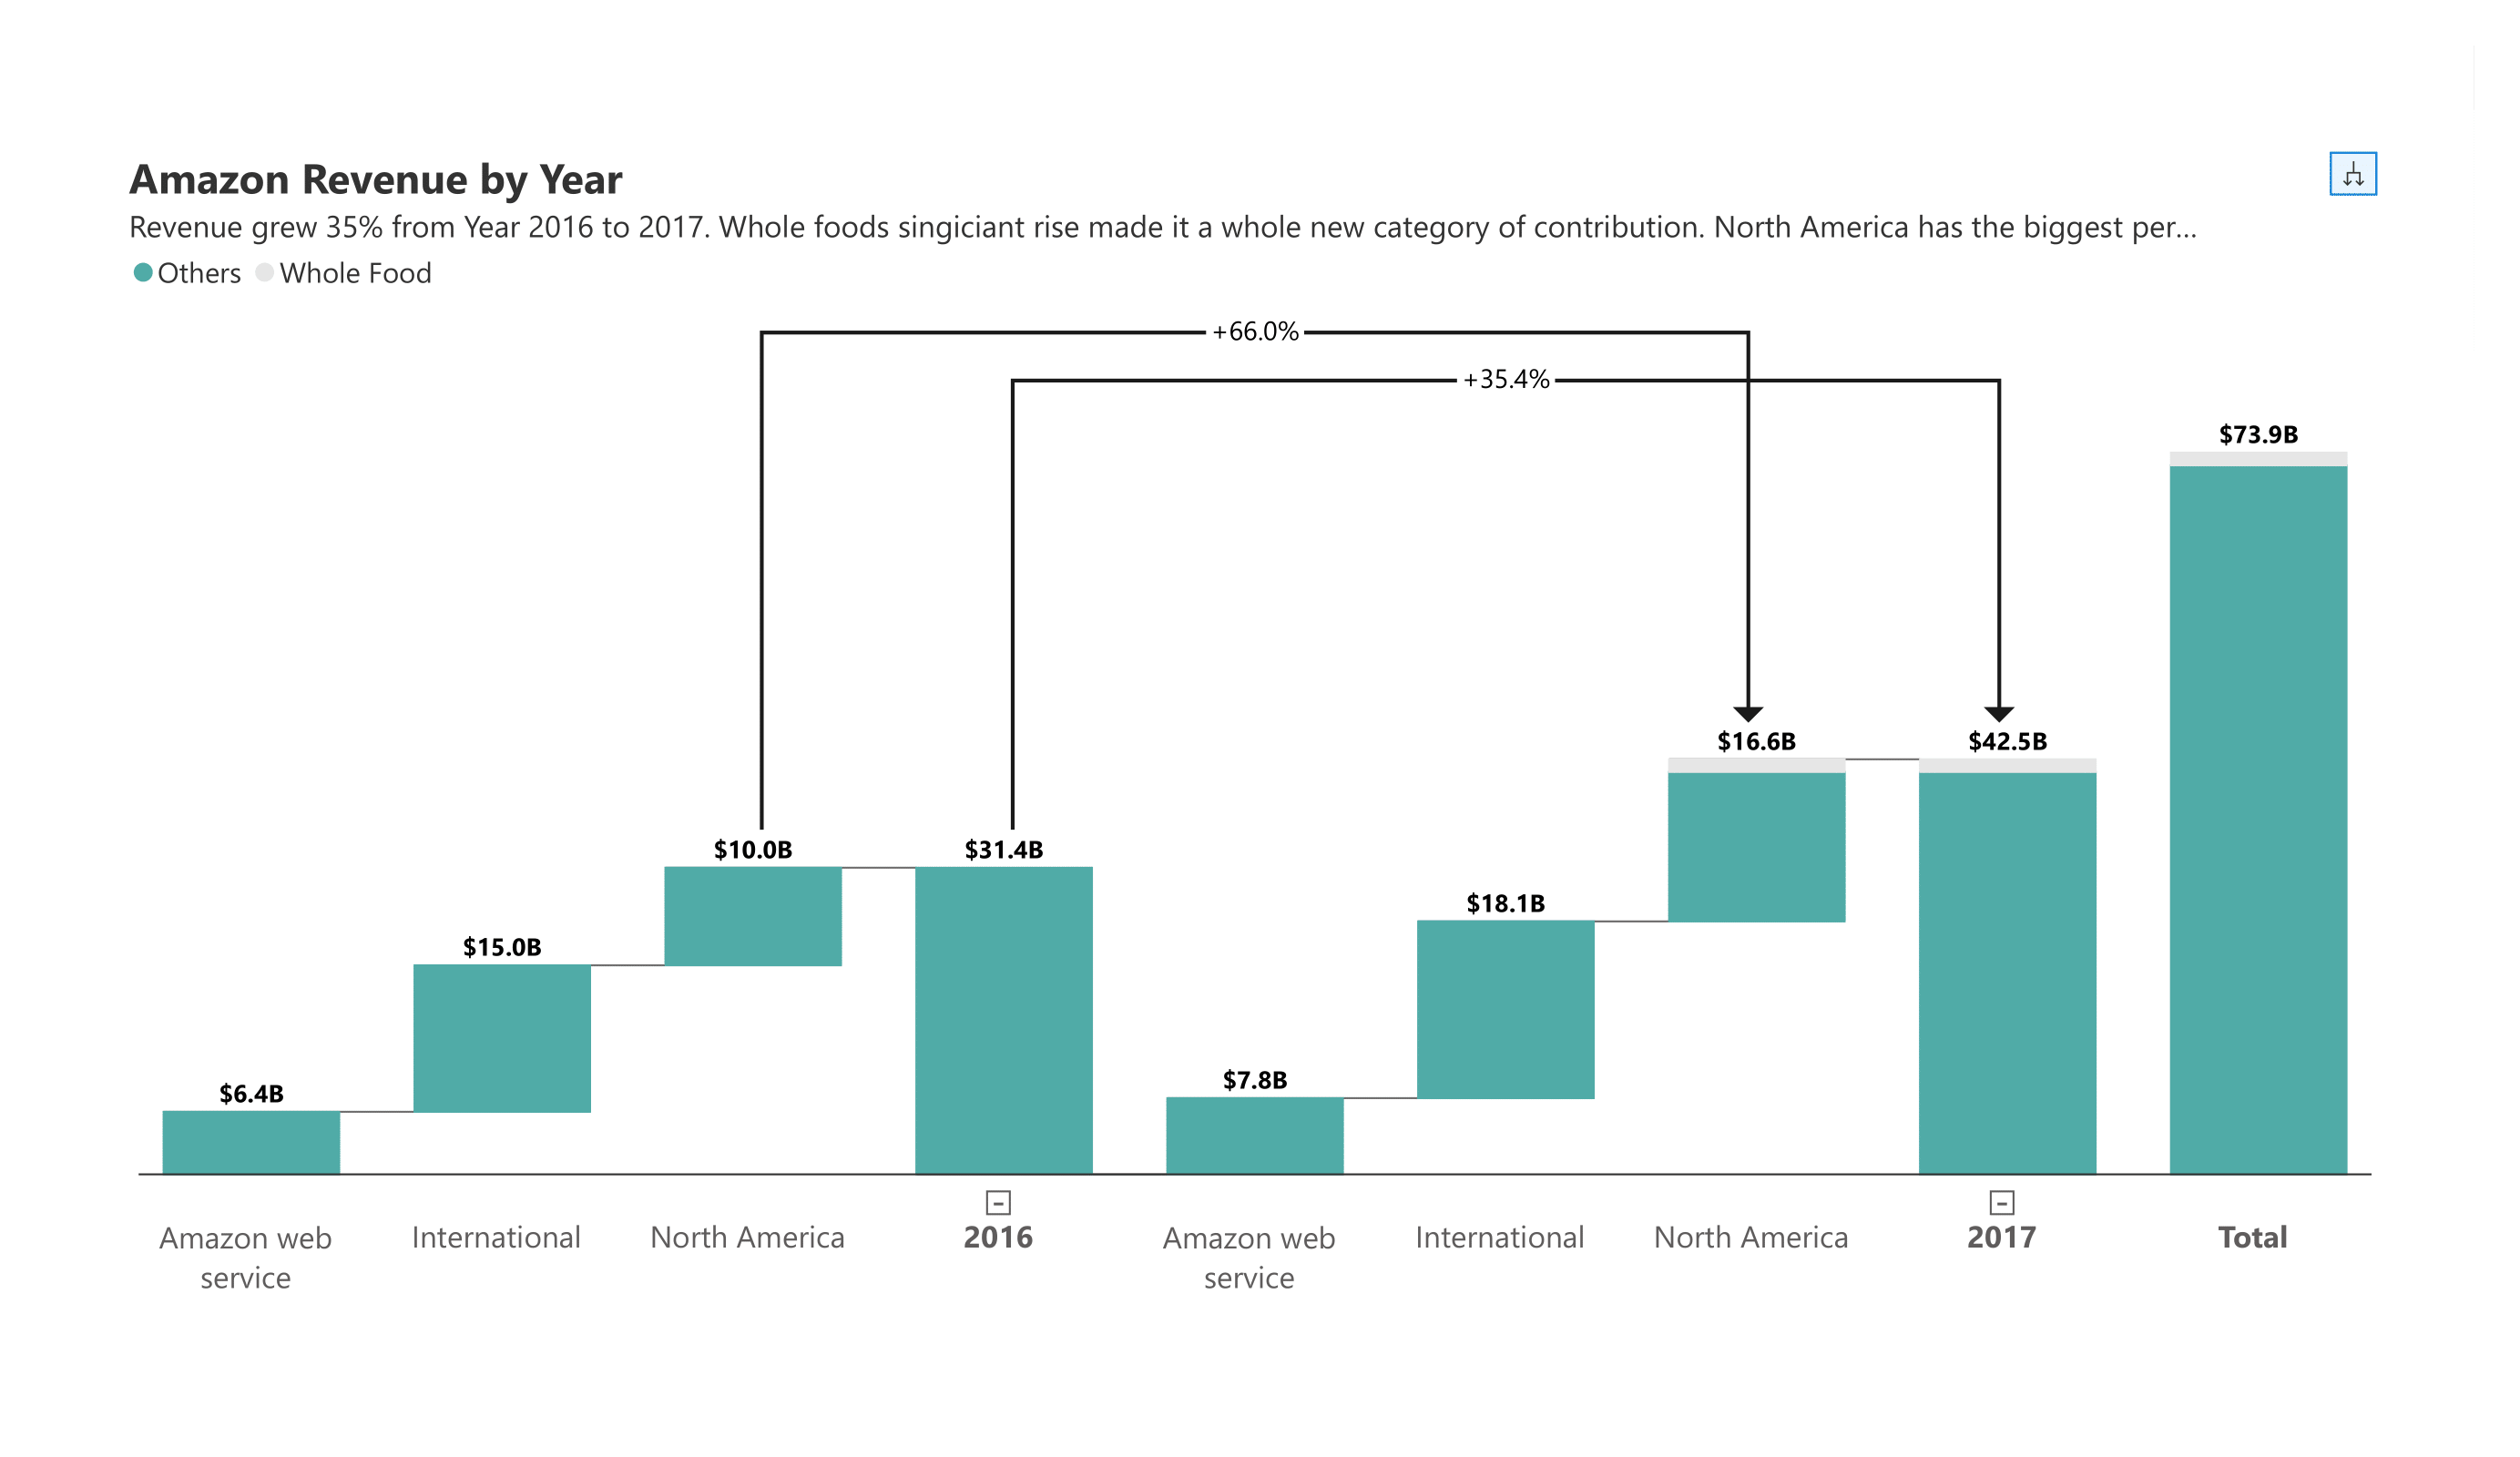
Create custom breakdowns with simple clicks. Add totals, results, and invert +/- values to create cumulative bars.
Small multiples

Small Multiples

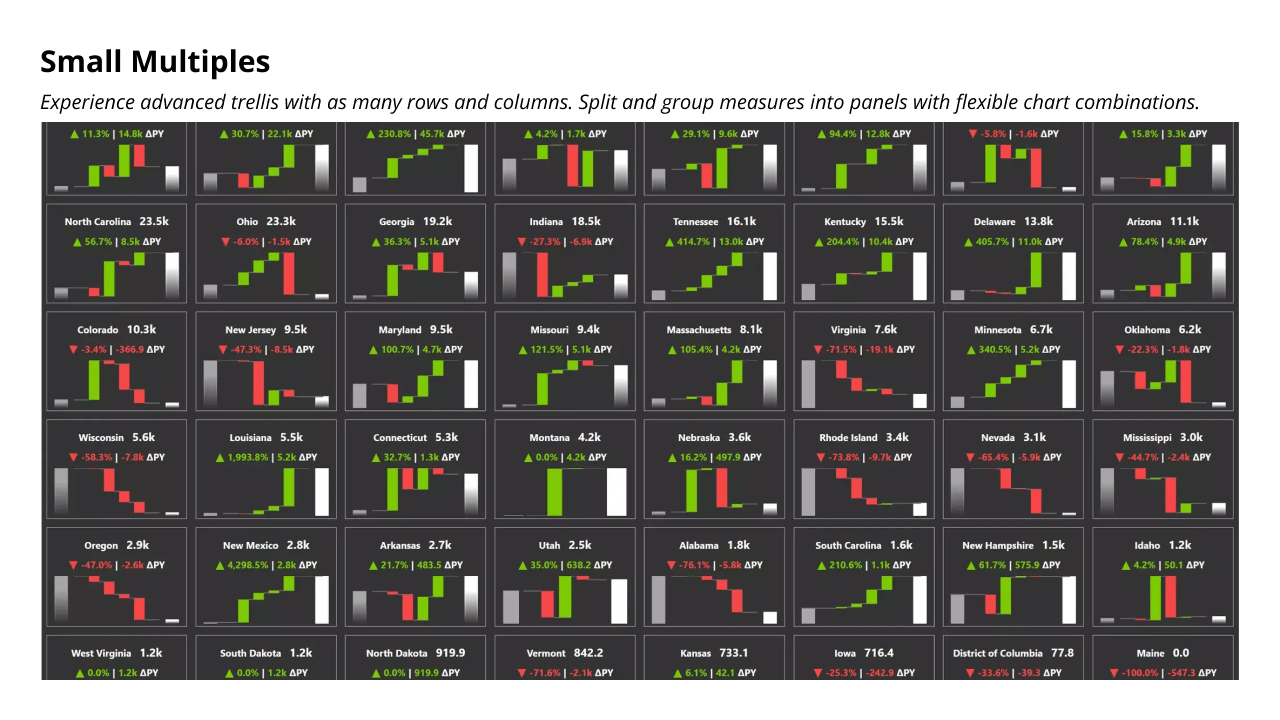
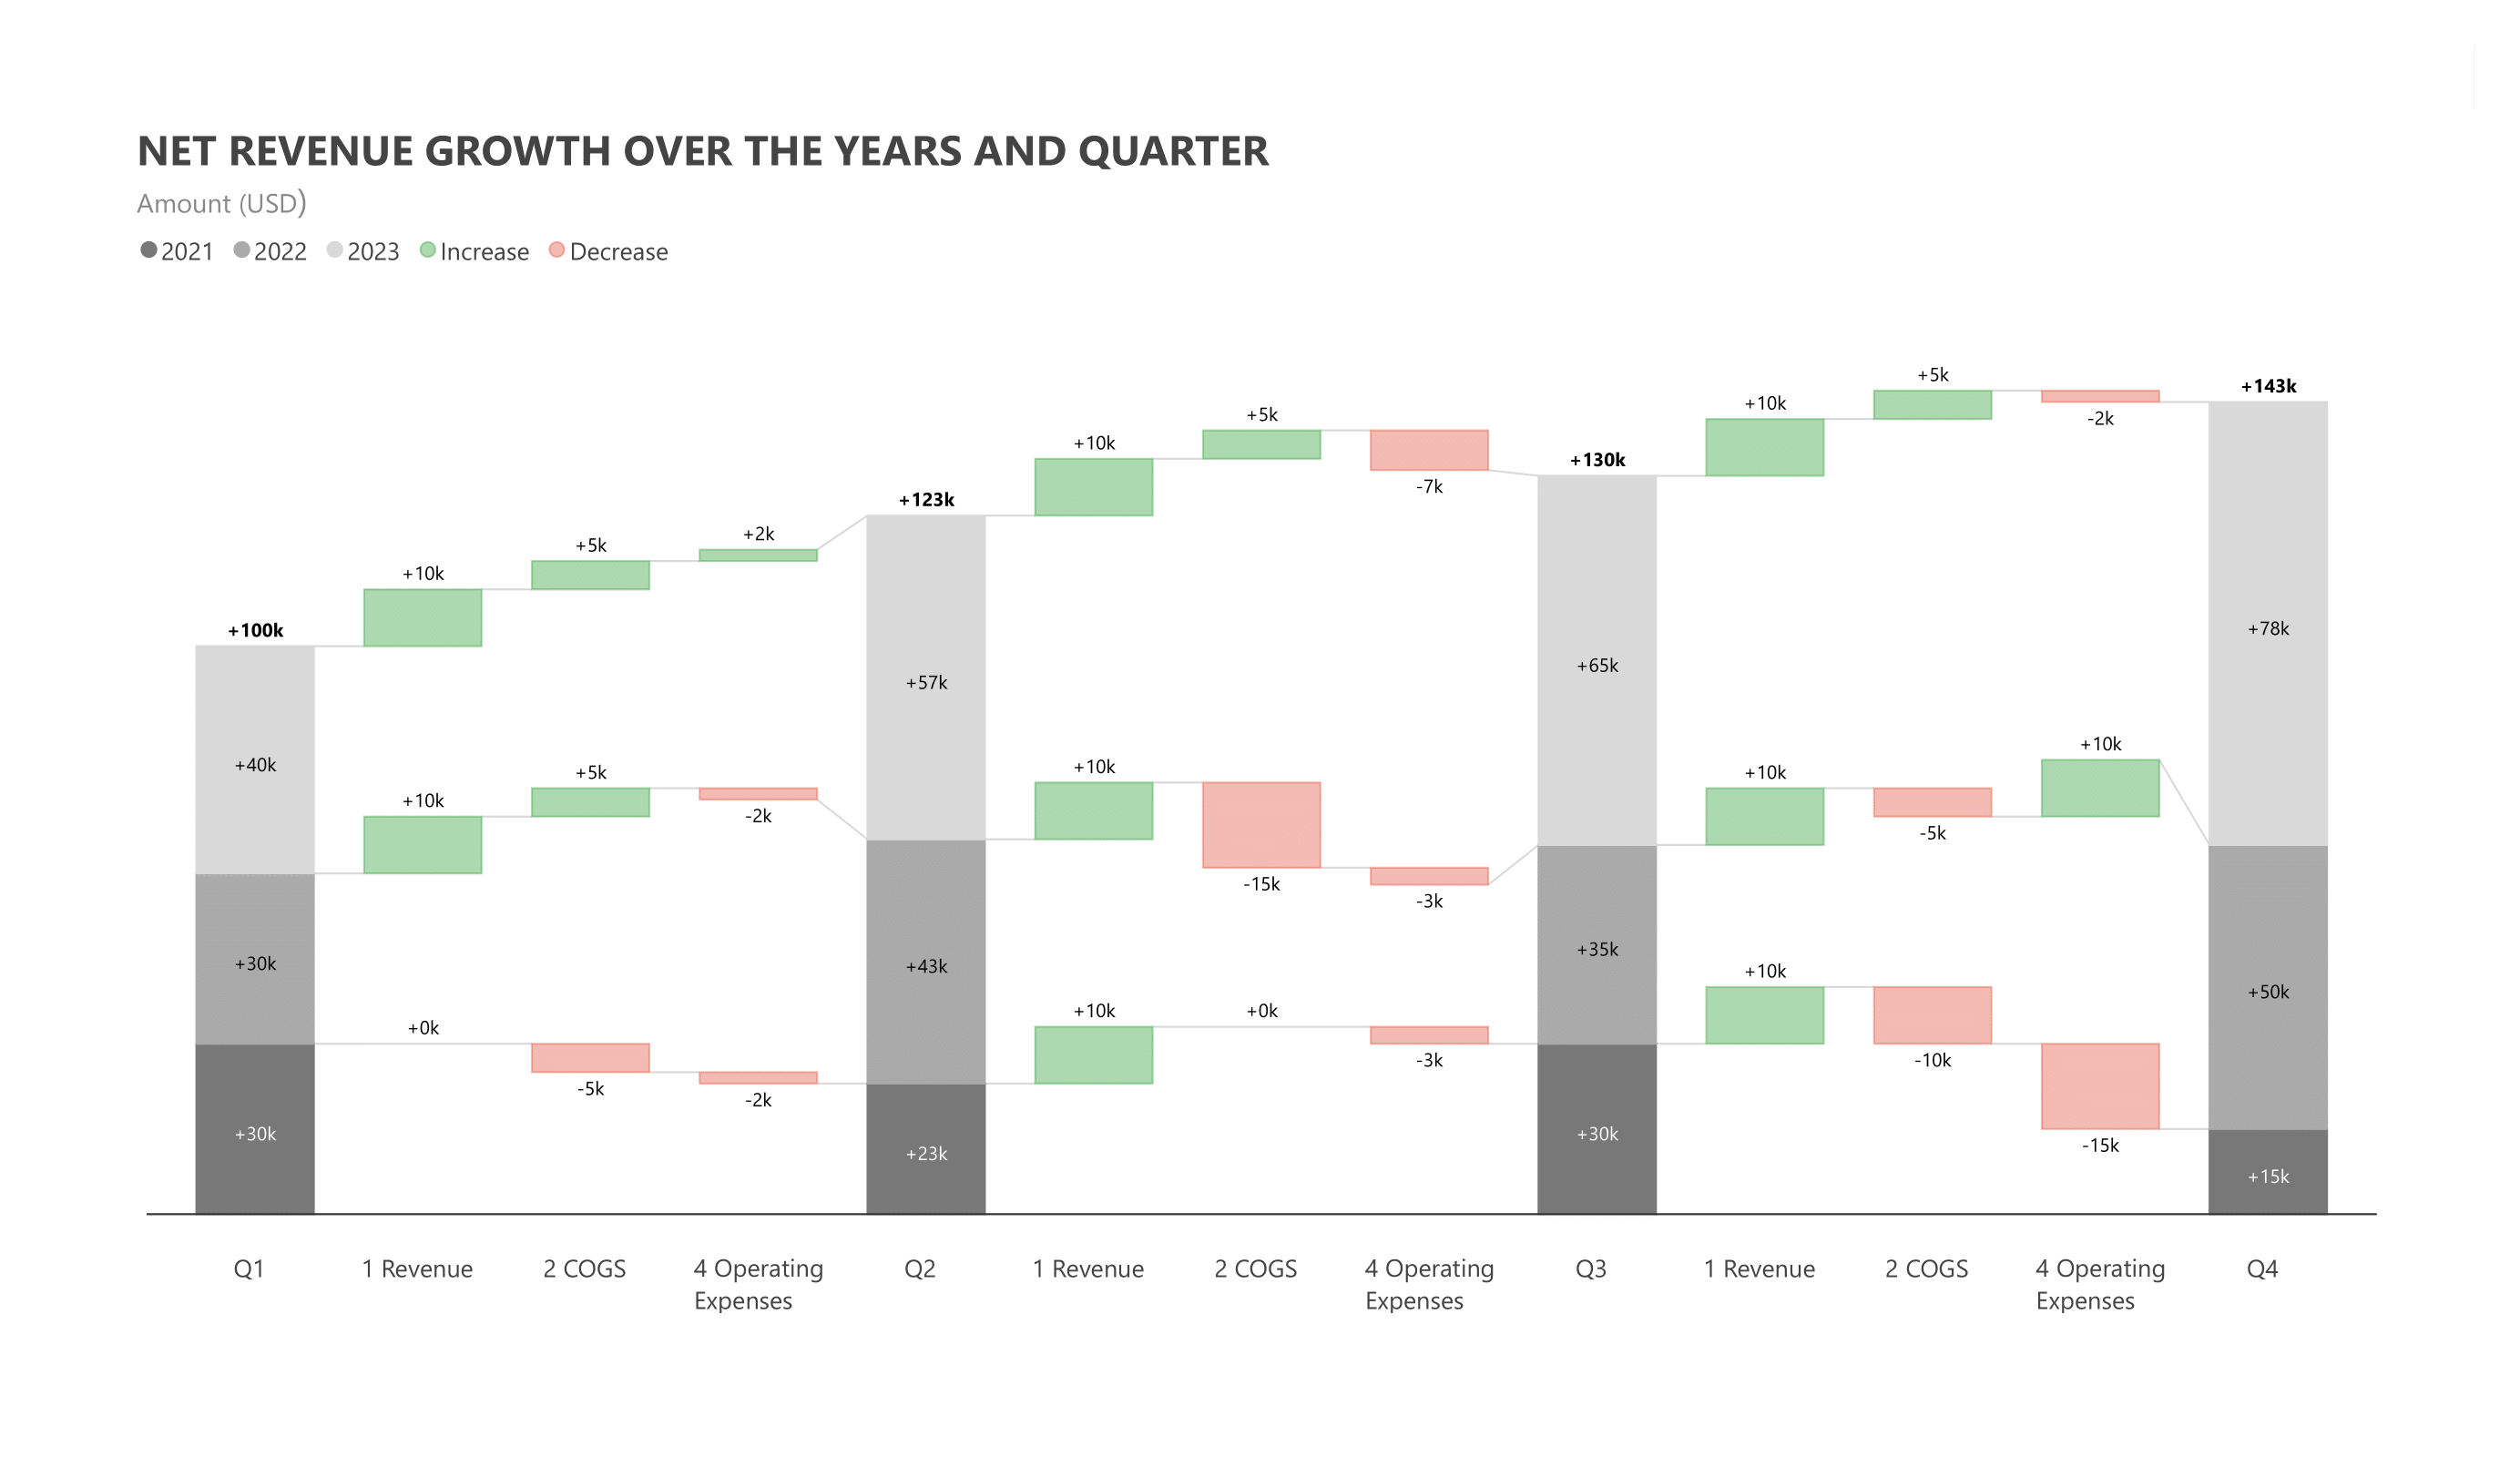
Experience advanced trellis charts with multi-level small multiples. Split and group measures into panels with flexible chart combinations and Excel-like formatting.
Rich formatting

Rich Formatting

Features include ranking, sorting, legends, number formatting, conditional formatting, axis breaks, and pixel-perfect export to PDF.
Advanced analytics

Advanced Analytics

Calculate relative and absolute Deviation. Annotate important points with dynamic measure.
Summary table

Summary Table

Edit and modify data like in a PPT editor to change visuals on the go.

Gallery

Featured webinar

popup-waterfall-charts-in-Power-BI-deep-dive

Waterfall charts in Power BI – A deep dive

Check out this webinar replay to explore waterfall charts in-depth and learn how to harness their capabilities in Power BI!
Watch now

Pricing

Get Waterfall chart Family

Billed at

$9,995

/year
Buy waterfall chart family for your entire organization;
Buy now

Get the entire Analytics+ suite

Starts at

$3

/user/month
Buy all the 100+ Charts, KPI cards and Tables (includes bullet charts);
Buy now

Get your FREE eBook

The Ultimate Guide to Waterfall Charts in Power BI

Explore all the types of waterfall chart that you can create in Power BI without using scripting or DAX.​

waterfall-chart-ebook-mockup-inforiver

Get Inforiver brochure

Maximize your business potential with Inforiver's paginated reporting, data entry, planning & budgeting capabilities
Download now
Inforiver

Inforiver helps enterprises consolidate planning, reporting & analytics on a single platform (Power BI). The no-code, self-service award-winning platform has been recognized as the industry’s best and is adopted by many Fortune 100 firms.

Inforiver is a product of Lumel, the #1 Power BI AppSource Partner. The firm serves over 3,000 customers worldwide through its portfolio of products offered under the brands Inforiver, EDITable, ValQ, and xViz.

linkedin facebook pinterest youtube rss twitter instagram facebook-blank rss-blank linkedin-blank pinterest youtube twitter instagram