As the pace of change continues to accelerate, organizations have access to an array of powerful solutions designed to help you stay ahead of the curve. However, it is not just about having these tools—learning how to harness their full potential effectively without impacting your data is an important element.
A "sandbox" is a safe, isolated environment where users can run programs without affecting the rest of the system or systems. It's a little like a virtual playground where you can experiment, test, or try out new things without concern for breaking anything or causing harm to the rest of your systems.
A Power BI sandbox is a secure environment where users can explore Power BI functionalities, create reports, and test various settings without affecting critical data.
Sandboxes are a very useful tool for several reasons, including minimizing risk and allowing users to safely enhance their skills. Using a sandbox reduces the risk of disrupting key business insights and is ideal for learning for beginners or expert professionals.
Inforiver provides a robust sandbox, so that you and your team can utilize a sandbox environment to thoroughly evaluate features and performance. Discover how to level up your planning and analytics capabilities with a sandbox environment in our step-by-step guide:
Learn how to set up a new sandbox below:
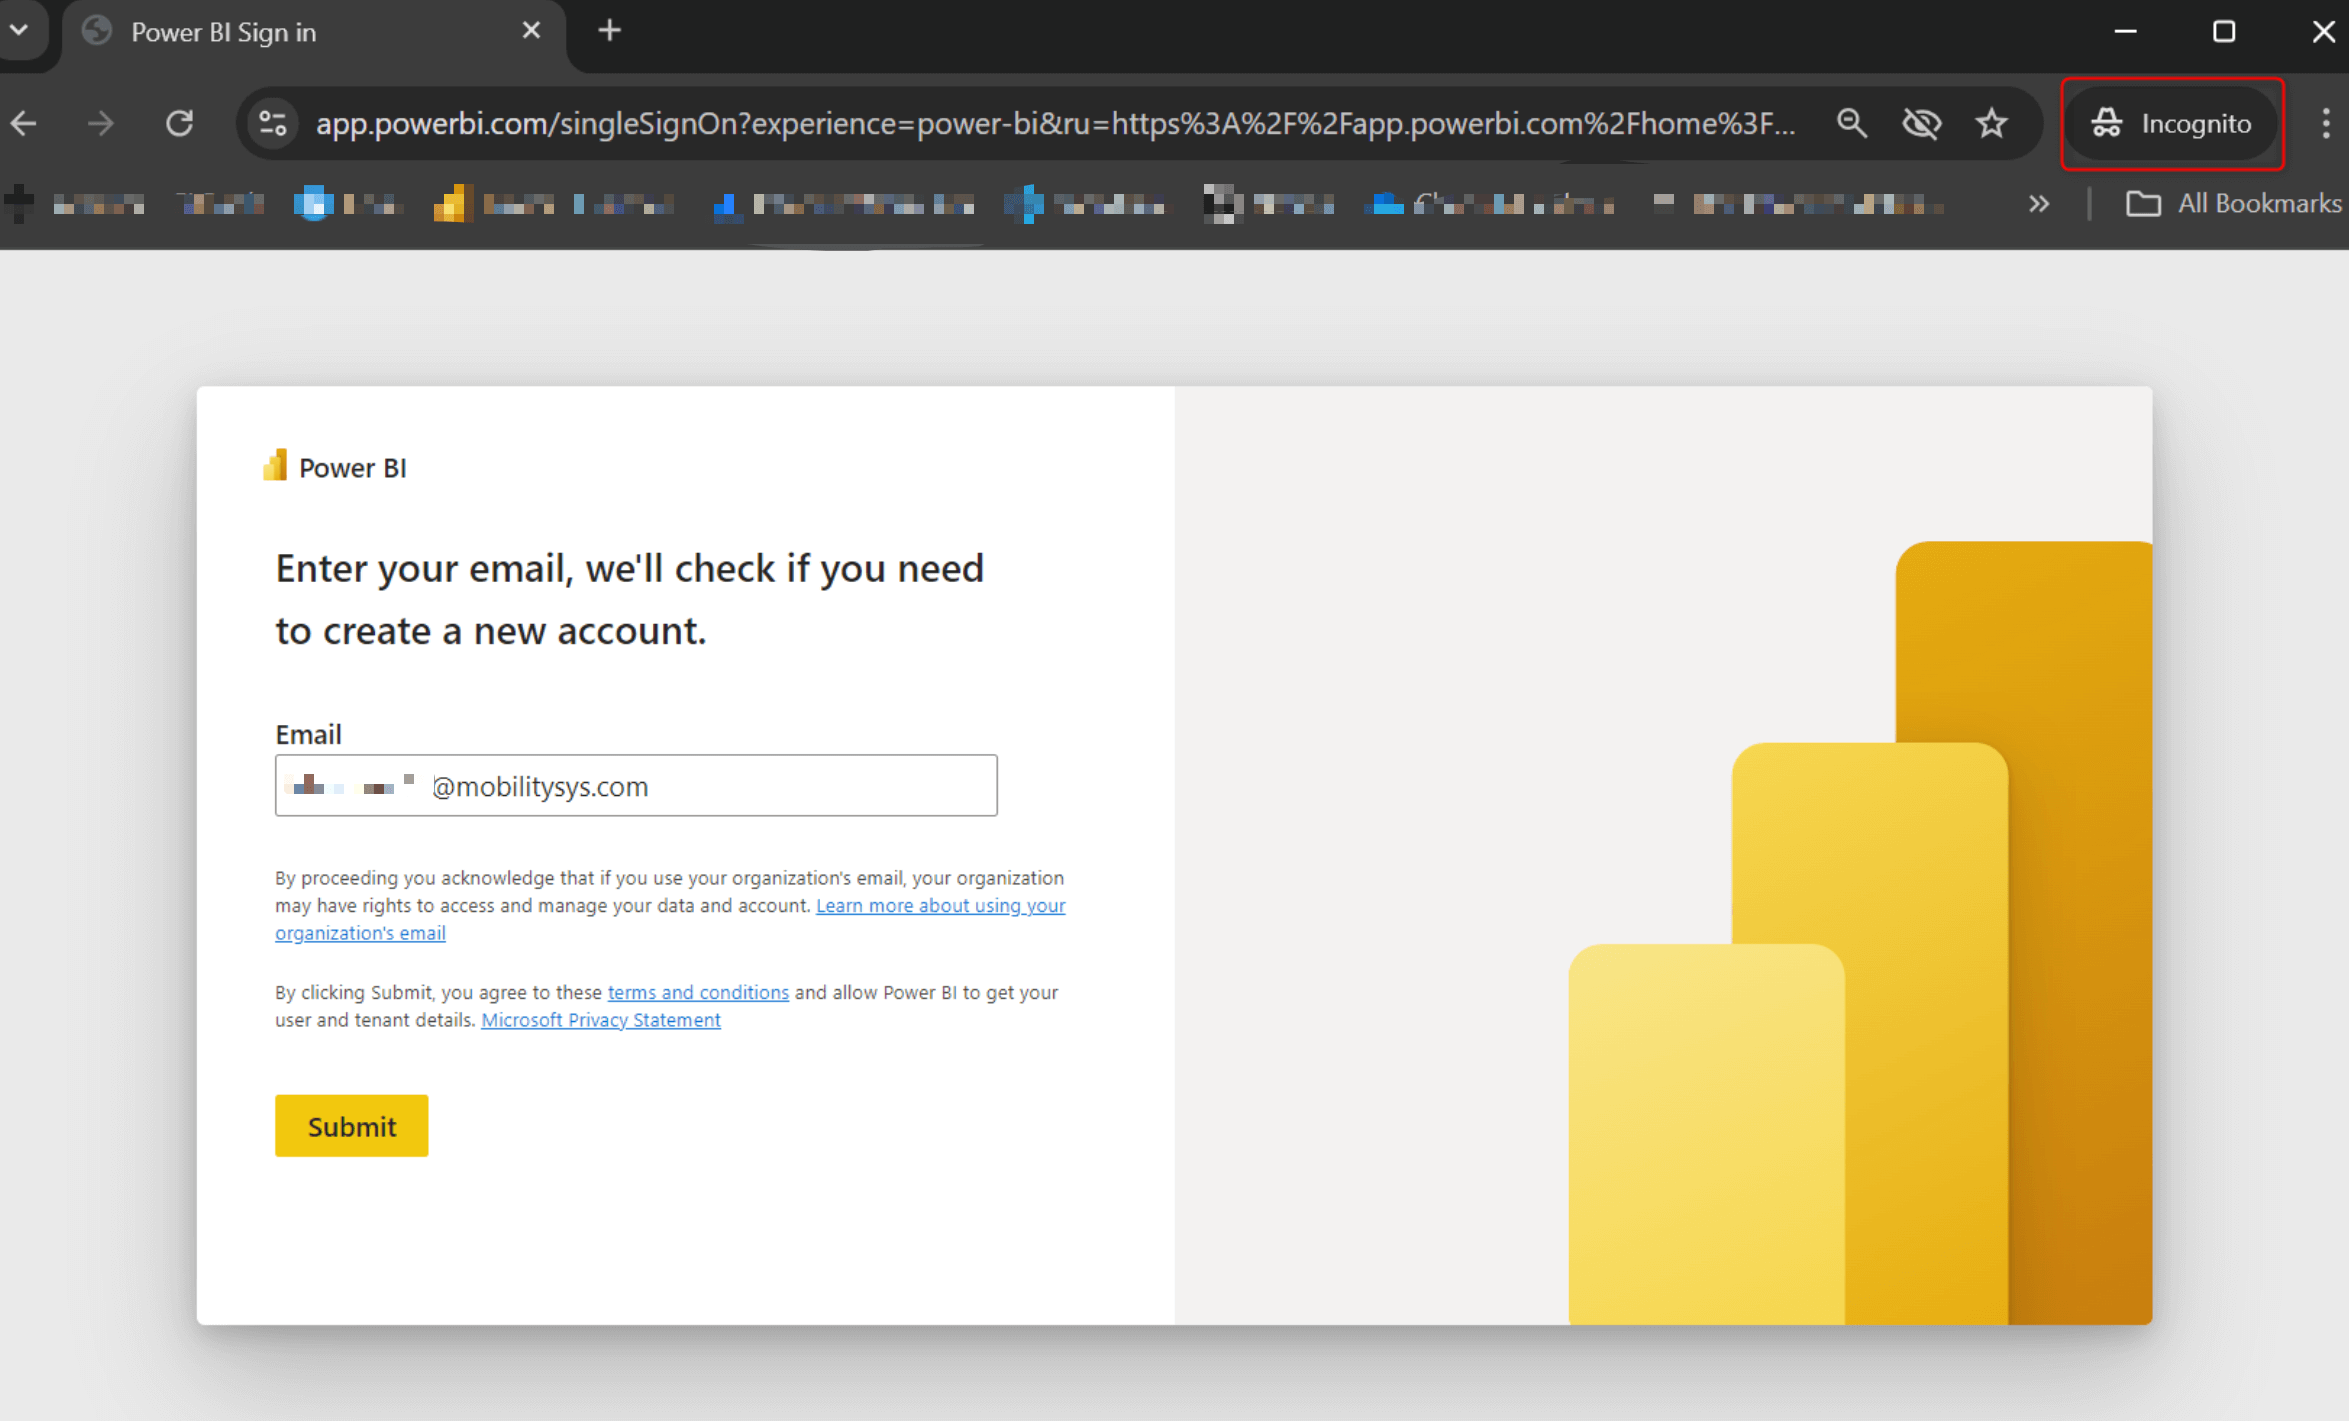
- Open a private session (Incognito mode) in your browser. Ensure you are not logged in with your Power BI/Microsoft O365 credentials. Go to app.powerbi.com.
- Use the mobilitysys.com IDs and passwords to login. The first email ID in the list will have admin access. We recommend that the trial license admin choose this ID and allocate the remaining licenses to their colleagues as needed.
- During your first sign-in attempt, you will be required to reset your password. Choose a strong password.
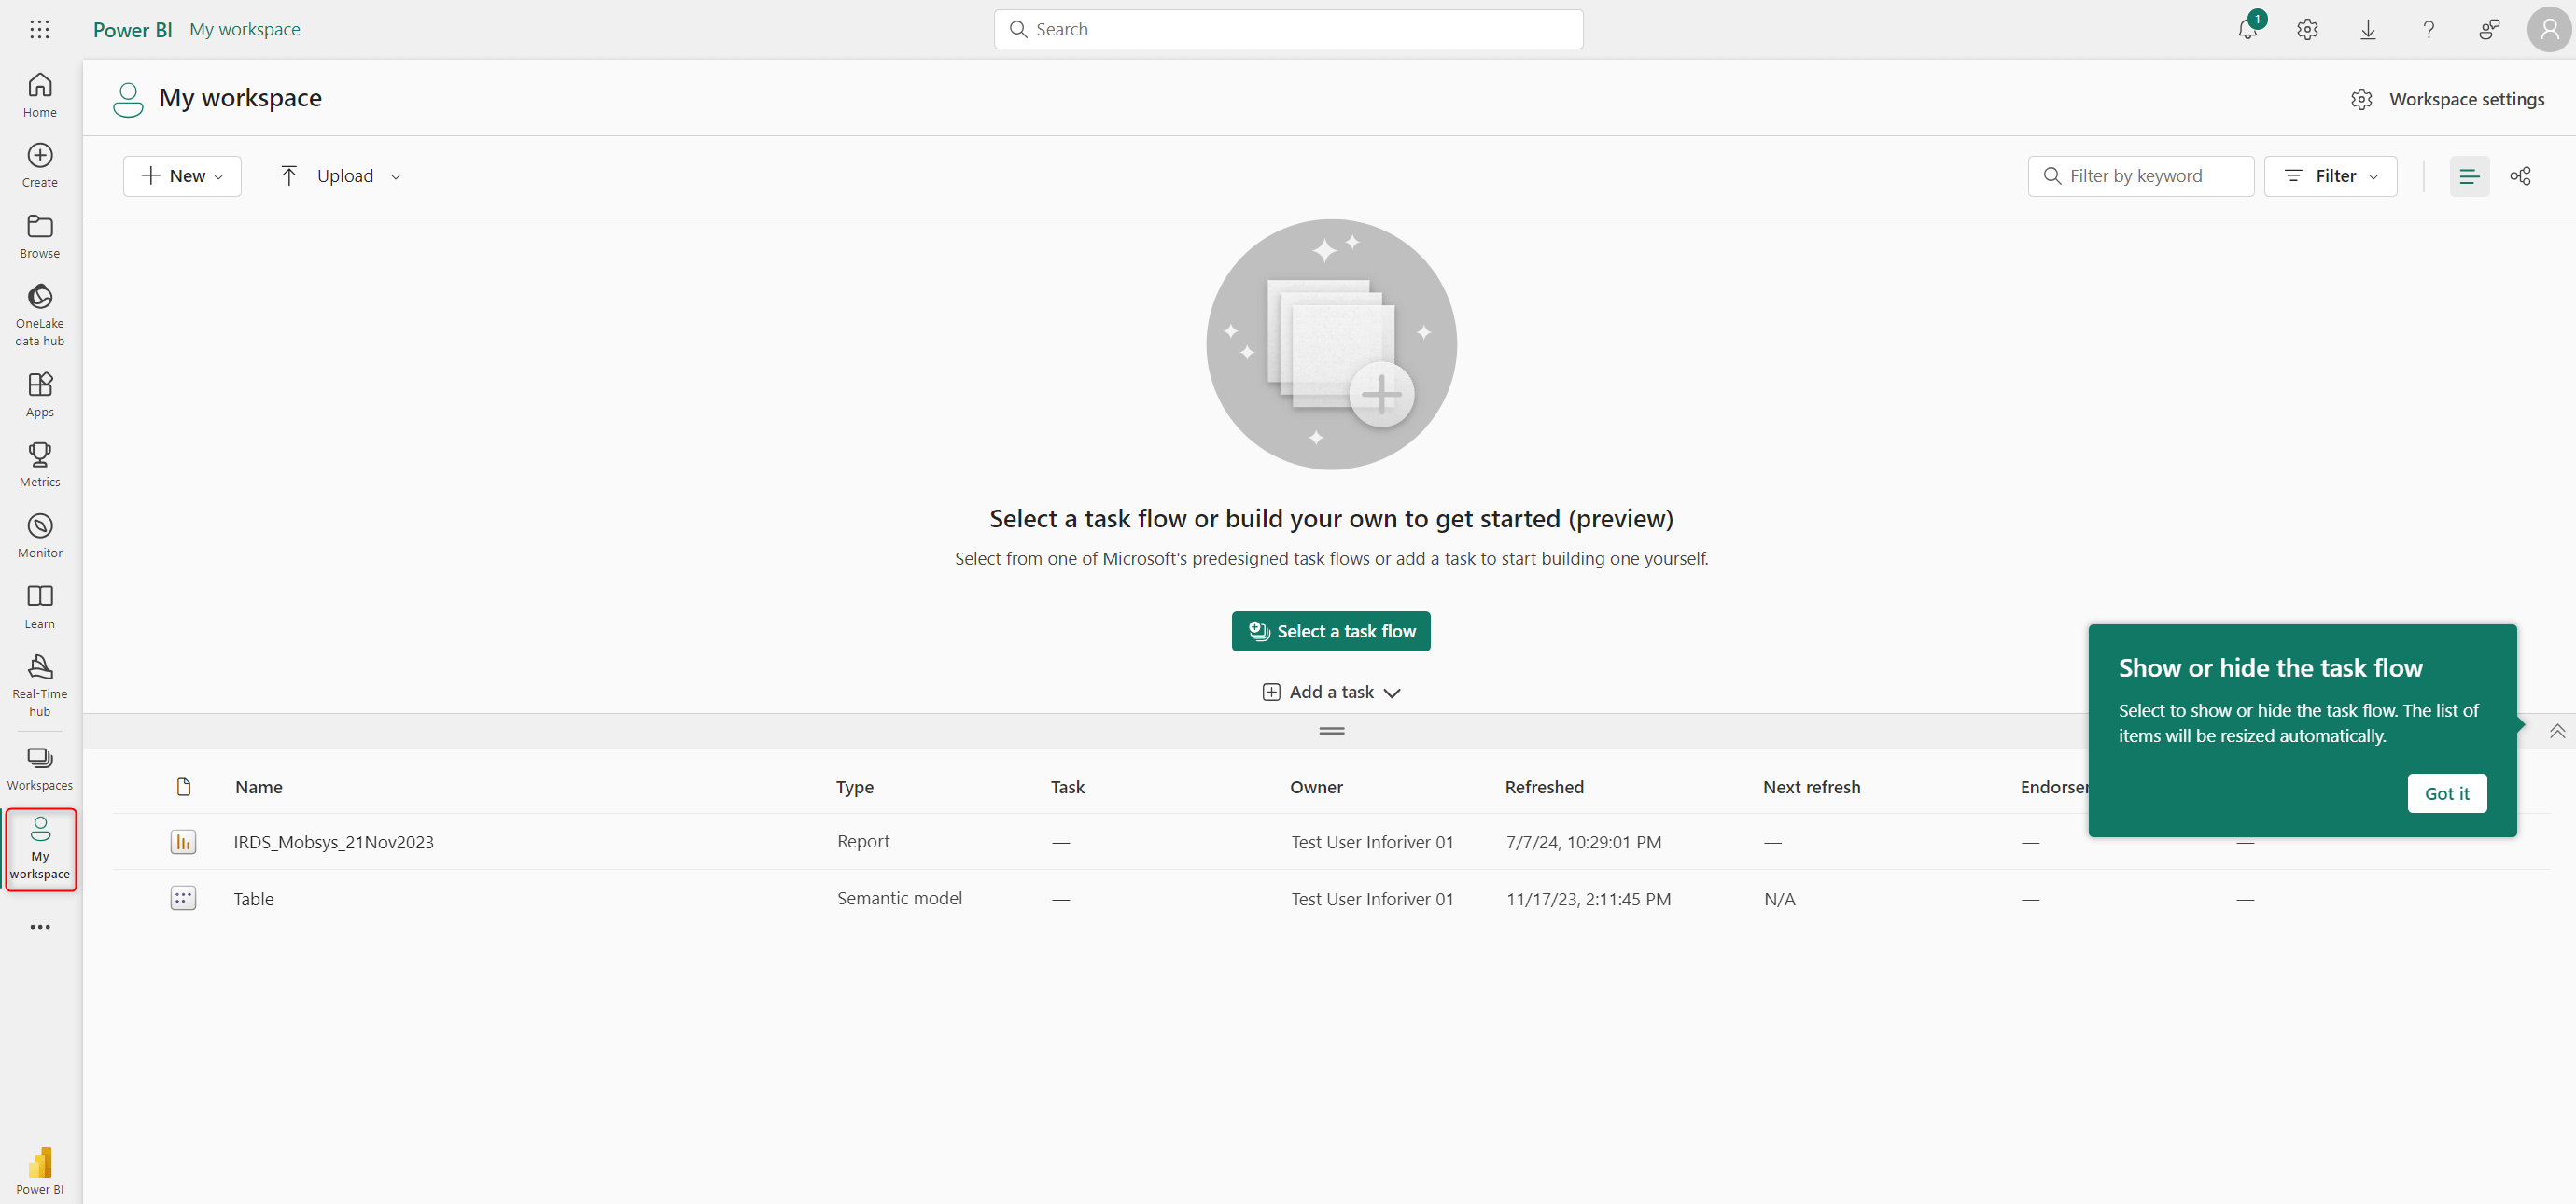
- Click on my workspace in the vertical pane on the left-hand side.
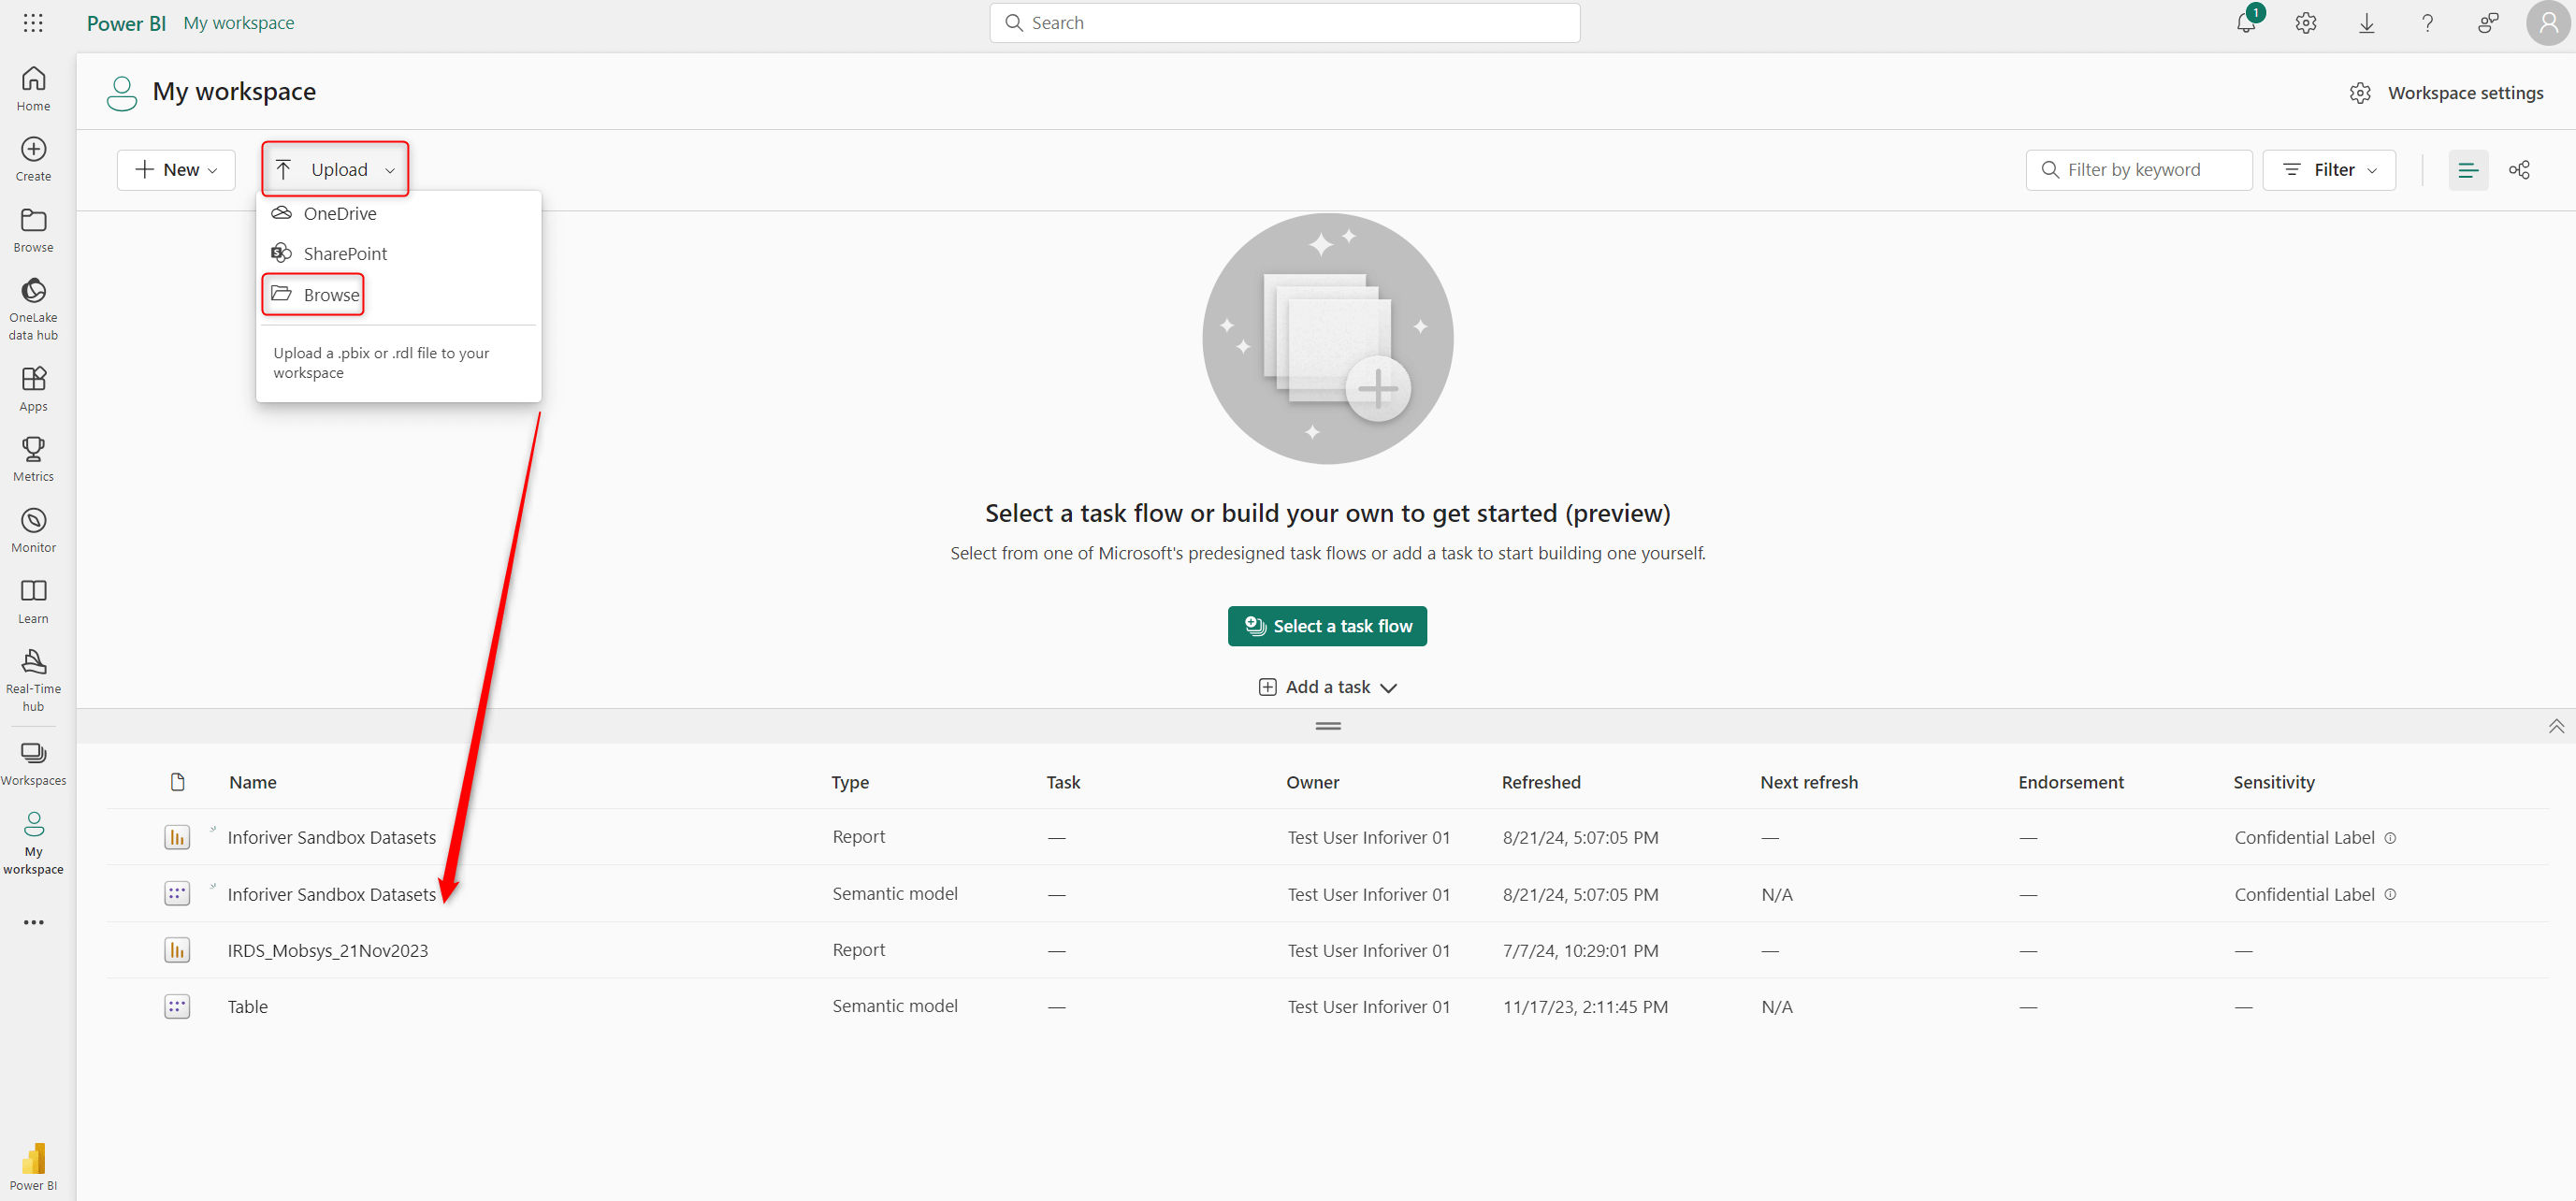
- Click on Upload > Browse and upload the sample PBIX dataset provided below.
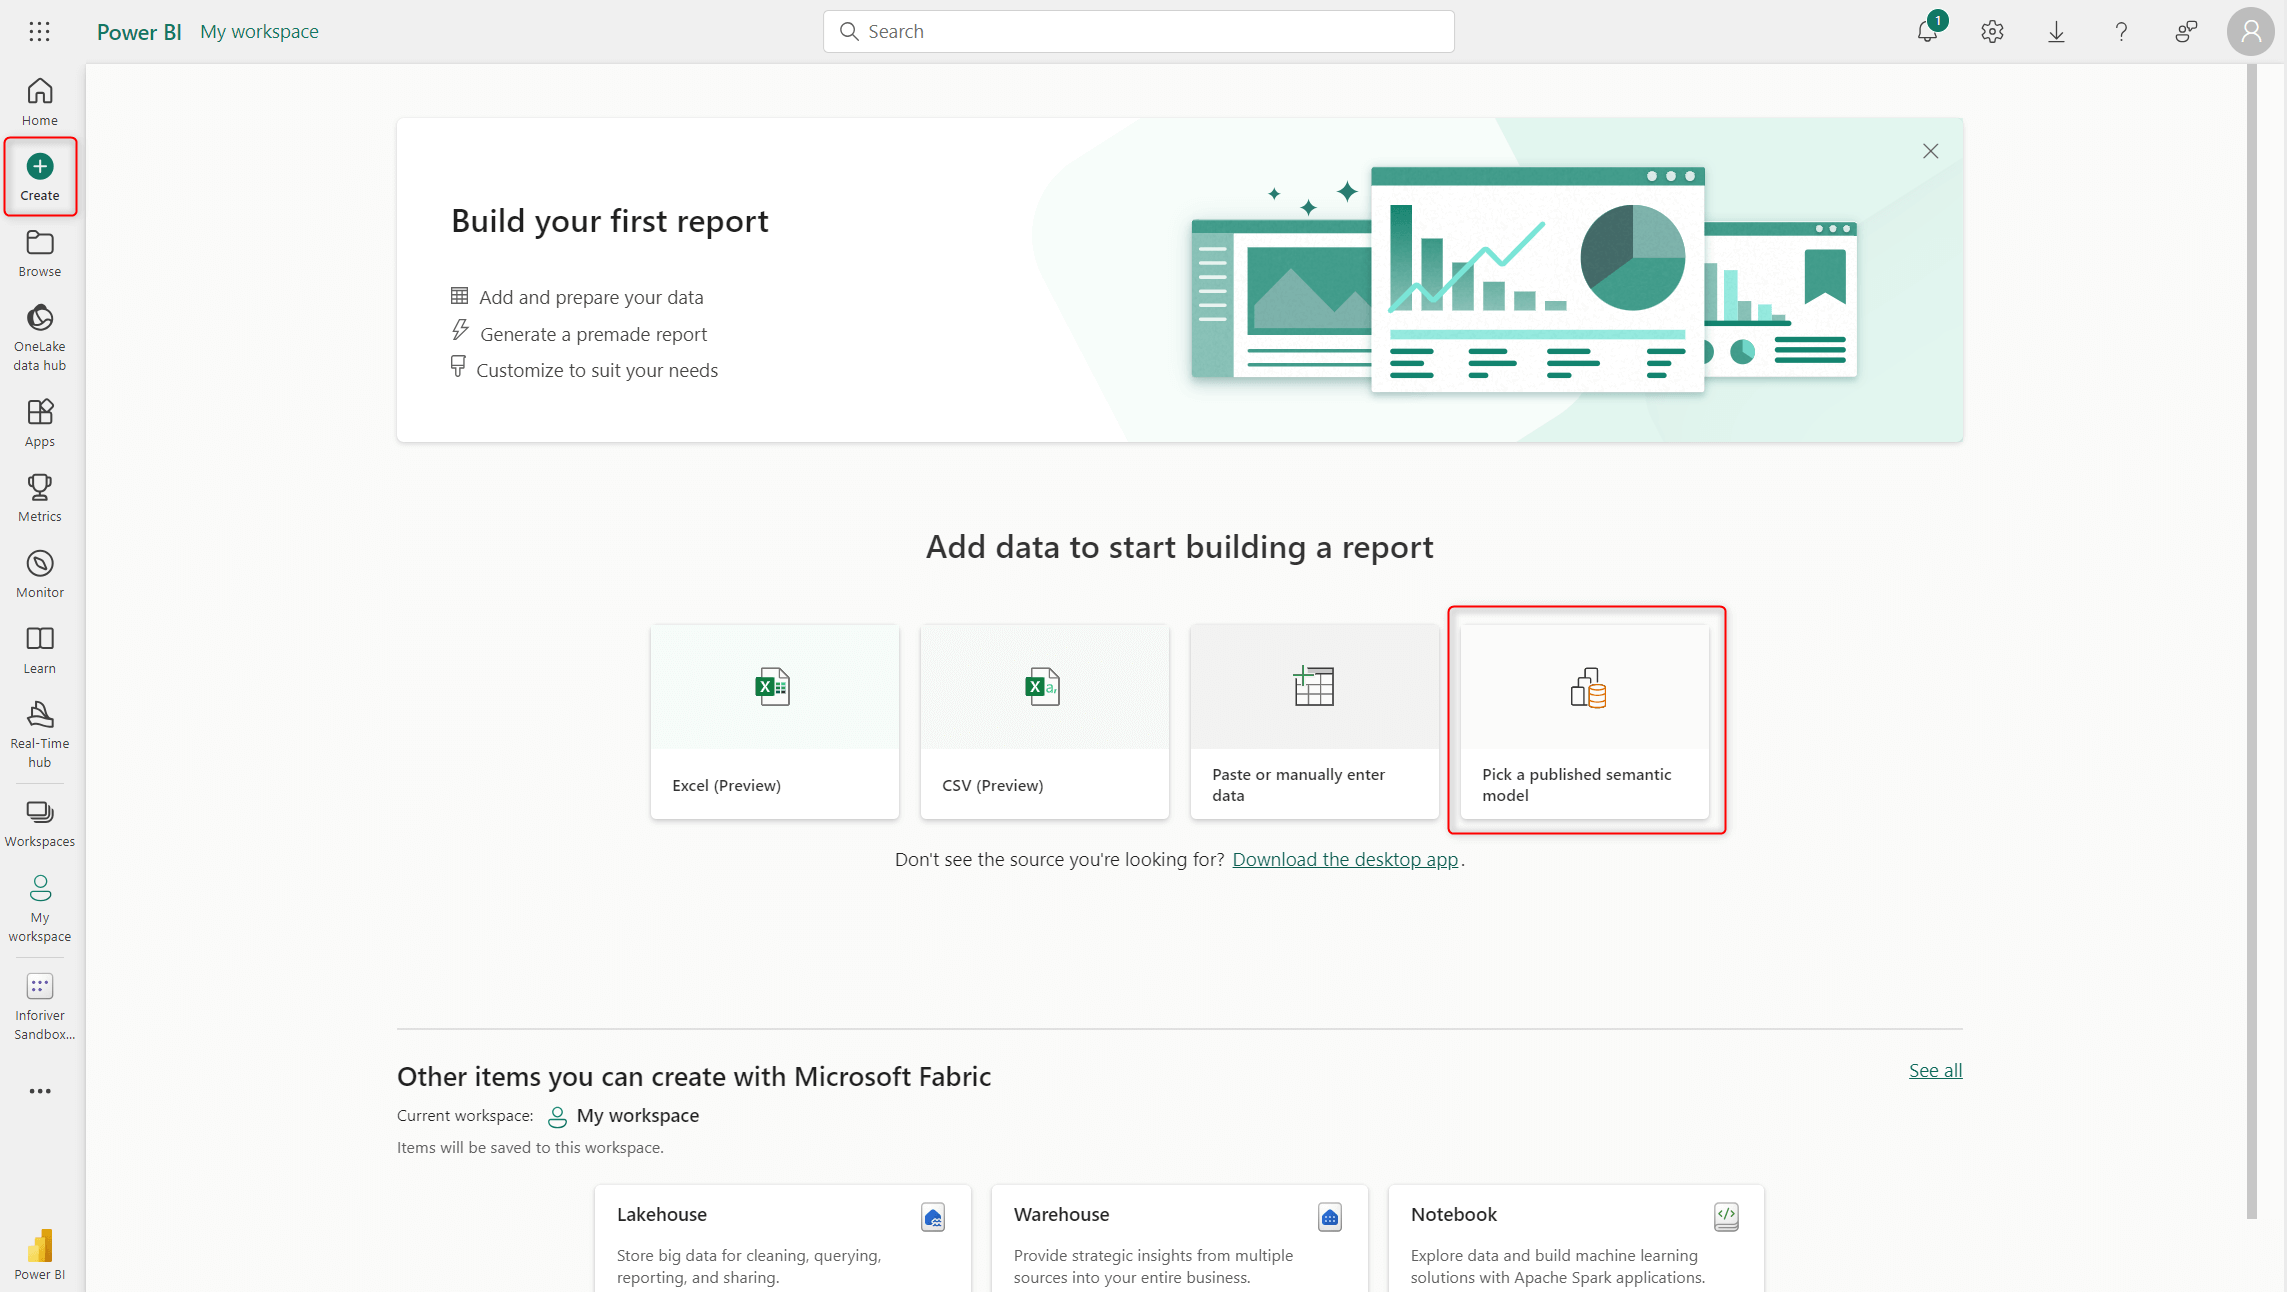
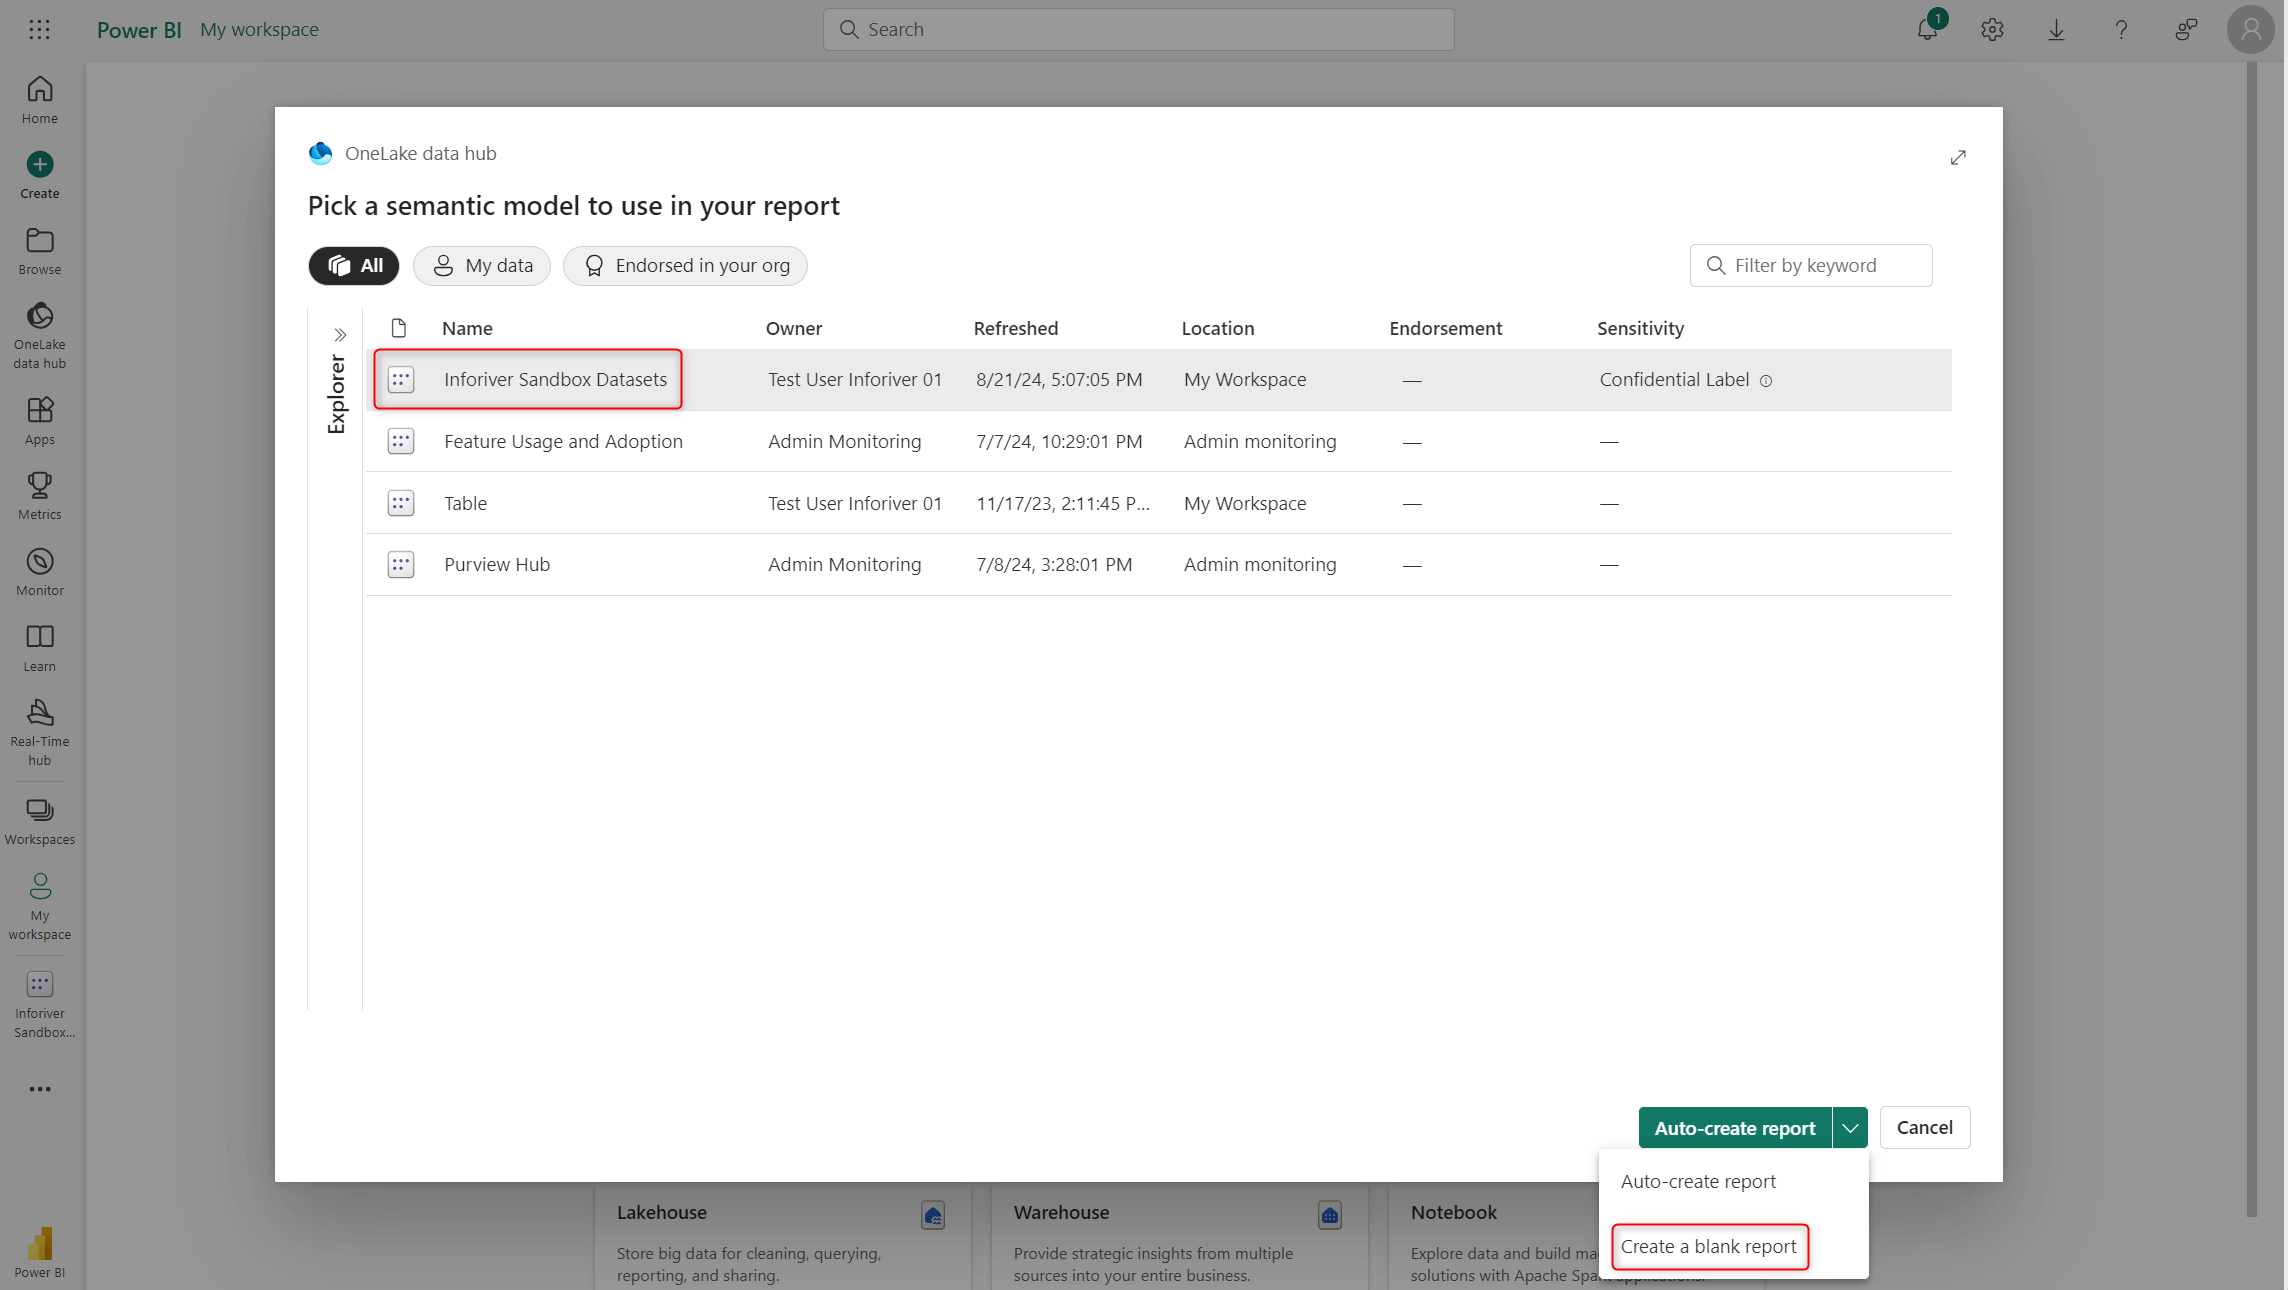
- Click Create. Select the Pick a published semantic model option.
- Select the Inforiver Sandbox dataset and choose the Create a blank report option.
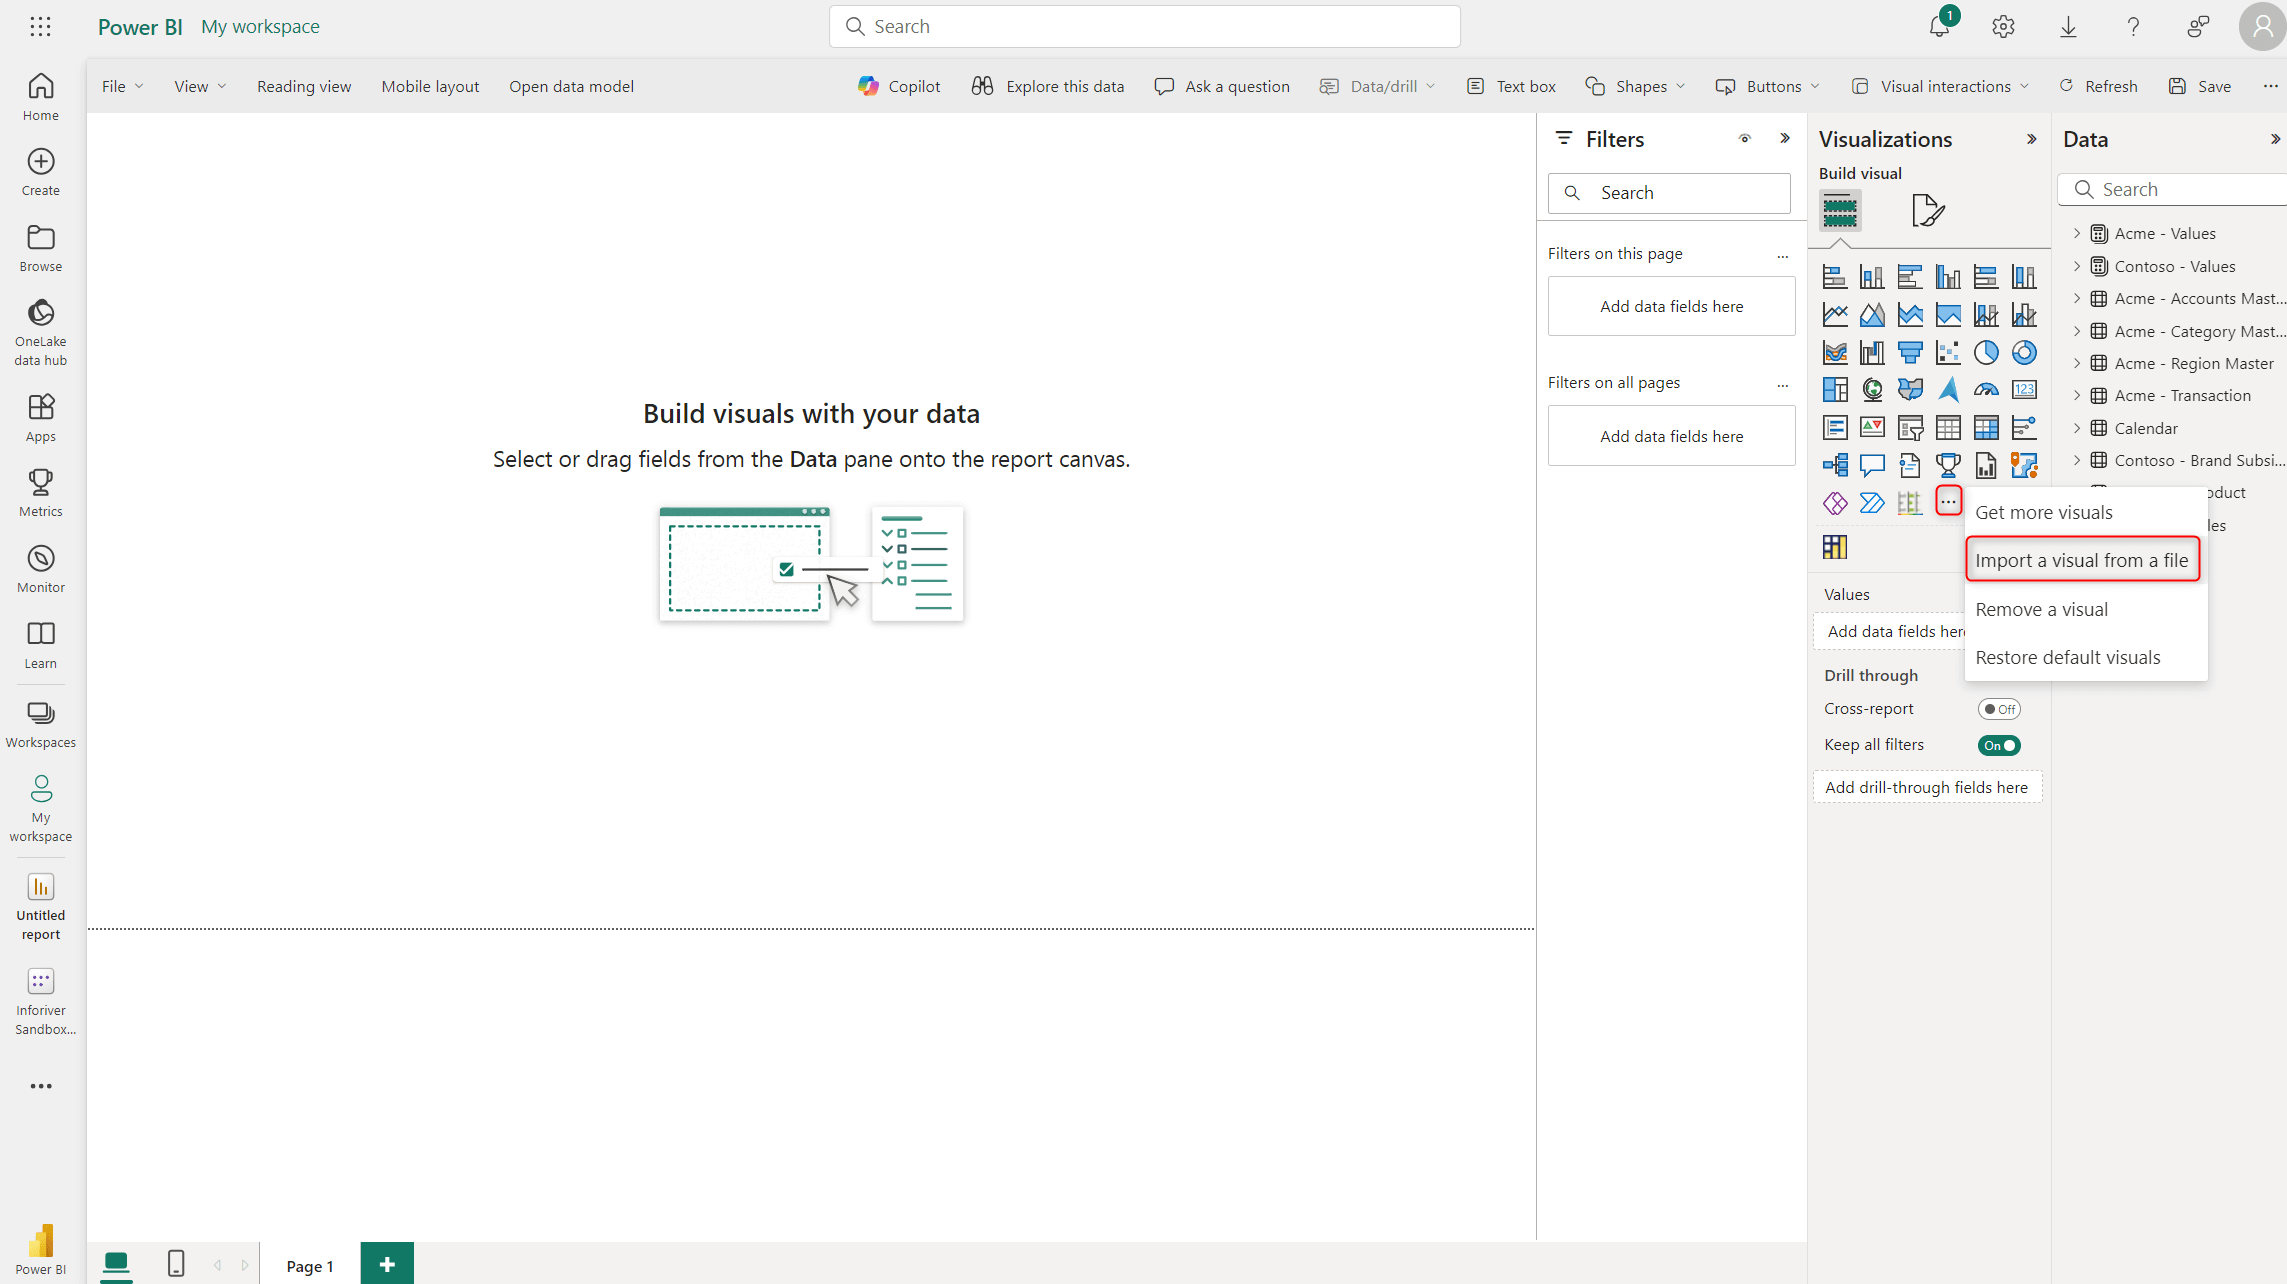
- You would have received a pbviz file from Inforiver via email. Use the Import a visual from a file option to import the Inforiver visual into Power BI.
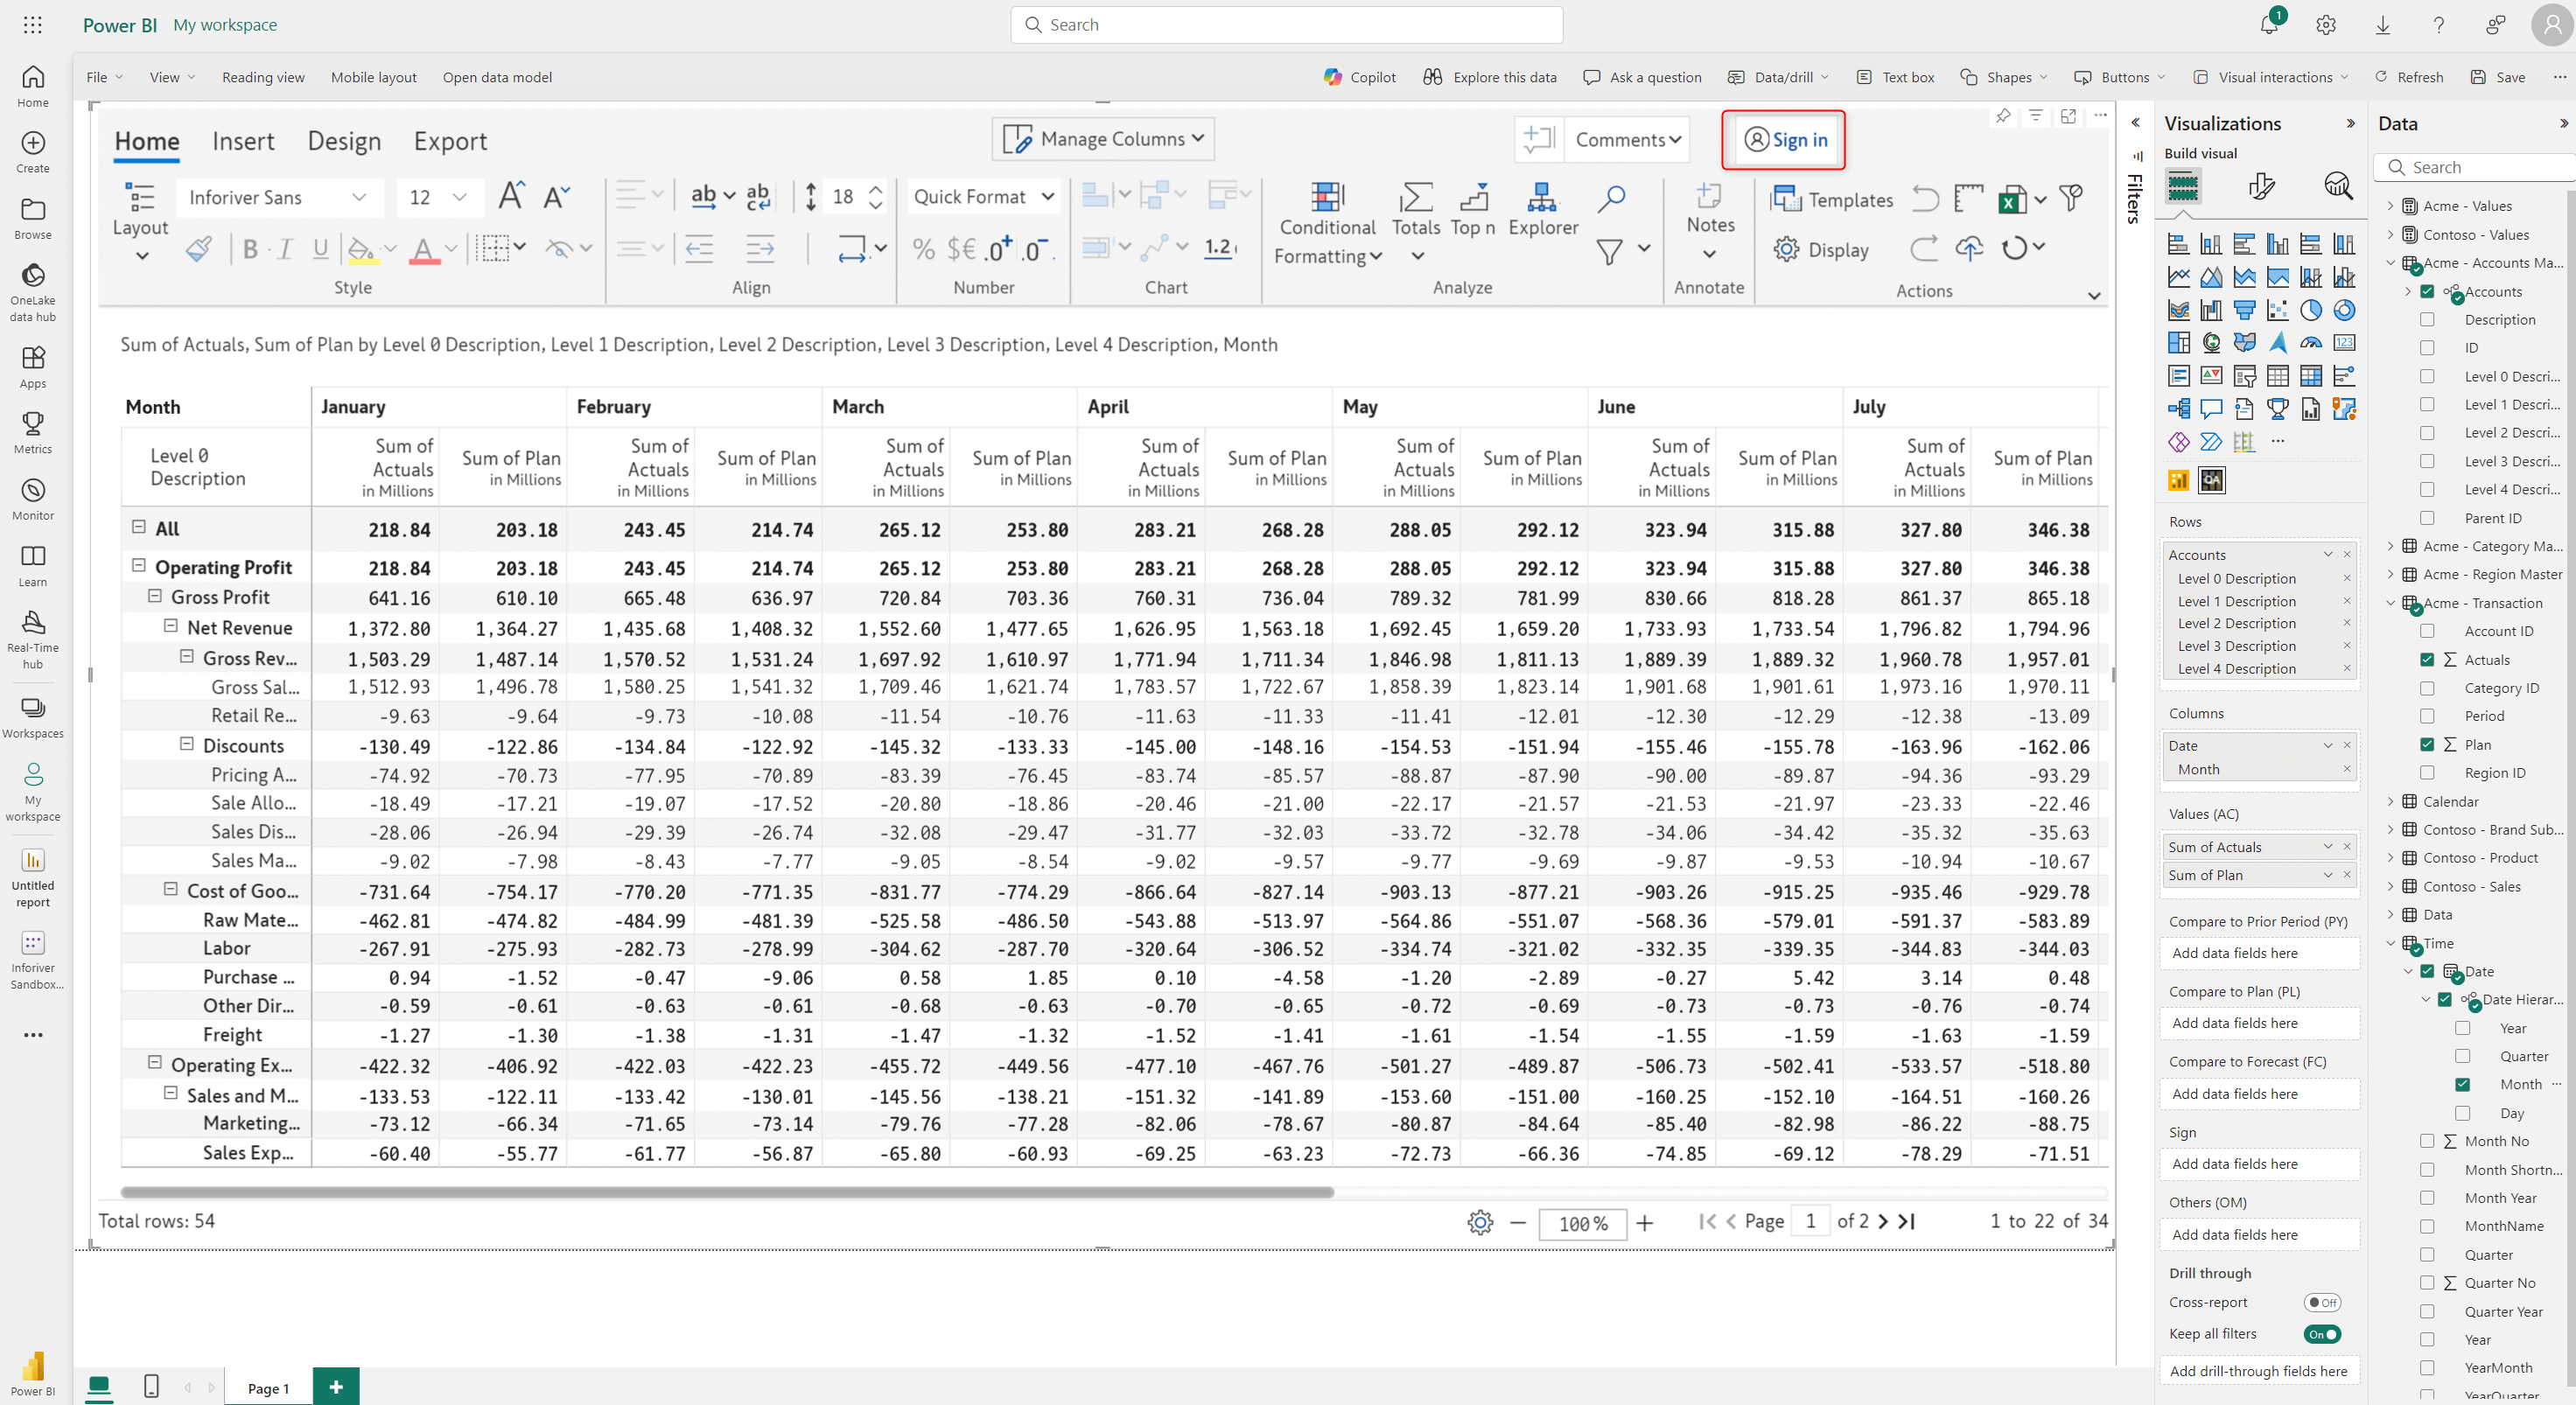
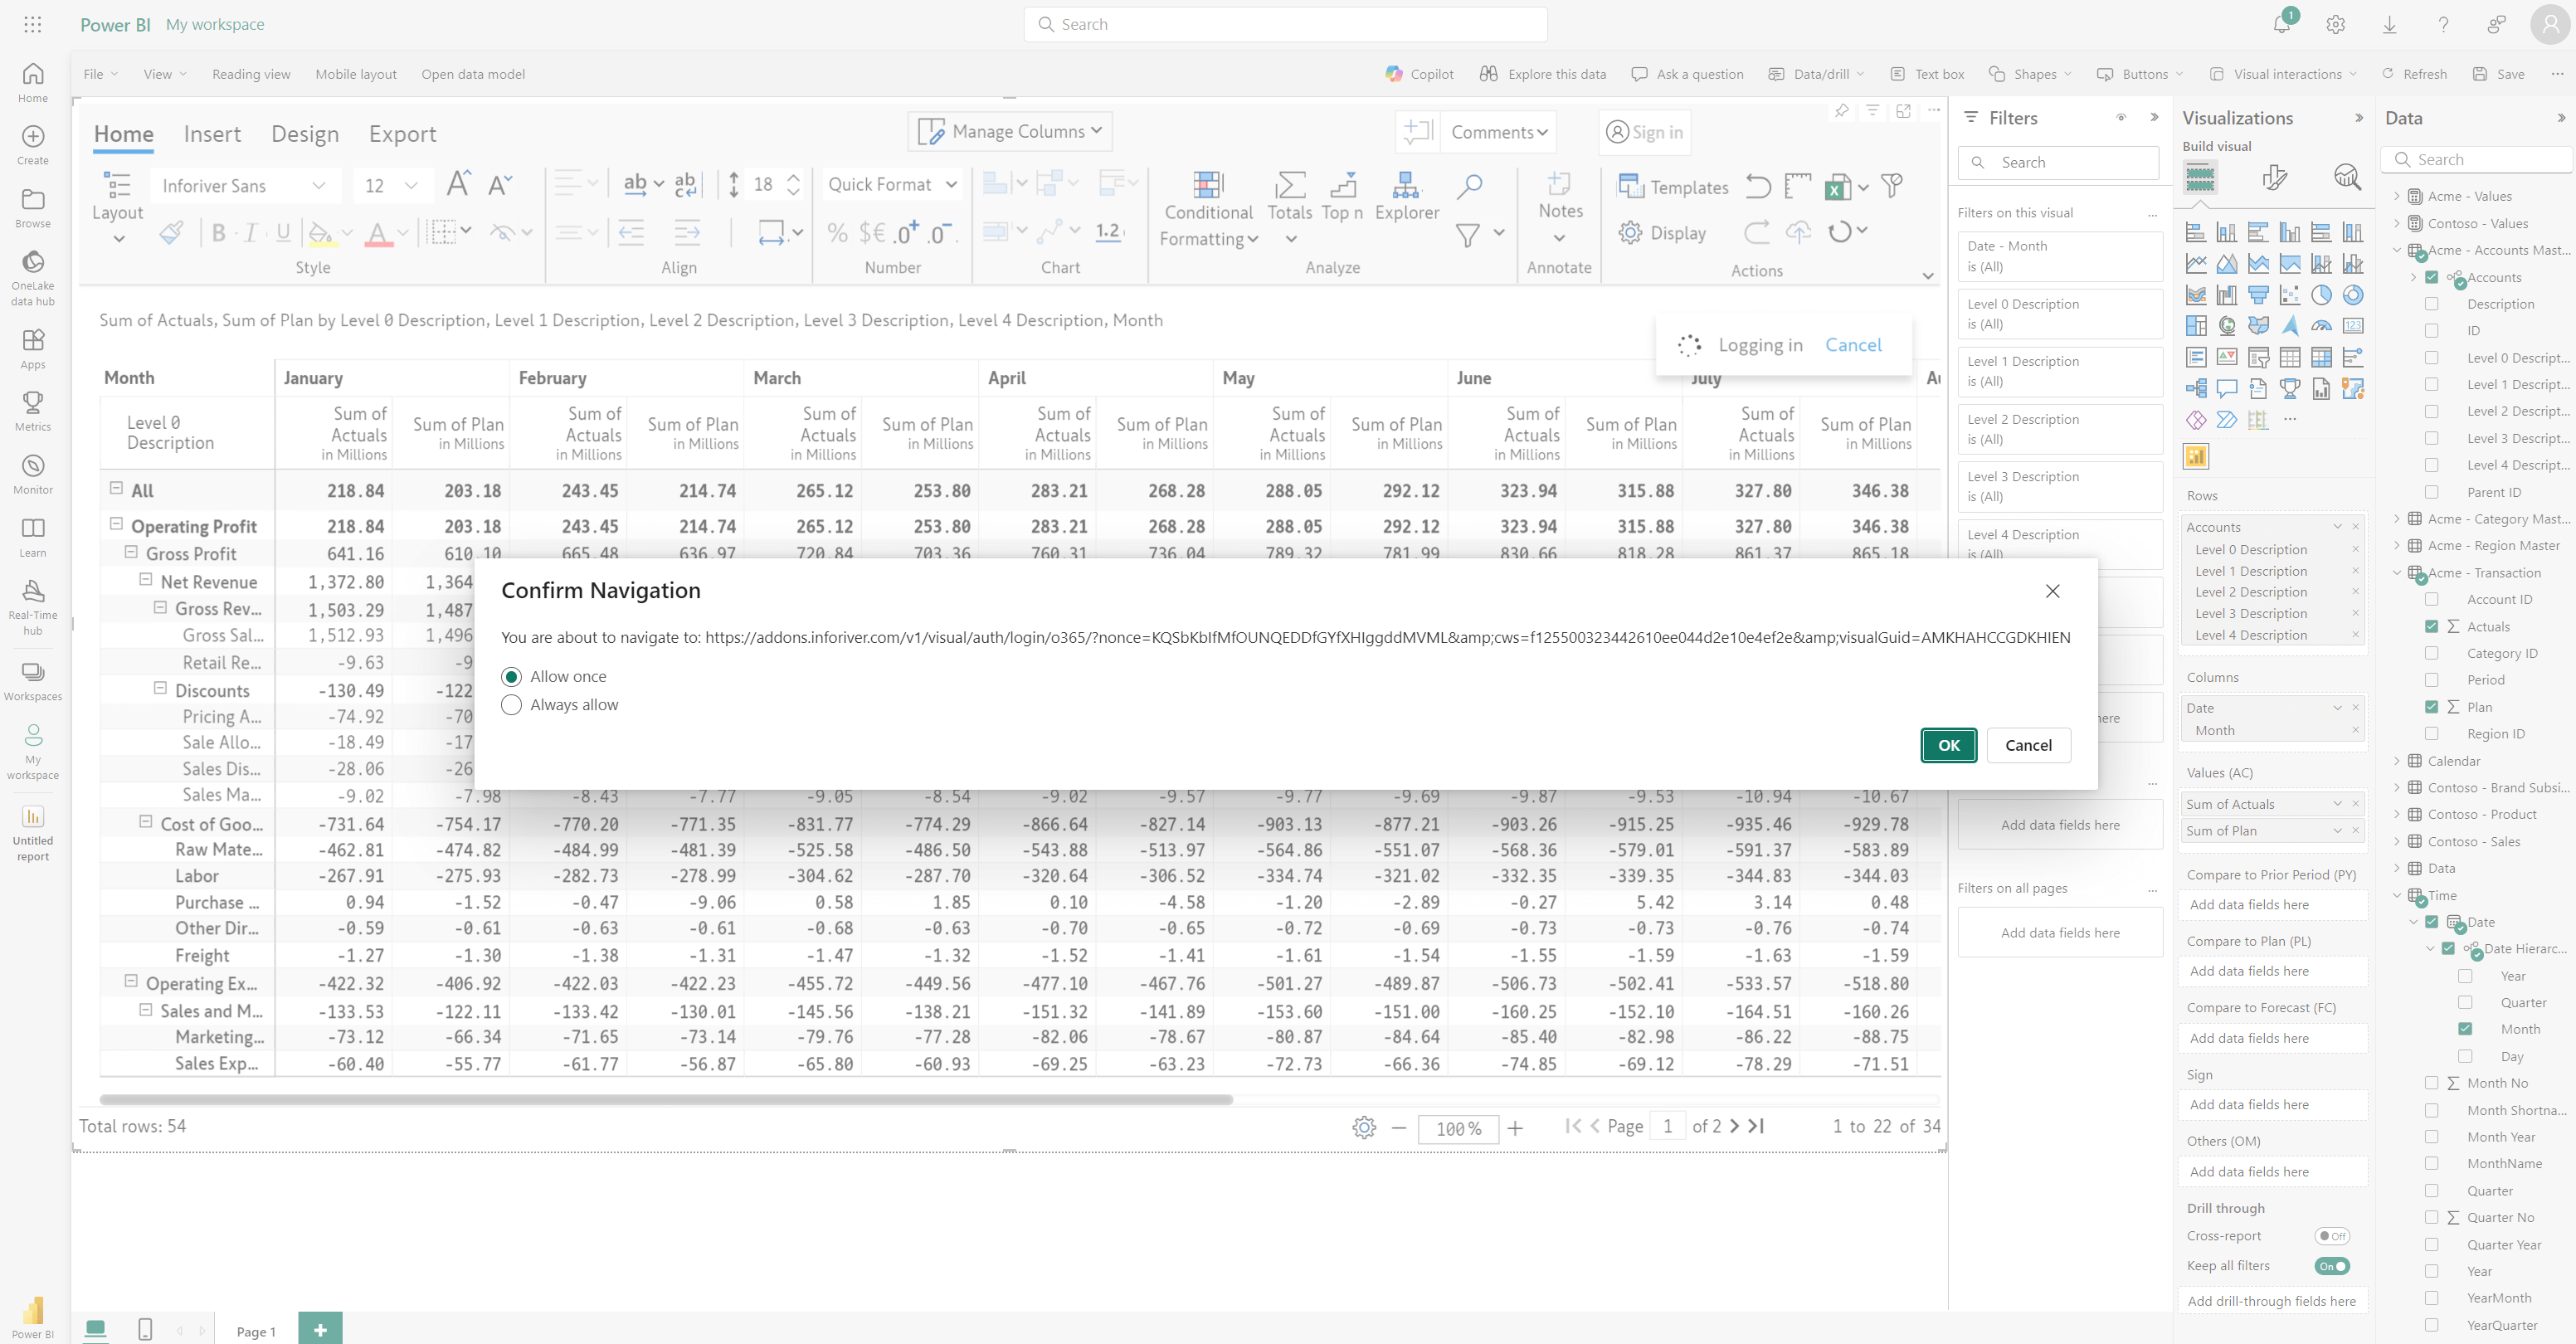
- Add the visual to the canvas. Assign dimensions and measures to the Rows/Columns/Values parameters to build a report. Click Sign In.
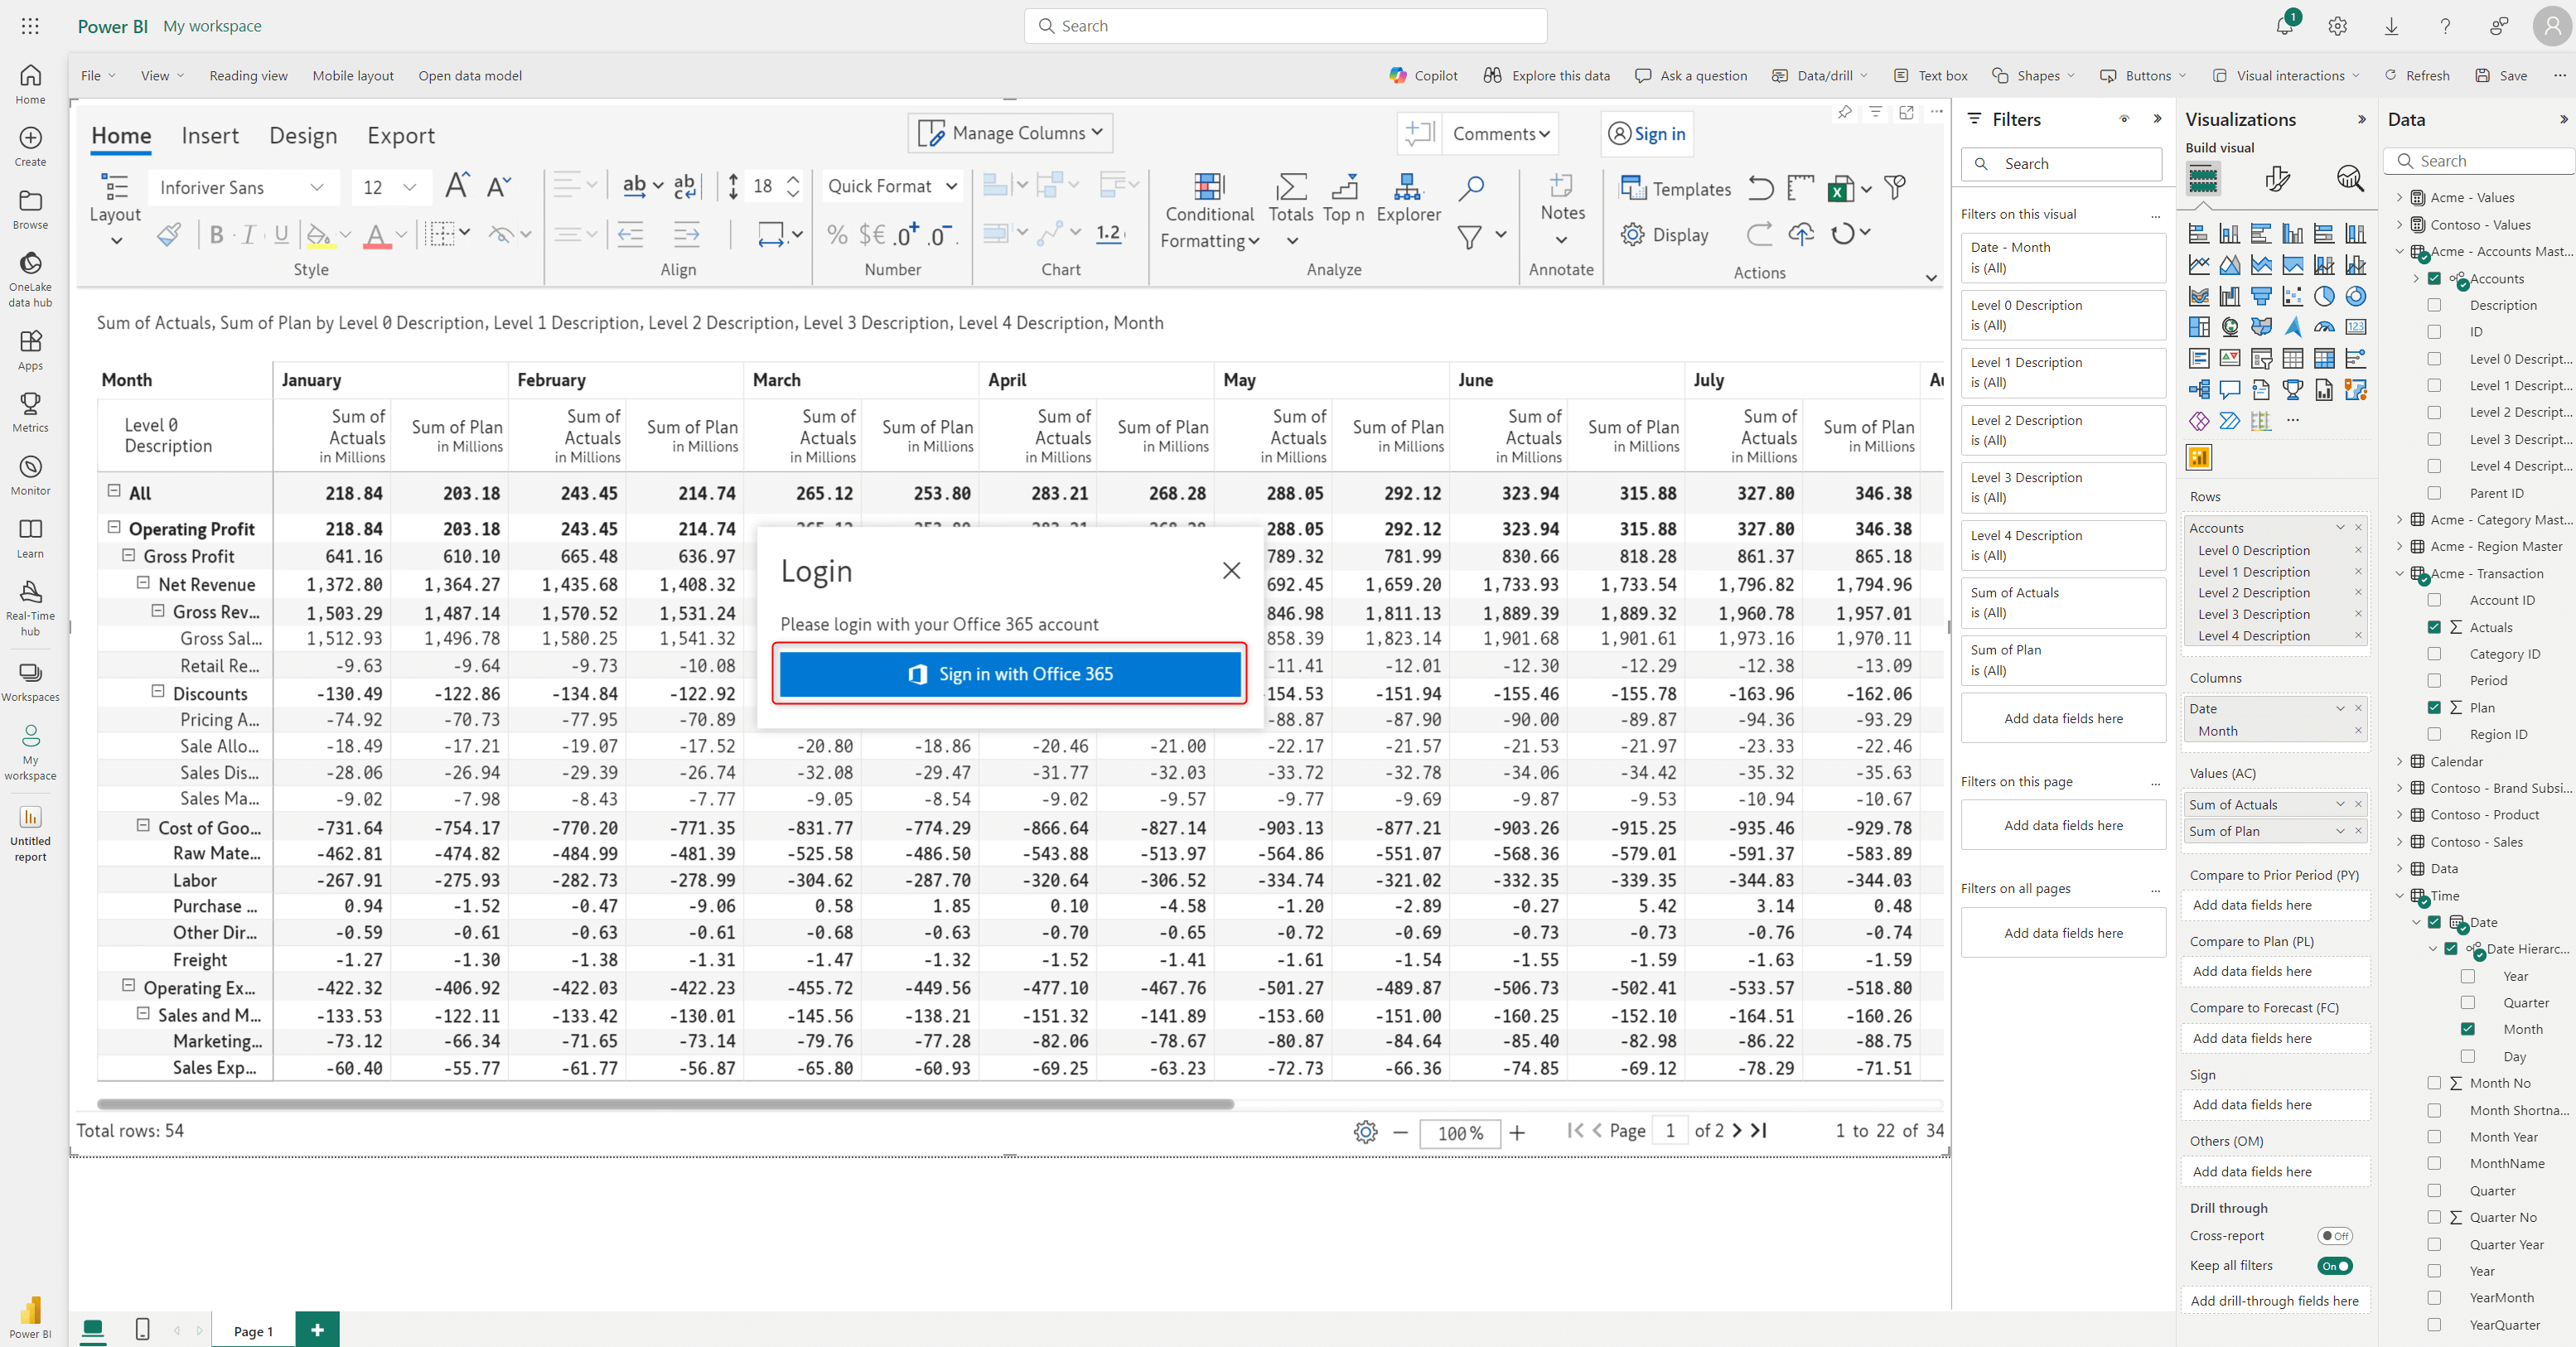
Note: When you click the Sign in button, you will get a pop-up that says Sign in with Office 365, you can click the blue sign in button.
- Select one of the radio buttons and click OK.
You will be re-directed to a login page, which will automatically close in a few seconds and bring you back to the Power BI page.
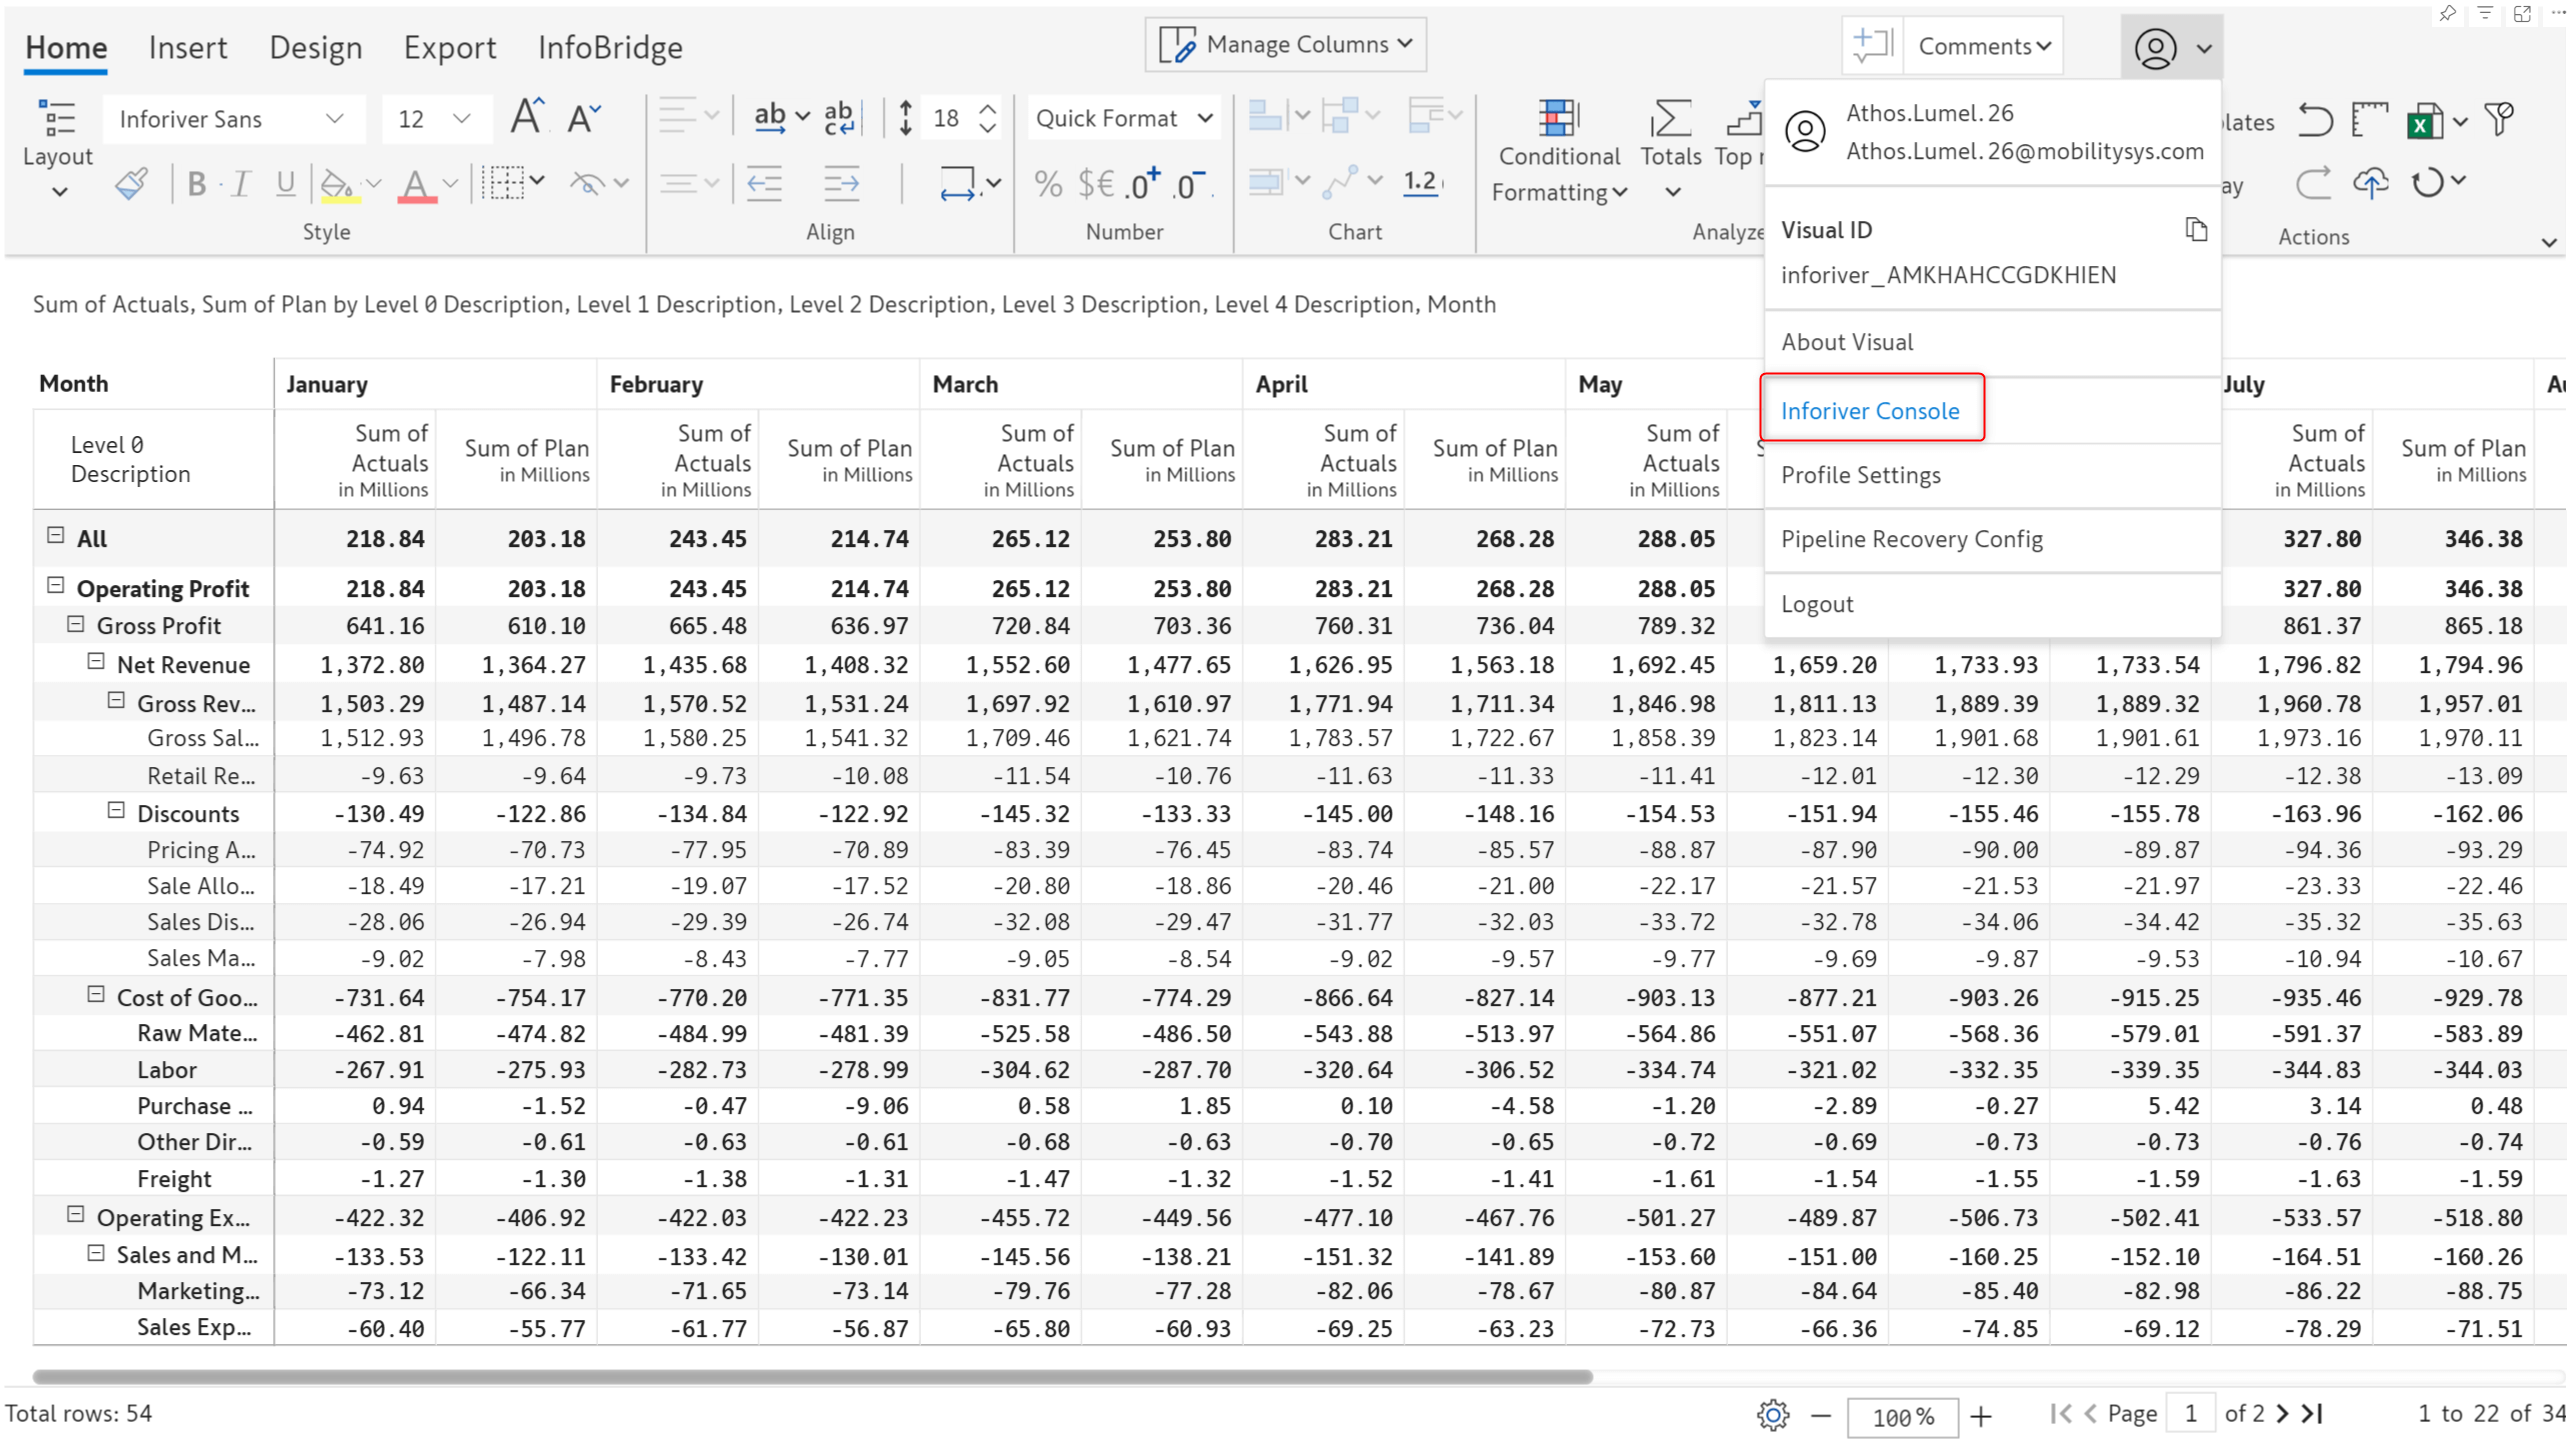
- After signing in, click the downward arrow icon and navigate to the Inforiver Console.
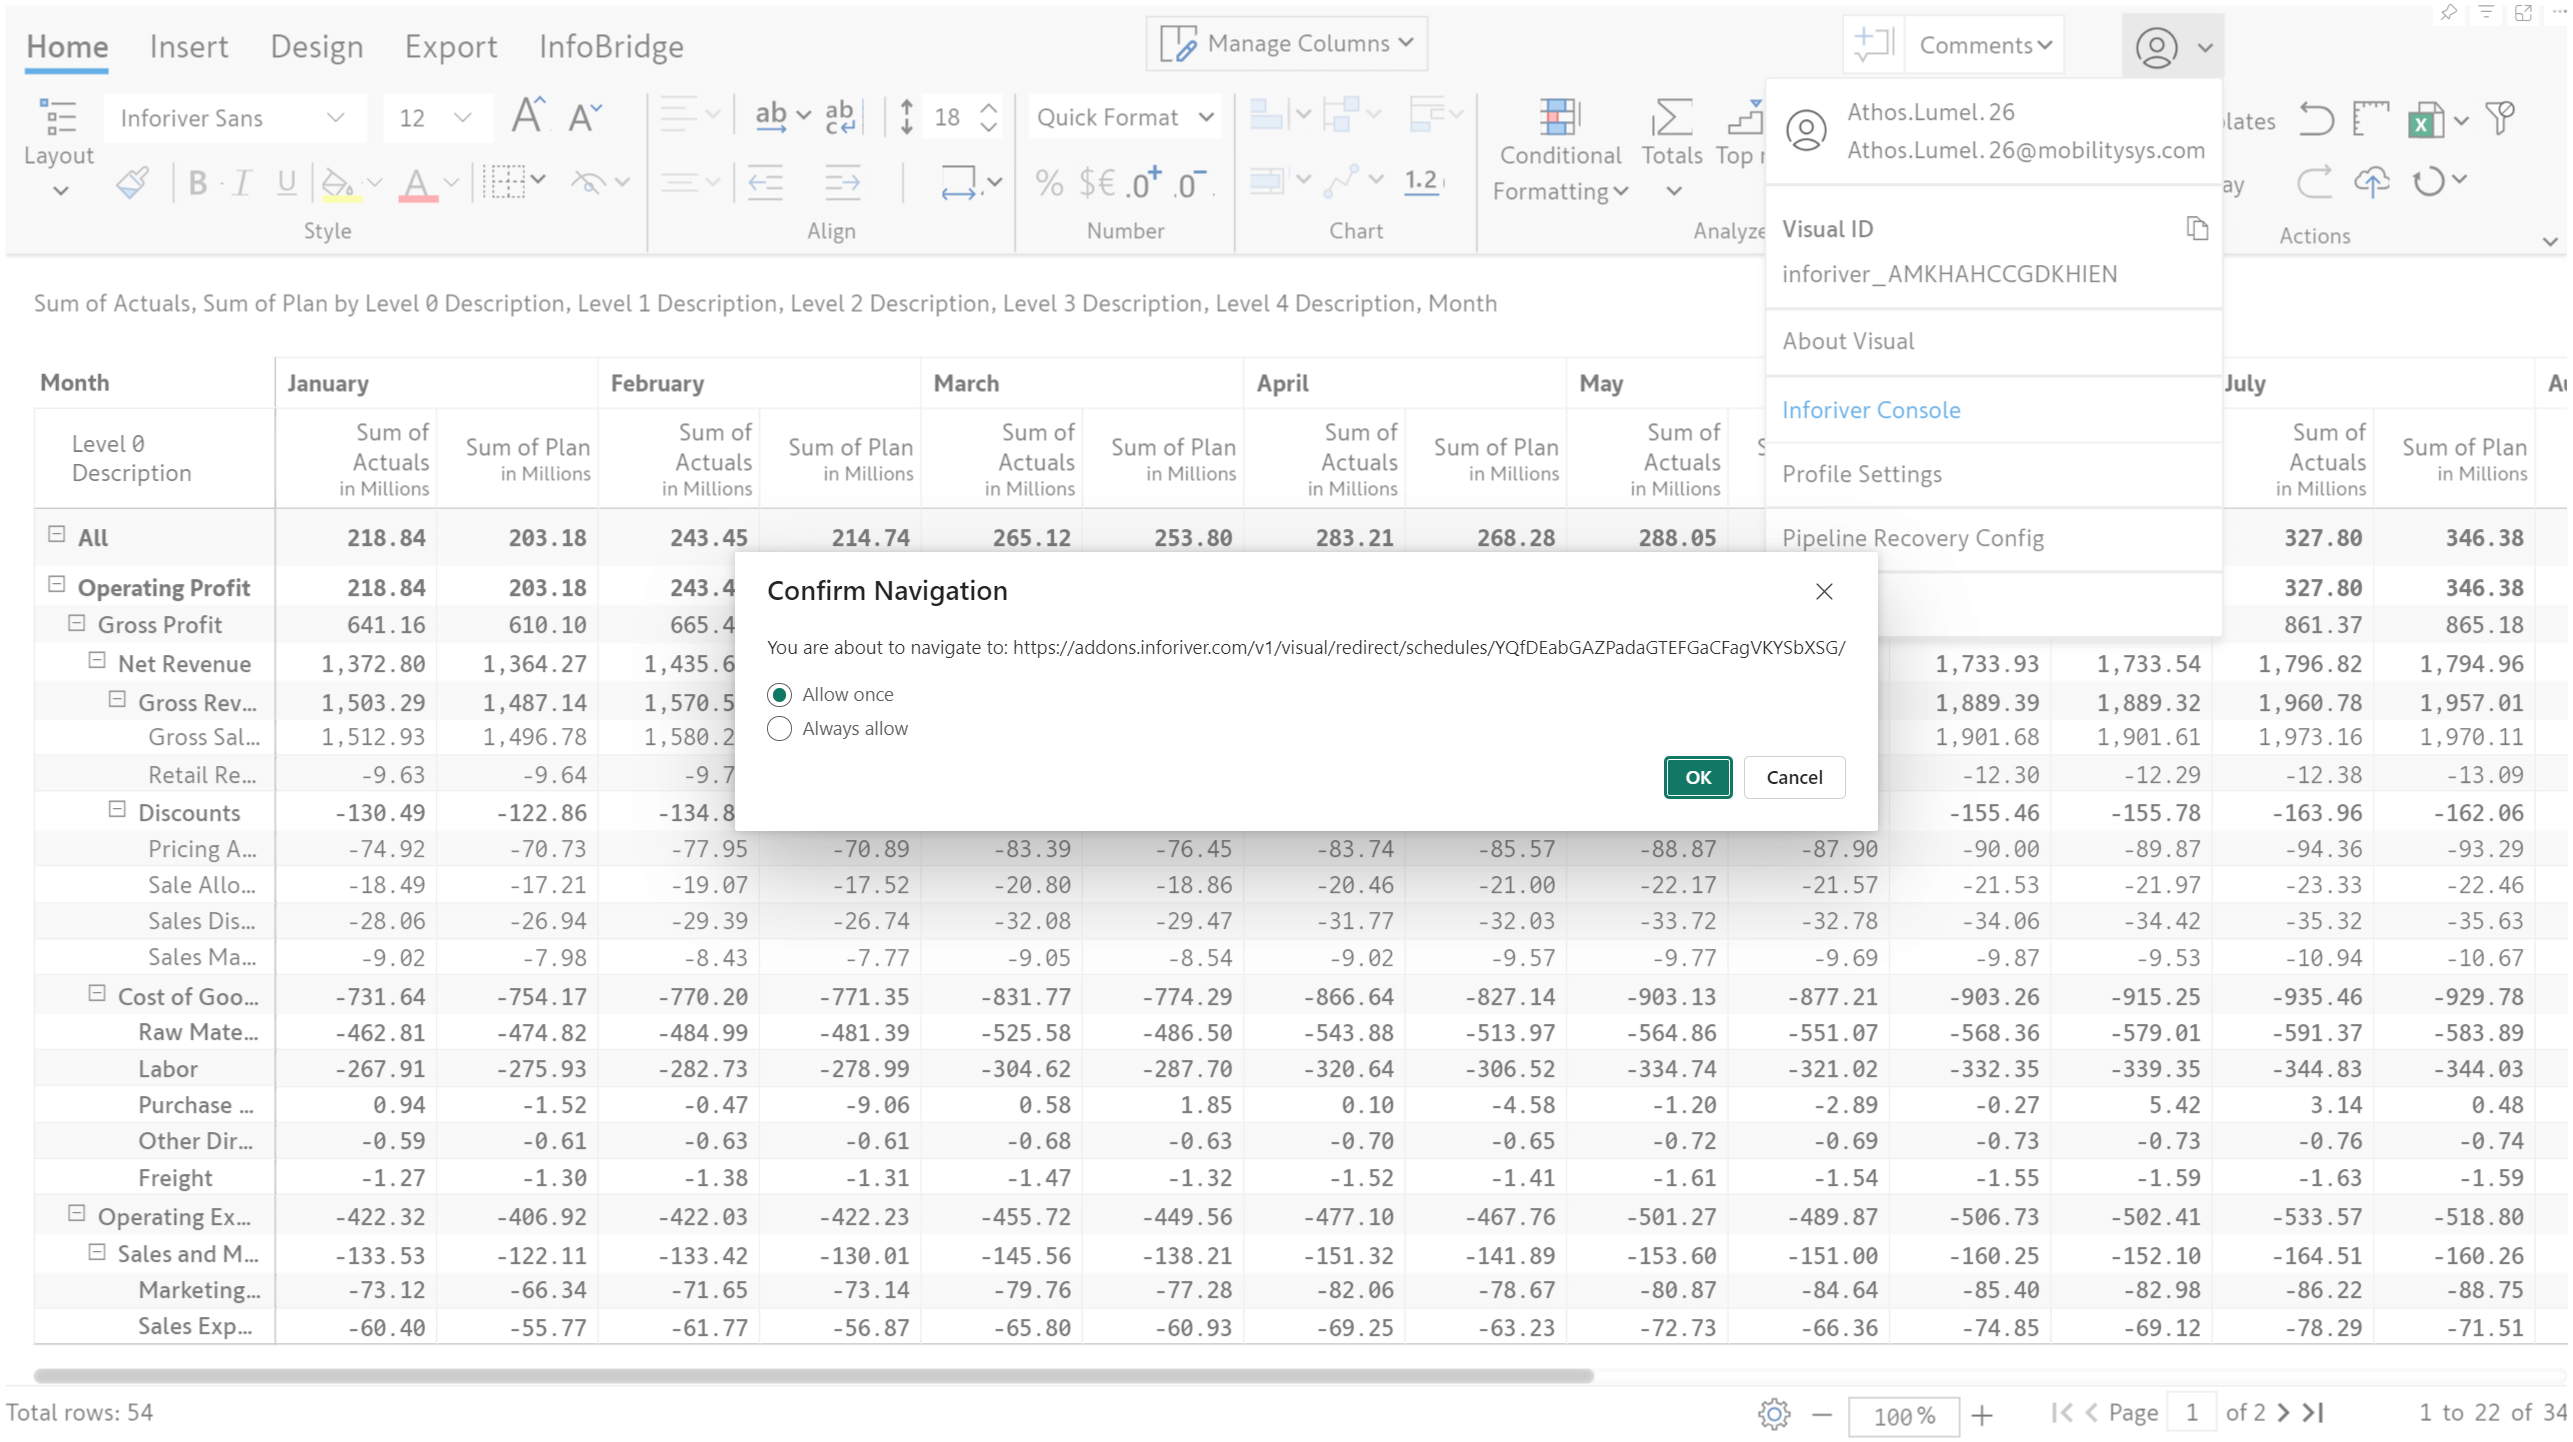
- Select either one of the radio buttons and click OK.
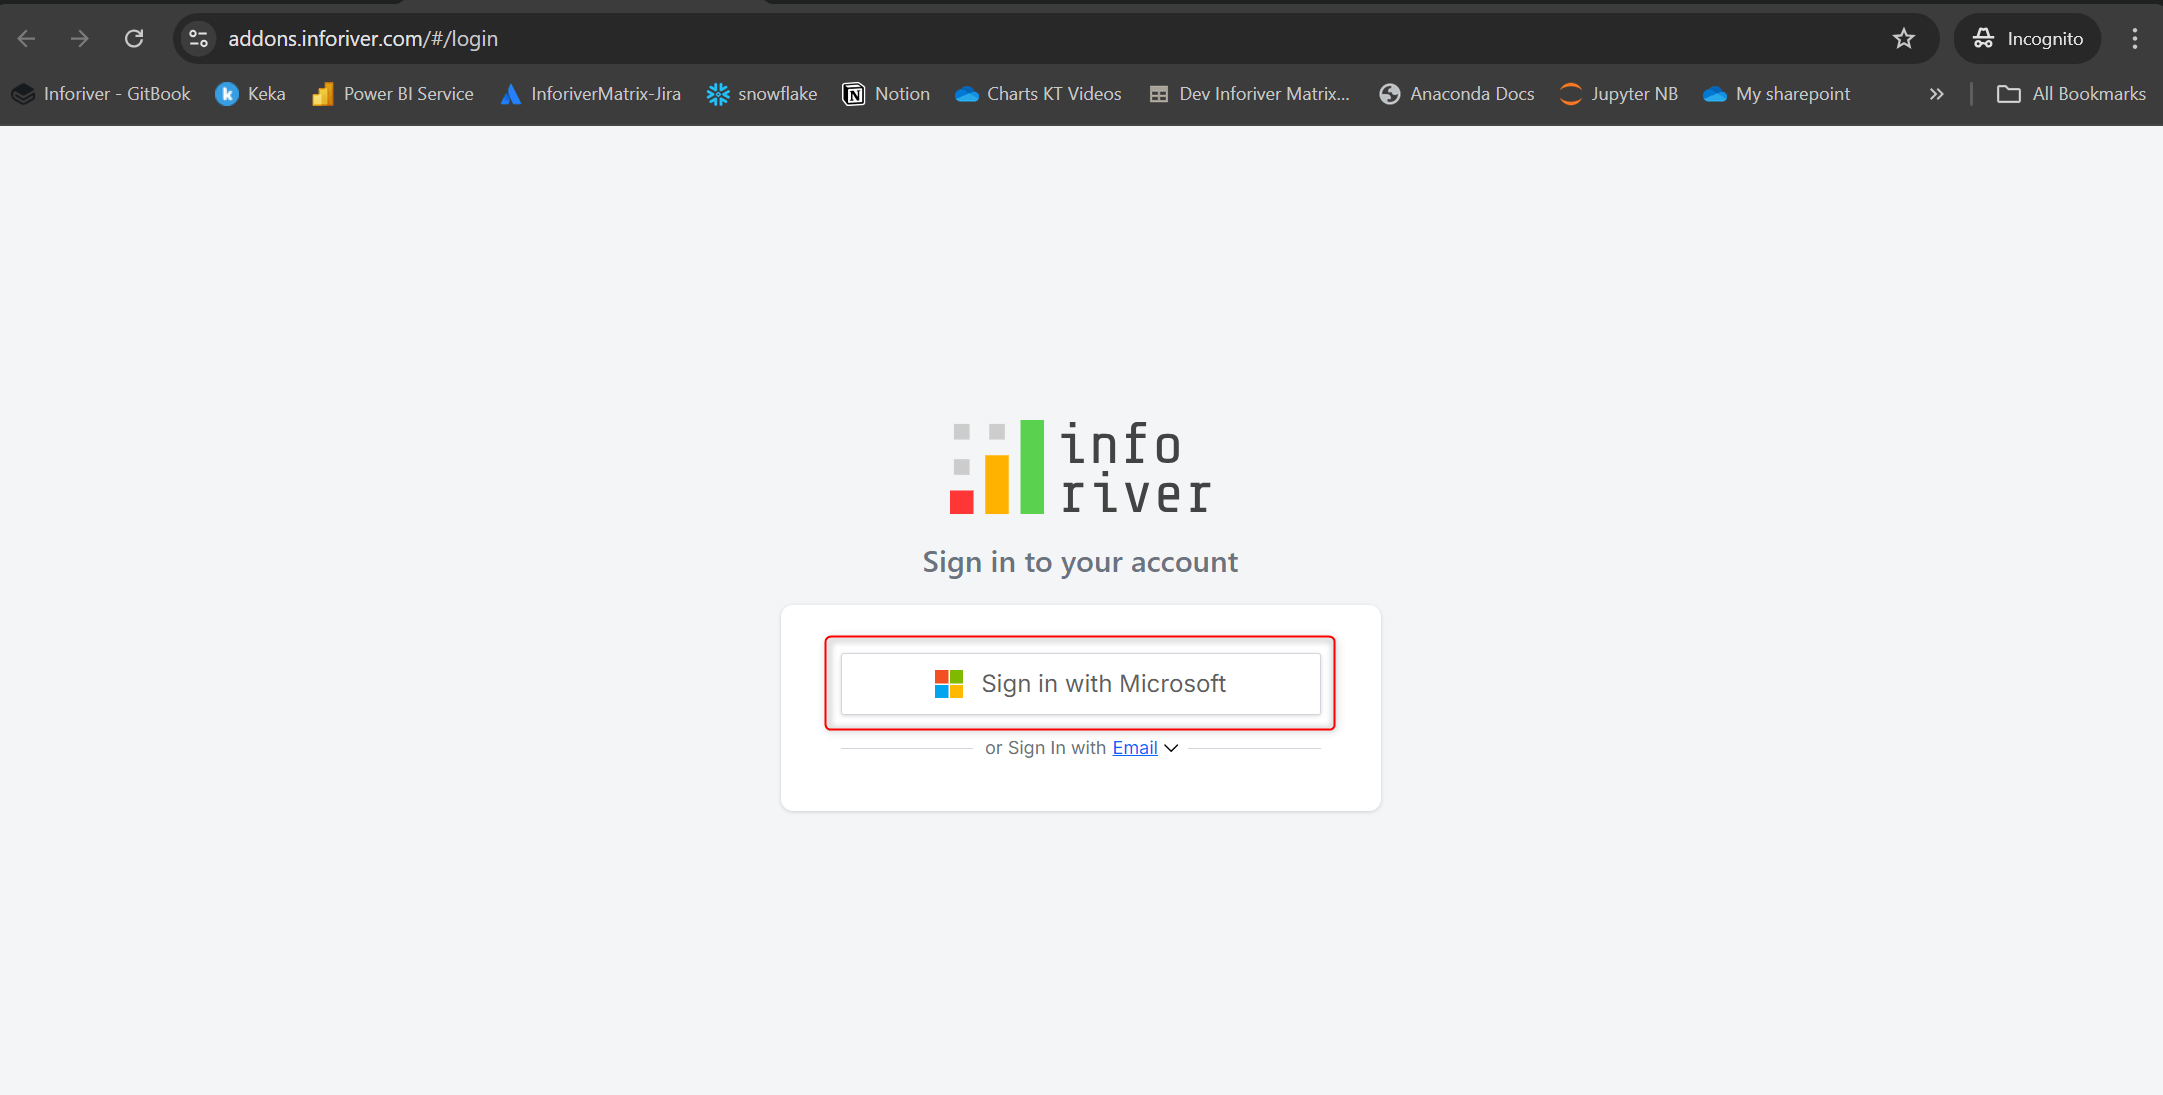
- Click the Sign in with Microsoft button. Inforiver will internally sign you into the admin console with your mobilitysys sandbox ID. A login page will open up and automatically close within 5 seconds after sign-in is completed.
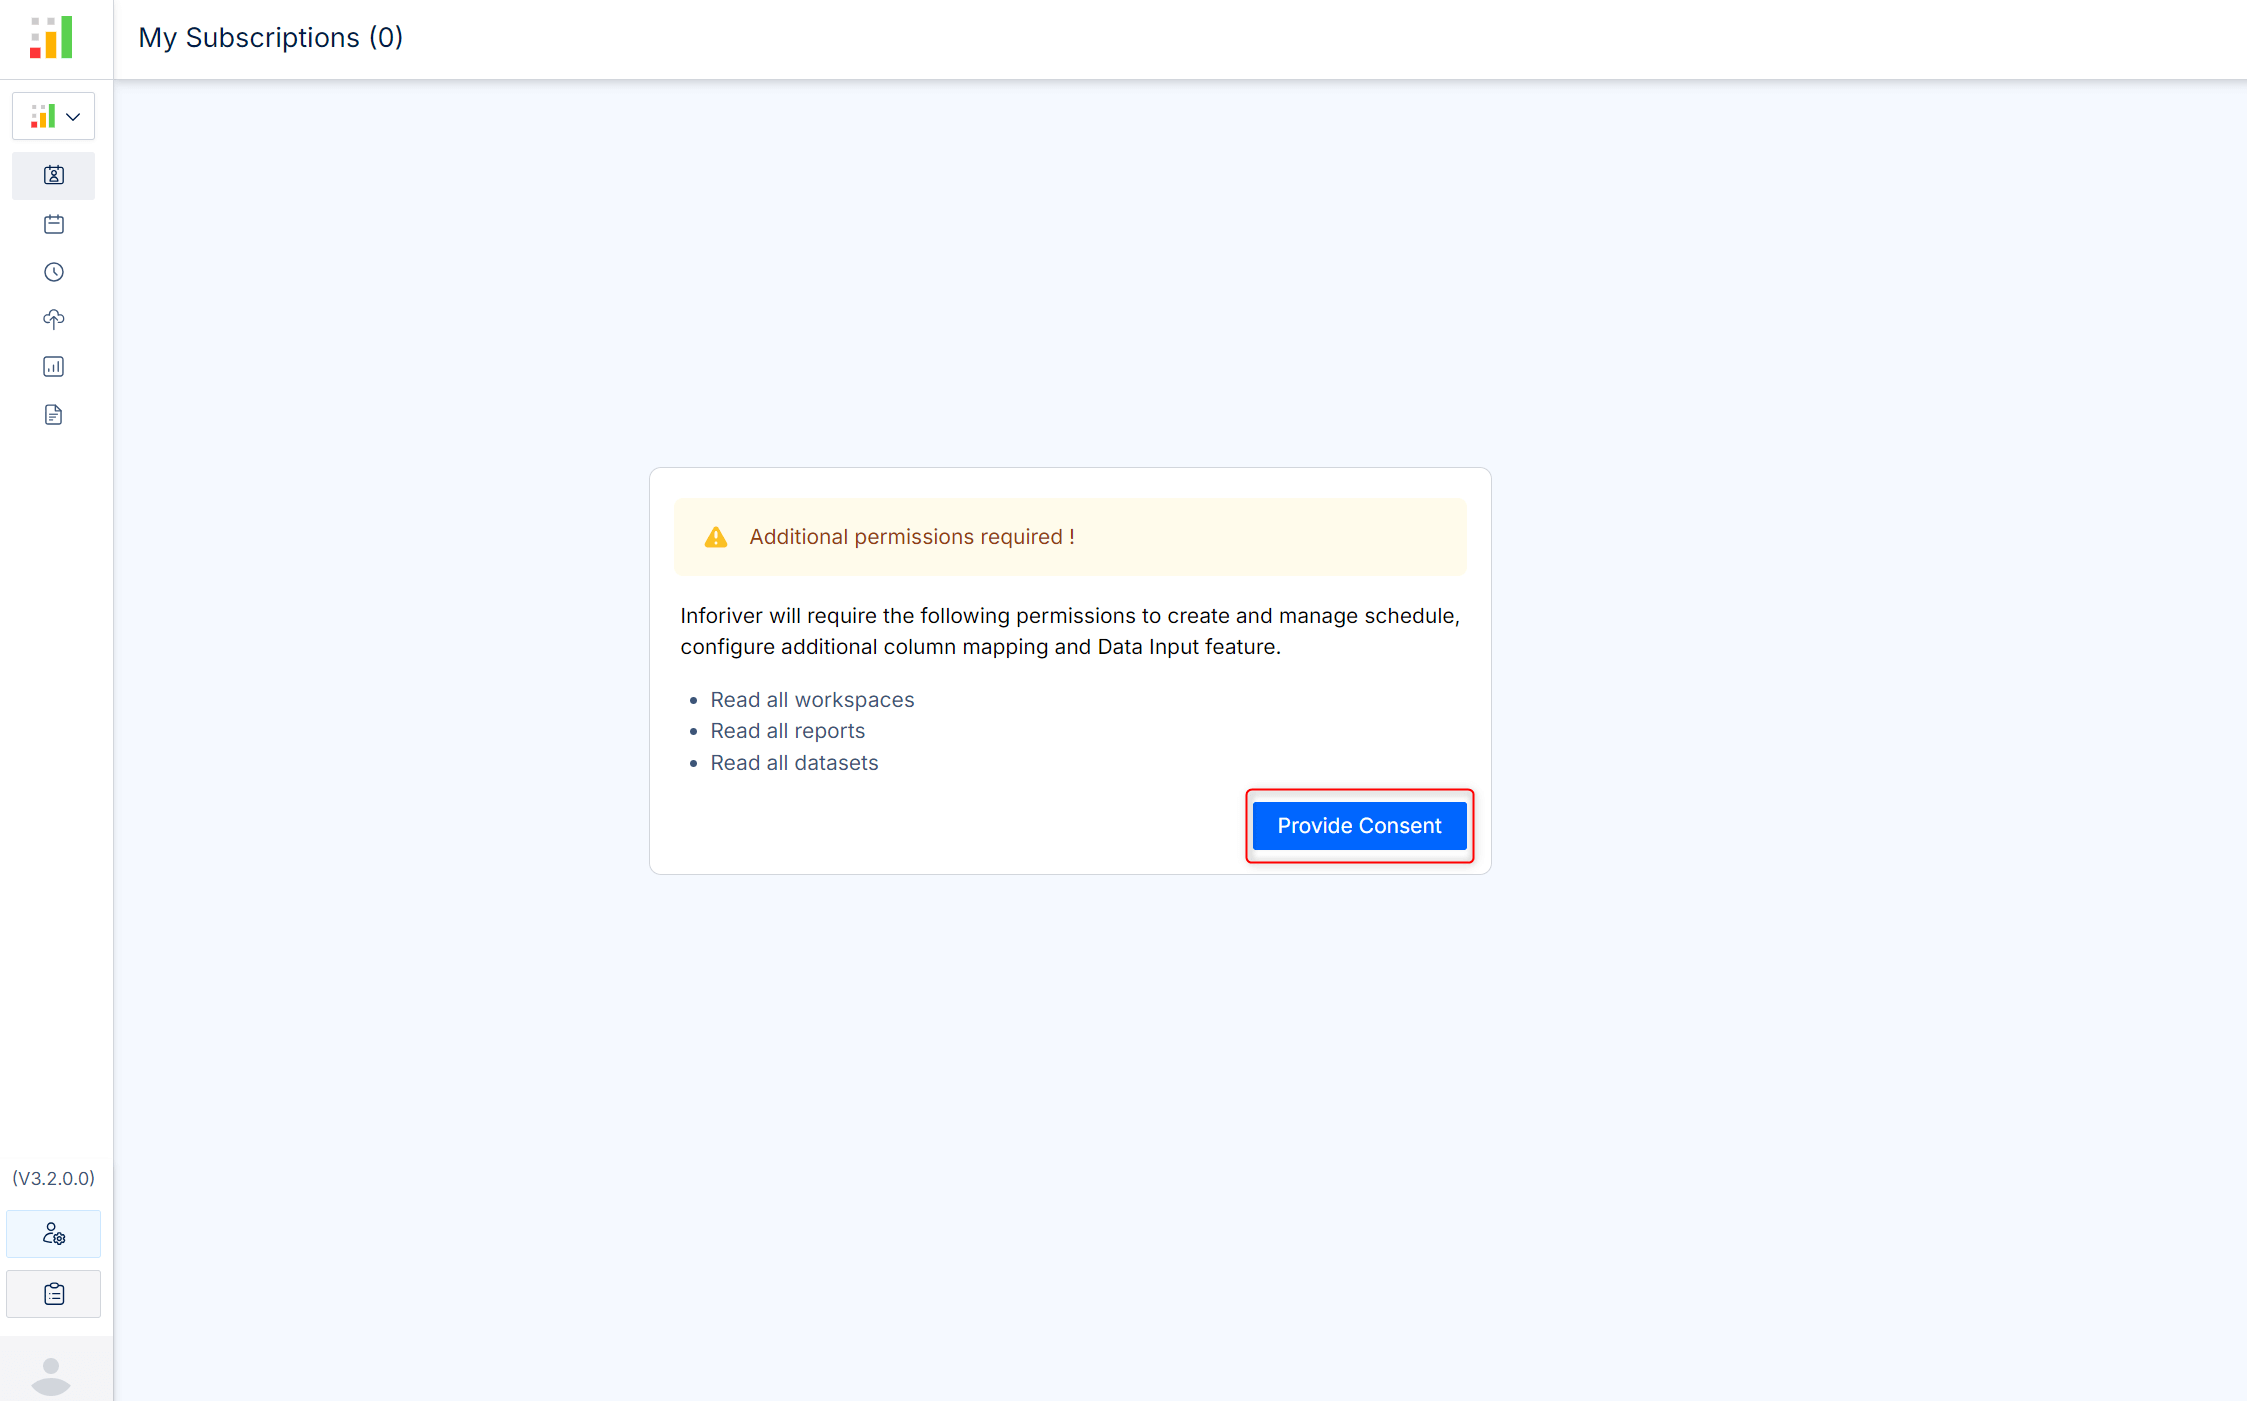
The Inforiver admin console will require read access to all your workspaces, reports, and datasets.
- Click the Provide Consent button to proceed.
You will redirected to the login page. No action is required, the page will close in a few seconds.
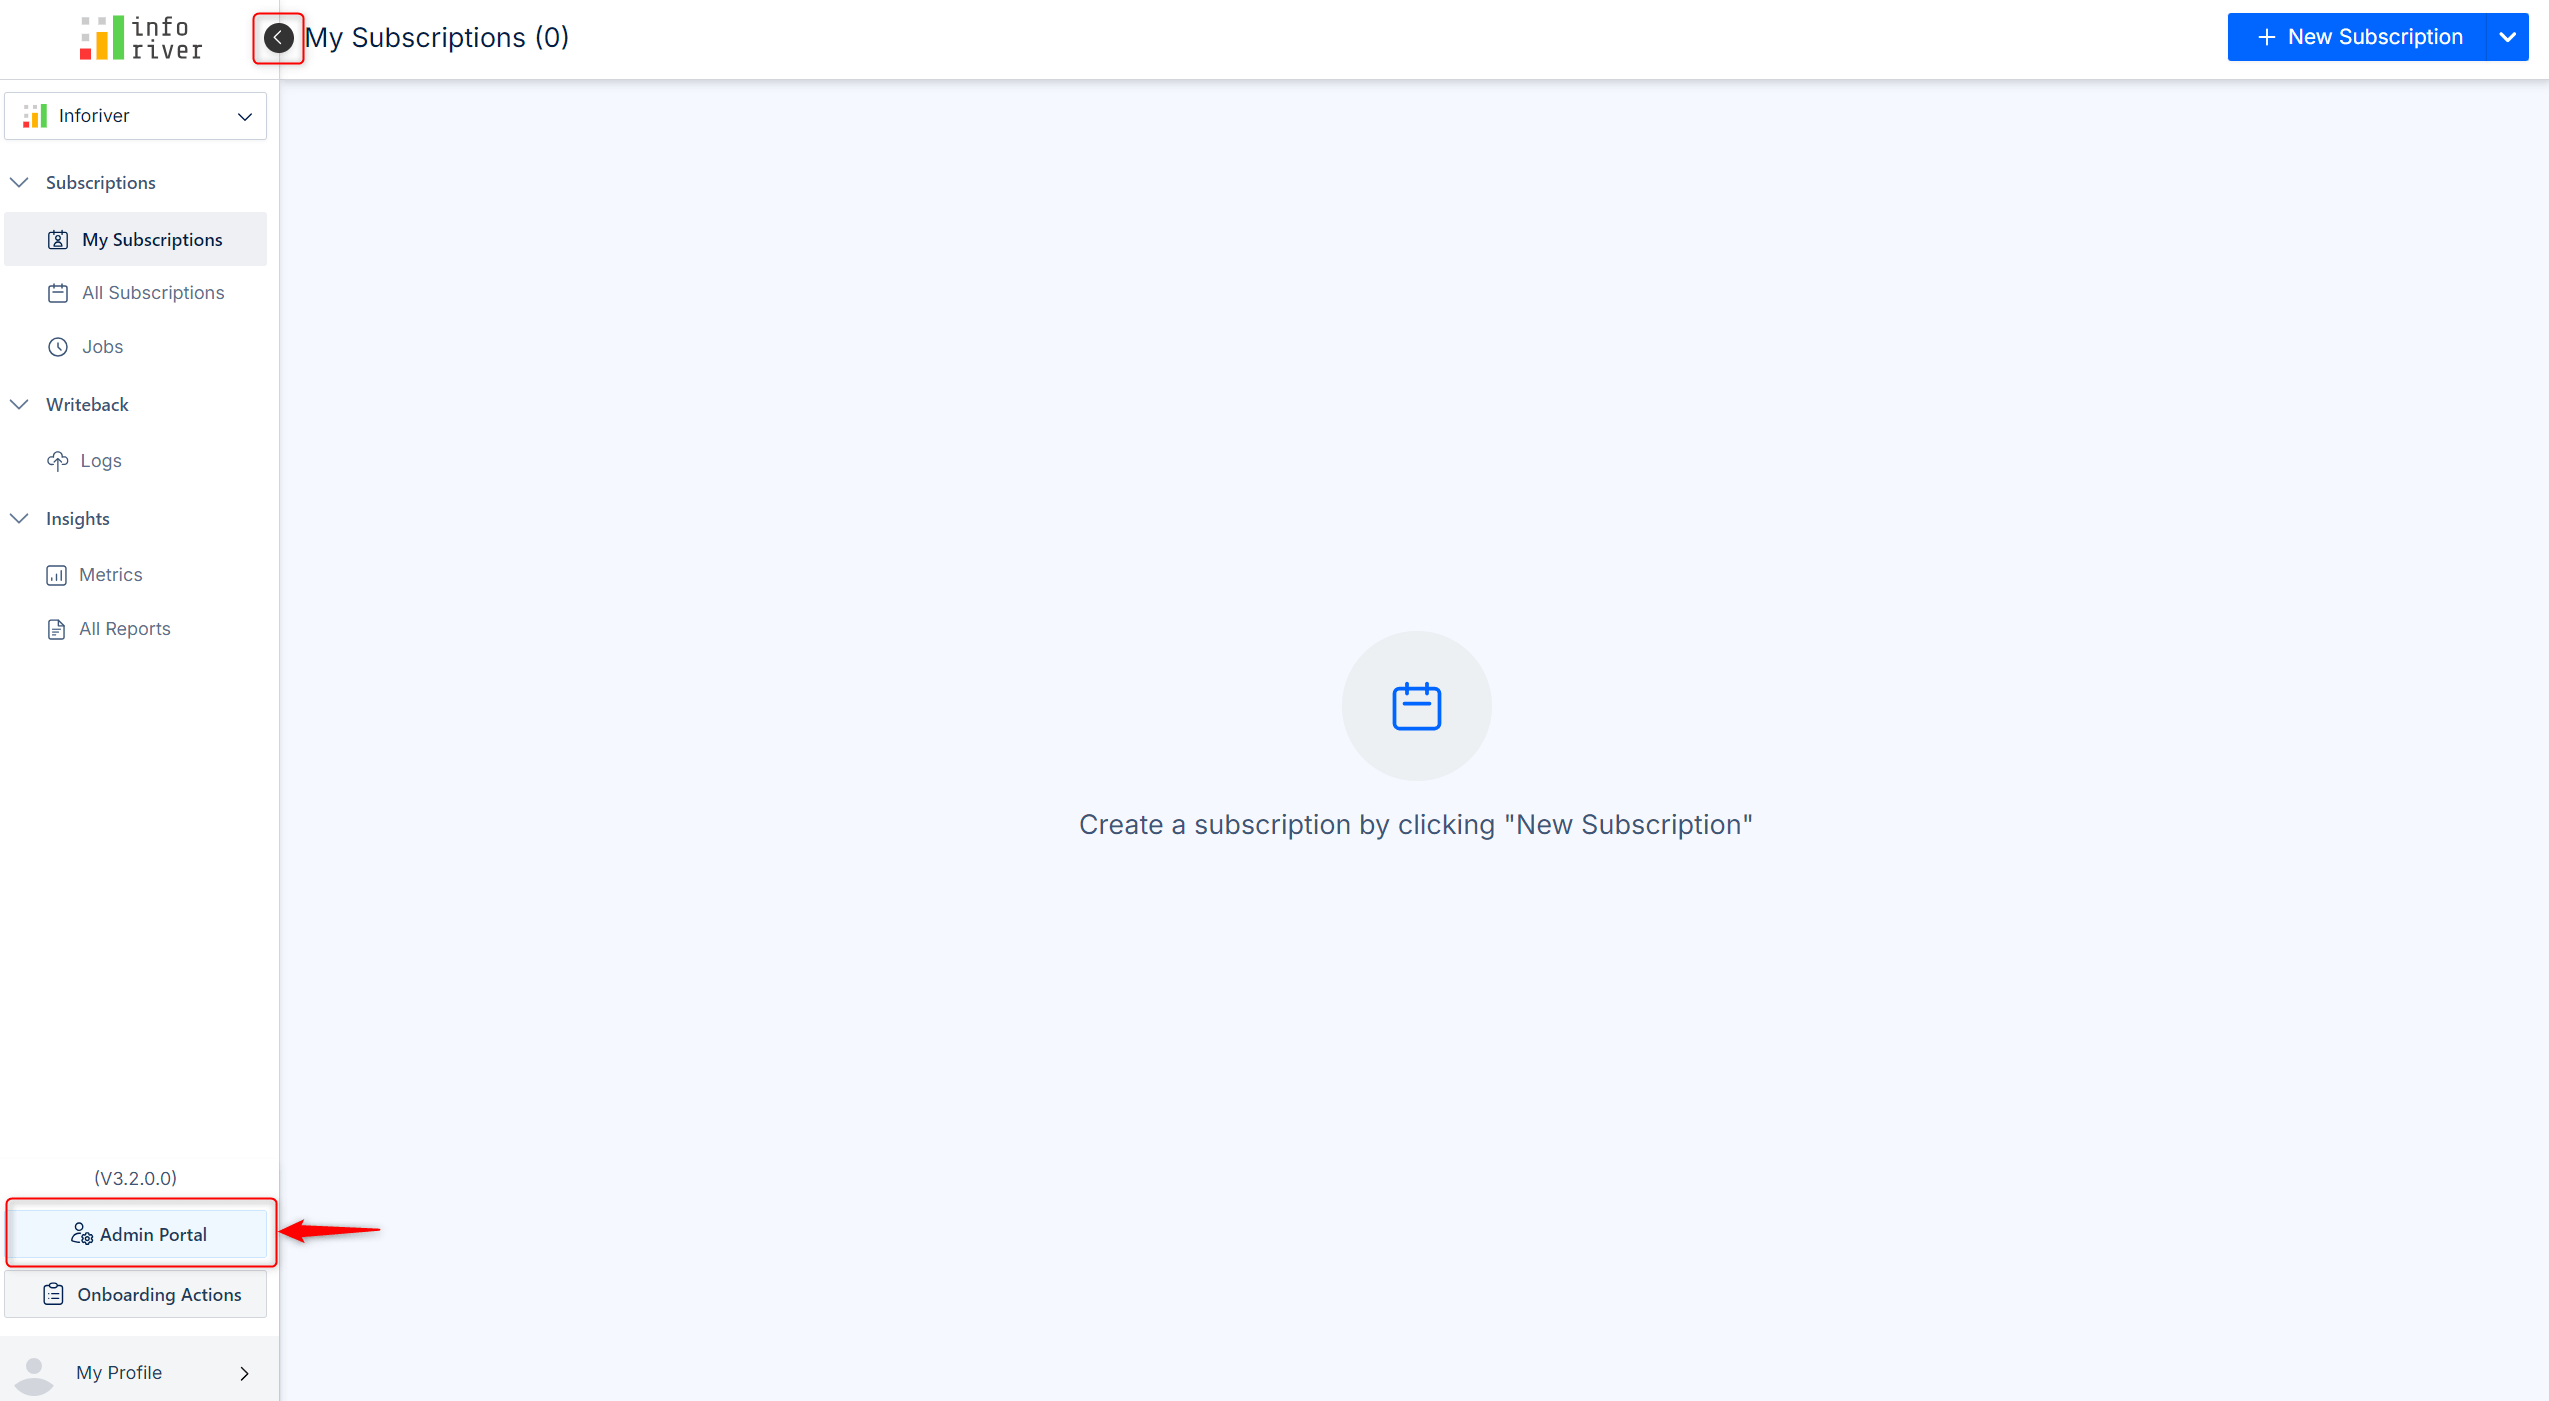
- Expand the menu on the left-hand side by clicking the black arrow icon that appears on hovering near the top left of the menu. Click Admin Portal at the bottom left of the admin console menu.
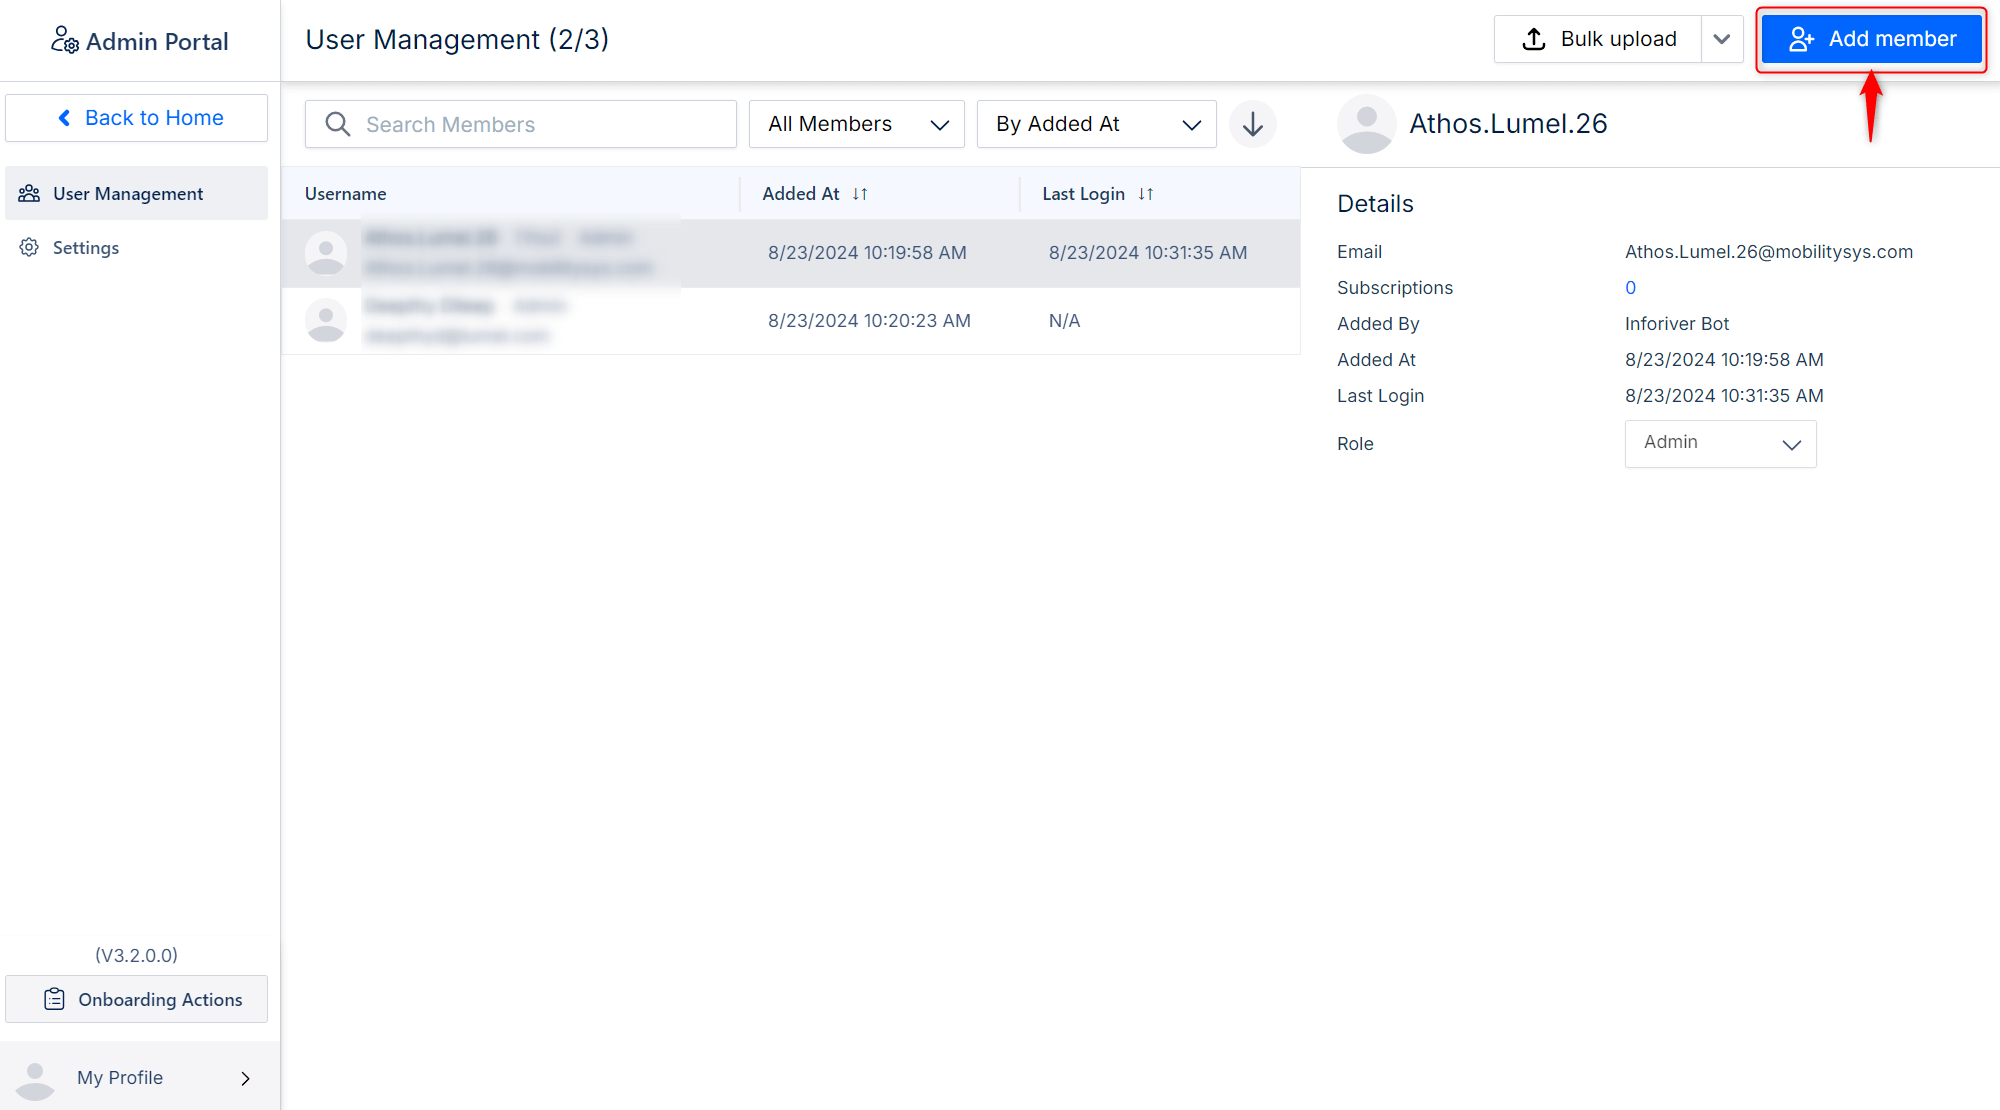
- Click the Add Member button at the top right corner of the admin console.
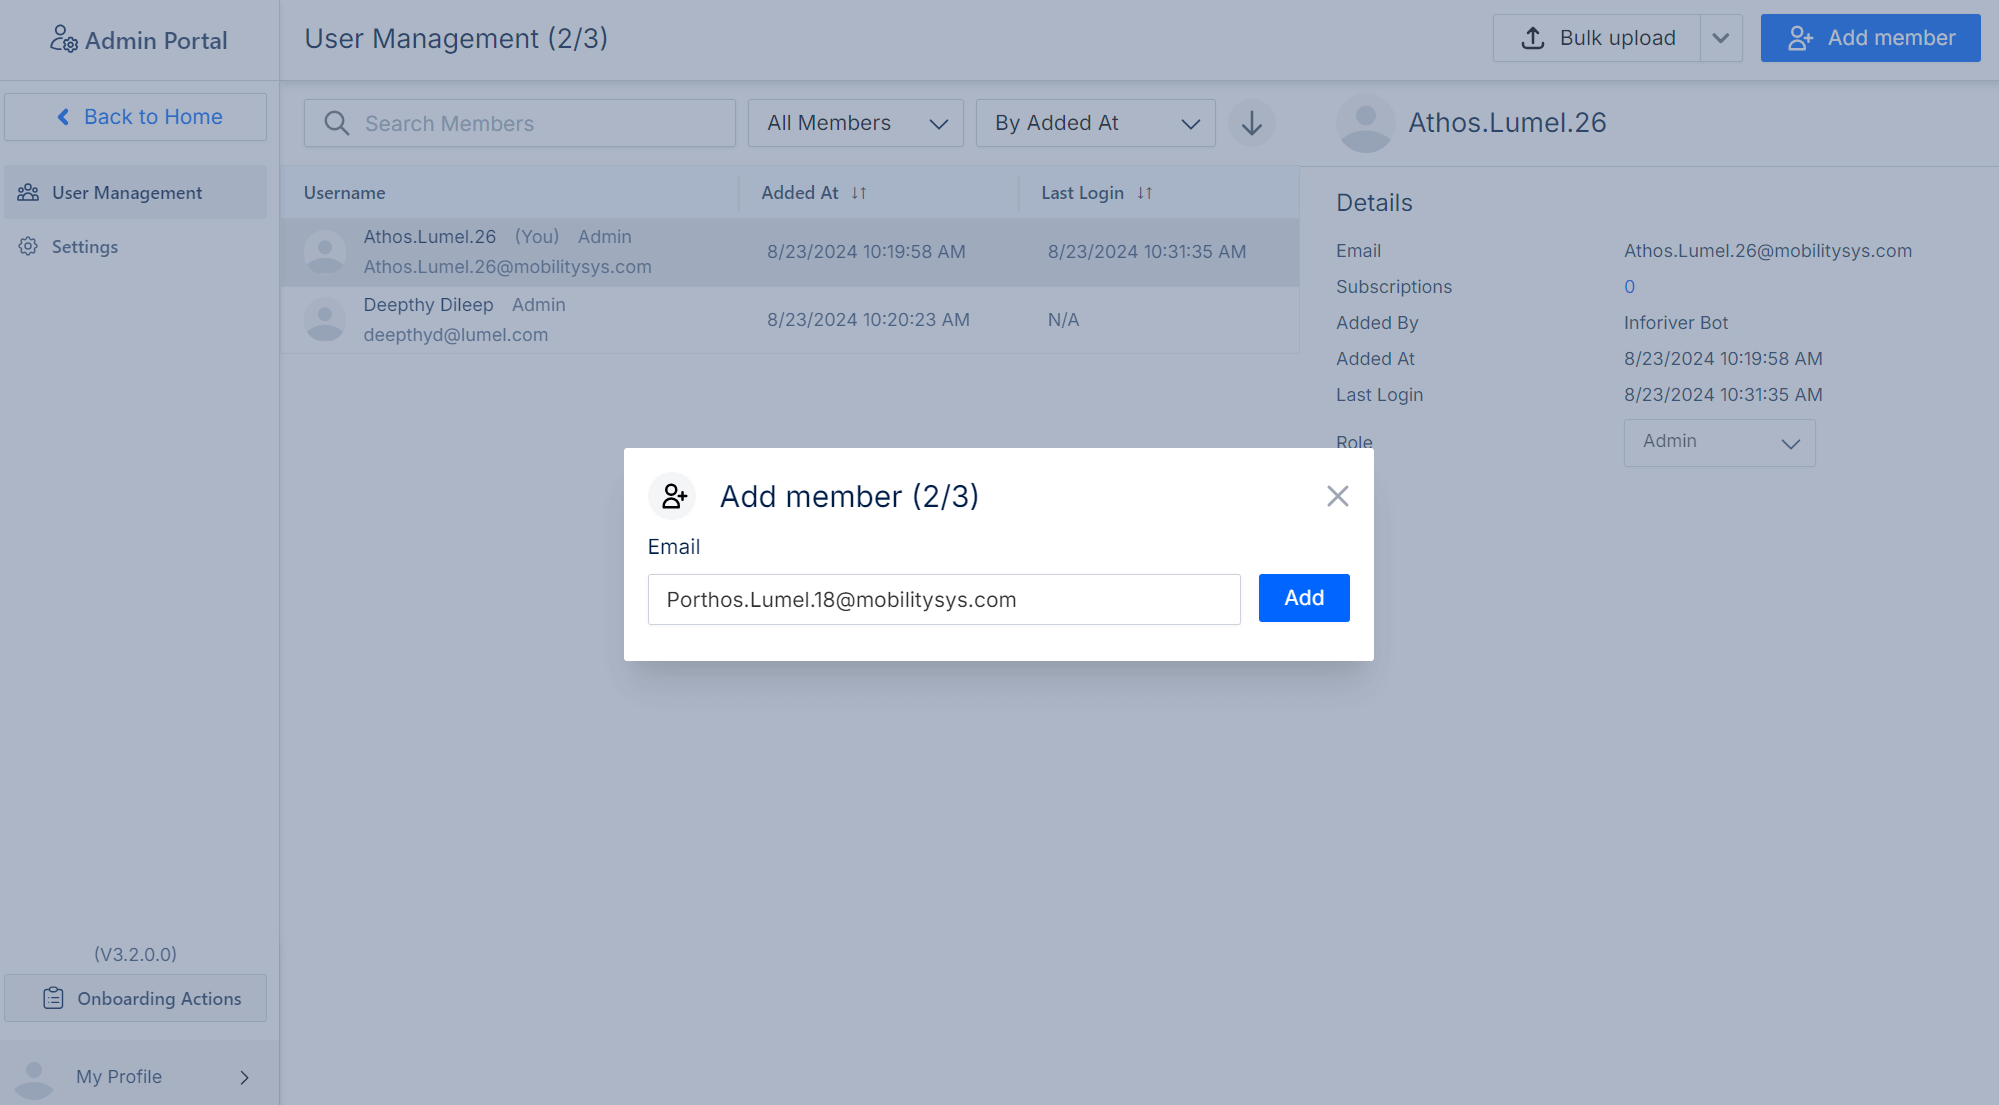
- Enter another Mobilitysys email ID from the list of email IDs provided for sandbox access. Click Add.
- Repeat step 13 - 14 for all the email IDs that will be used to access the sandbox. The trial license admin can then share the email IDs and credentials with the users who will be evaluating the sandbox.
Setting up Inforiver Writeback
As part of the sandbox environment, you will also be provisioned with a managed Azure SQL DB instance for POC purposes. After completing the steps outlined in this section, you will be able to
- Create a writeback connection to the Azure DB
Learn more about Inforiver writeback.
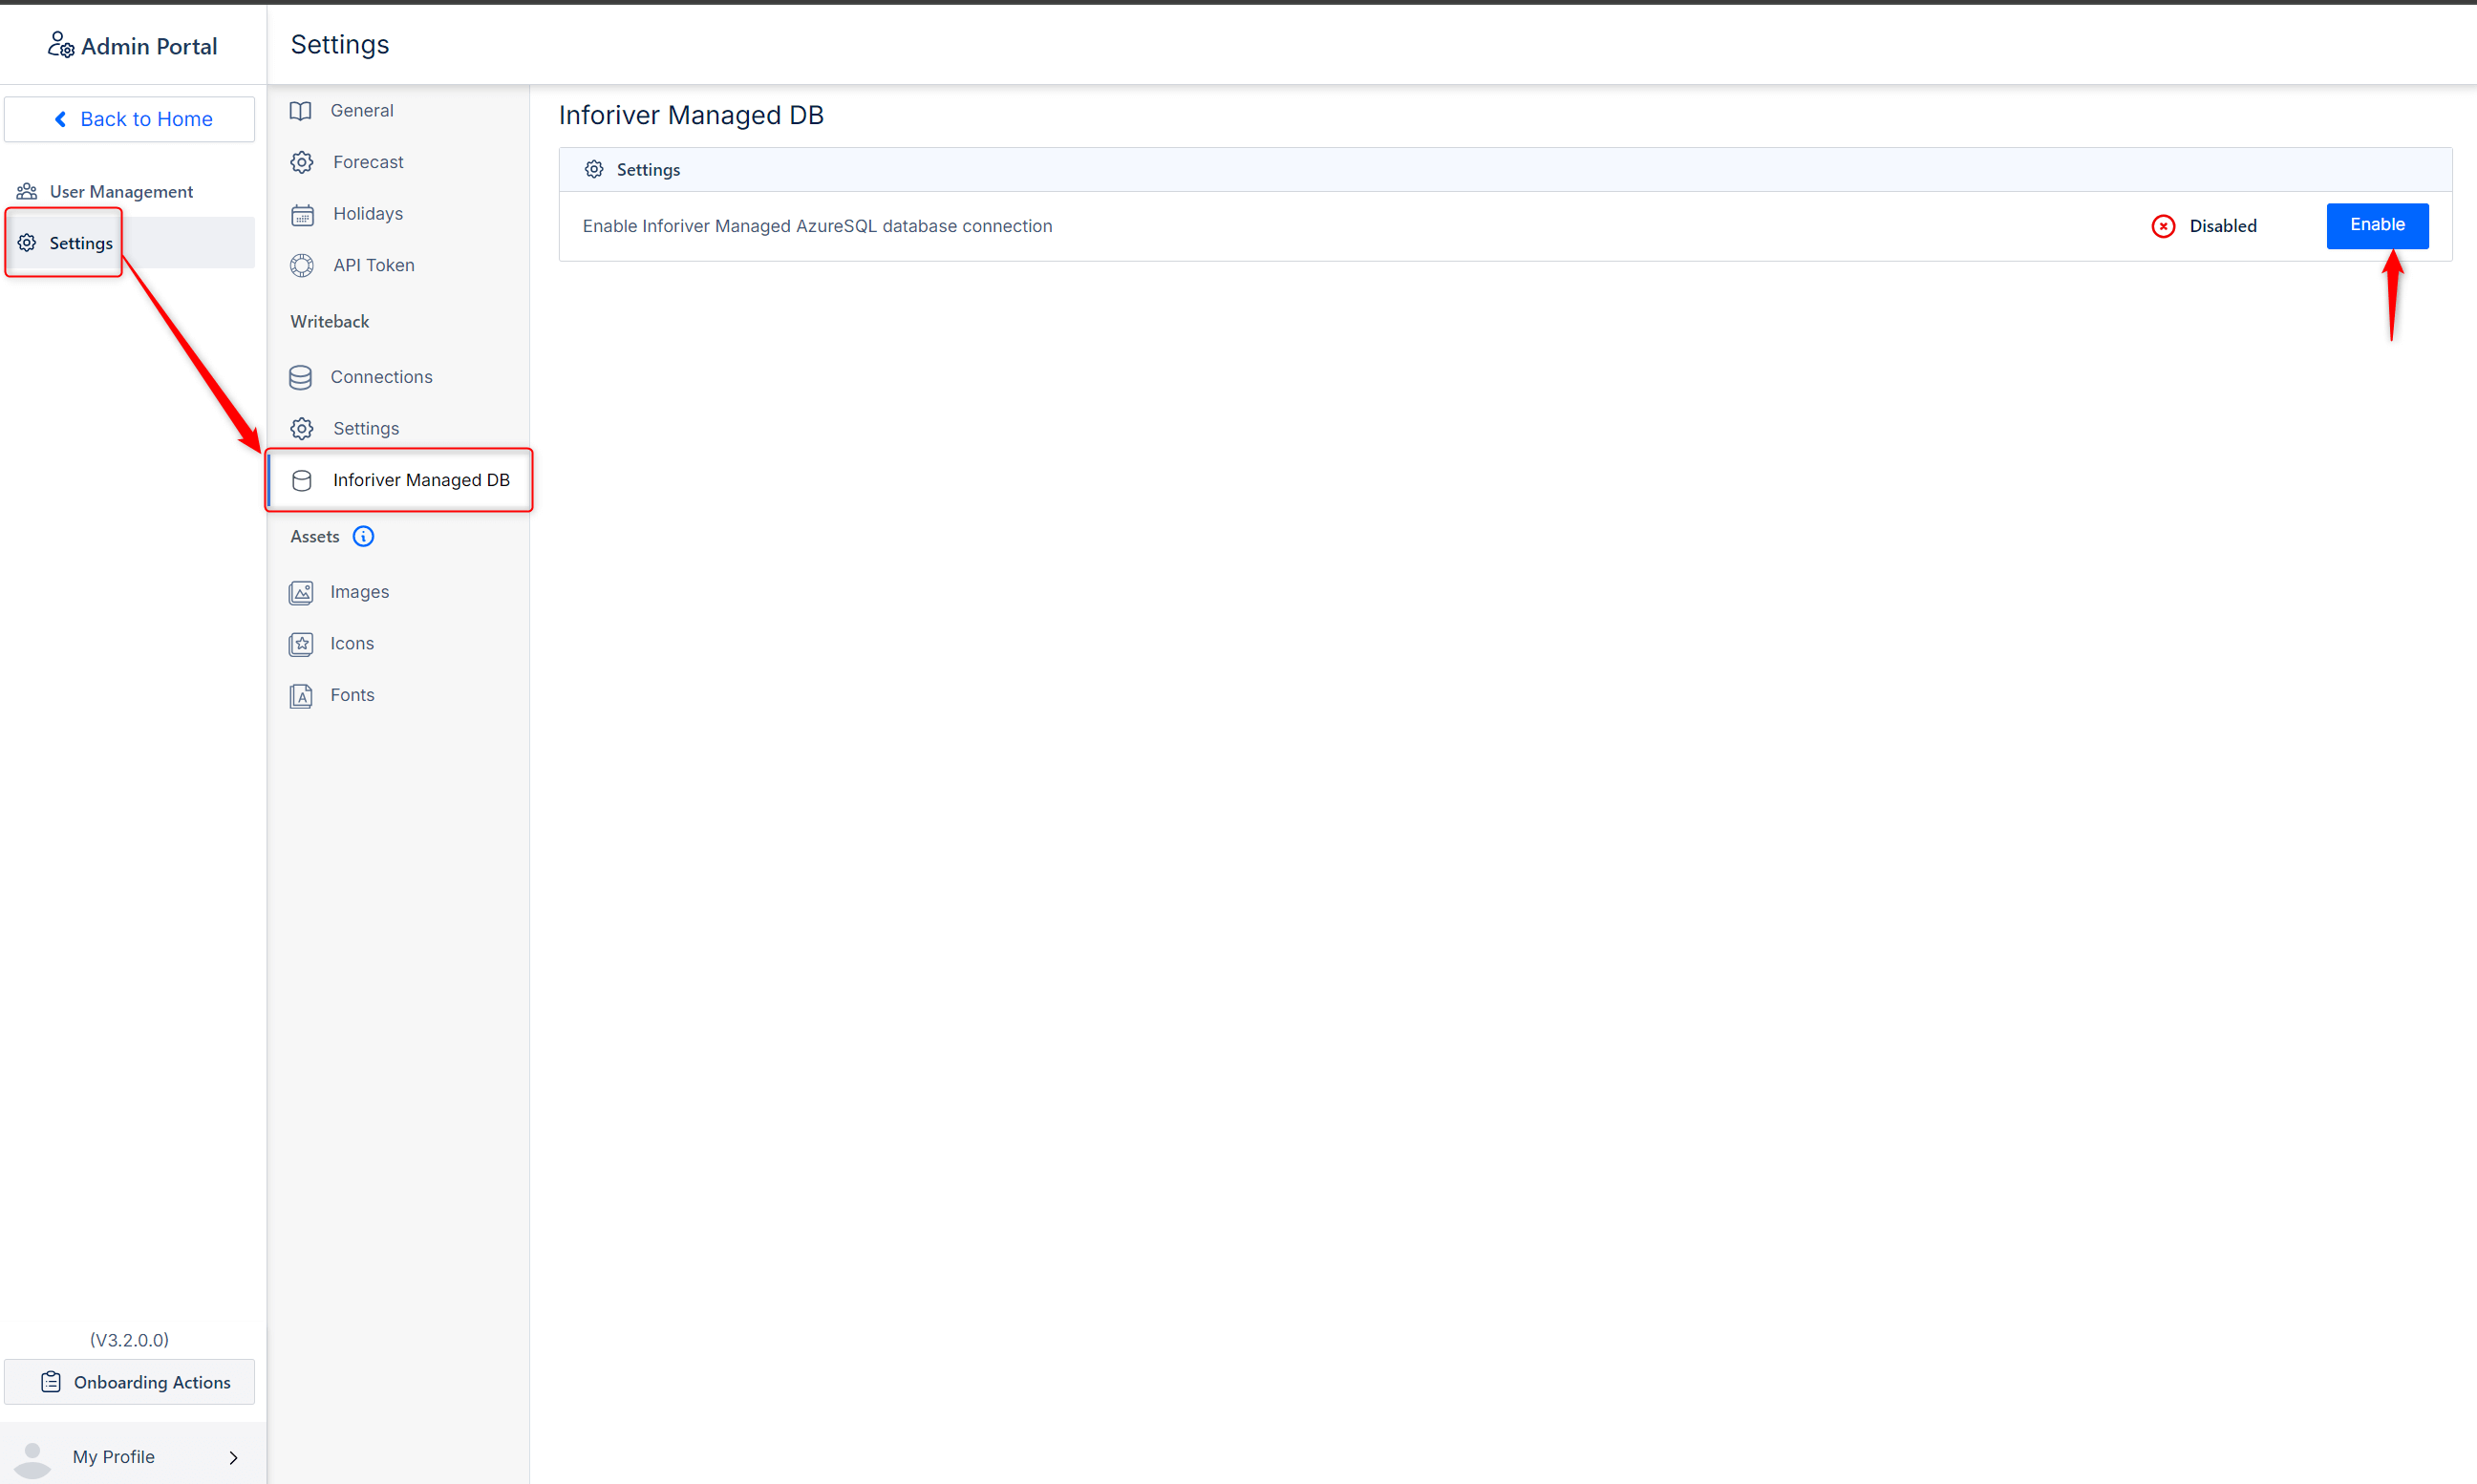
- Navigate to Admin Portal > Settings. Click Inforiver Managed DB from the menu. Click Enable.
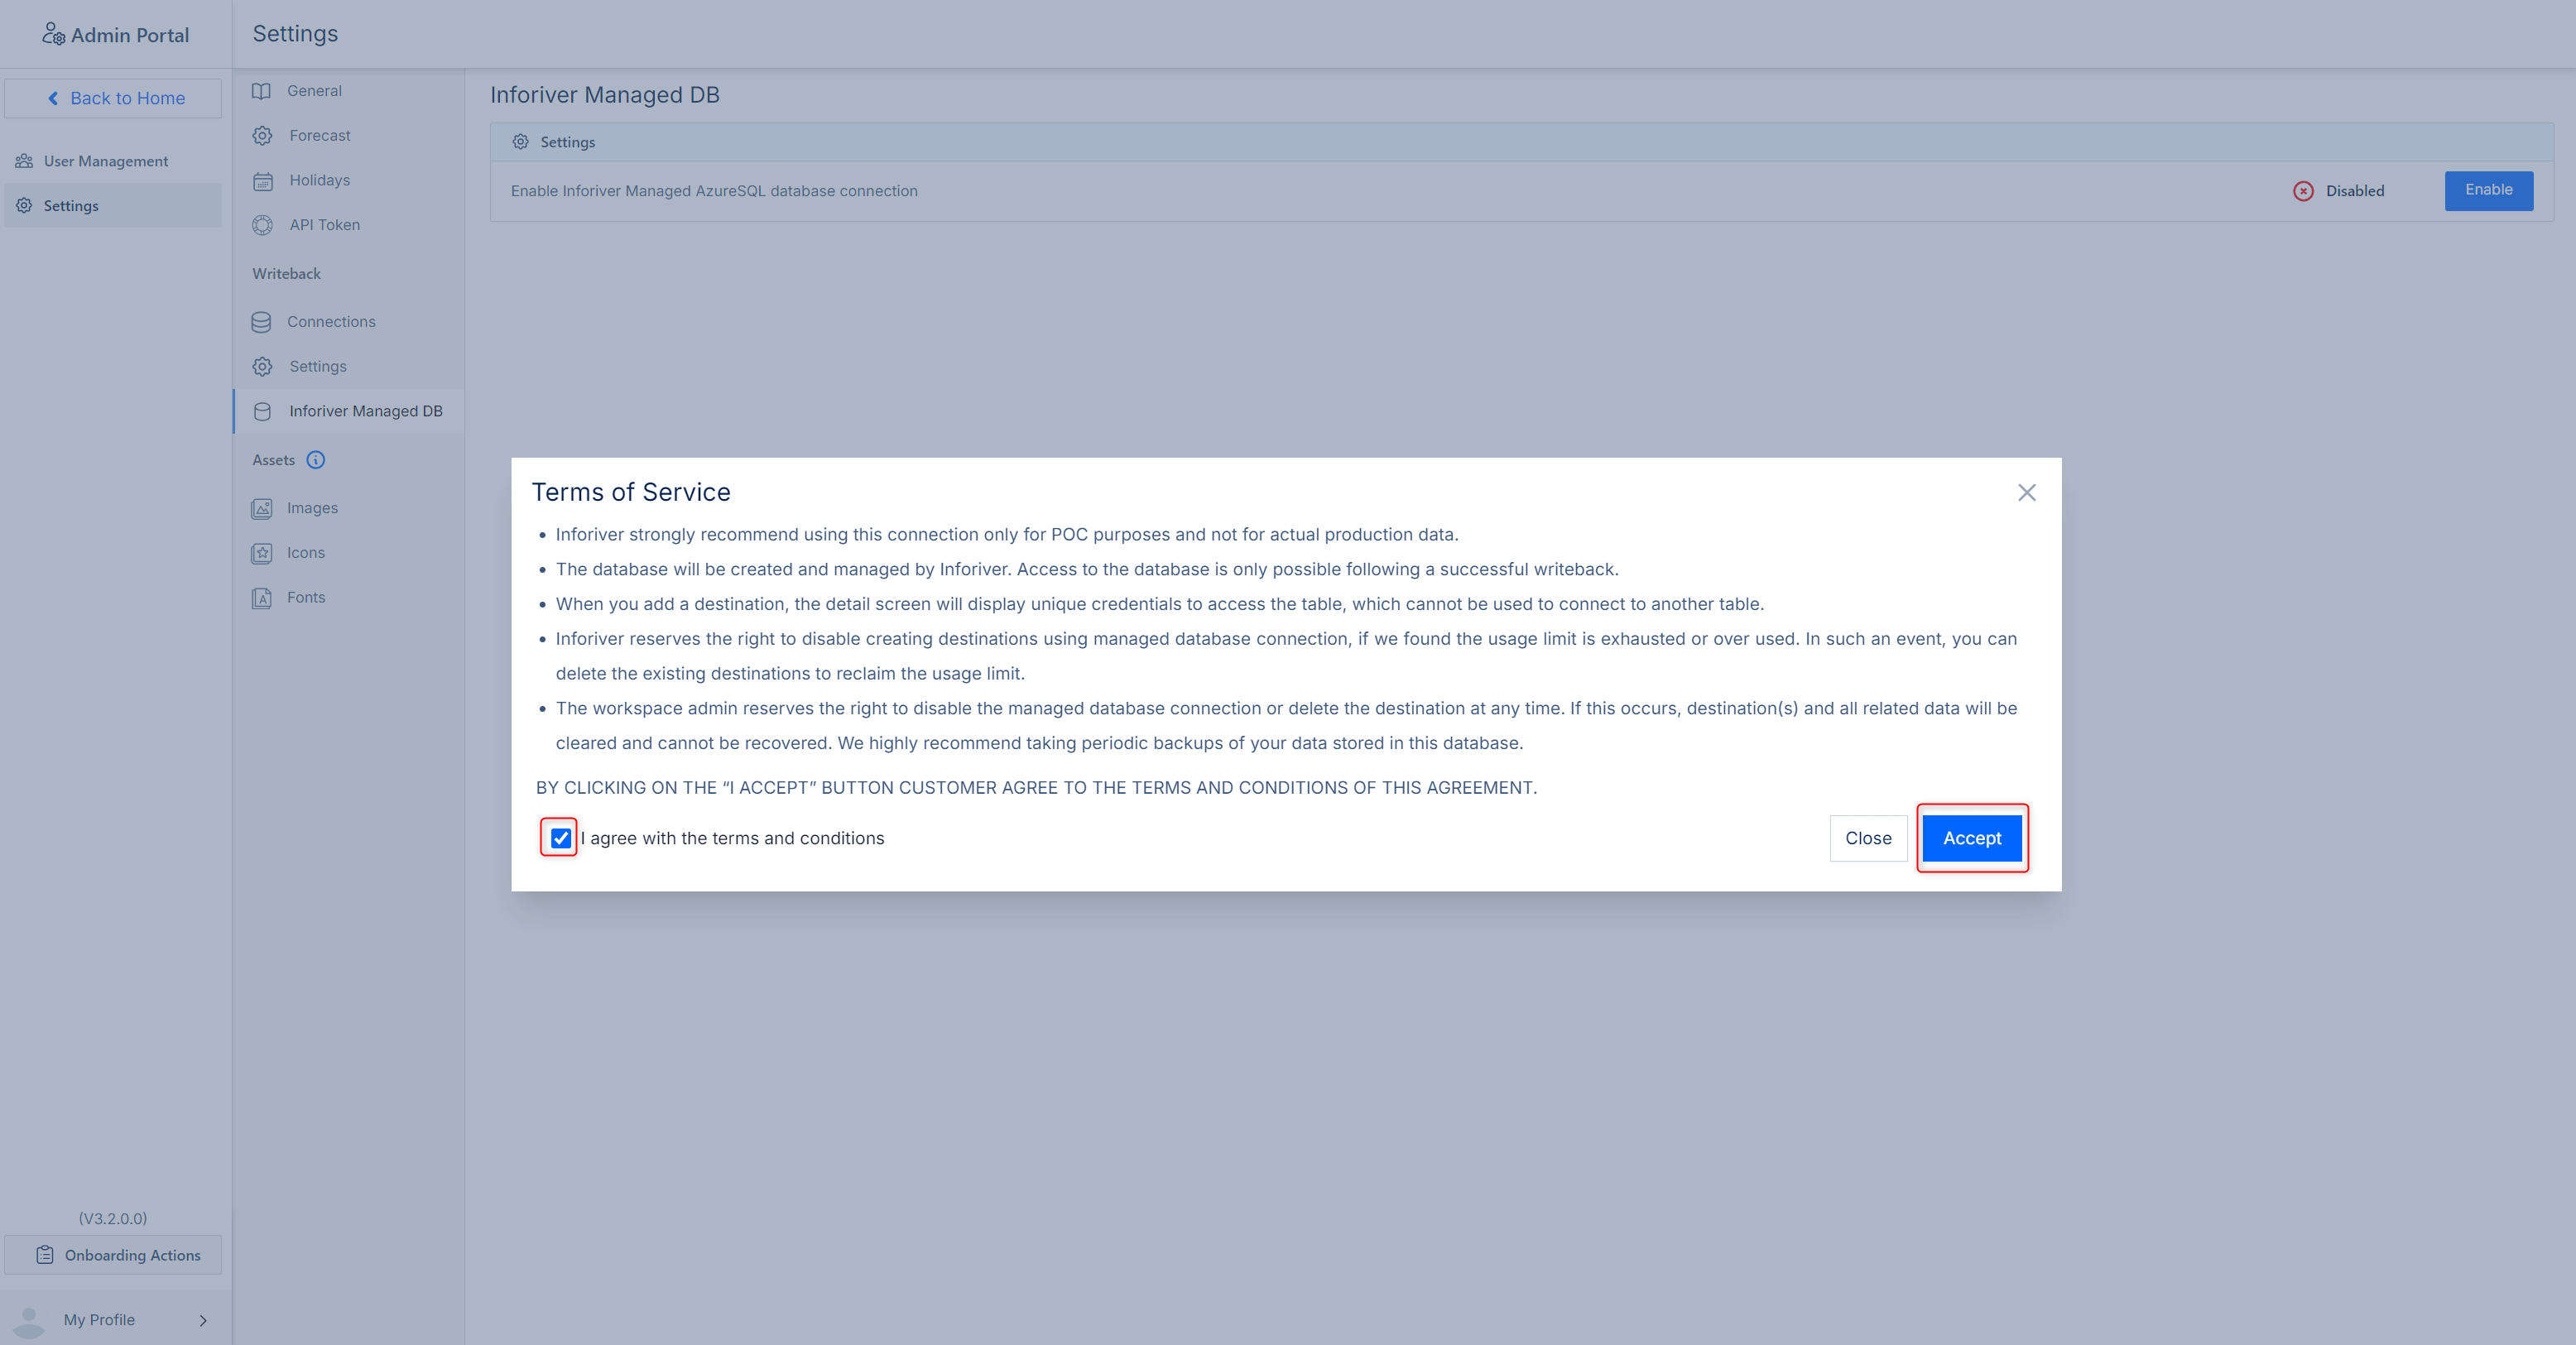
Review and accept the terms and conditions.
- Build a report in Power BI using Inforiver. In order to writeback, please bear in mind that you need to Sign In (Step#9 in the onboarding section).
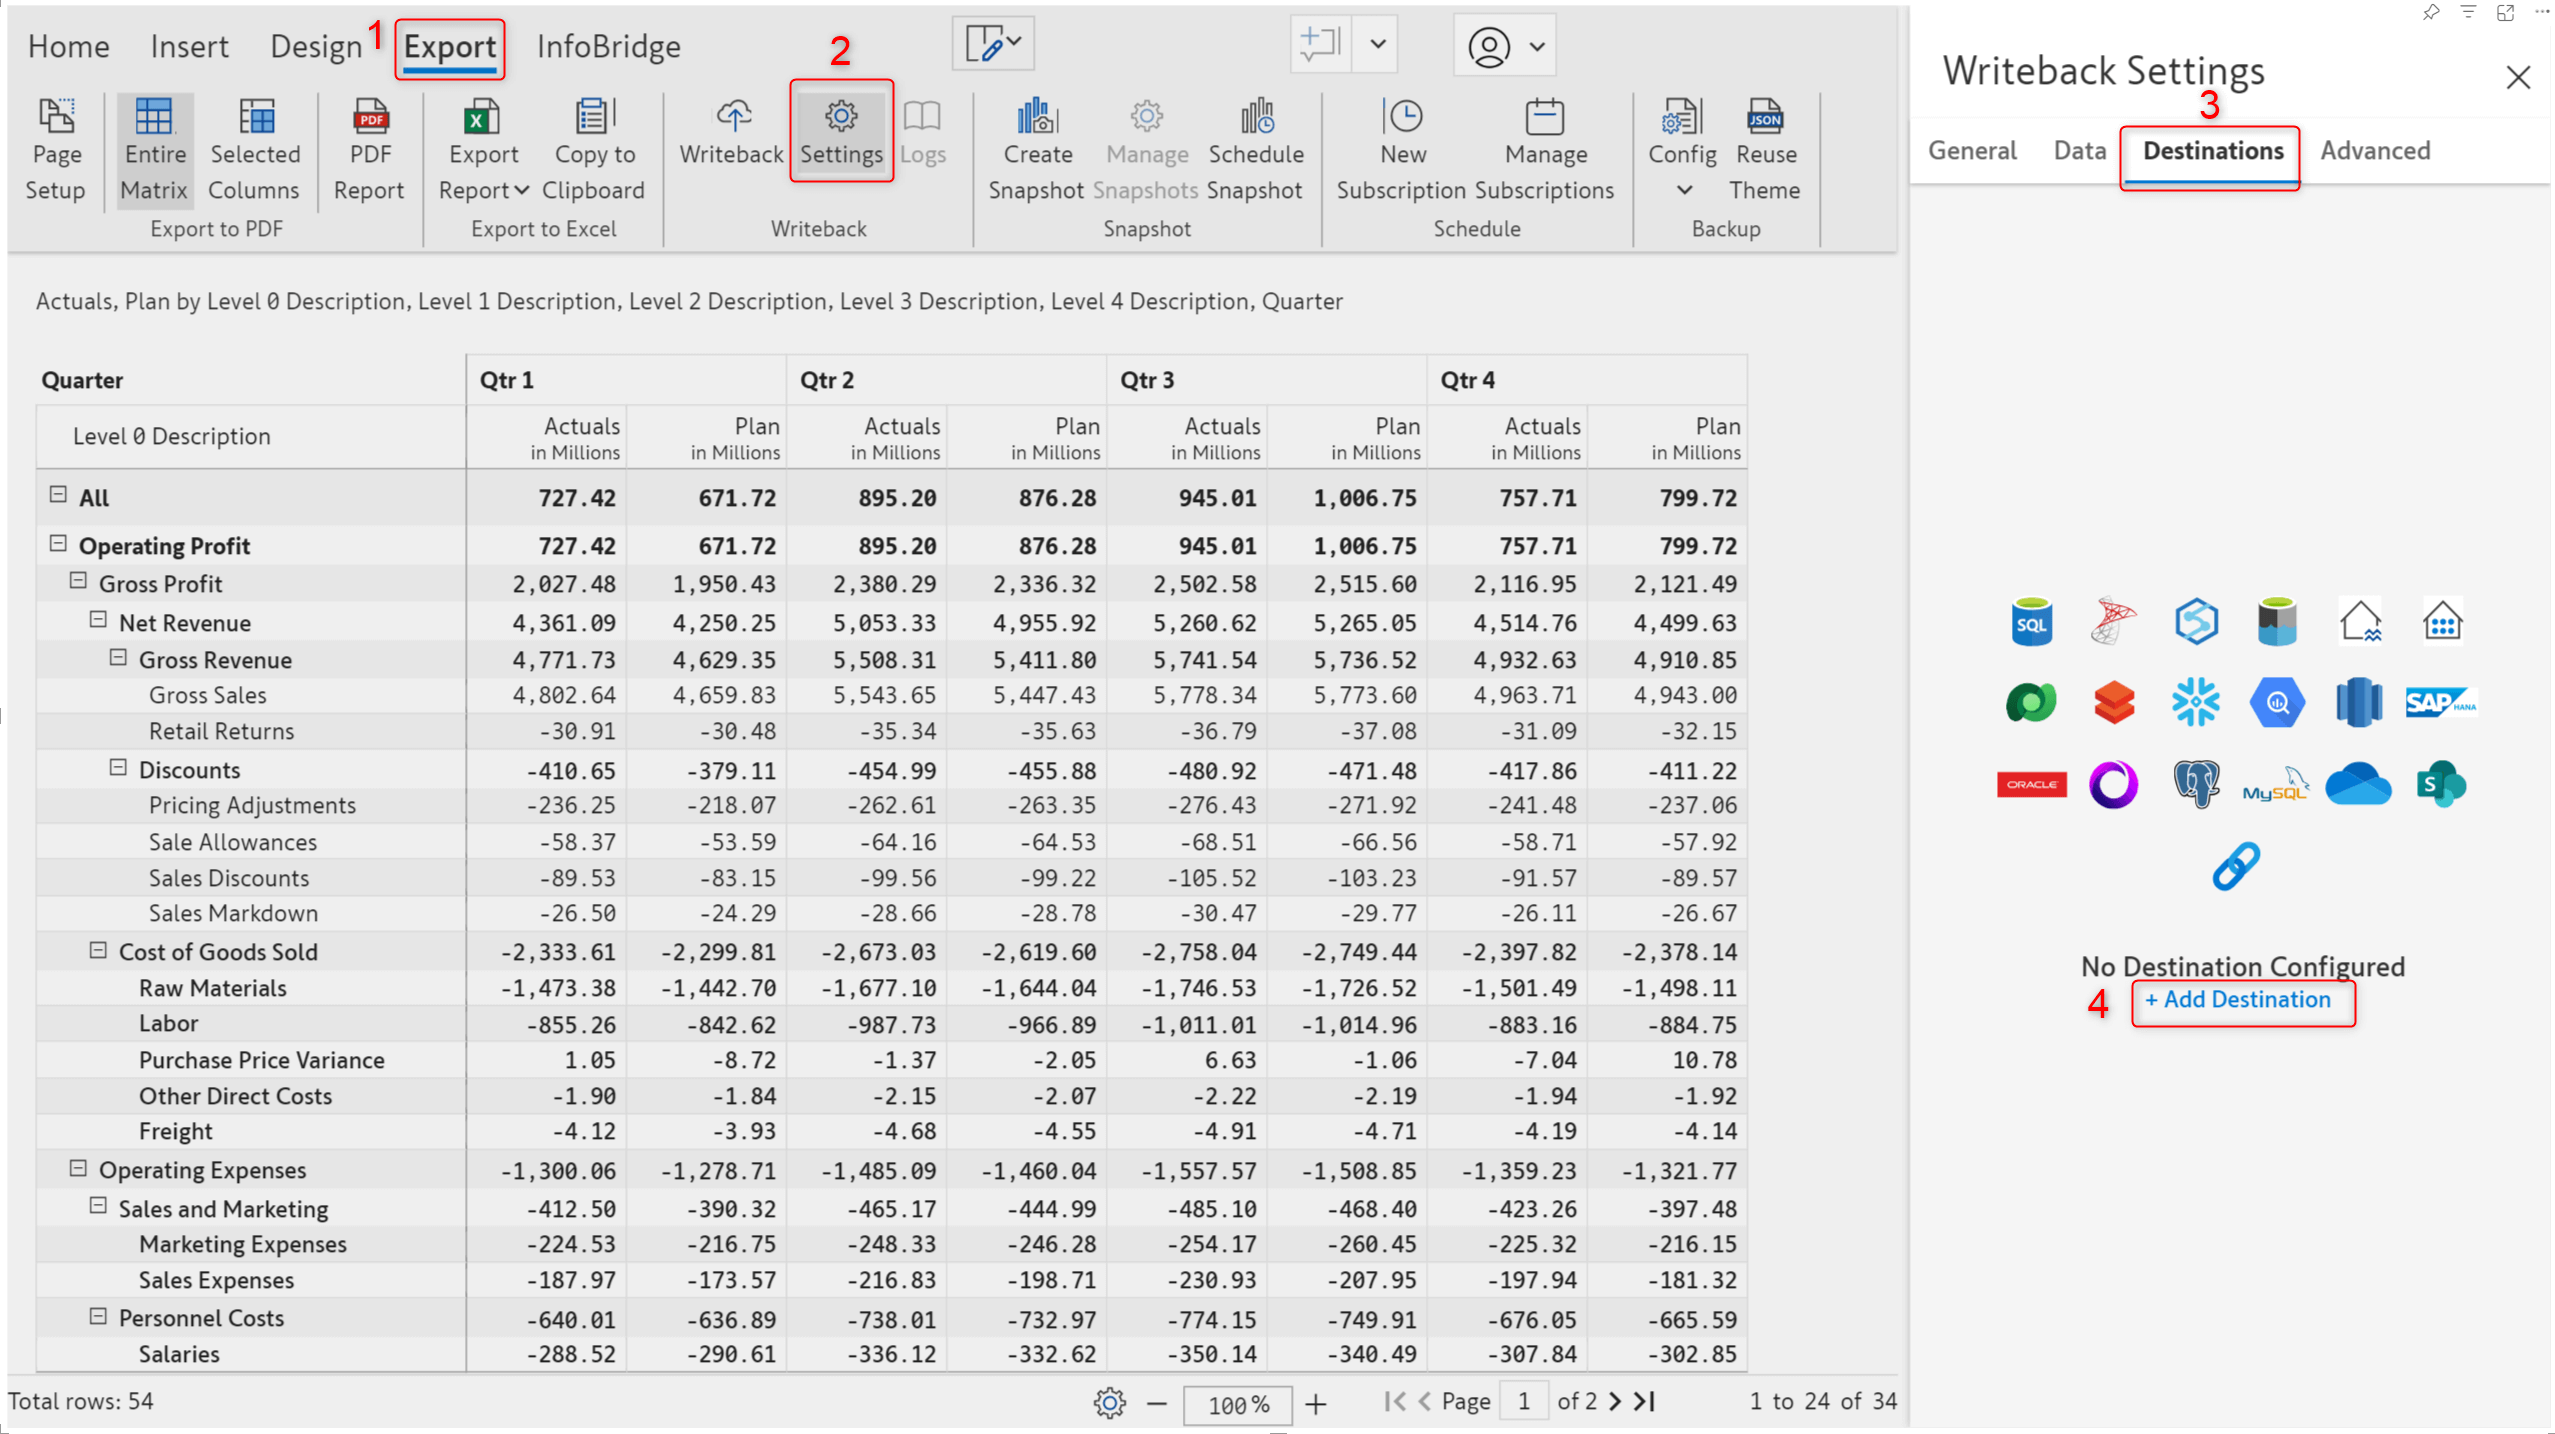
- In the export ribbon, click the Settings button in the writeback section.
- In the Writeback Settings side panel, navigate to the Destinations tab.
- Click the Add Destination link. This will open the destination configuration page in the Inforiver console.
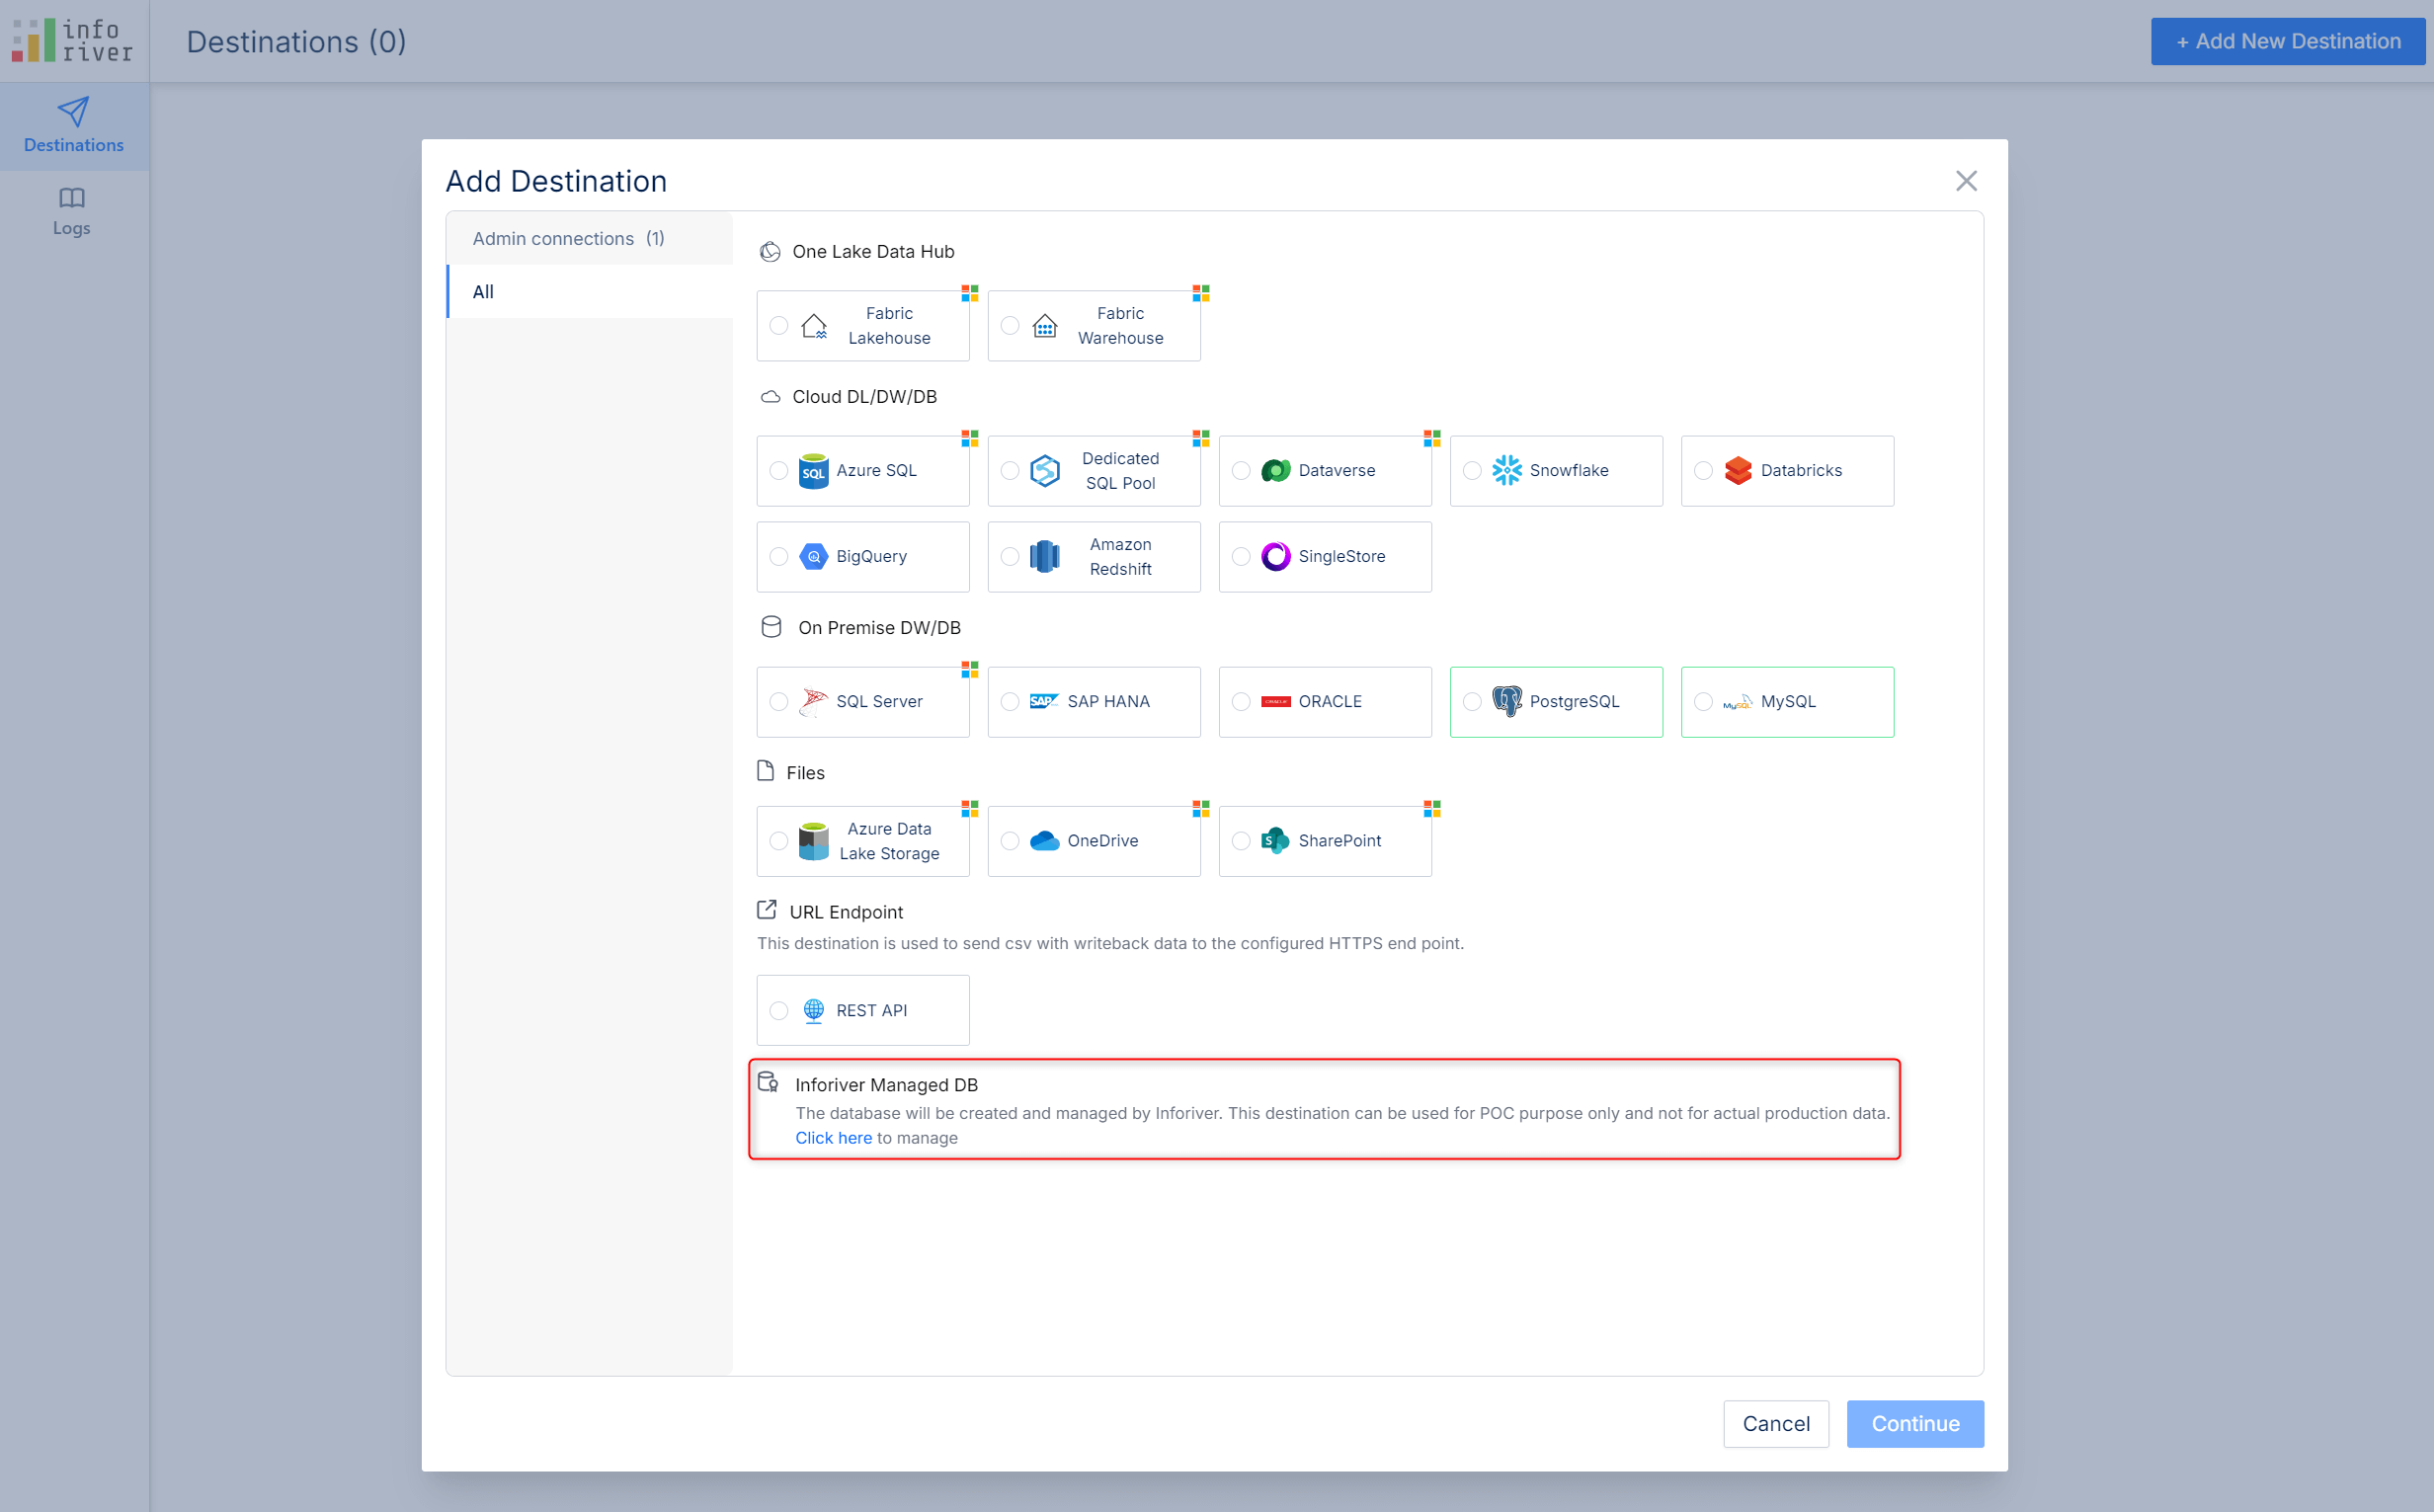
- The Add New Destination page will list all the writeback destination types supported in Inforiver.
- Choose the "Click here" link under Inforiver Managed DB. Review and accept the terms and conditions.
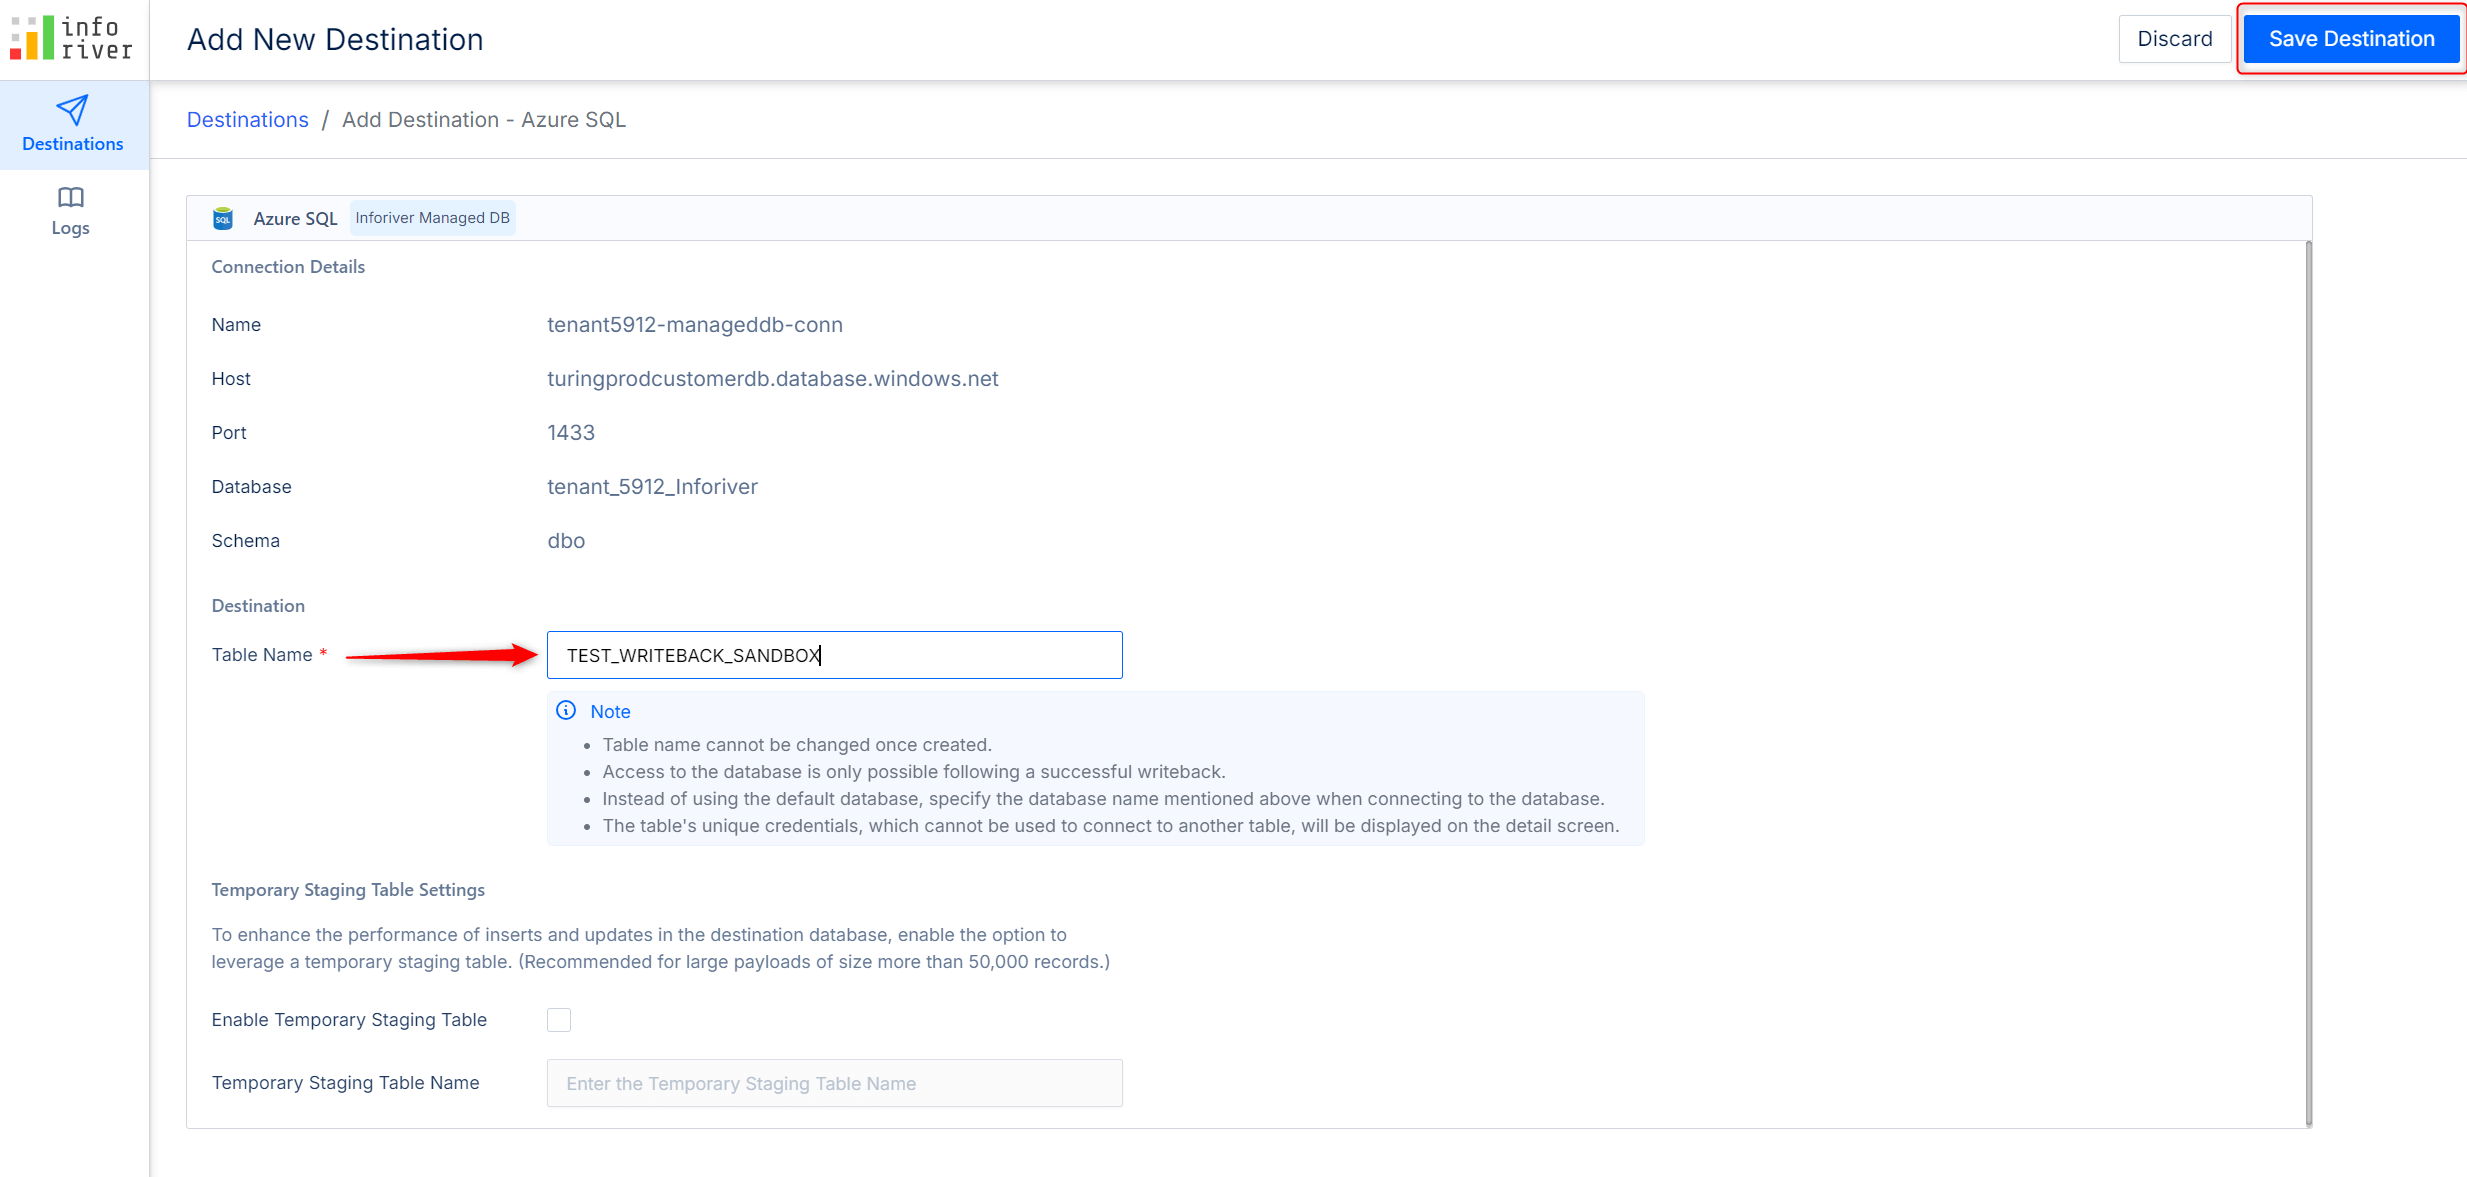
- Enter the table name to writeback to. Click the Save Destination button at the top right corner.
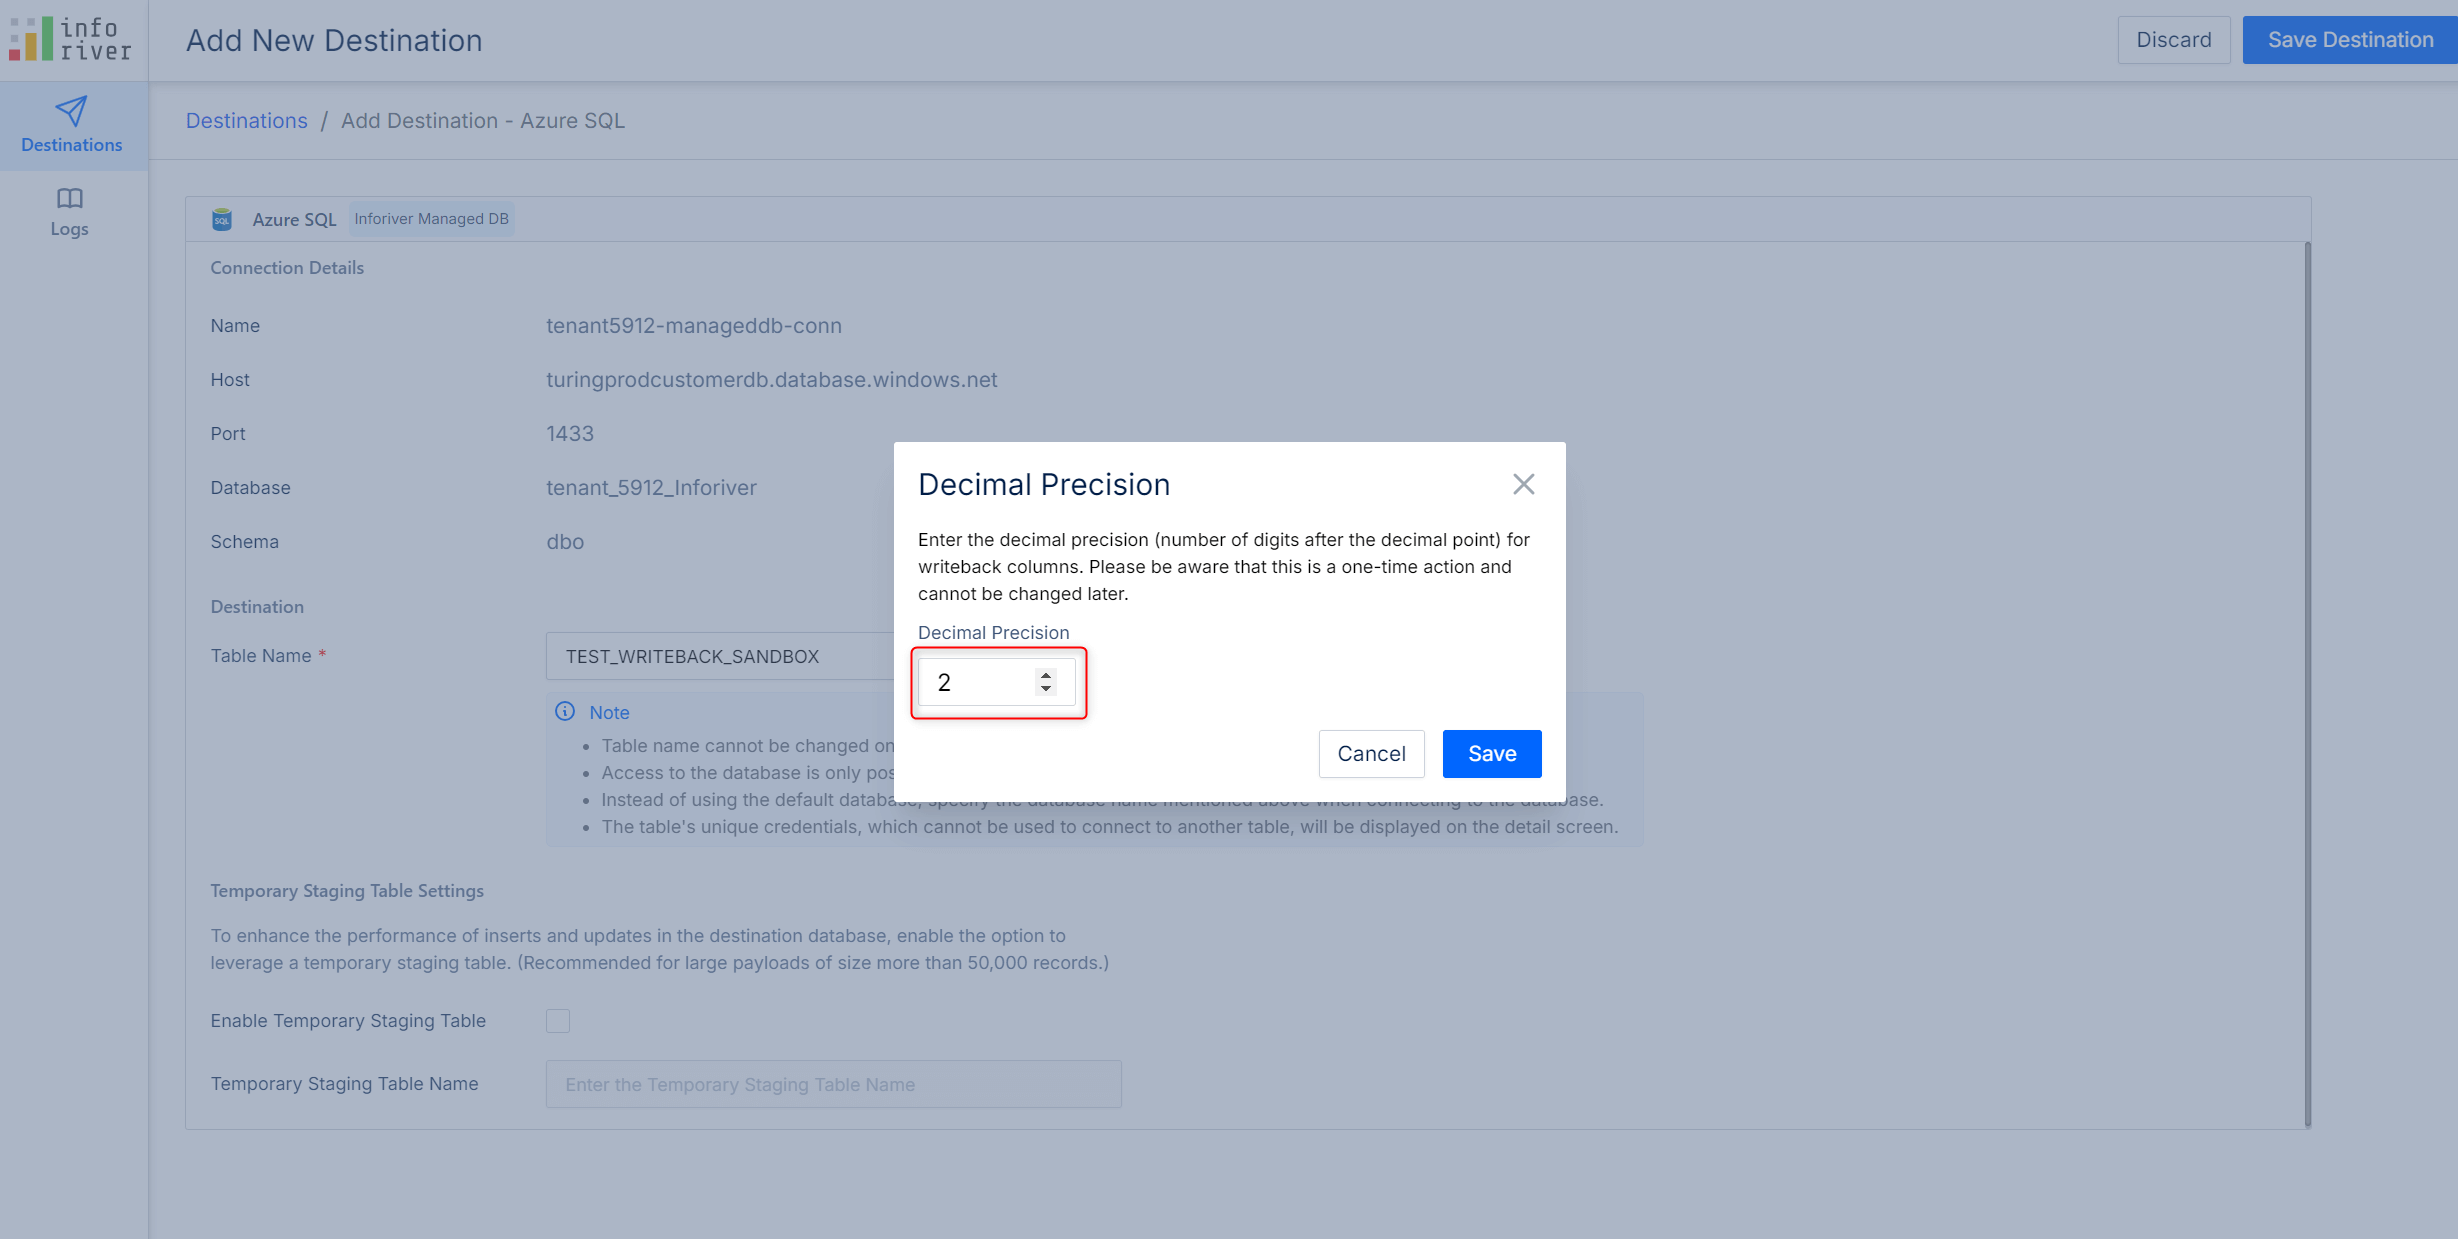
- Enter the decimal precision for measures that are written back. Values will be rounded off to the number of digits specified here.
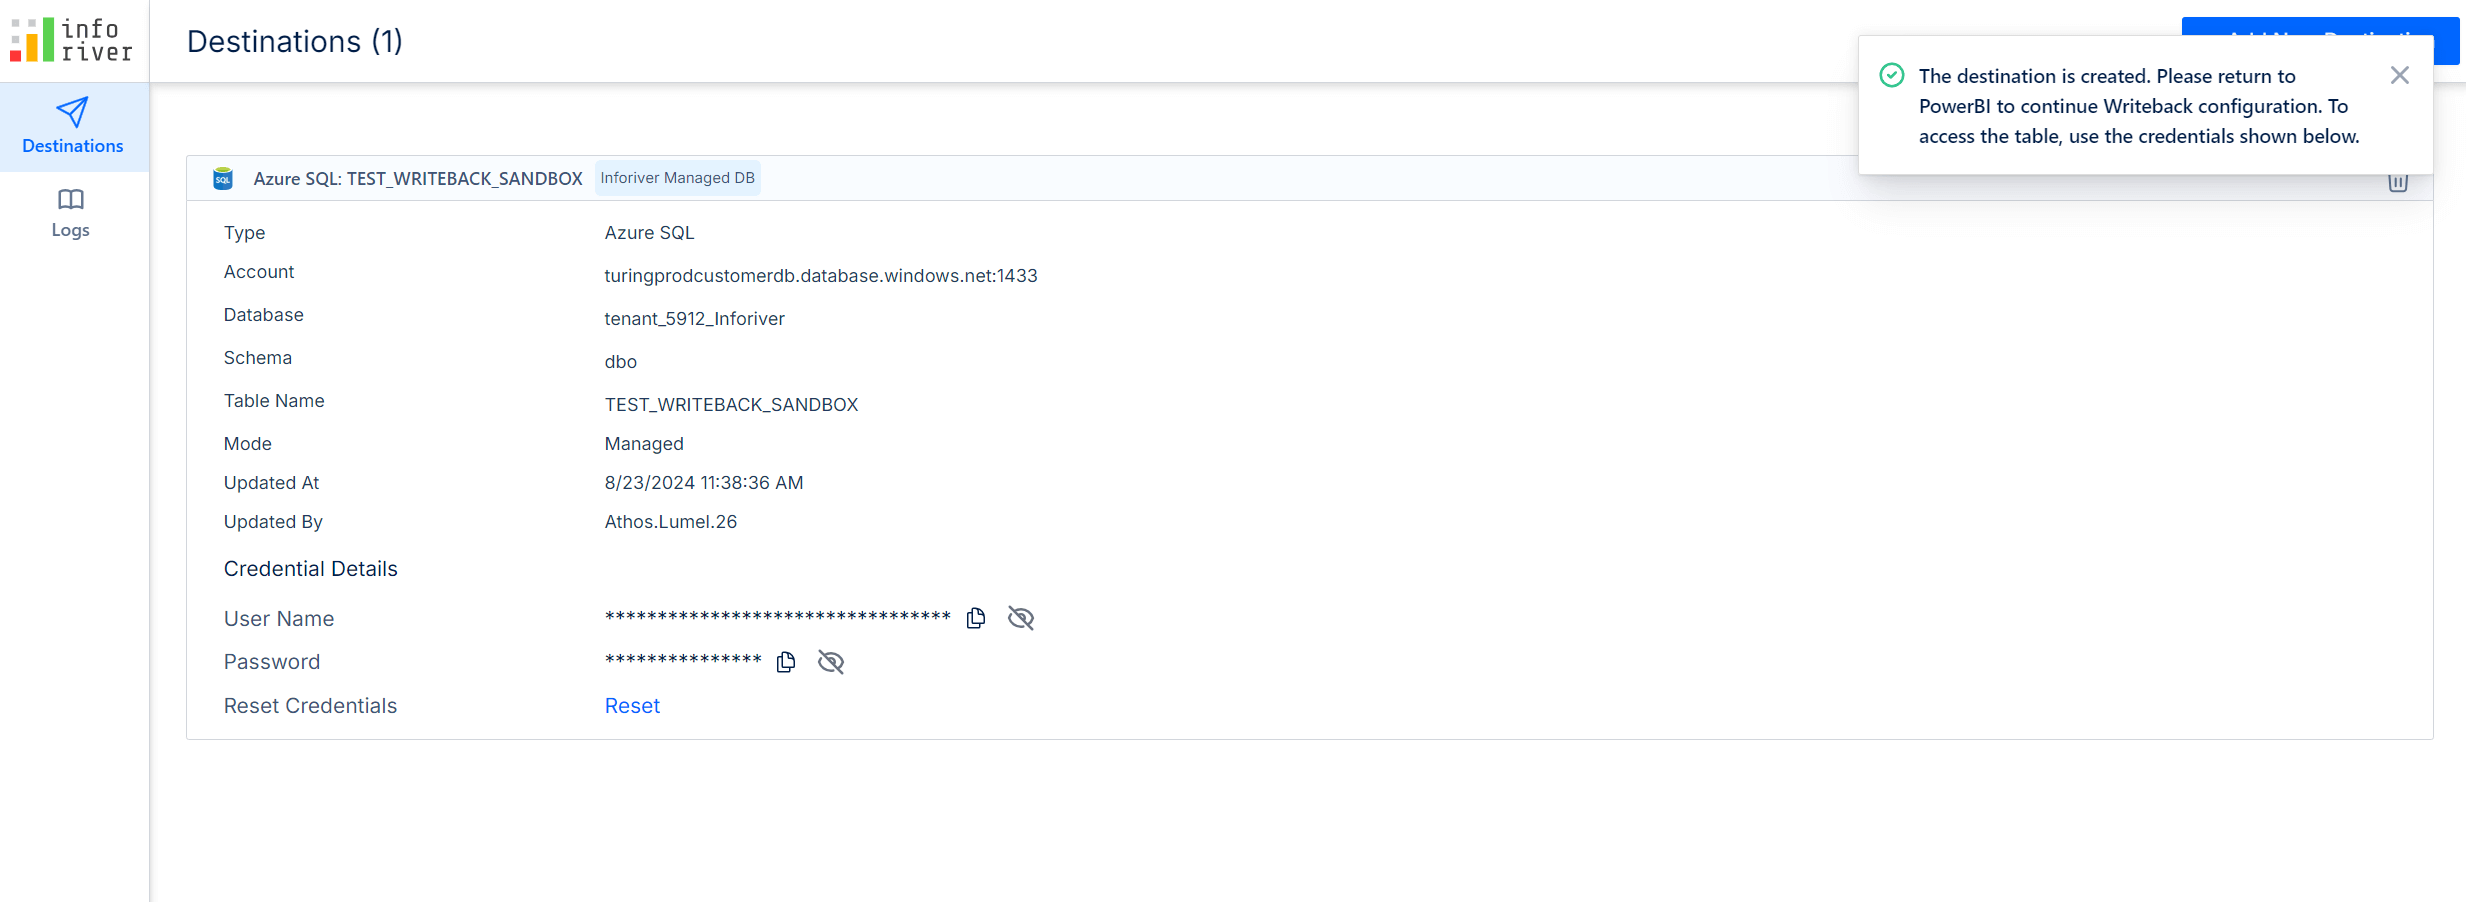
- Upon saving, it will show all the connection details to the managed DB including the database name, schema, username, and password. Click the eye with a slash icon to reveal the username and password. You can keep the connection details handy. They will be required to login to the database later and view the writeback data.
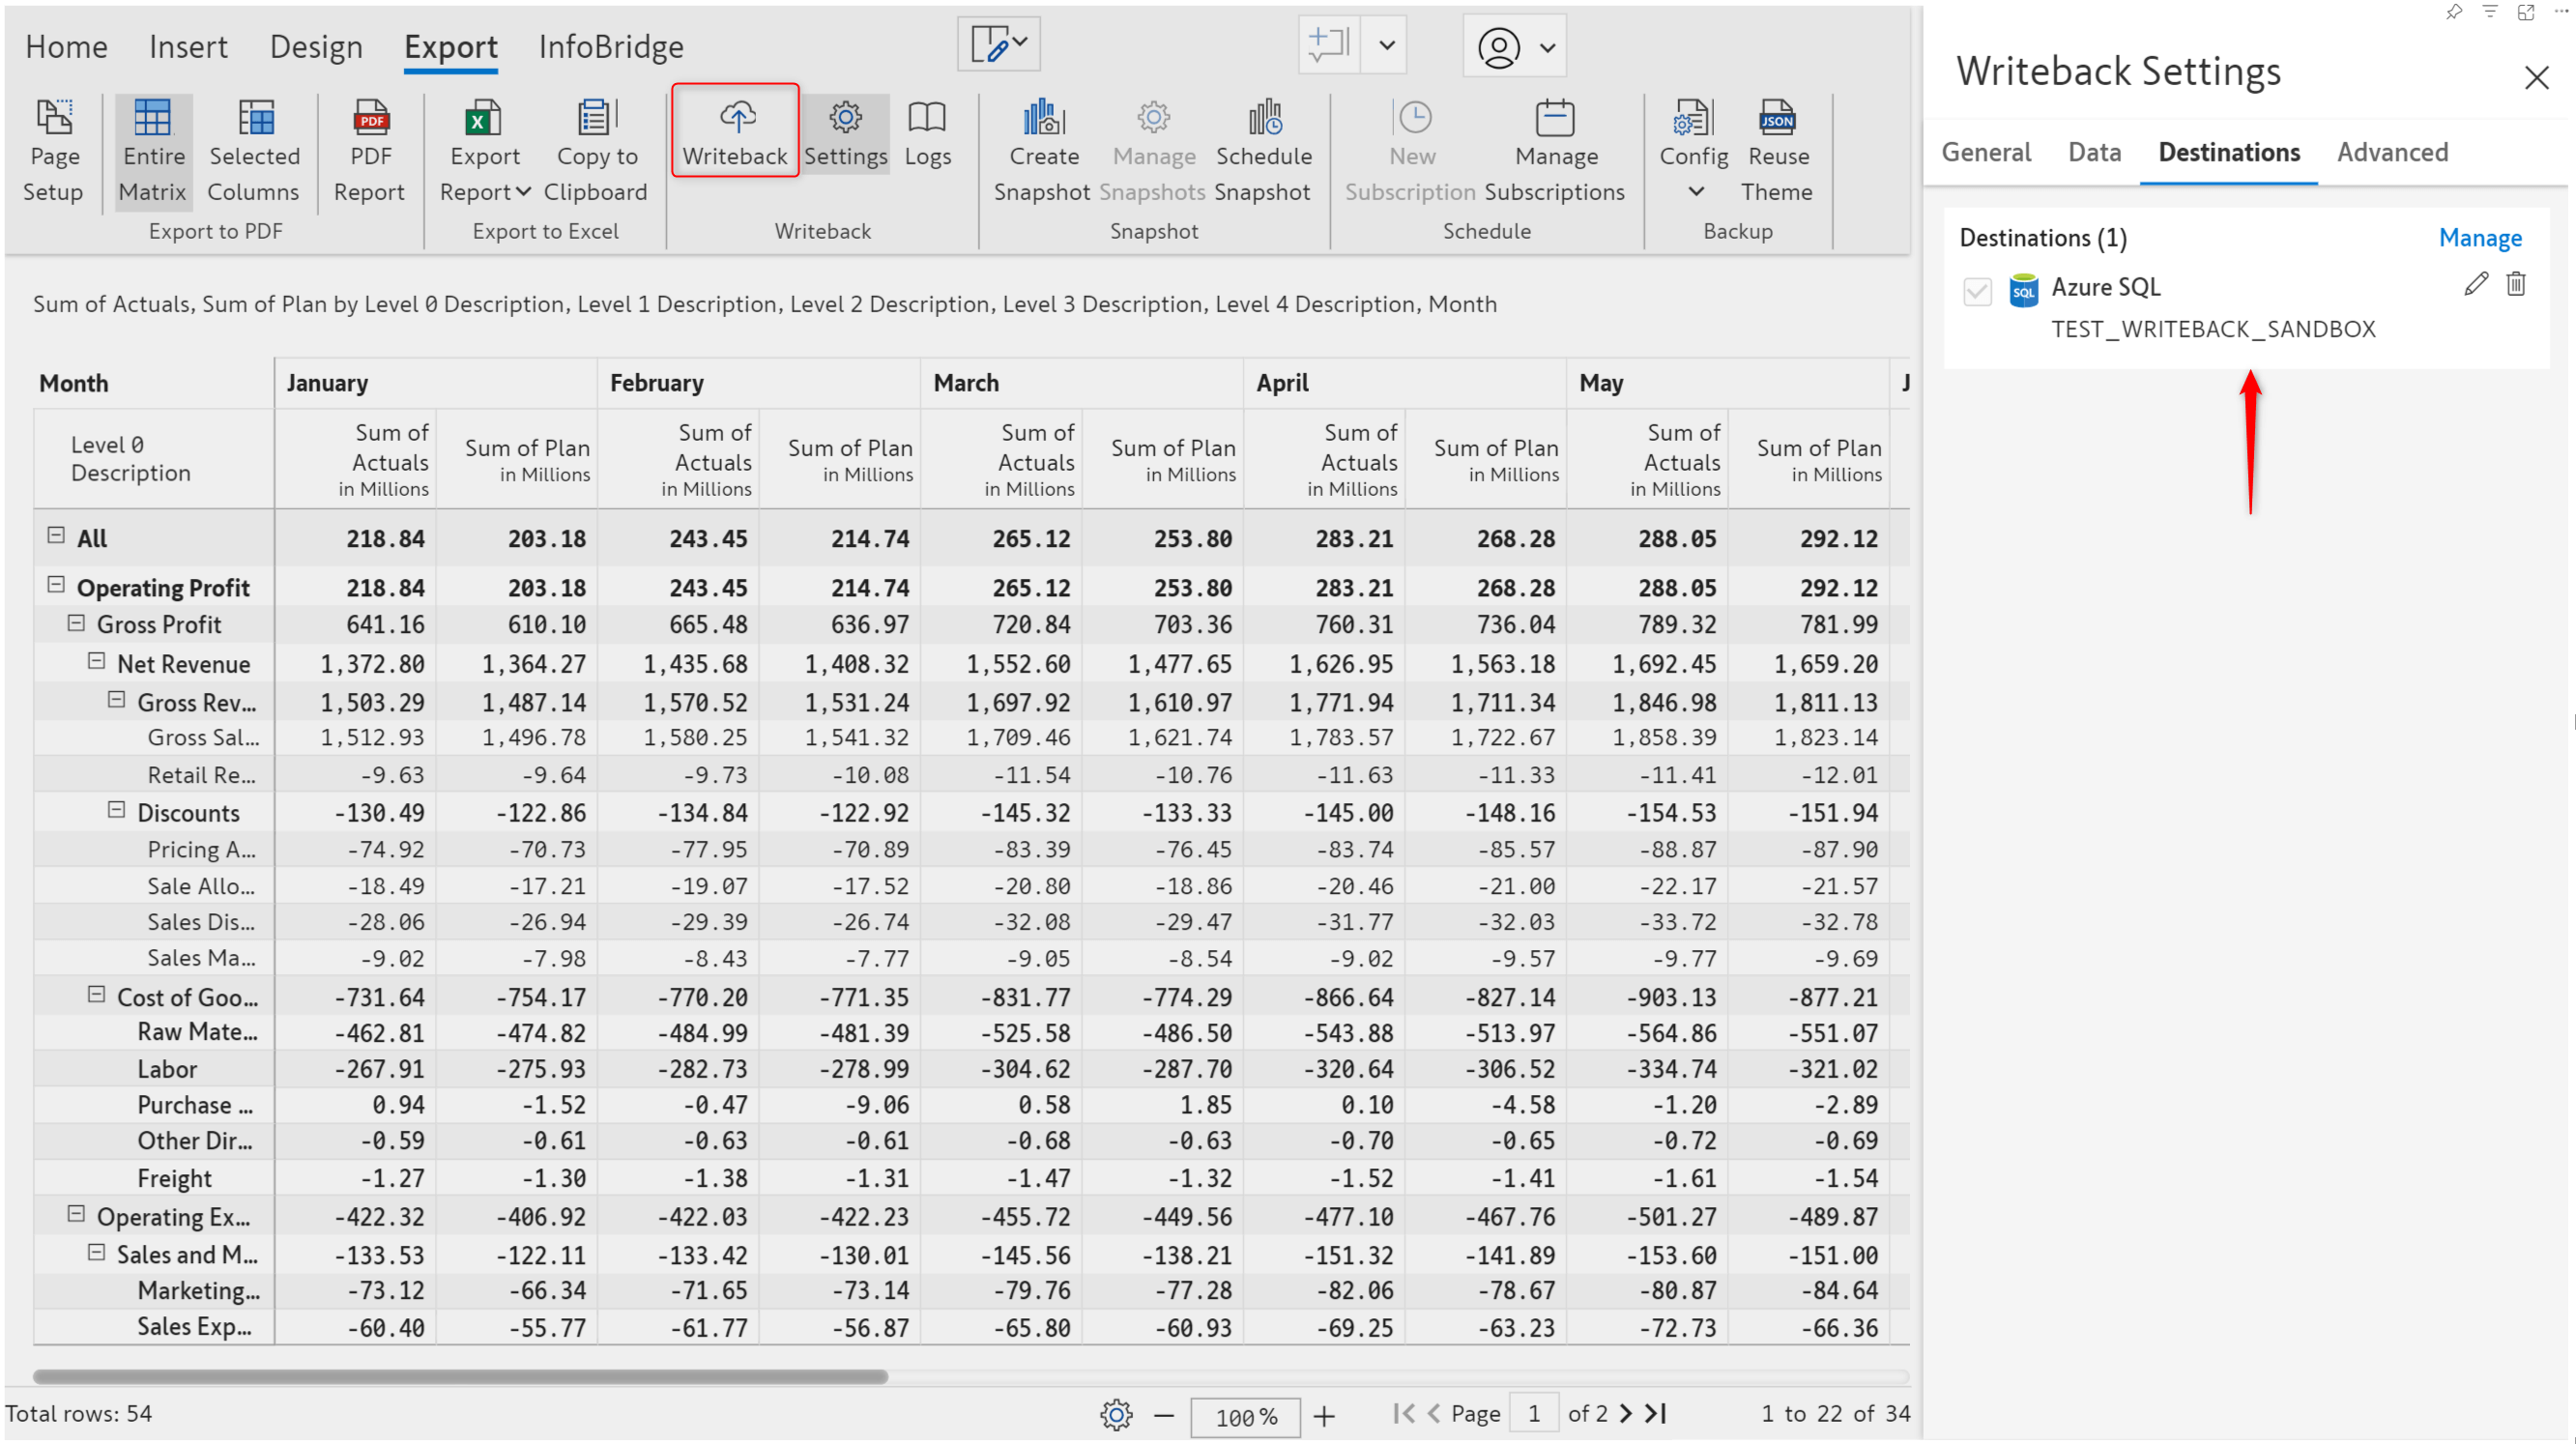
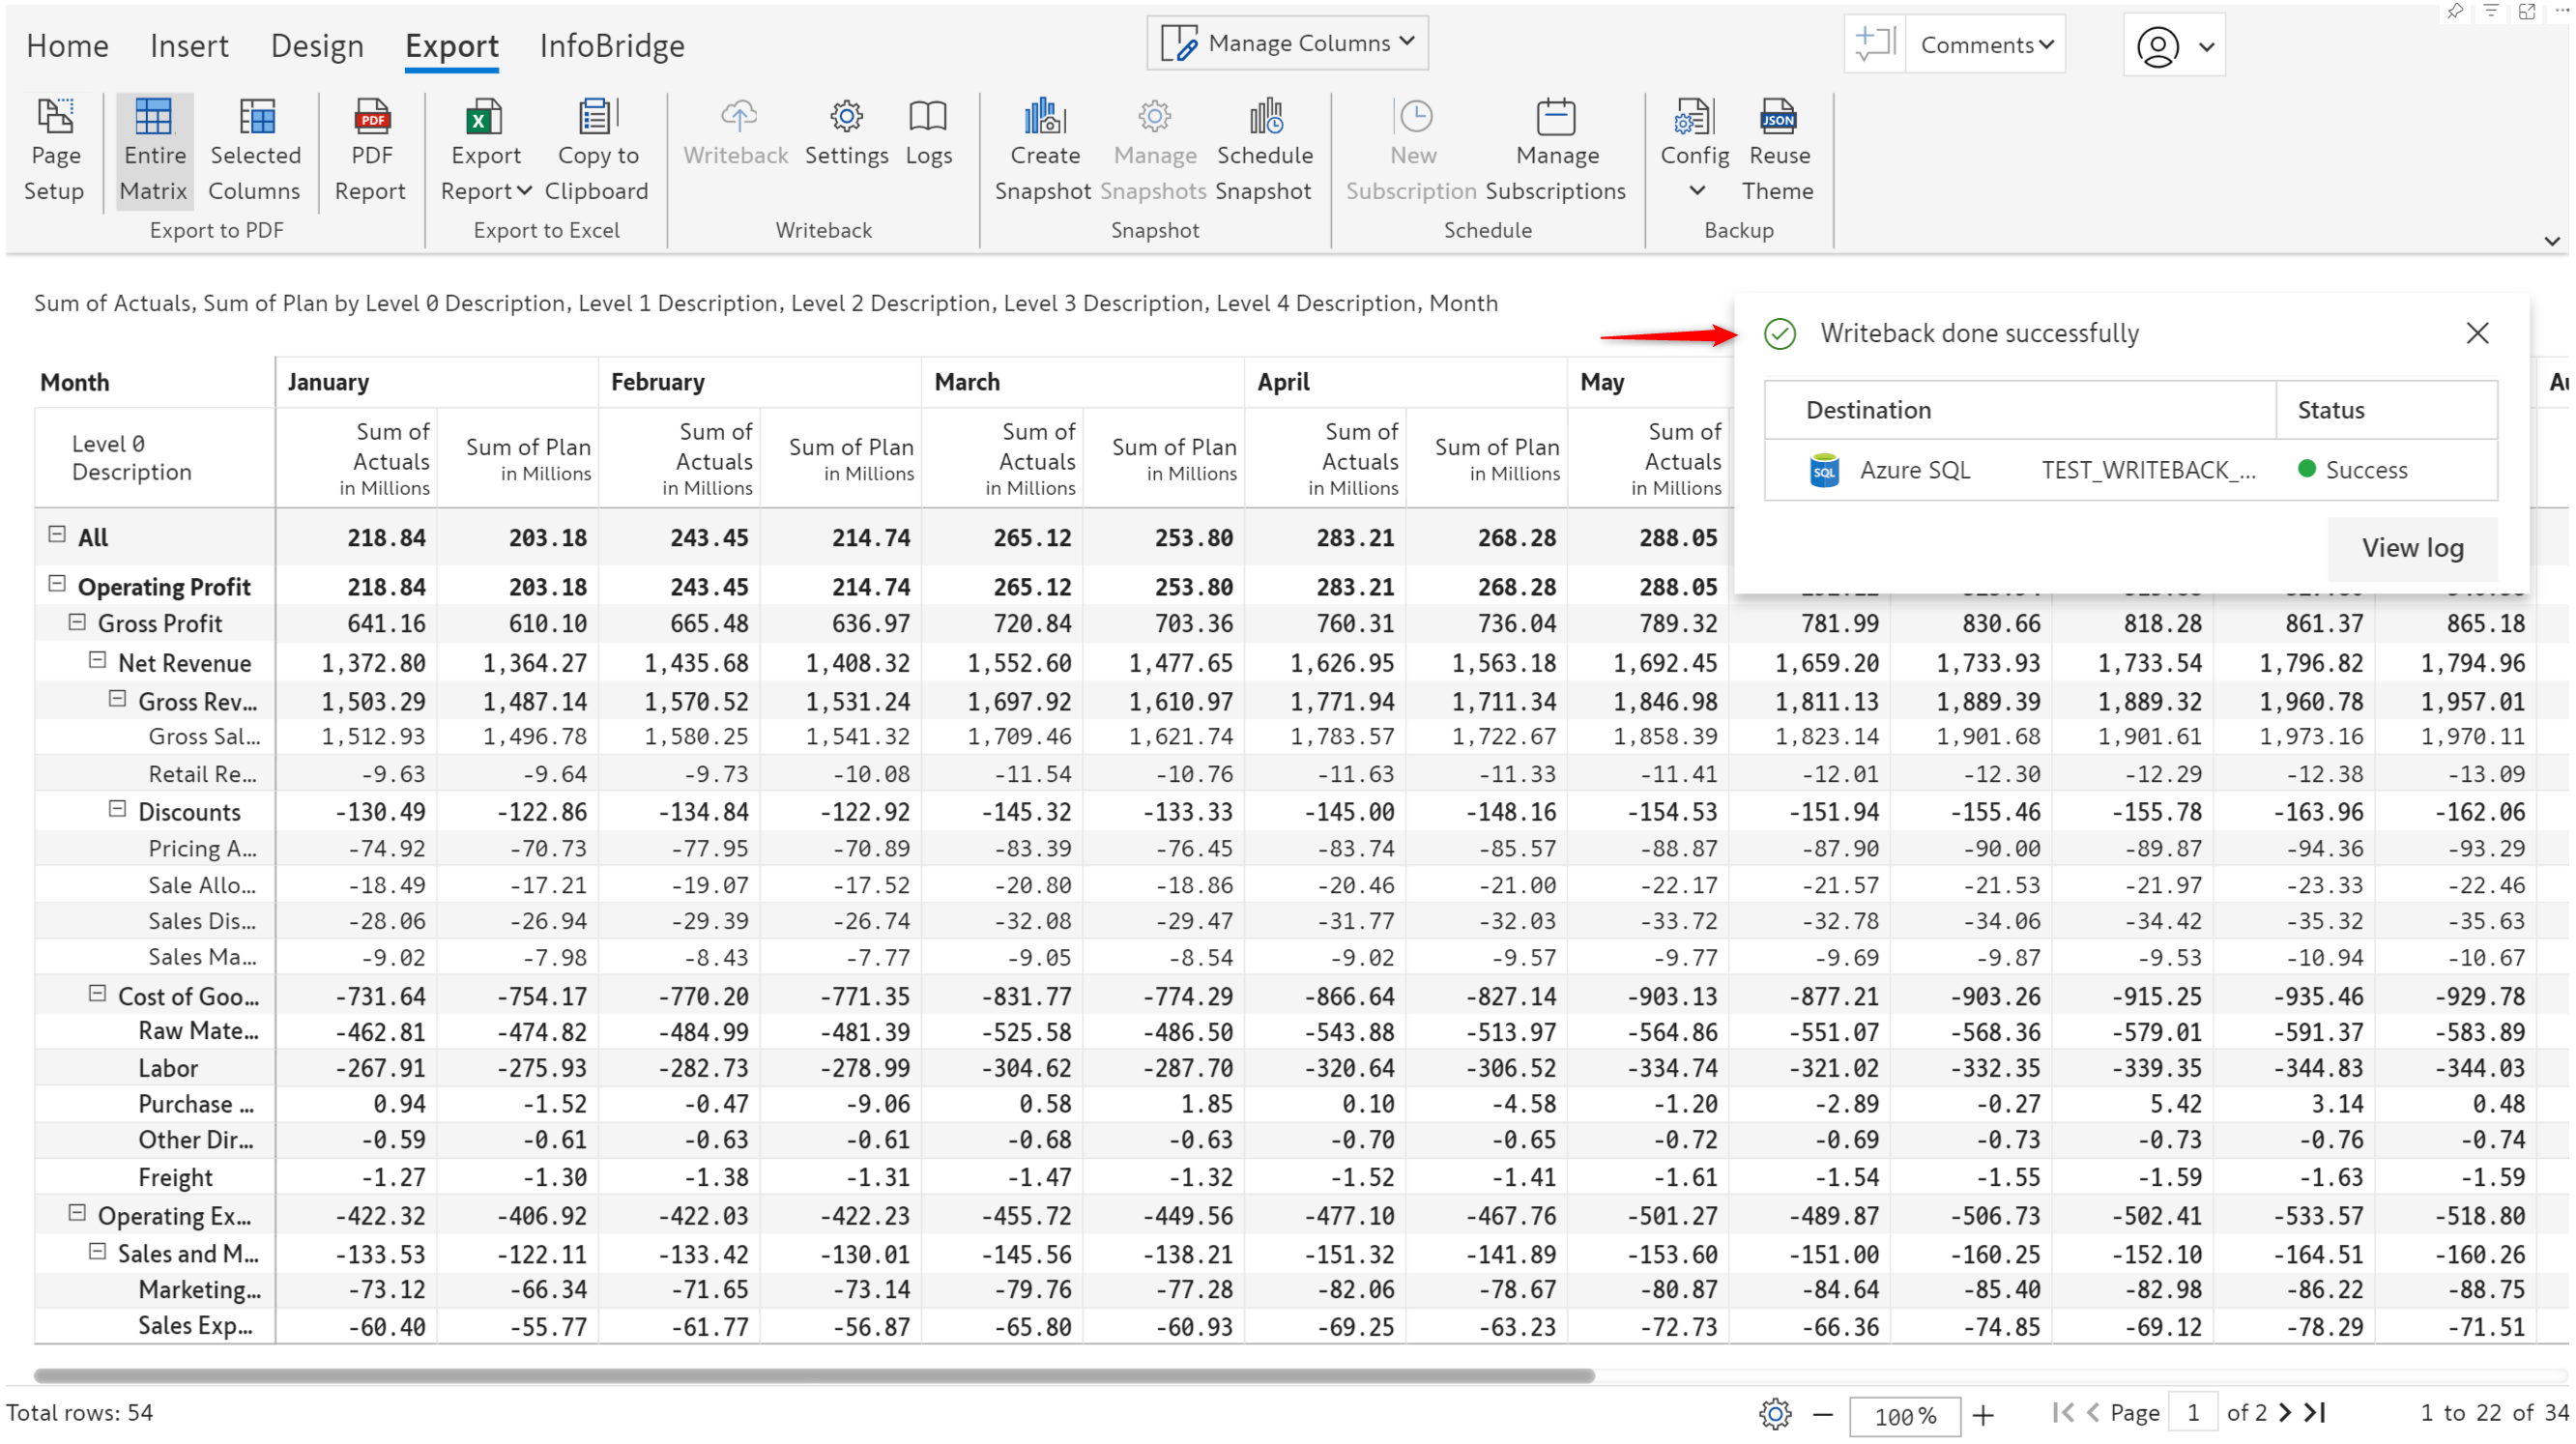
- Navigate back to the writeback matrix report. You’ll see that the Azure SQL destination you configured is now available in the Destinations tab. Click the writeback button to trigger the writeback process.
- After initiating writeback, you will see progress notifications and finally a success intimation at the top left of the page.
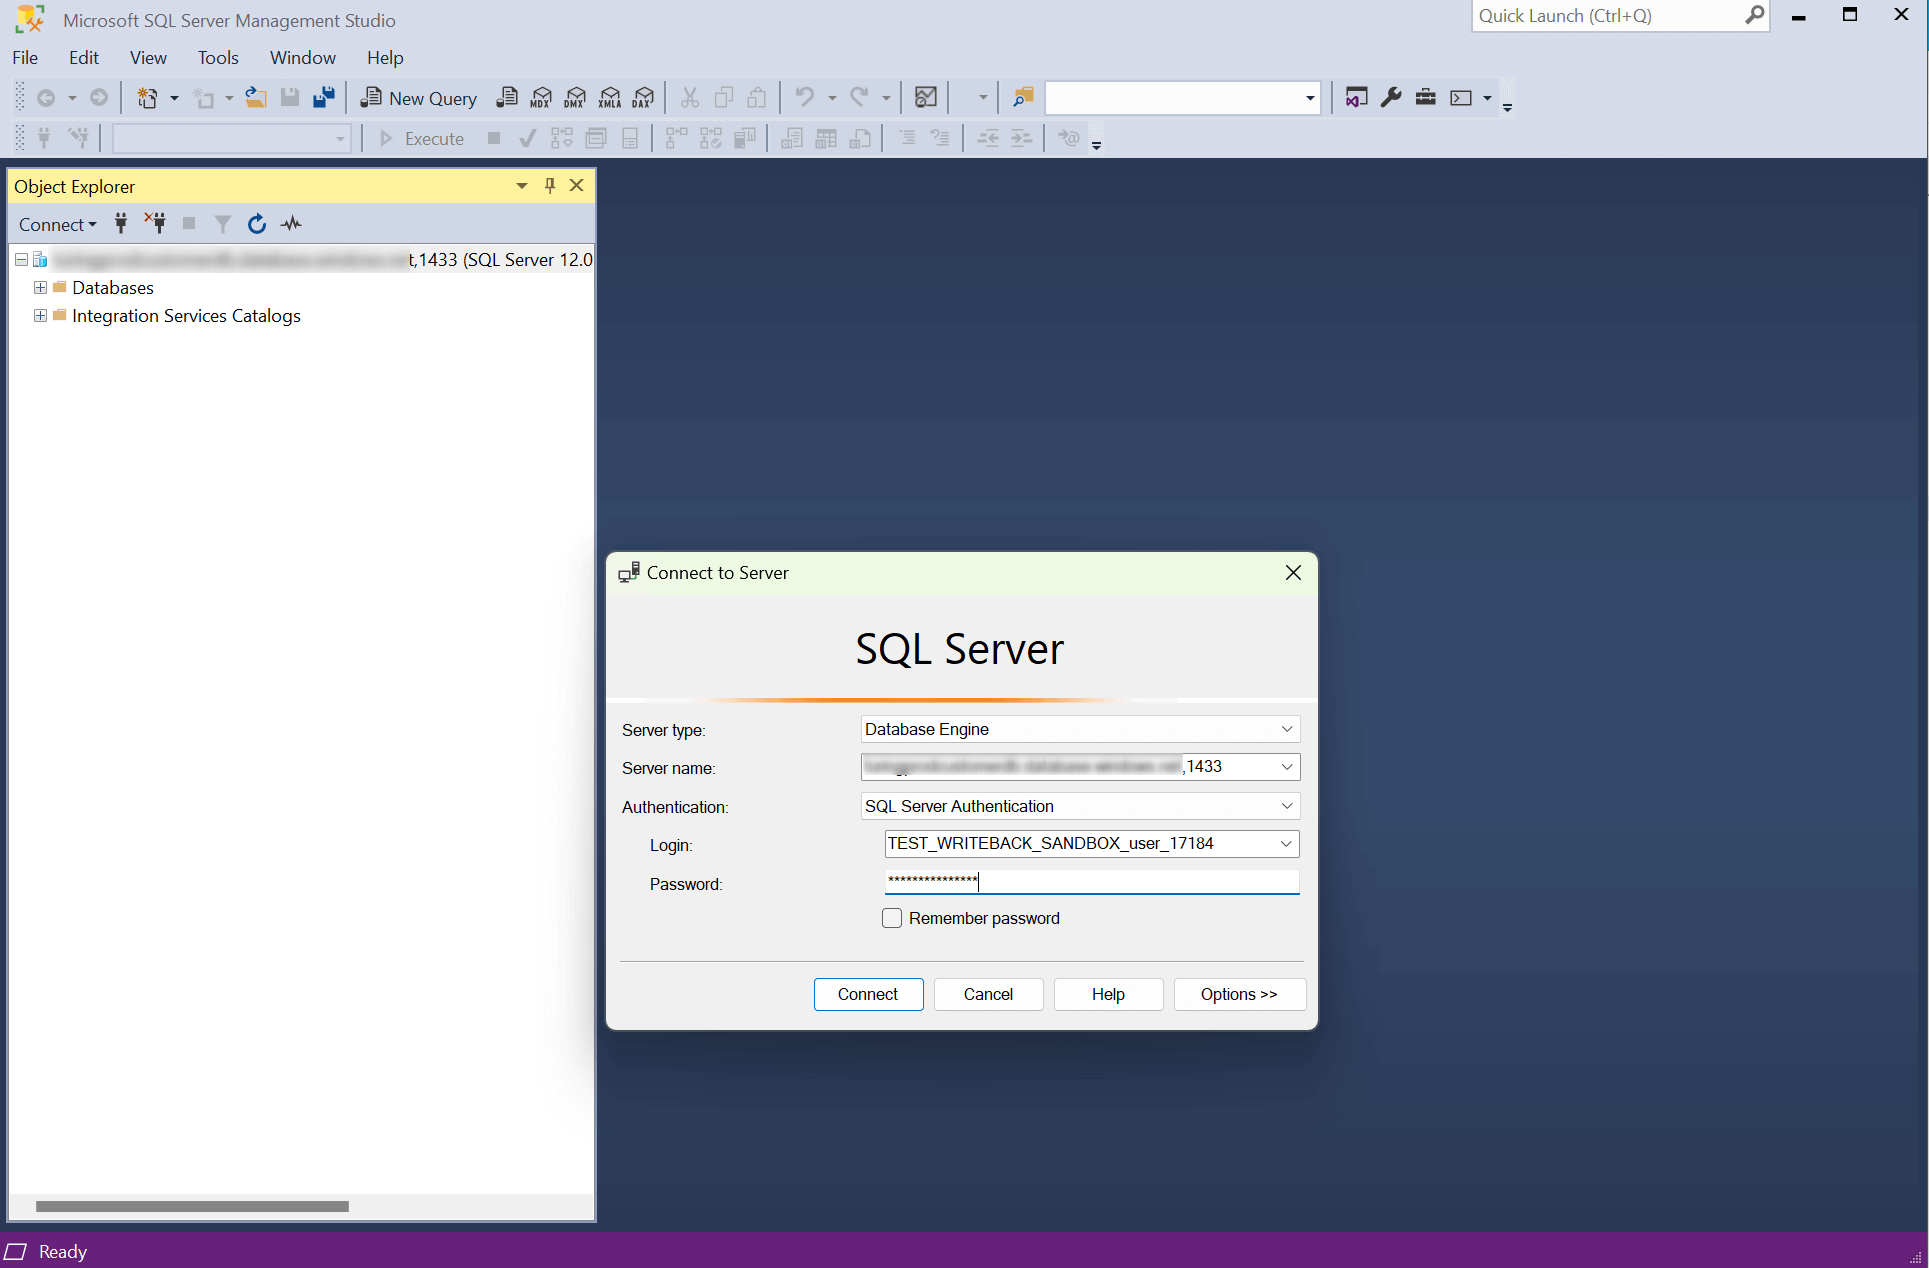
- After the writeback process is completed, you will need to login to the database to view the data that was written back.
Some of the applications you can use to connect to the Azure DB instance are listed below. You can use similar applications to query the managed DB to view and validate the writeback data.
- Power BI desktop [Open blank desktop report. Click SQL server on the toolbar. Enter respective details. Load table]
- SQL Server Management Studio
- Azure Data Studio
- DBeaver
- Use the credentials from step#5 to login. Ensure you use the database name from Step 5 while connecting and not the default database name.
The mobilitysys sandbox IDs will have access to Inforiver once the steps outlined in the onboarding section are completed. The sandbox environment will allow users to explore all the features and assess writeback performance.
You can learn more about the capabilities Inforiver offers from the Inforiver product documentation. You can reach us here if you need assistance or have any questions.
