Upcoming webinar on 'Inforiver Charts : The fastest way to deliver stories in Power BI', Aug 29th , Monday, 10.30 AM CST. Register Now
Upcoming webinar on 'Inforiver Charts : The fastest way to deliver stories in Power BI', Aug 29th , Monday, 10.30 AM CST. Register Now

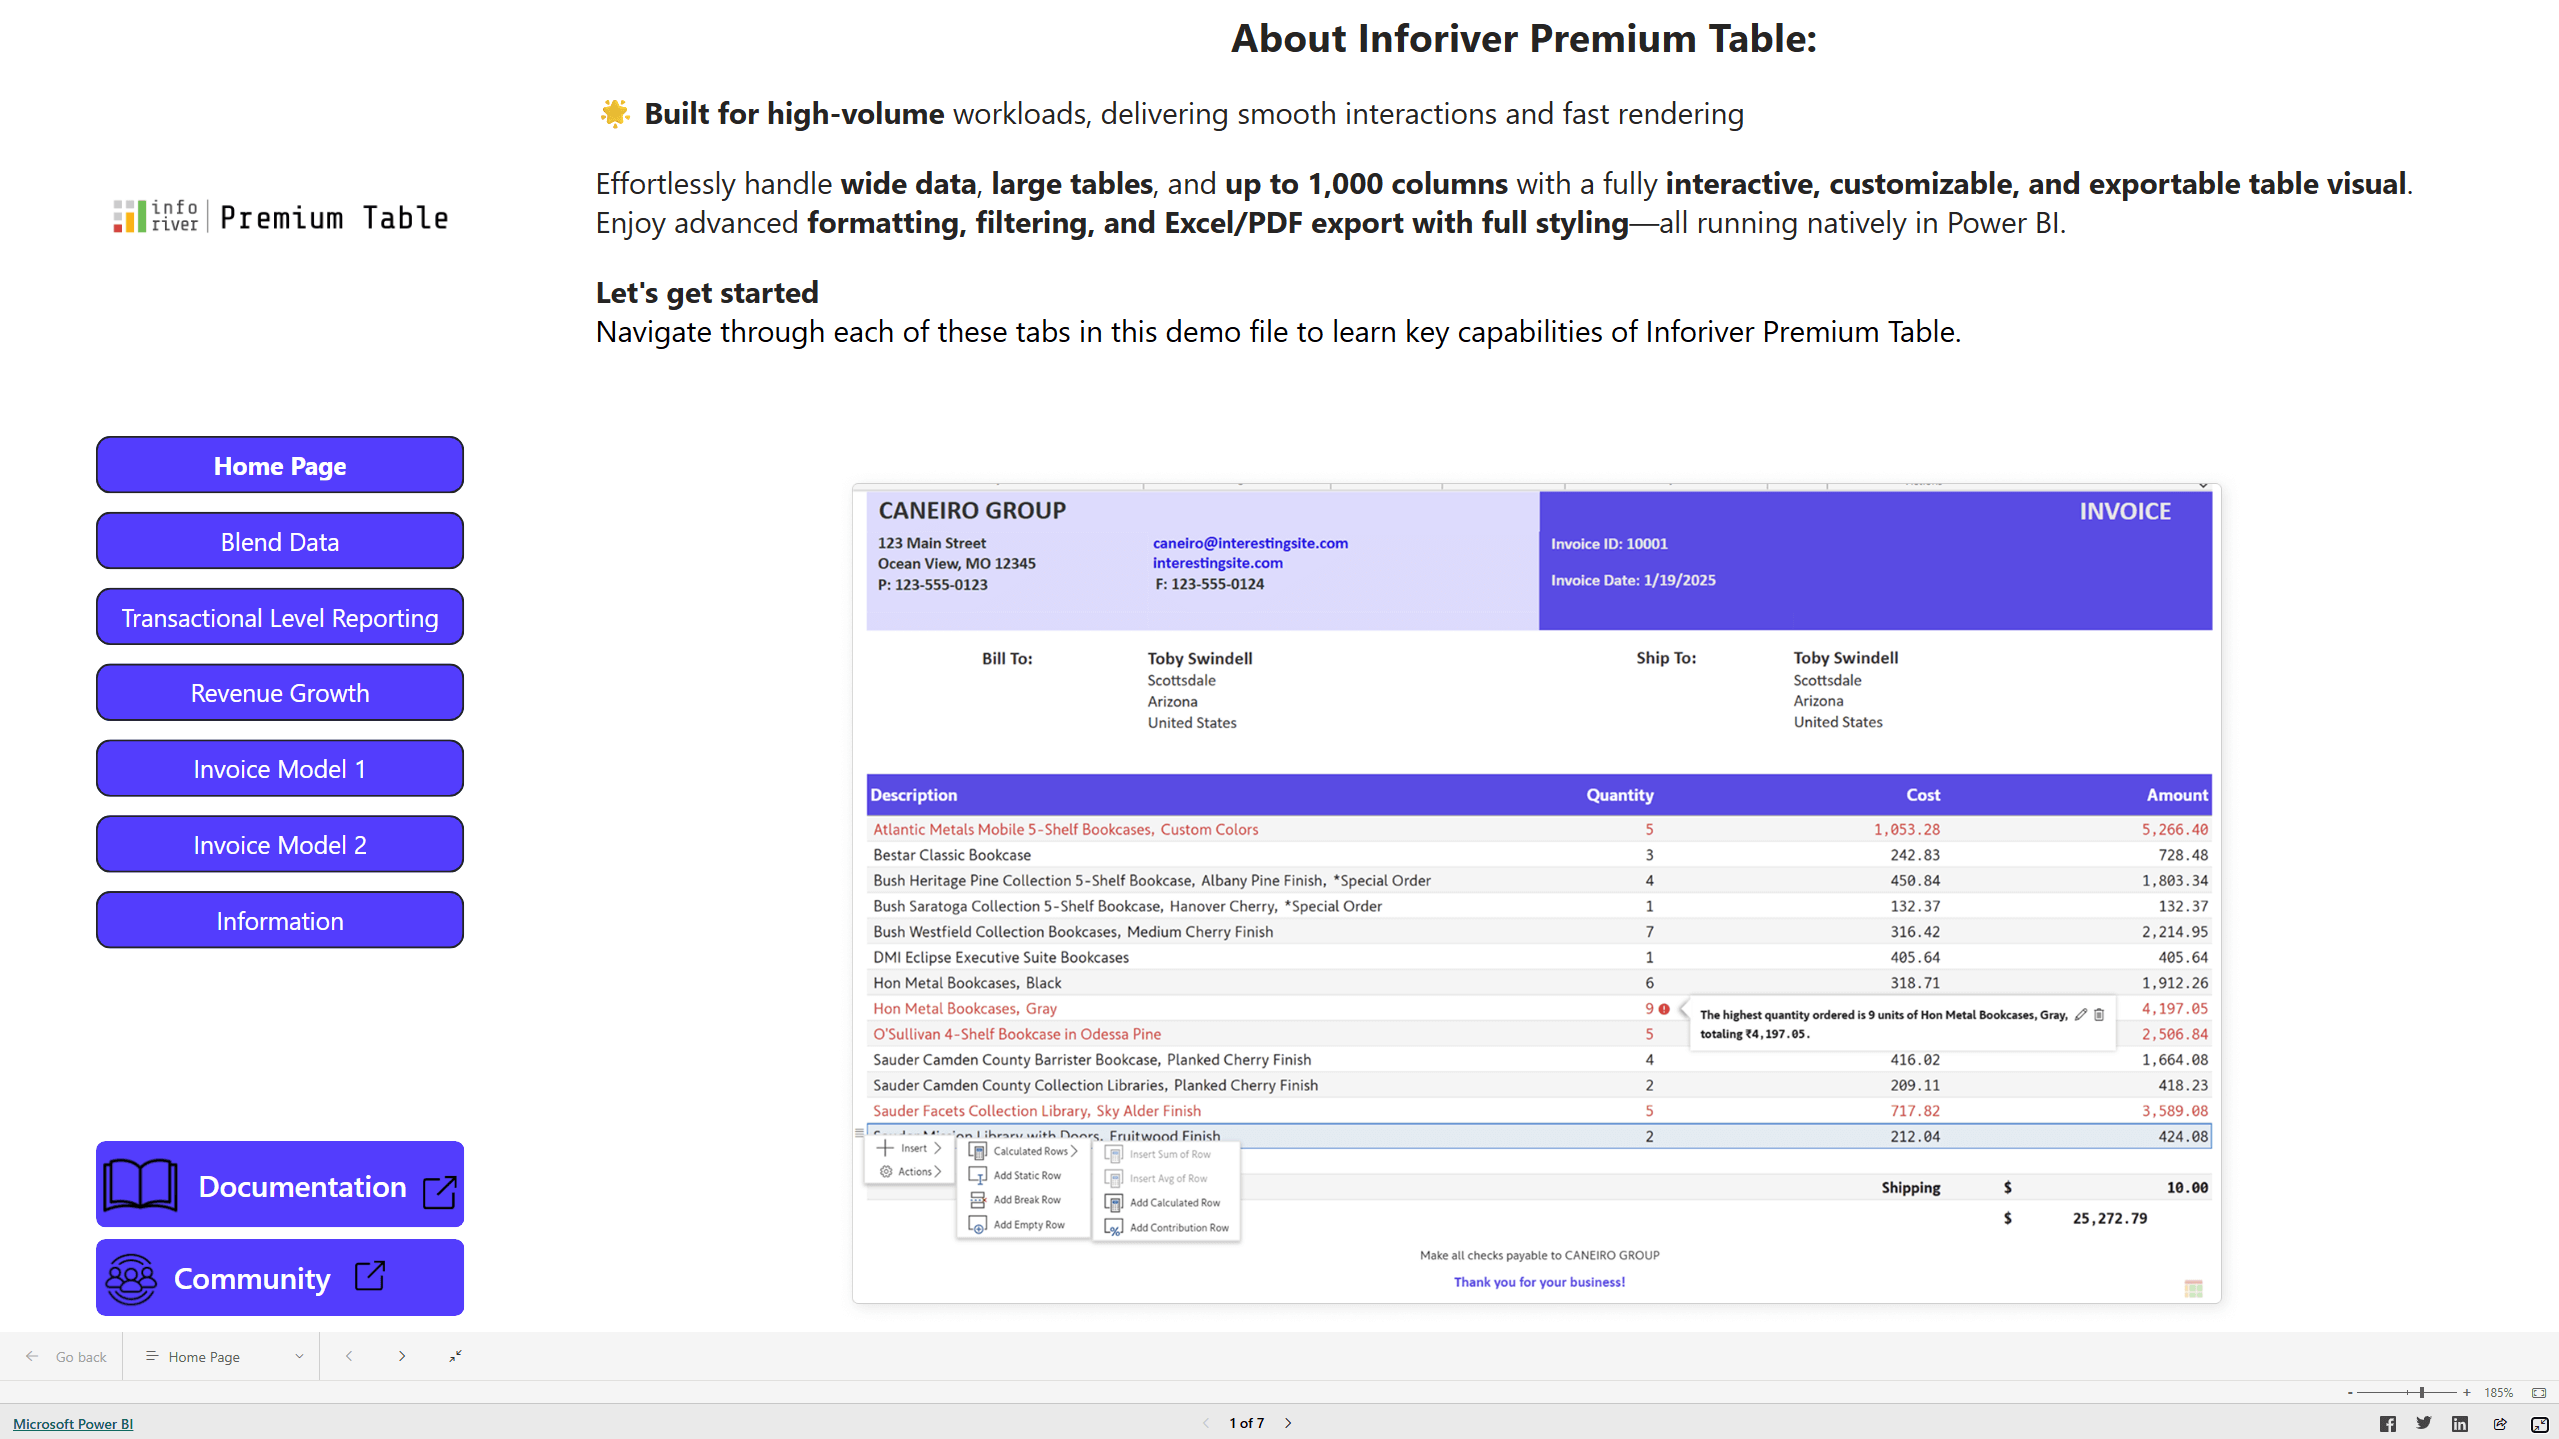
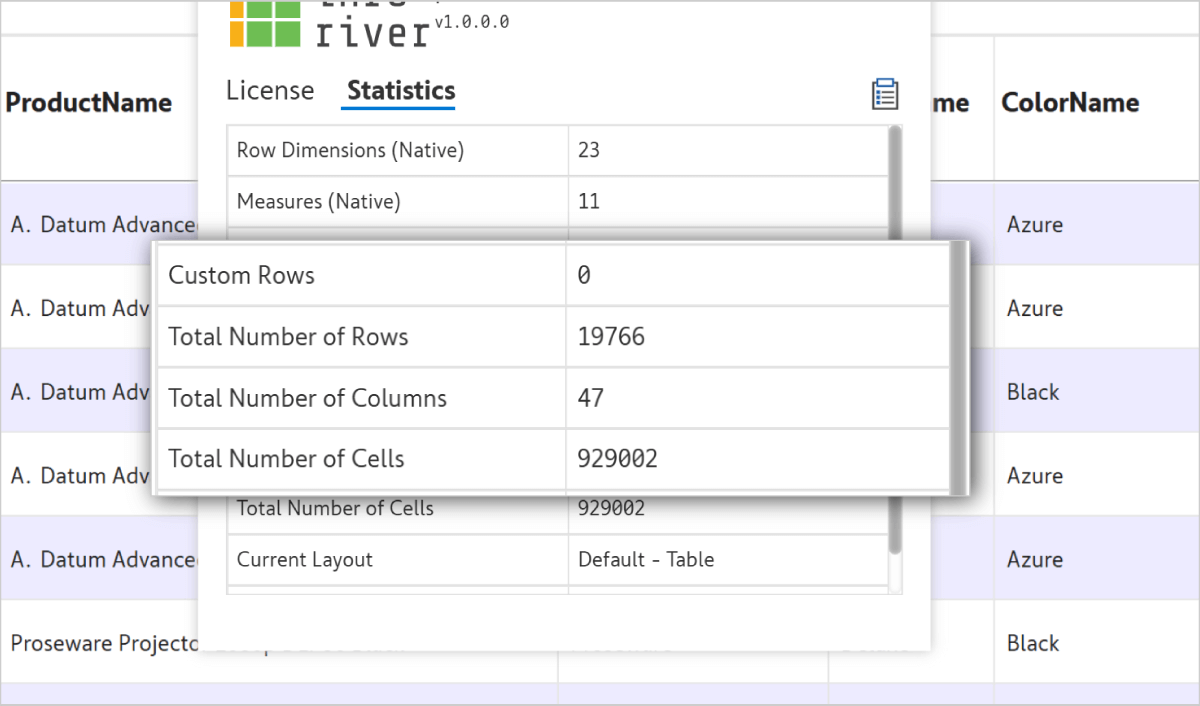
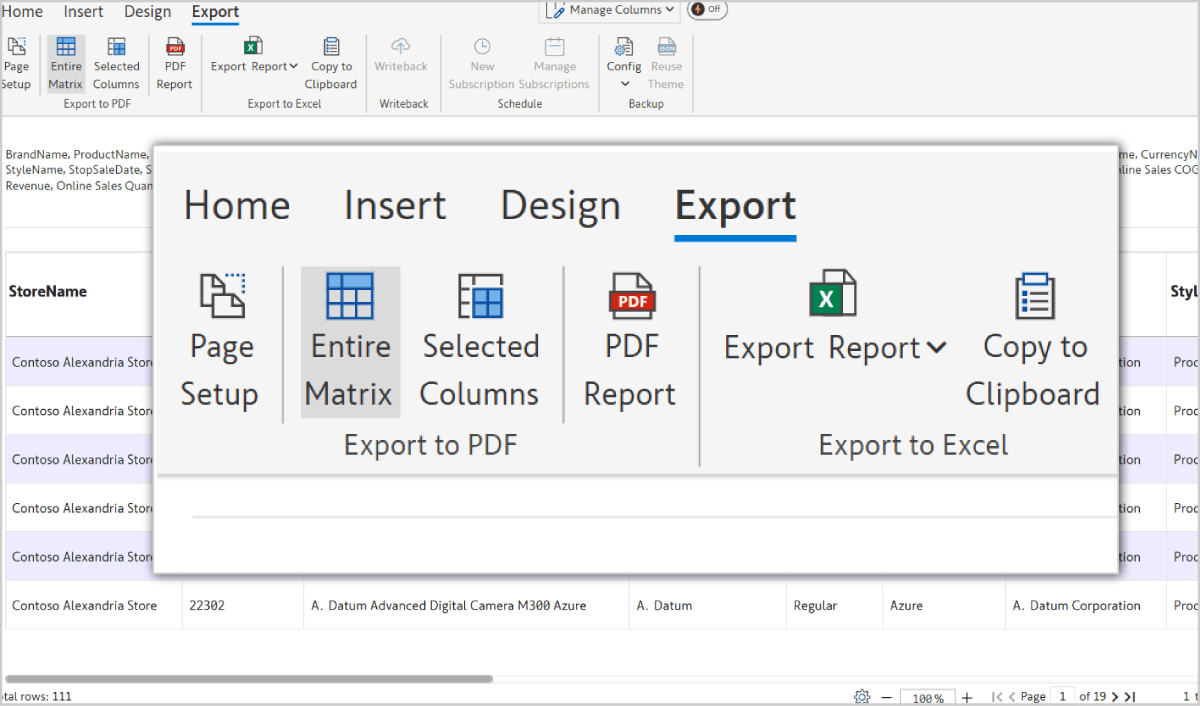
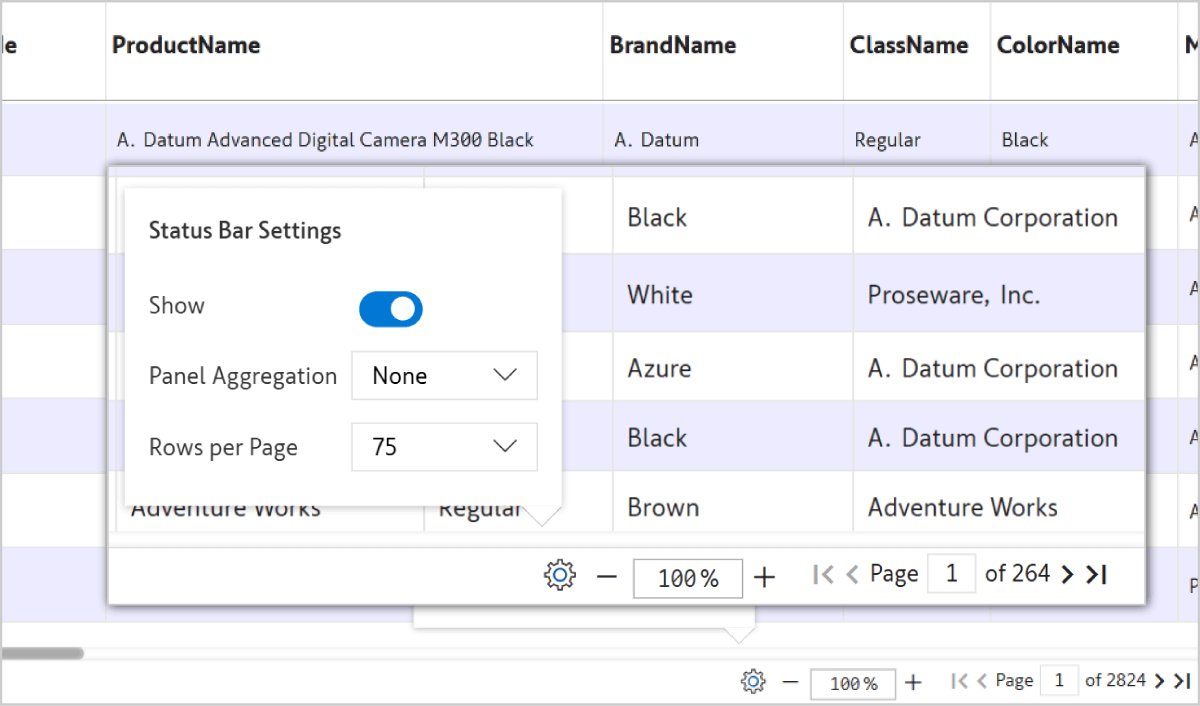
Inforiver Premium Table | Inforiver Reporting Matrix |
|---|---|
| Handle tables with extensive combinations of rows and columns | Better for Hierarchical or cross-tabular reporting like pivot table (e.g., Region > Country > State > City) |
| Flat/tabular reports without hierarchies | Pivot-style views with measures across columns |
| Detailed views for transactions or line items (e.g., invoice lists, P&L lines) | Dynamic aggregation across categories |
| Display multiple KPIs/metrics side by side | Compact matrix-style layout for multi-dimensional analysis |
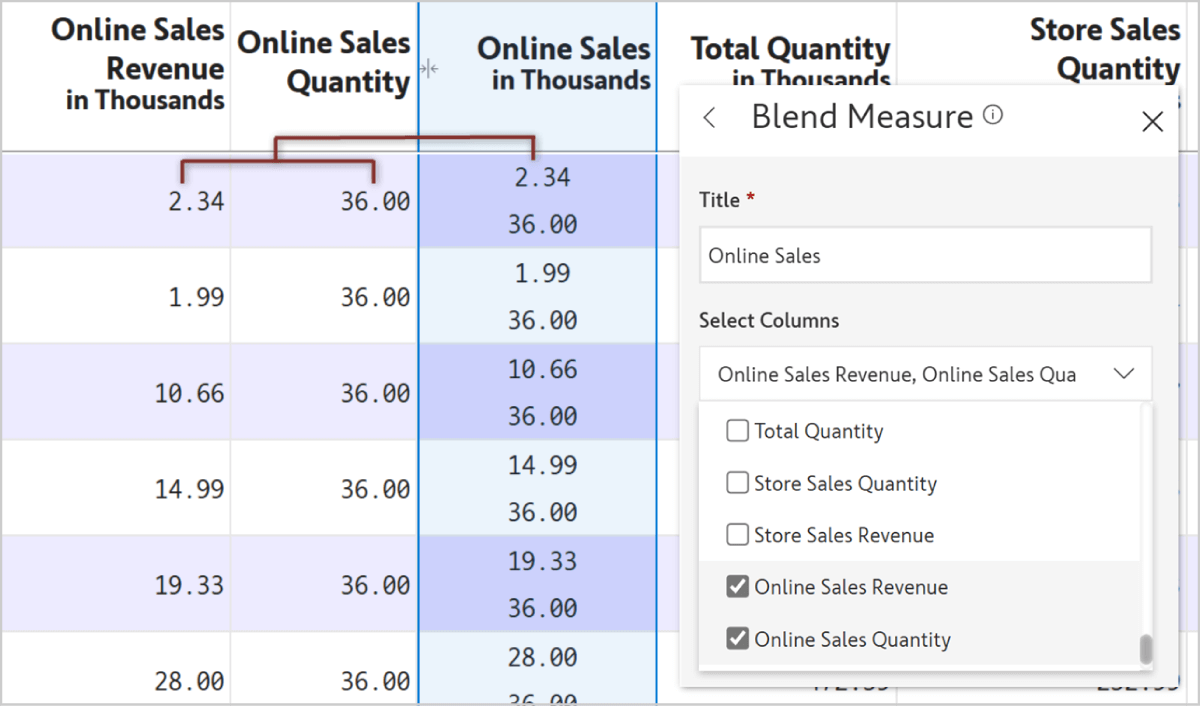
| Blend multiple fields into one smart cell | Ideal for rolling forecasts, budget tracking, and financial planning |


Inforiver helps enterprises consolidate planning, reporting & analytics on a single platform (Power BI). The no-code, self-service award-winning platform has been recognized as the industry’s best and is adopted by many Fortune 100 firms.
Inforiver is a product of Lumel, the #1 Power BI AppSource Partner. The firm serves over 3,000 customers worldwide through its portfolio of products offered under the brands Inforiver, EDITable, ValQ, and xViz.