
Upcoming webinar on 'Inforiver Charts : The fastest way to deliver stories in Power BI', Aug 29th , Monday, 10.30 AM CST. Register Now
Upcoming webinar on 'Inforiver Charts : The fastest way to deliver stories in Power BI', Aug 29th , Monday, 10.30 AM CST. Register Now
Effective report delivery is crucial for ensuring that data insights reach stakeholders promptly, enabling informed decision-making. From dashboards for executives to detailed operational reports, delivery methods align data with business goals.
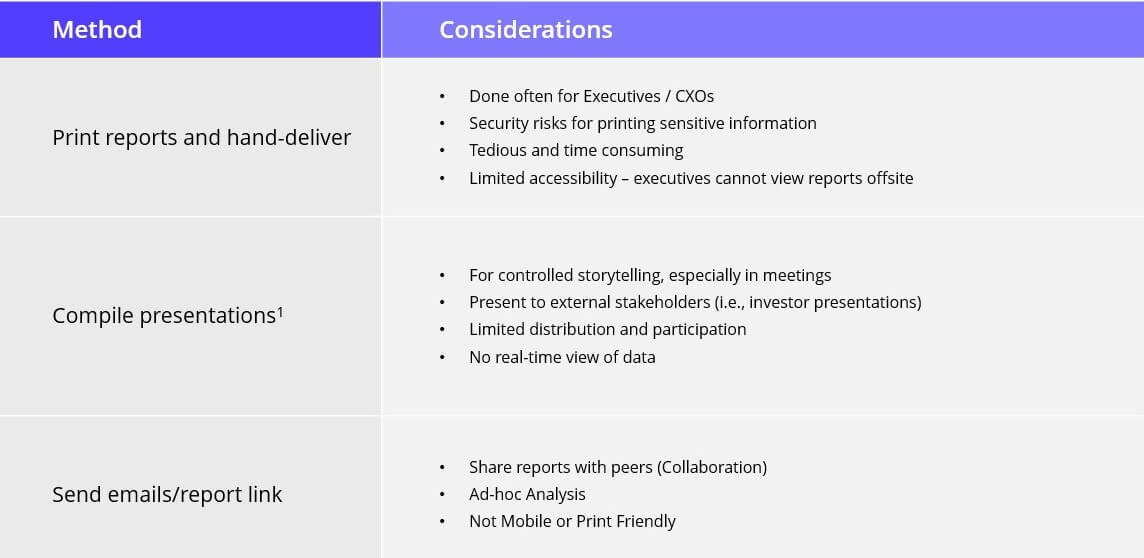
The most familiar method of report delivery is publishing a report to a designated portal or service. In this approach, the report is accessible online, and intended recipients, such as team members or stakeholders, can log in to view it. This centralized access point ensures that everyone views the same, up-to-date version of the report at their convenience.
In addition to portal publishing, other methods are also commonly used for report distribution. Each method has unique advantages and is suited to specific business needs. Some of these include:
Automated report delivery offers significant advantages that streamline the reporting process, making it more accessible, efficient, and scalable. Here are four primary benefits of automating report delivery:
Automated report delivery thus transforms reporting by accommodating a wide range of organizational needs.
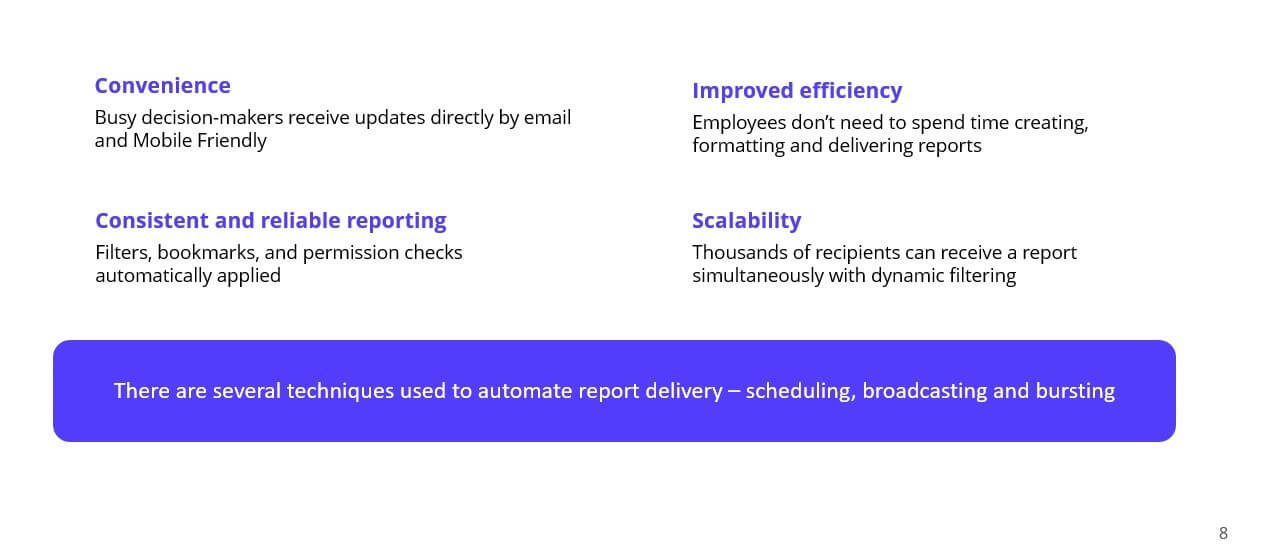
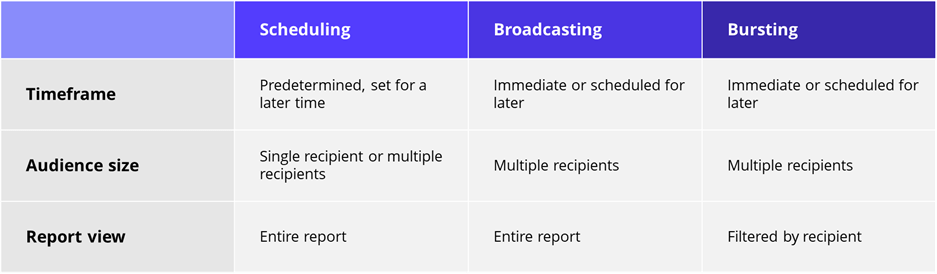
Three key techniques used for automating report delivery are scheduling, broadcasting, and bursting. While these terms are often used interchangeably, each approach offers distinct advantages and serves unique use cases.
Scheduling
Scheduling is the simplest of the three. With scheduling, a report is delivered at a pre-set time in the future. This can be a one-time delivery or a recurring schedule, depending on business needs. For example, a weekly sales report might be scheduled to be sent to the VP of Sales every Monday at 8:00 AM.
Broadcasting
Broadcasting involves sending a single report to multiple recipients simultaneously. It allows for easy scalability as one report reaches many stakeholders at once. Unlike scheduling, broadcasting can happen immediately or be set for a later time. An example of broadcasting might be a quarterly financial report that needs to reach hundreds of stakeholders and investors.
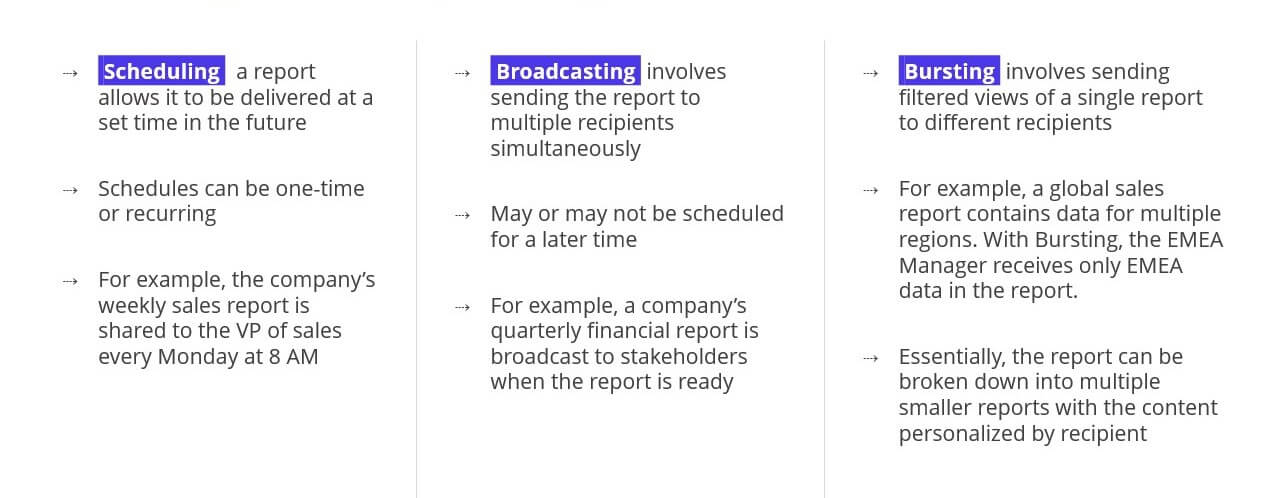
To summarize and compare these three techniques:
In this chapter, we will explore how Power BI implements scheduling, broadcasting, and bursting through its native scheduling capabilities. These methods help deliver reports to stakeholders automatically, based on predefined schedules or user needs.
Power BI also supports API-driven schedules triggered by Power Automate workflows. This feature enhances flexibility, allowing both standard and dynamic subscriptions for paginated reports with additional options for file formats and delivery destinations, making it easier to meet diverse reporting requirements.
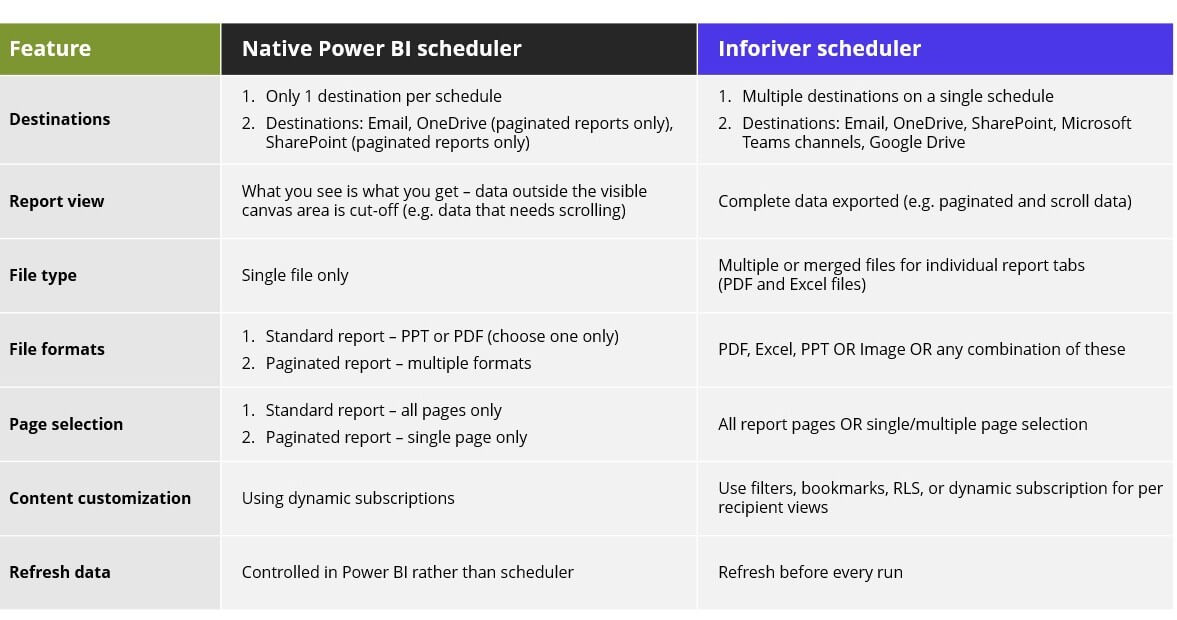
Let us now compare the features of the native Power BI scheduler with the Inforiver scheduler across a few key aspects.
In this chapter, we explore the Inforiver Scheduler, designed to automate Power BI report delivery with features like personalized schedules, multiple export formats, and advanced filtering. These capabilities ensure accurate and timely distribution, simplifying report management and improving efficiency.
Self-service and No-code: Designed for Business Users
The Inforiver Scheduler is designed to be self-service and low-code, with a user-friendly interface tailored for casual business users. It allows users to create, manage, and administer schedules with just a few clicks, minimizing or even eliminating dependency on IT support.
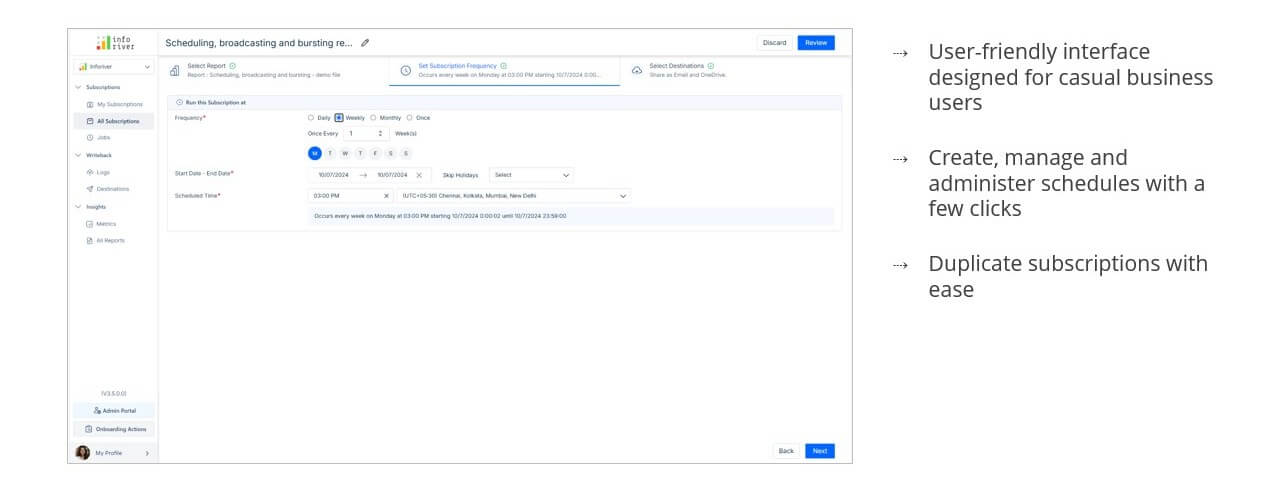
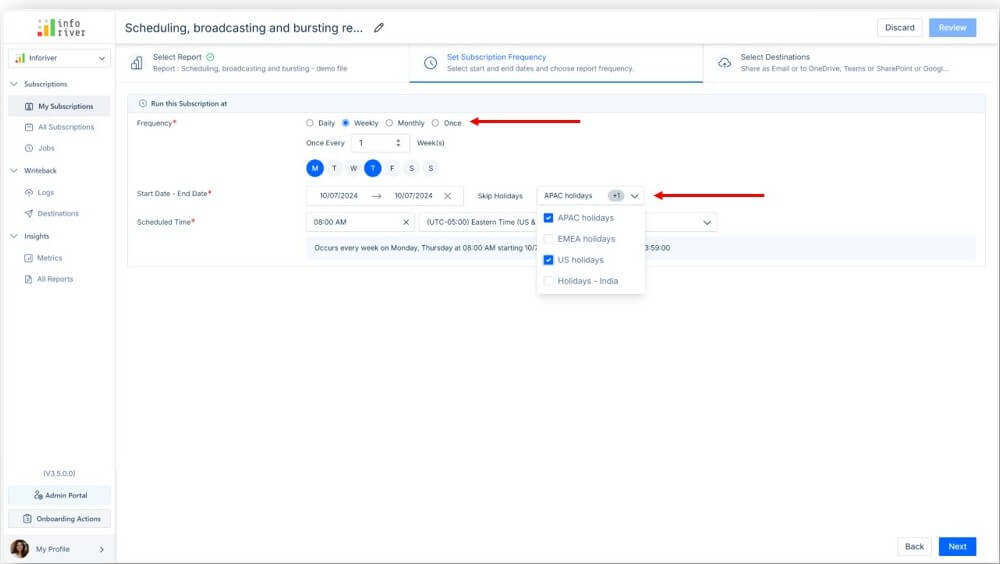
Create One-Time and Flexible Recurring Schedules
The Inforiver Scheduler allows you to create both one-time and flexible recurring schedules. For recurring schedules, you have flexible options such as skipping holidays and scheduling on specific days of the week, giving you greater control over the timing of your reports.
Download out our ebook to learn more.
In this chapter, we guide you through the steps to effectively schedule, broadcast, and burst reports in Power BI using Inforiver. Learn how to automate report delivery and distribute customized content to the right recipients.
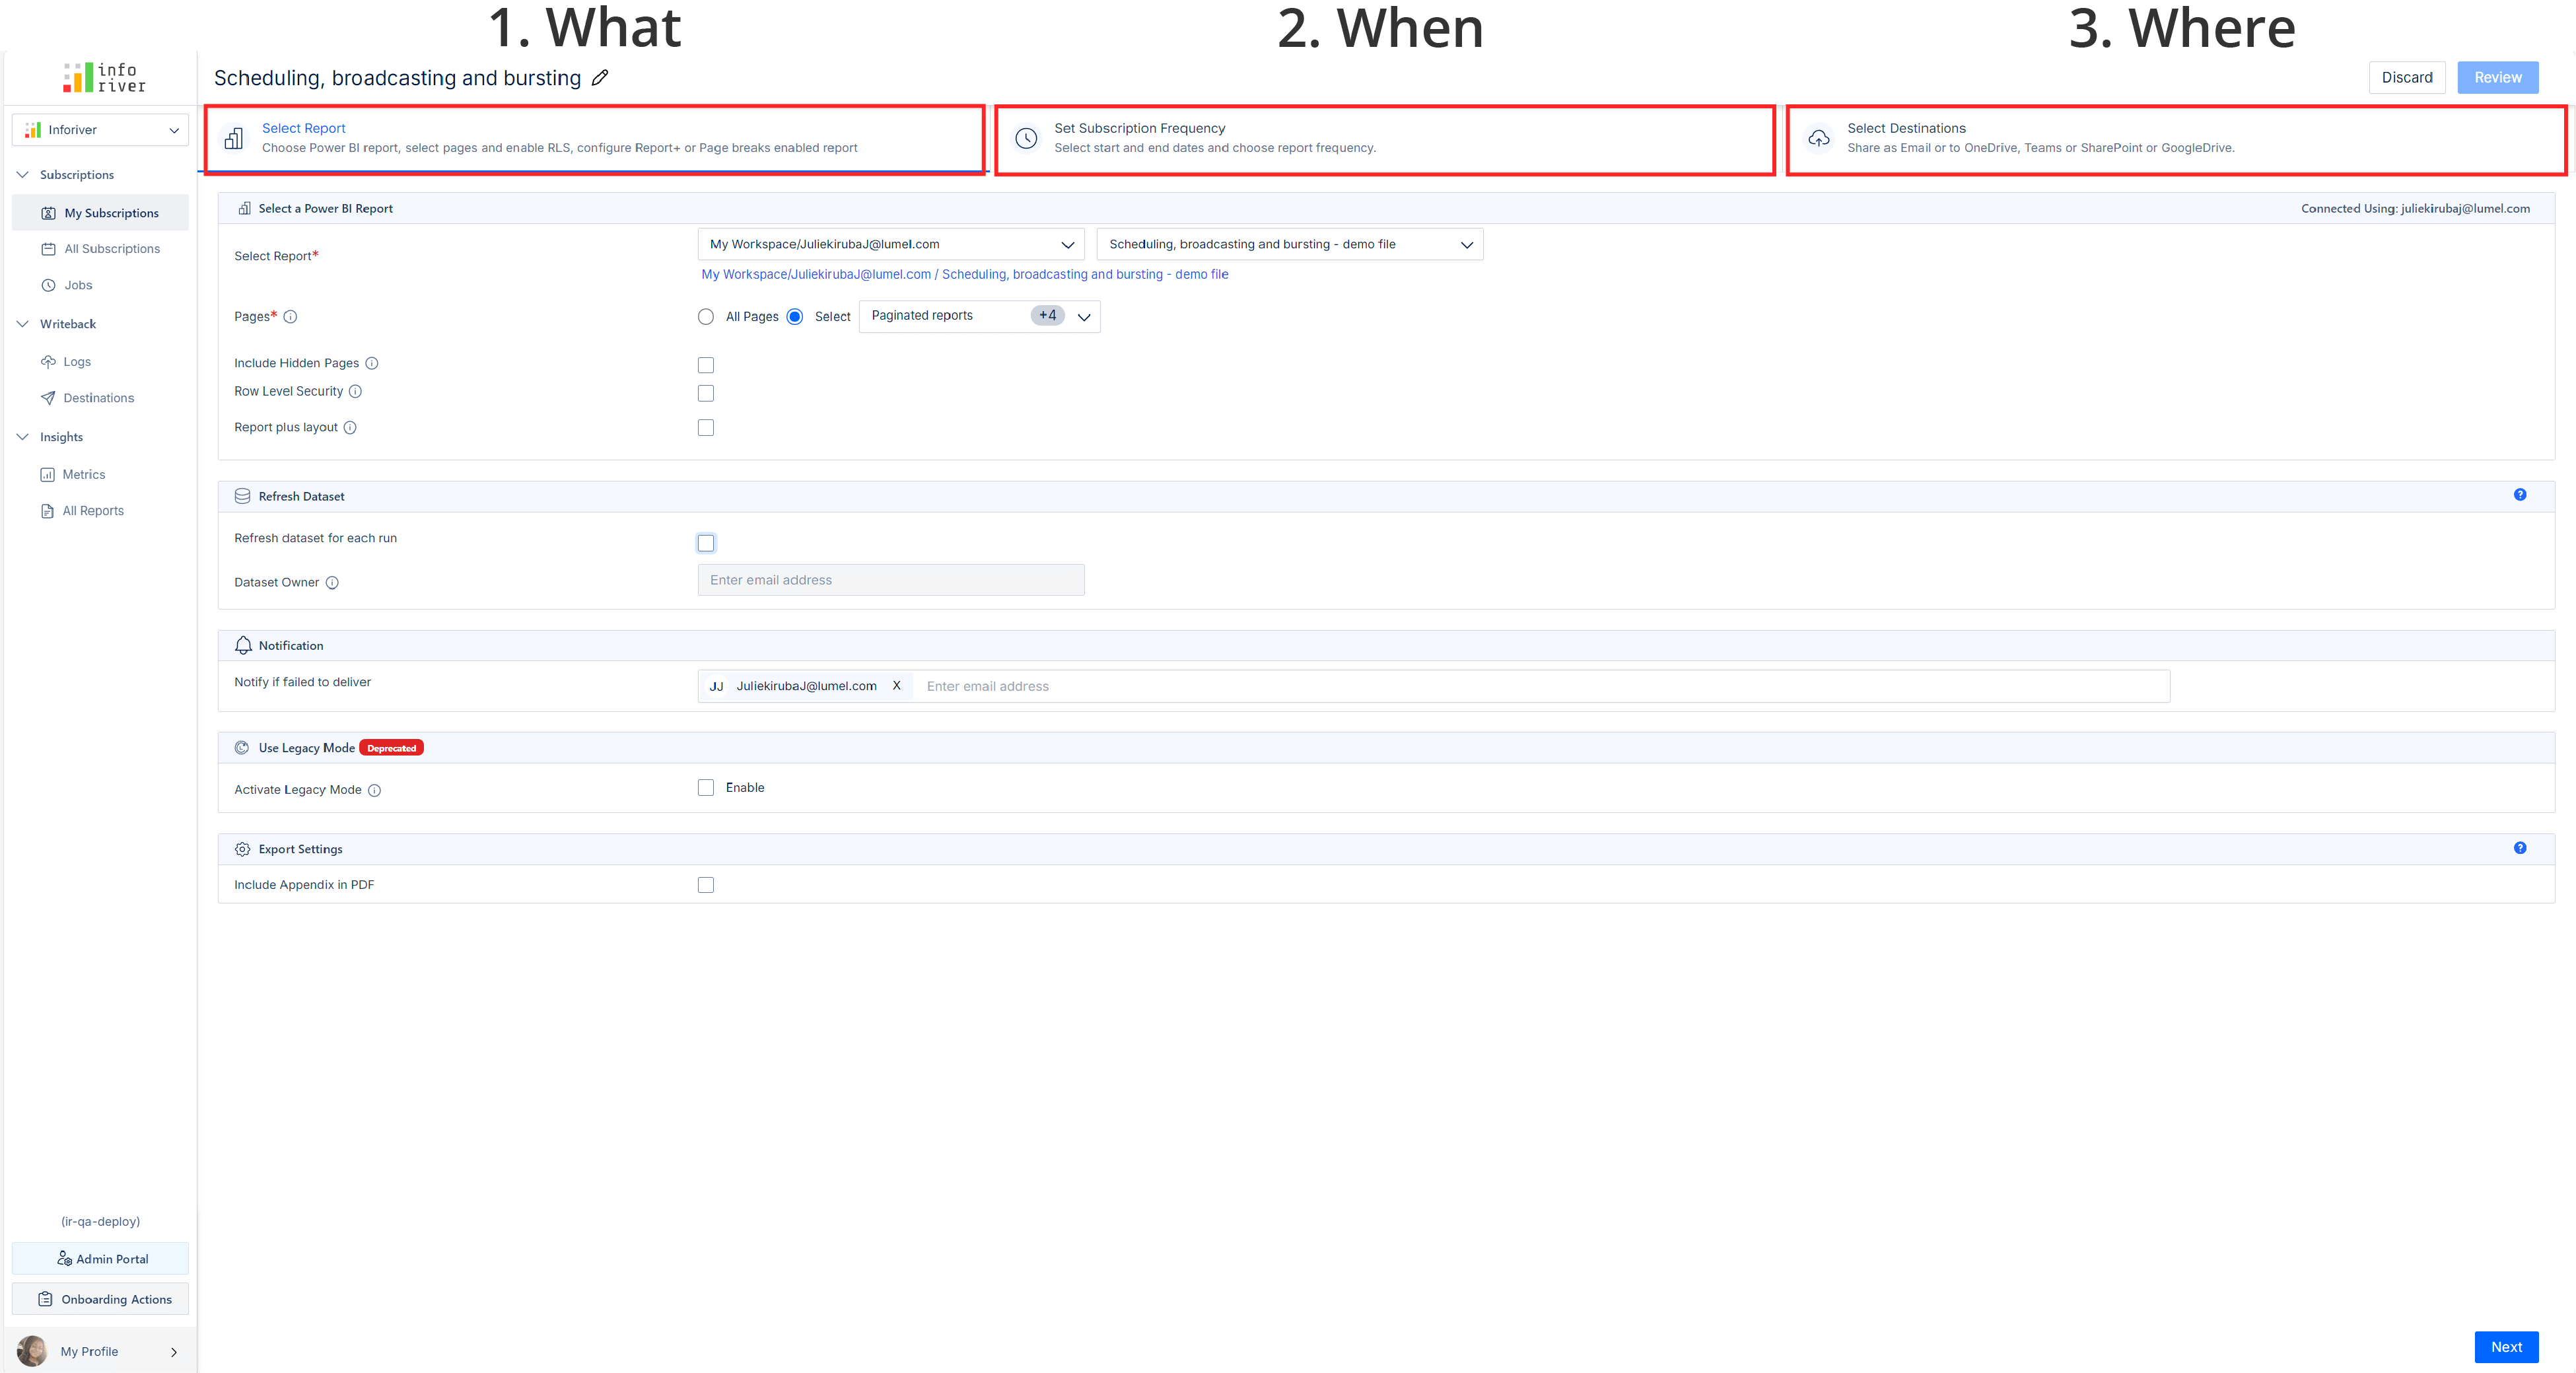
This section covers how to create a new report subscription, focusing on key configuration options. You'll define report details, delivery timing, and where the report should be sent. Follow these easy steps to create a new subscription.
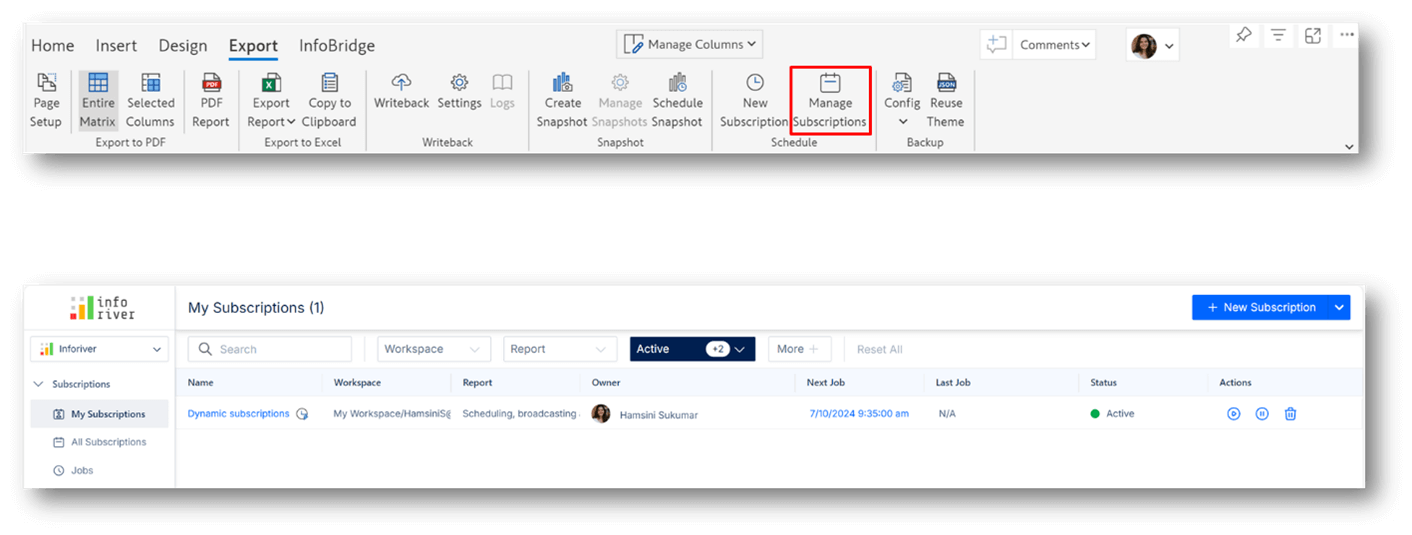
1. Go to the Inforiver Toolbar:
2. Click on New Subscription:
3. Automatic redirect to the Inforiver Console:
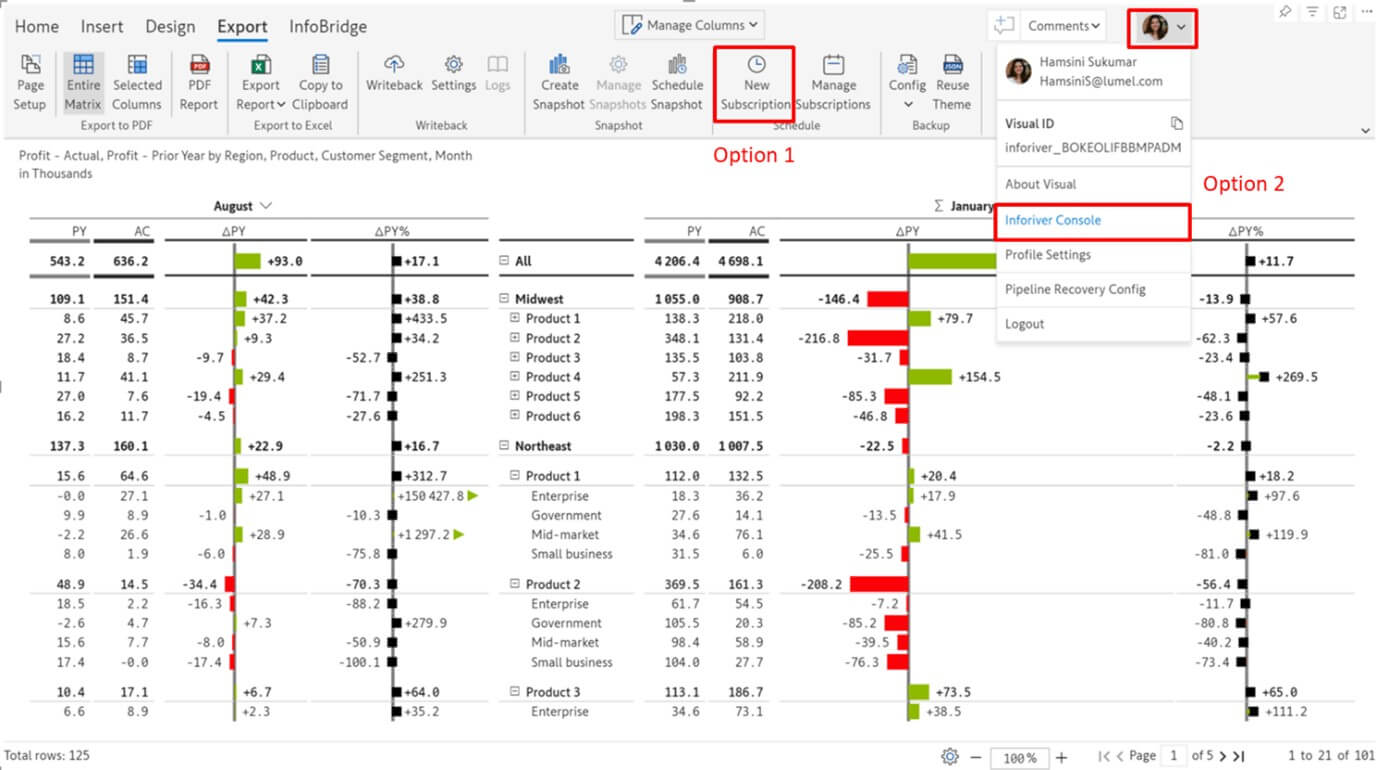
4. View the Console Layout:
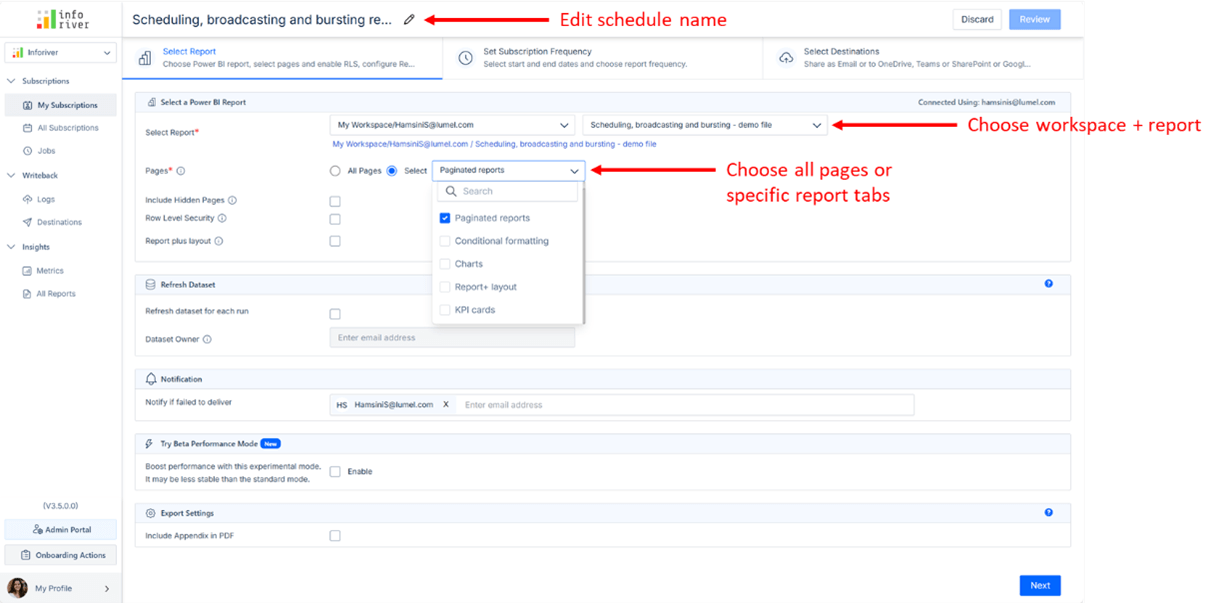
5. Edit Schedule Name:
The first tab of the Inforiver scheduler console shows report options. In this step, you'll choose the report and set any required filters or parameters. This ensures that only relevant data is included in the subscription.
Choose Workspace and Report:
Choose Report Tabs:
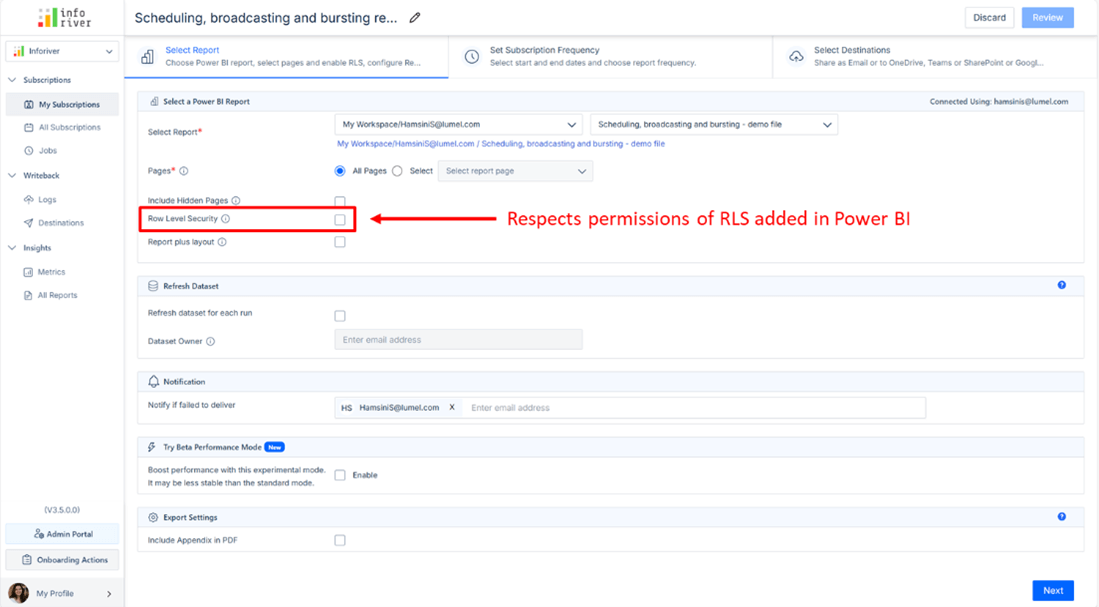
Row-Level Security (RLS) Option:
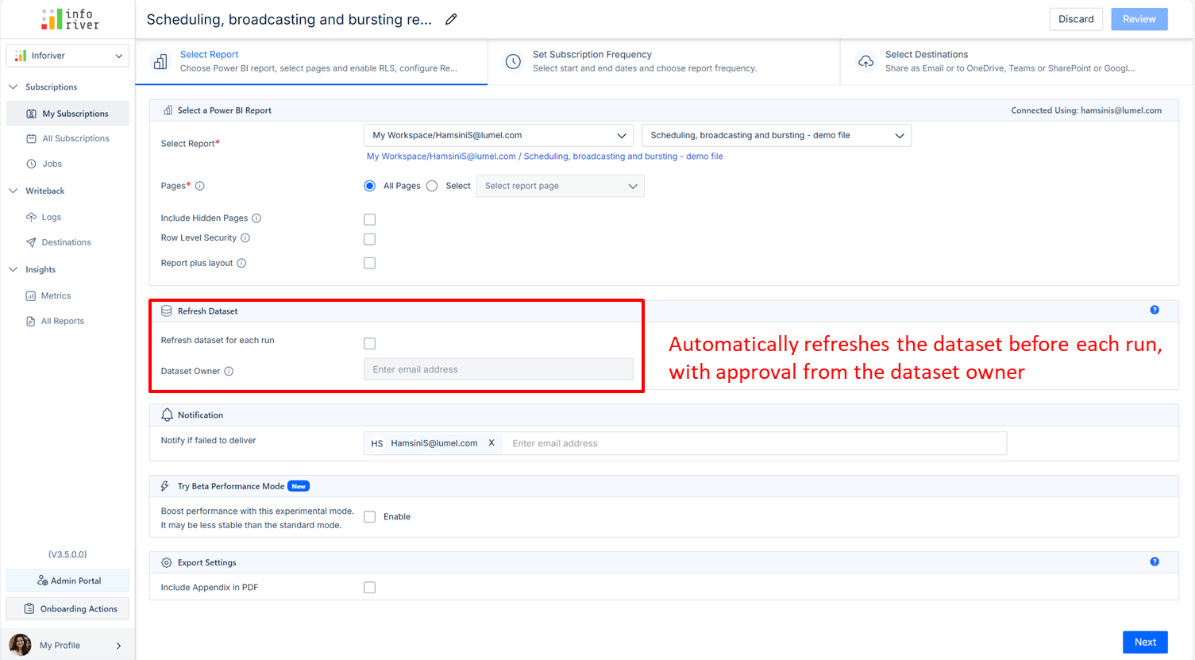
Refresh Dataset Before Run:
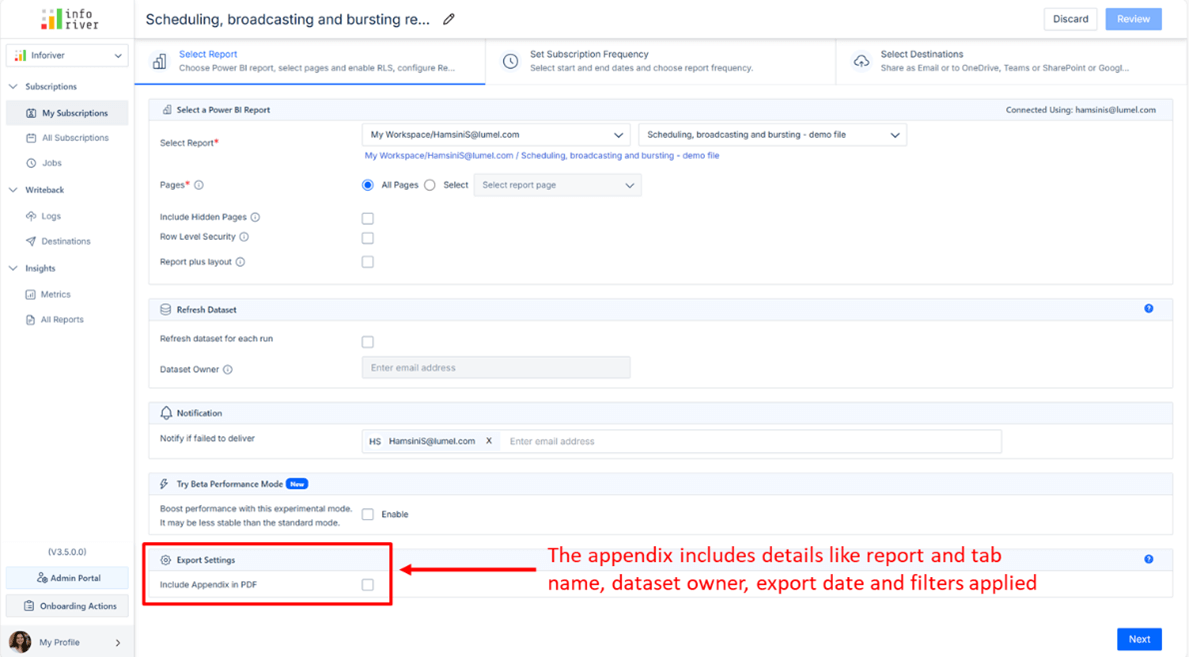
Export settings:
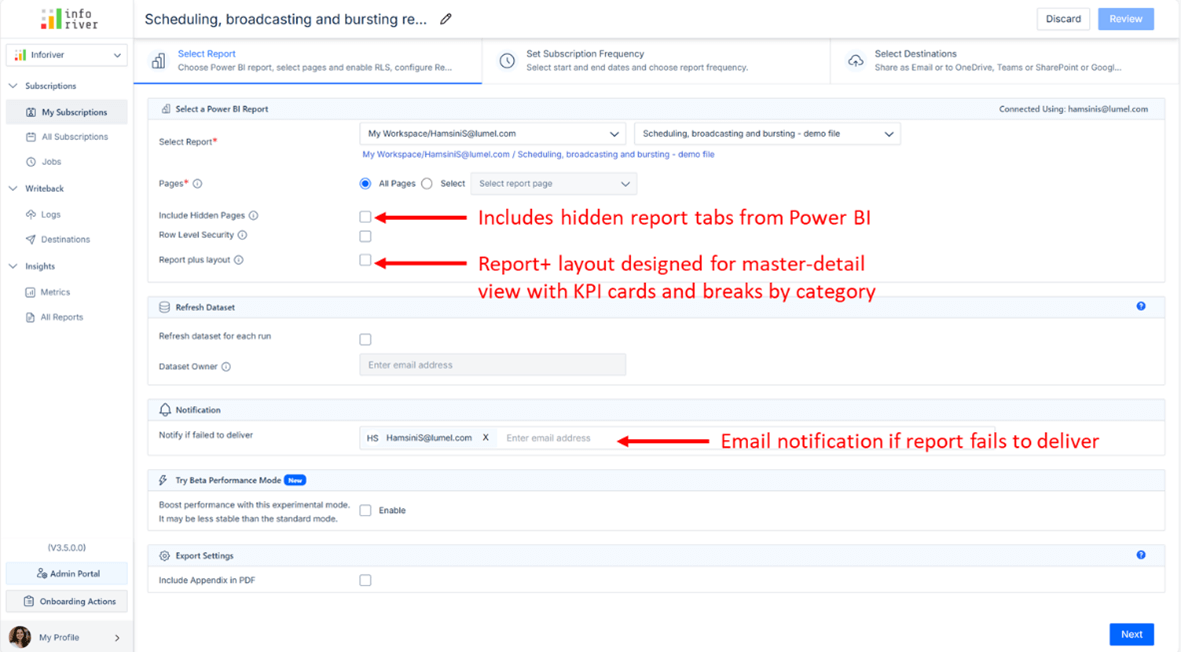
Notifications for Report Failures:
Include Hidden Pages:
Report Plus Layout:
Once you have finished selecting your report customization options, click Next to move to the frequency options tab. Here, you’ll select the frequency for report delivery (e.g., daily, weekly). This automates the timing of report delivery to avoid manual intervention.
Choose Delivery Frequency:
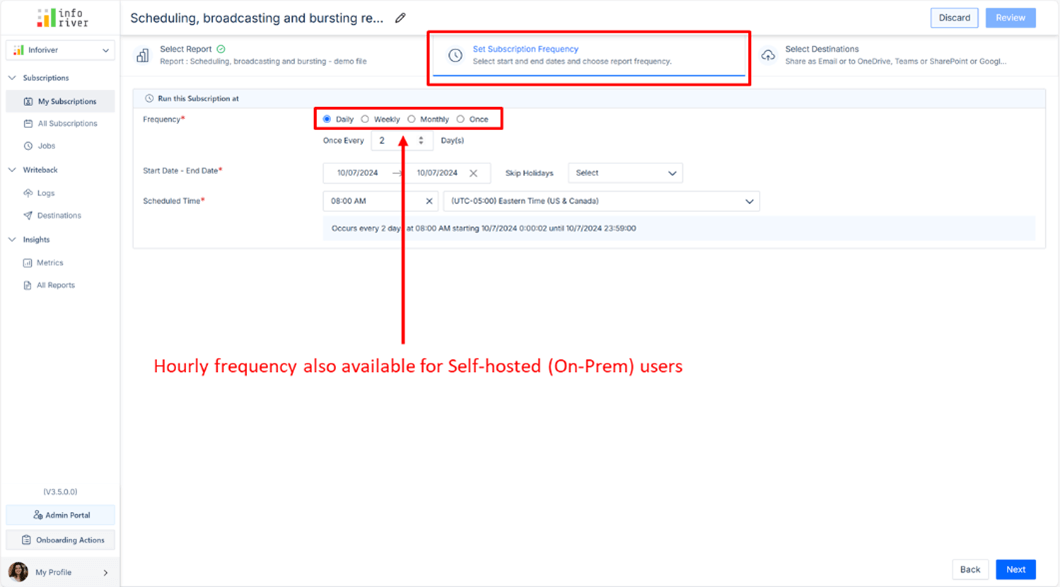
Start and End Dates:
Day Delivery Settings:
Weekly Delivery settings:
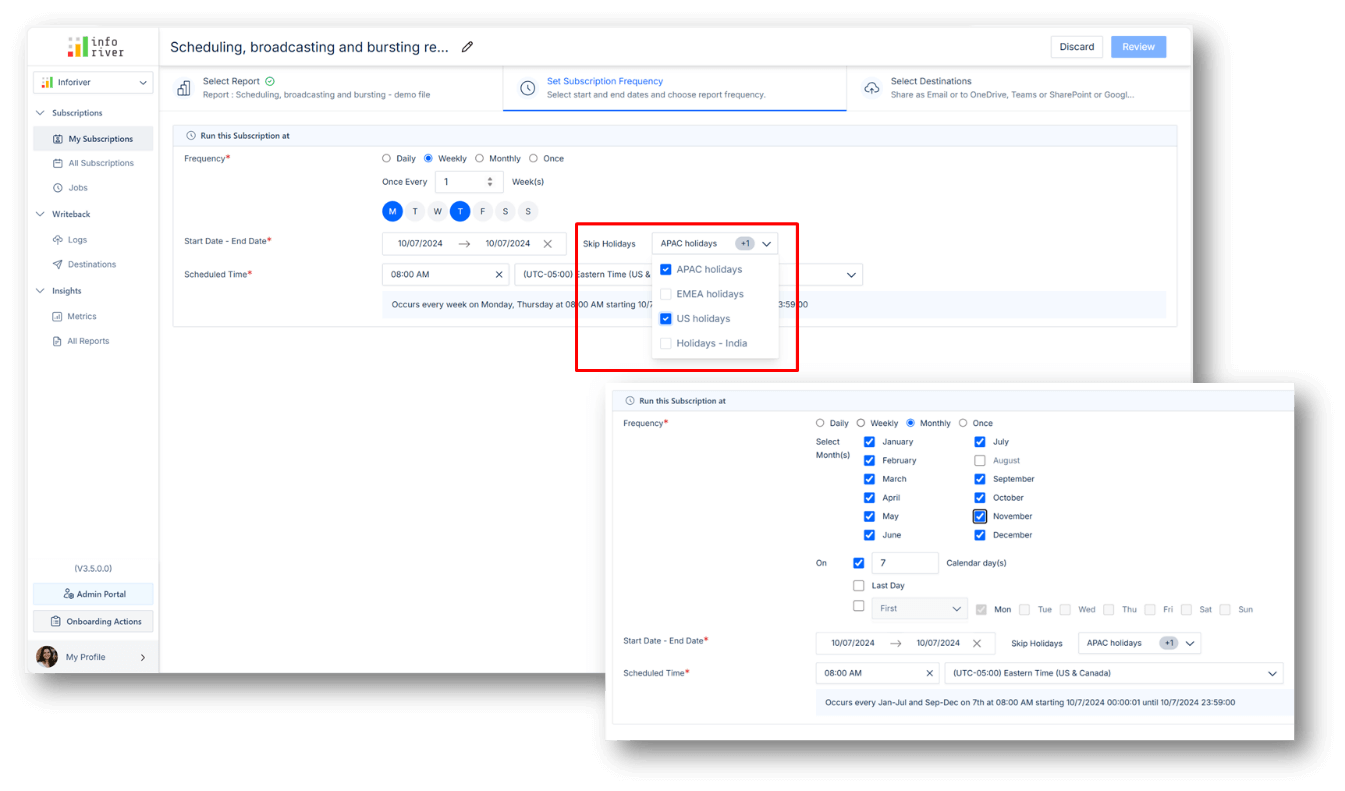
Monthly Delivery Settings:
One-Time Delivery:
Hourly Option for On-Prem Users:
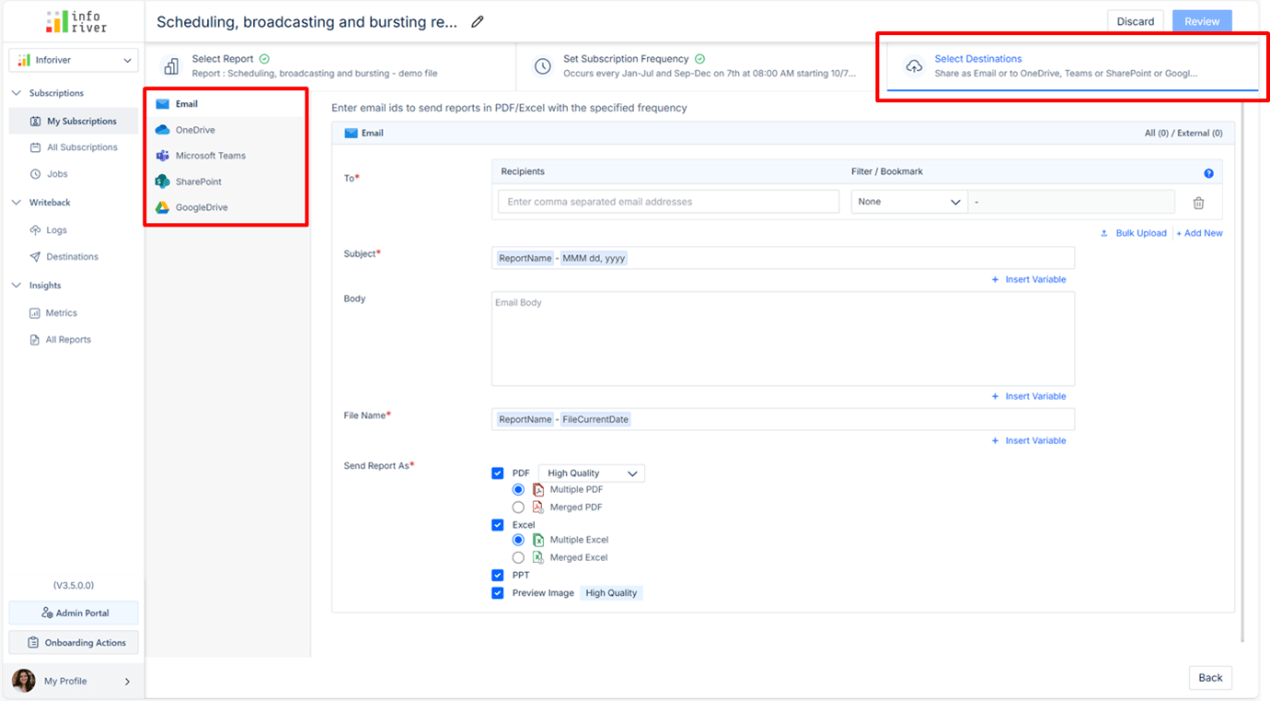
The third section of the Inforiver console allows you to specify destination options (email, shared folder, etc.) including bulk upload of filters or bookmarks for your schedule. You can select multiple destinations simultaneously as well as any of the file formats offered to ensure the report reaches the correct audience in the right format. We will explore both standard as well as dynamic subscriptions below.
Destination Options
In the scheduler, you can select between two primary types of destinations:
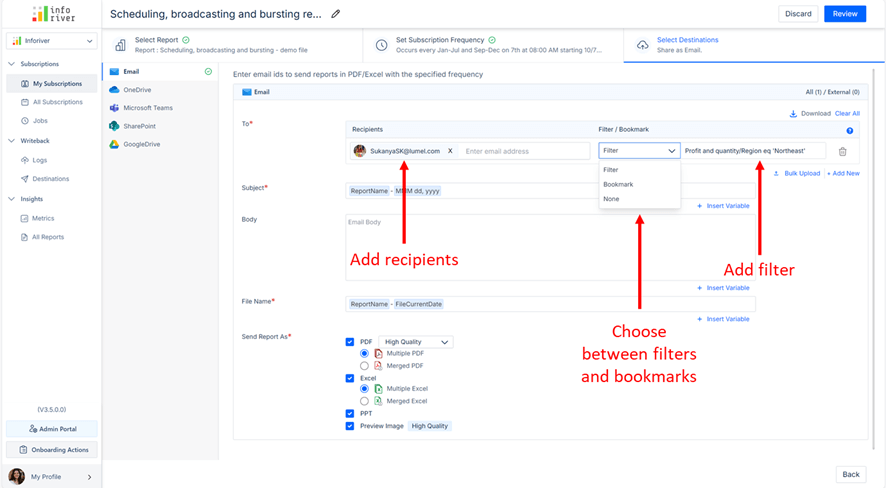
Adding Recipients + Filters/Bookmarks
When selecting email as a destination, you can add individual recipients (e.g., your email address) and personalize the report view for each user.
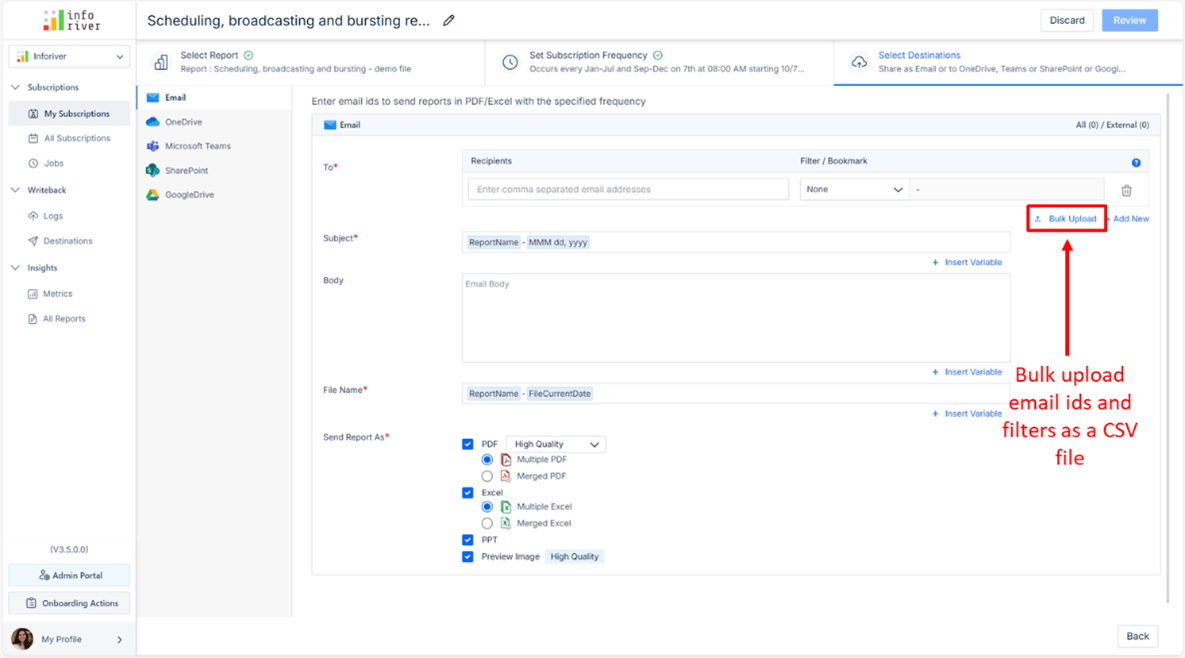
Bulk Upload Recipients + Filters
Instead of adding recipients one by one, you can upload a CSV file containing both the recipients' email addresses and the filters they need. This is ideal when you have a large number of recipients.
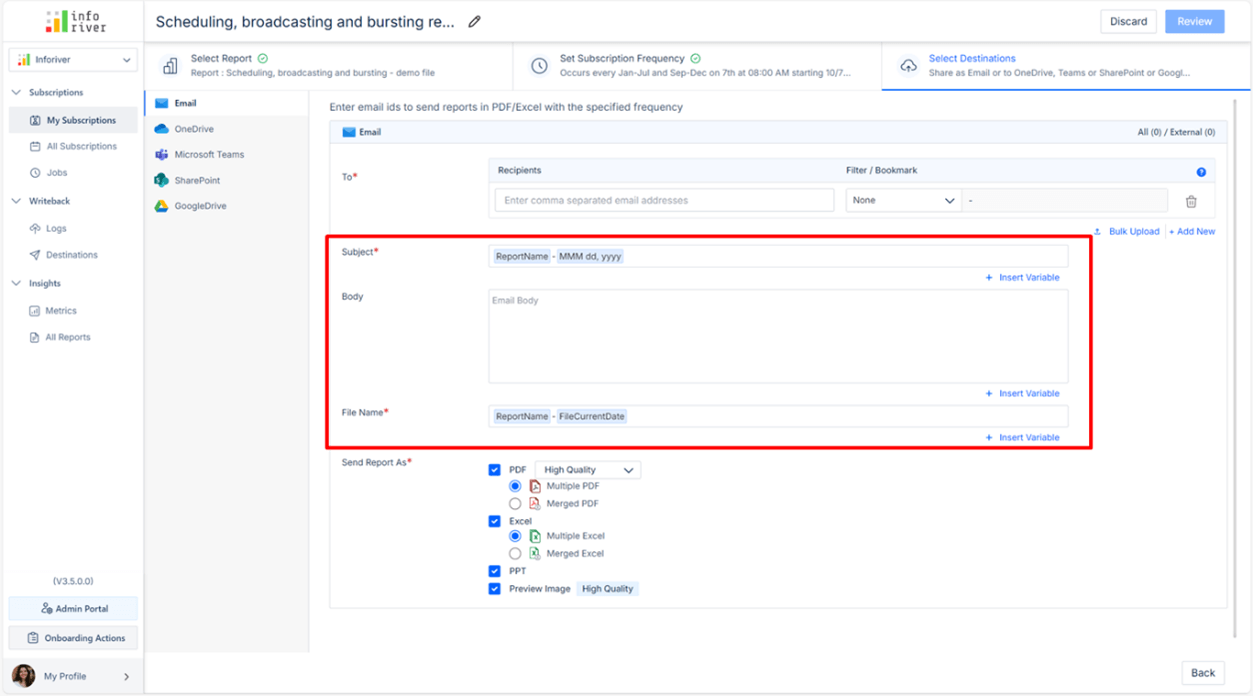
Subject, Body, and File Name
You can customize the subject and body of the email.
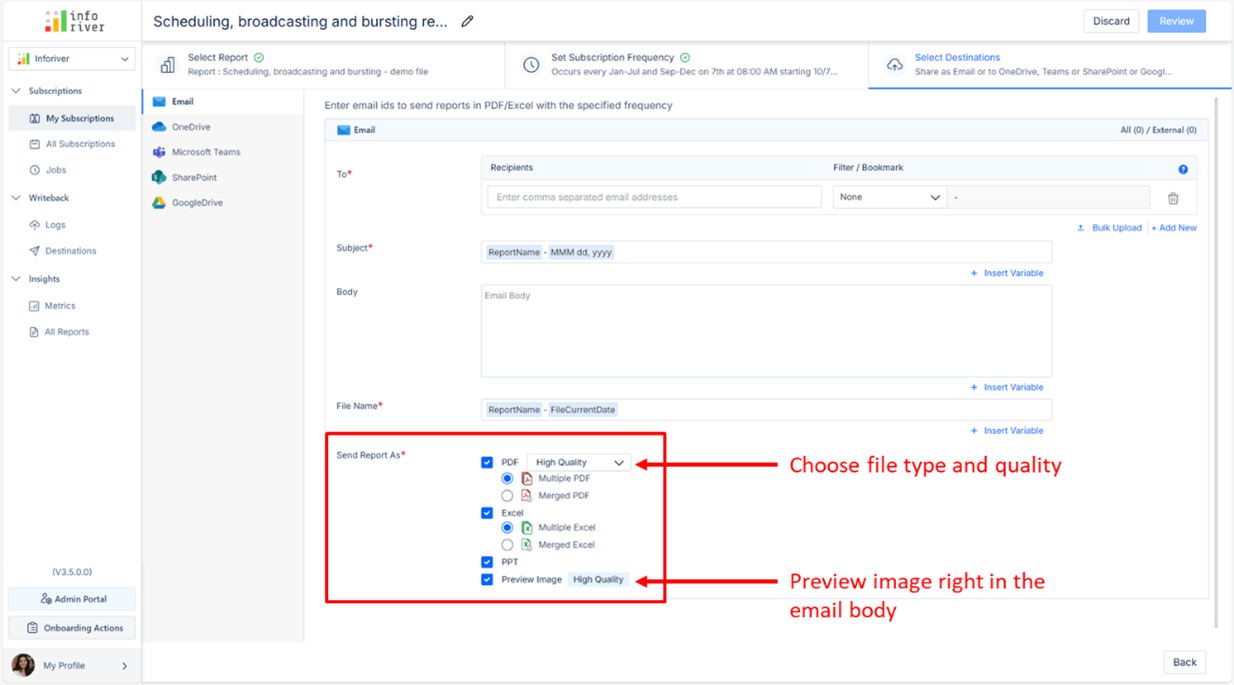
Report Format and Quality
You can choose from several formats for the report, such as PDF, Excel, or PowerPoint.
Dynamic Subscriptions - Implicitly select recipients
Dynamic subscriptions allow you to implicitly send reports to users based on their email addresses detected in the system. This is powered by a semantic model or through a CSV file.
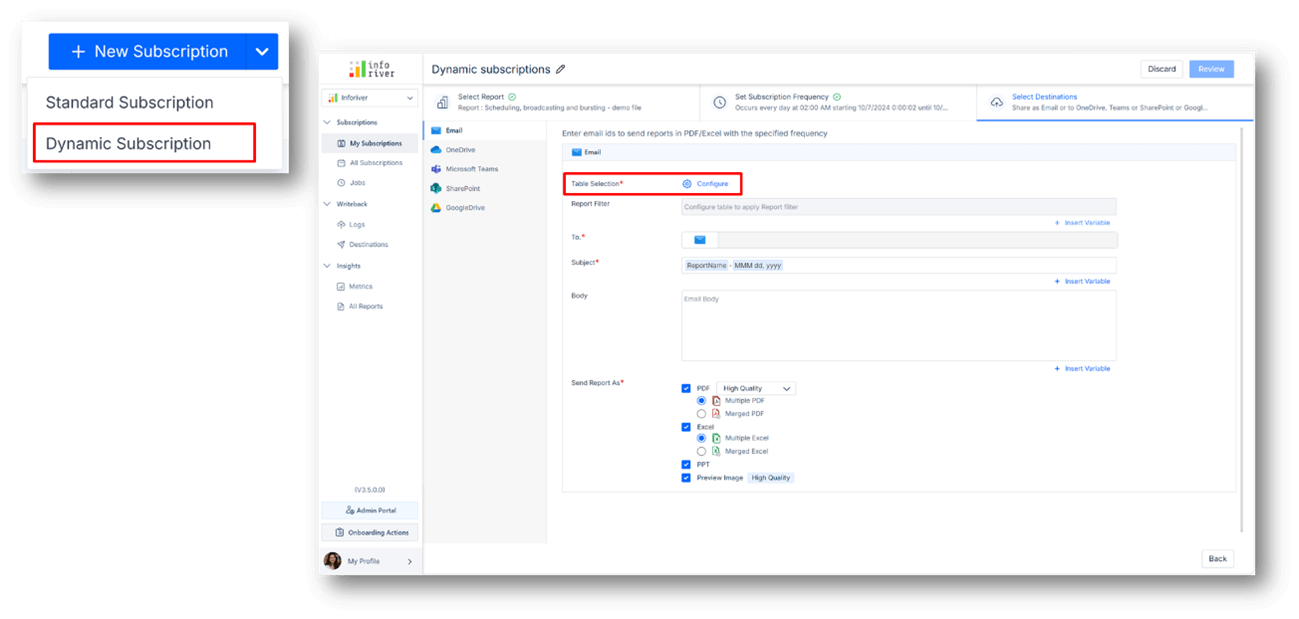
Dynamic Subscription Configuration Options
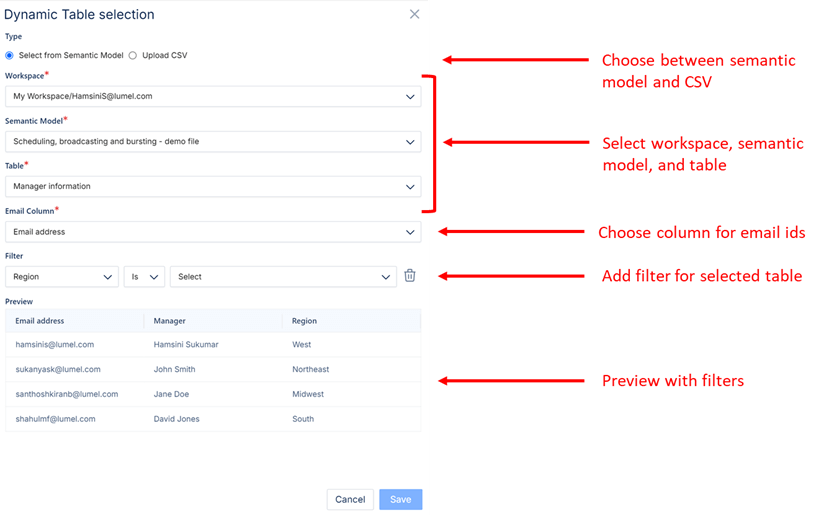
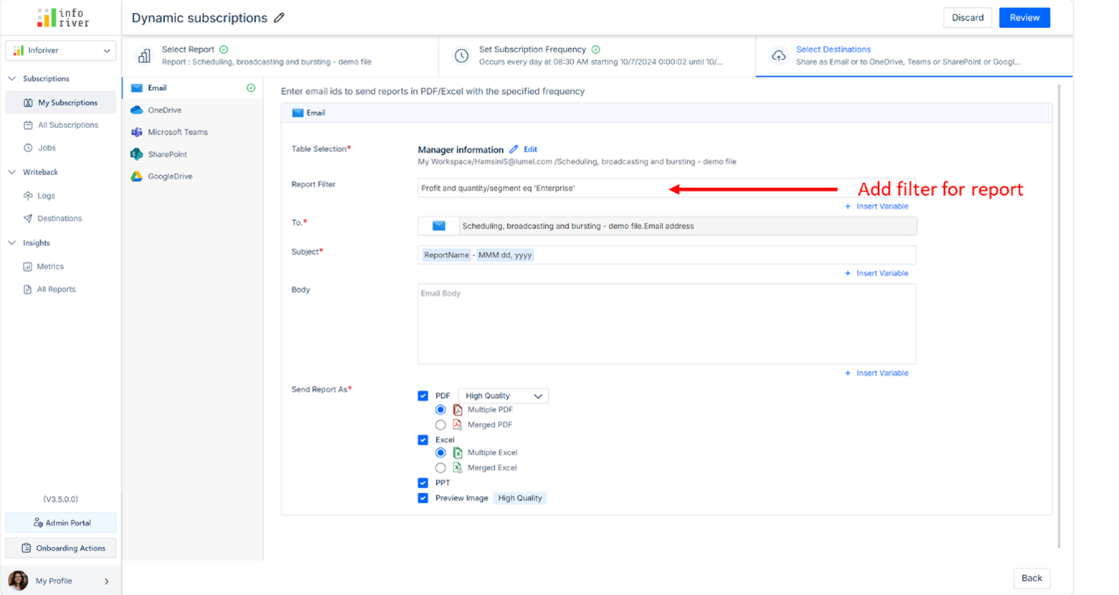
Dynamic Subscription – Report Filter Option
In addition, you can also apply a filter to the report within the dynamic subscription, ensuring that recipients only receive reports relevant to them (e.g., by region or customer segment).
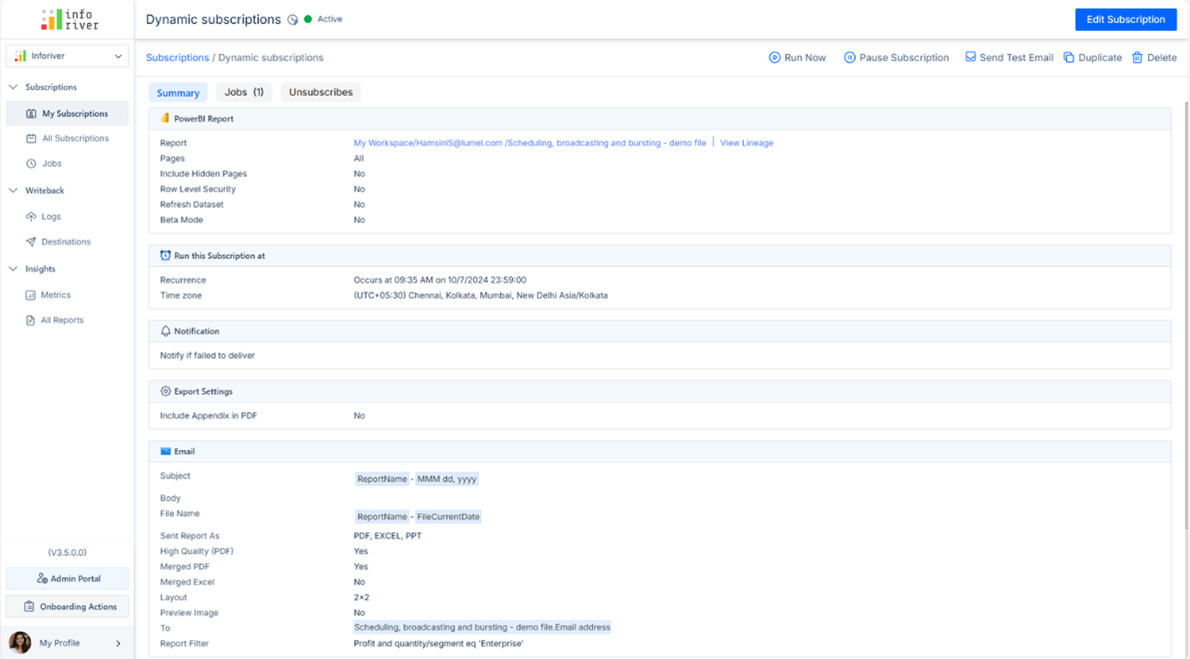
Subscription Overview
Subscription Actions
From the subscriptions page, you have several management options:
Job Status Tracking
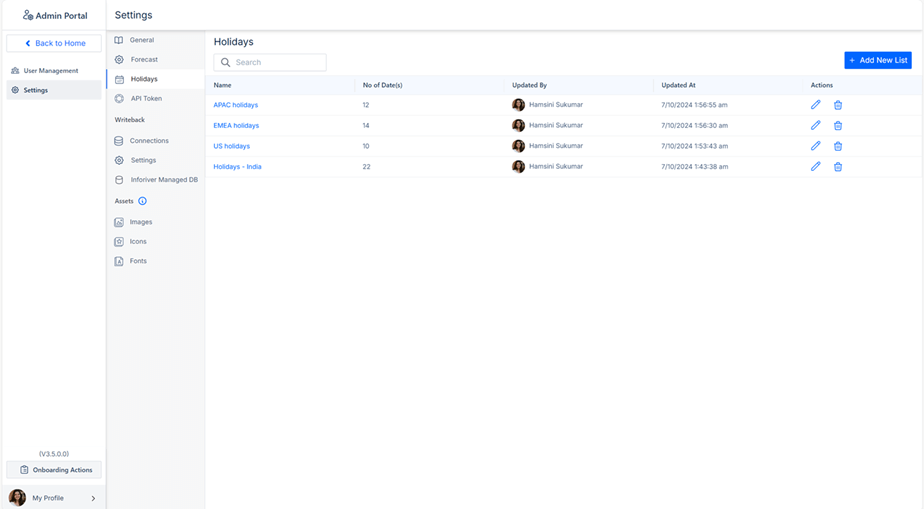
Editing Holiday Lists
Administrators can manage holiday lists to ensure reports are not scheduled on holidays. This helps in avoiding the sending of reports during non-working days. You can add a new list of holidays using the Add New List button. Your holiday lists will be available under the Skip holidays dropdown from the frequency options of the scheduler, allowing you to configure flexible frequencies.
By understanding and utilizing scheduling, broadcasting, and bursting methods, users can optimize report delivery, ensure timely access to critical data, and enhance decision-making processes across their organizations. Embracing these strategies enables businesses to automate report distribution, improve data accessibility, and foster a more streamlined, data-driven culture.
By leveraging Inforiver's advanced features for scheduling, bursting and broadcasting, organizations can improve efficiency, accuracy, and the timeliness of their report deliveries. Whether it's for personalized, secure reports, detailed paginated outputs, or fully formatted exports to PDF and Excel, Inforiver ensures that every report meets the specific needs of the user, while providing flexibility and ease of use.
Explore our webinar, to learn more about ‘Power BI Report Delivery: Scheduling, Broadcasting, and Bursting Explained’ webinar here.
Effective report delivery is crucial for ensuring that data insights reach stakeholders promptly, enabling informed decision-making. From dashboards for executives to detailed operational reports, delivery methods align data with business goals.
The most familiar method of report delivery is publishing a report to a designated portal or service. In this approach, the report is accessible online, and intended recipients, such as team members or stakeholders, can log in to view it. This centralized access point ensures that everyone views the same, up-to-date version of the report at their convenience.
In addition to portal publishing, other methods are also commonly used for report distribution. Each method has unique advantages and is suited to specific business needs. Some of these include:
Automated report delivery offers significant advantages that streamline the reporting process, making it more accessible, efficient, and scalable. Here are four primary benefits of automating report delivery:
Automated report delivery thus transforms reporting by accommodating a wide range of organizational needs.
Three key techniques used for automating report delivery are scheduling, broadcasting, and bursting. While these terms are often used interchangeably, each approach offers distinct advantages and serves unique use cases.
Scheduling
Scheduling is the simplest of the three. With scheduling, a report is delivered at a pre-set time in the future. This can be a one-time delivery or a recurring schedule, depending on business needs. For example, a weekly sales report might be scheduled to be sent to the VP of Sales every Monday at 8:00 AM.
Broadcasting
Broadcasting involves sending a single report to multiple recipients simultaneously. It allows for easy scalability as one report reaches many stakeholders at once. Unlike scheduling, broadcasting can happen immediately or be set for a later time. An example of broadcasting might be a quarterly financial report that needs to reach hundreds of stakeholders and investors.
To summarize and compare these three techniques:
In this chapter, we will explore how Power BI implements scheduling, broadcasting, and bursting through its native scheduling capabilities. These methods help deliver reports to stakeholders automatically, based on predefined schedules or user needs.
Power BI also supports API-driven schedules triggered by Power Automate workflows. This feature enhances flexibility, allowing both standard and dynamic subscriptions for paginated reports with additional options for file formats and delivery destinations, making it easier to meet diverse reporting requirements.
Let us now compare the features of the native Power BI scheduler with the Inforiver scheduler across a few key aspects.
In this chapter, we explore the Inforiver Scheduler, designed to automate Power BI report delivery with features like personalized schedules, multiple export formats, and advanced filtering. These capabilities ensure accurate and timely distribution, simplifying report management and improving efficiency.
Self-service and No-code: Designed for Business Users
The Inforiver Scheduler is designed to be self-service and low-code, with a user-friendly interface tailored for casual business users. It allows users to create, manage, and administer schedules with just a few clicks, minimizing or even eliminating dependency on IT support.
Create One-Time and Flexible Recurring Schedules
The Inforiver Scheduler allows you to create both one-time and flexible recurring schedules. For recurring schedules, you have flexible options such as skipping holidays and scheduling on specific days of the week, giving you greater control over the timing of your reports.
Download out our ebook to learn more.
In this chapter, we guide you through the steps to effectively schedule, broadcast, and burst reports in Power BI using Inforiver. Learn how to automate report delivery and distribute customized content to the right recipients.
This section covers how to create a new report subscription, focusing on key configuration options. You'll define report details, delivery timing, and where the report should be sent. Follow these easy steps to create a new subscription.
1. Go to the Inforiver Toolbar:
2. Click on New Subscription:
3. Automatic redirect to the Inforiver Console:
4. View the Console Layout:
5. Edit Schedule Name:
The first tab of the Inforiver scheduler console shows report options. In this step, you'll choose the report and set any required filters or parameters. This ensures that only relevant data is included in the subscription.
Choose Workspace and Report:
Choose Report Tabs:
Row-Level Security (RLS) Option:
Refresh Dataset Before Run:
Export settings:
Notifications for Report Failures:
Include Hidden Pages:
Report Plus Layout:
Once you have finished selecting your report customization options, click Next to move to the frequency options tab. Here, you’ll select the frequency for report delivery (e.g., daily, weekly). This automates the timing of report delivery to avoid manual intervention.
Choose Delivery Frequency:
Start and End Dates:
Day Delivery Settings:
Weekly Delivery settings:
Monthly Delivery Settings:
One-Time Delivery:
Hourly Option for On-Prem Users:
The third section of the Inforiver console allows you to specify destination options (email, shared folder, etc.) including bulk upload of filters or bookmarks for your schedule. You can select multiple destinations simultaneously as well as any of the file formats offered to ensure the report reaches the correct audience in the right format. We will explore both standard as well as dynamic subscriptions below.
Destination Options
In the scheduler, you can select between two primary types of destinations:
Adding Recipients + Filters/Bookmarks
When selecting email as a destination, you can add individual recipients (e.g., your email address) and personalize the report view for each user.
Bulk Upload Recipients + Filters
Instead of adding recipients one by one, you can upload a CSV file containing both the recipients' email addresses and the filters they need. This is ideal when you have a large number of recipients.
Subject, Body, and File Name
You can customize the subject and body of the email.
Report Format and Quality
You can choose from several formats for the report, such as PDF, Excel, or PowerPoint.
Dynamic Subscriptions - Implicitly select recipients
Dynamic subscriptions allow you to implicitly send reports to users based on their email addresses detected in the system. This is powered by a semantic model or through a CSV file.
Dynamic Subscription Configuration Options
Dynamic Subscription – Report Filter Option
In addition, you can also apply a filter to the report within the dynamic subscription, ensuring that recipients only receive reports relevant to them (e.g., by region or customer segment).
Subscription Overview
Subscription Actions
From the subscriptions page, you have several management options:
Job Status Tracking
Editing Holiday Lists
Administrators can manage holiday lists to ensure reports are not scheduled on holidays. This helps in avoiding the sending of reports during non-working days. You can add a new list of holidays using the Add New List button. Your holiday lists will be available under the Skip holidays dropdown from the frequency options of the scheduler, allowing you to configure flexible frequencies.
By understanding and utilizing scheduling, broadcasting, and bursting methods, users can optimize report delivery, ensure timely access to critical data, and enhance decision-making processes across their organizations. Embracing these strategies enables businesses to automate report distribution, improve data accessibility, and foster a more streamlined, data-driven culture.
By leveraging Inforiver's advanced features for scheduling, bursting and broadcasting, organizations can improve efficiency, accuracy, and the timeliness of their report deliveries. Whether it's for personalized, secure reports, detailed paginated outputs, or fully formatted exports to PDF and Excel, Inforiver ensures that every report meets the specific needs of the user, while providing flexibility and ease of use.
Explore our webinar, to learn more about ‘Power BI Report Delivery: Scheduling, Broadcasting, and Bursting Explained’ webinar here.

Inforiver helps enterprises consolidate planning, reporting & analytics on a single platform (Power BI). The no-code, self-service award-winning platform has been recognized as the industry’s best and is adopted by many Fortune 100 firms.
Inforiver is a product of Lumel, the #1 Power BI AppSource Partner. The firm serves over 3,000 customers worldwide through its portfolio of products offered under the brands Inforiver, EDITable, ValQ, and xViz.