
Upcoming webinar on 'Inforiver Charts : The fastest way to deliver stories in Power BI', Aug 29th , Monday, 10.30 AM CST. Register Now
Upcoming webinar on 'Inforiver Charts : The fastest way to deliver stories in Power BI', Aug 29th , Monday, 10.30 AM CST. Register Now
Dumbbell charts provide an intuitive and effective way to visually compare two sets of observations. However, they are often overlooked due to their unfamiliarity. We will take a quick look at why dumbbell charts must be in your go-to repertoire of visualizations.
Let us take a dataset consisting of GDP growth of a few countries. We want to compare GDP growth rate of two consecutive years (2021, the post covid recovery year, vs. 2022) to see which countries have sustained the expansion post COVID.
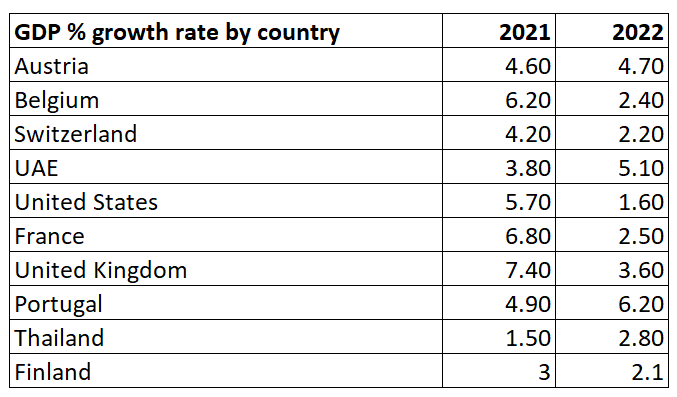
When we plot it in a bar chart, the data shows up as follows.
However, when it comes to GDP growth data, we are often interested to know which countries are accelerating, and which ones are slowing down. In other words, whether a GDP growth of 3% is good or bad depends on the GDP growth in the prior period. If the prior period growth is 2.8%, then the economy is accelerating. If the prior period growth were 3.2%, it is a cause for concern.
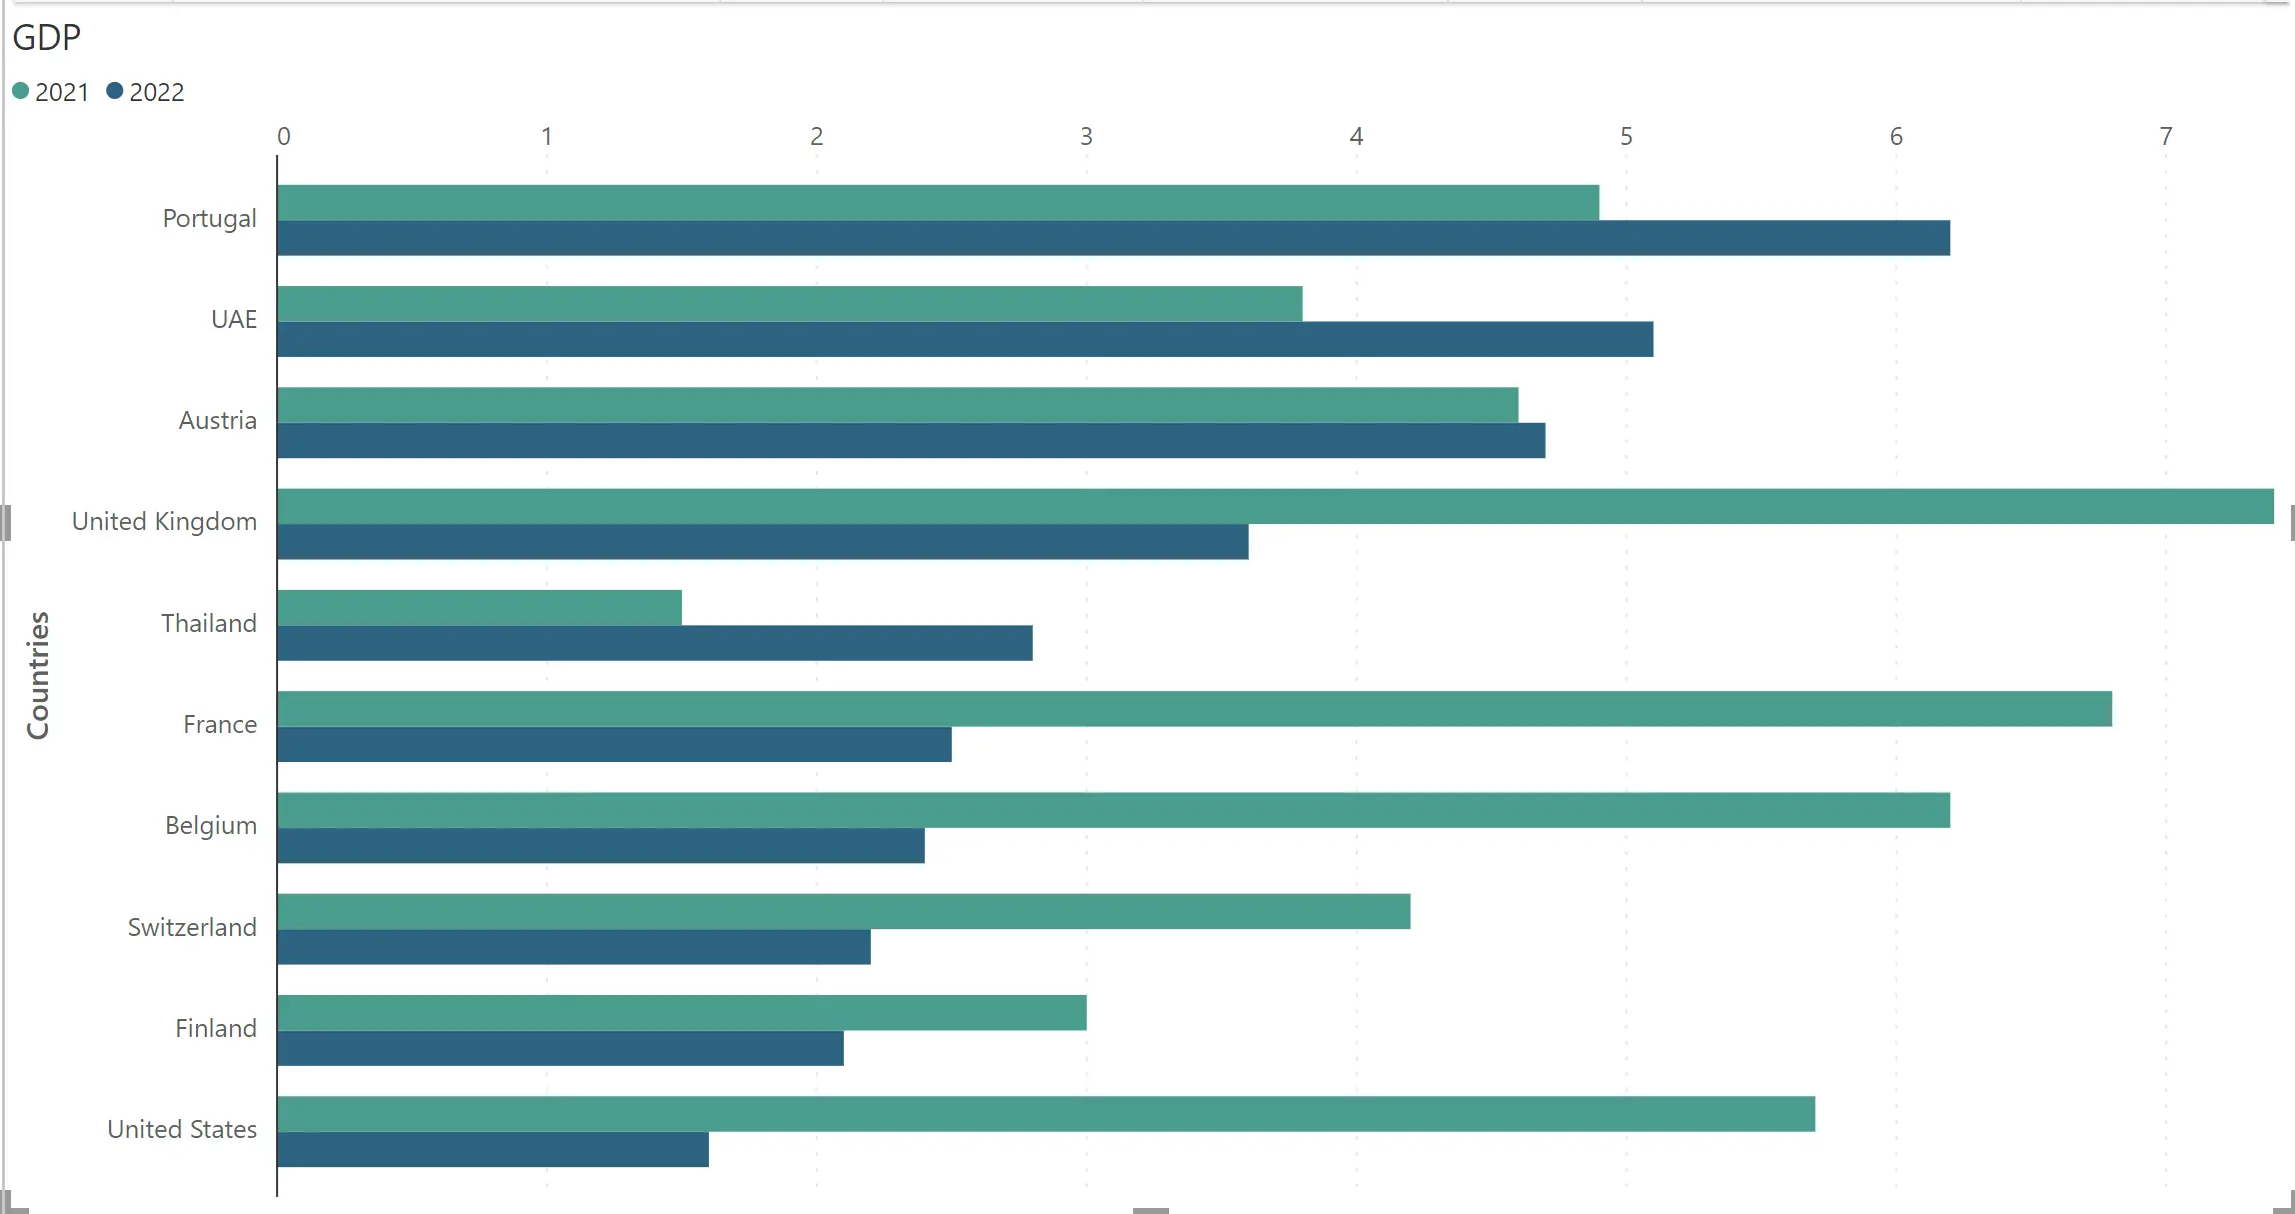
Looking at the bar chart, it is not easier to understand which countries have their rates accelerating vs. slowing down. Let us now try the same with a variance.
The integrated variance chart shown below is better than the bar chart. It quickly shows us that UK, France and Belgium slowed down much faster from the post-COVID recovery rates in 2021, while Portugal, UAE and Thailand sustained the expansion post-COVID.
The integrated variance chart listed above tracks two things:
In our case, we are more interested in tracking movement than the absolute magnitude.
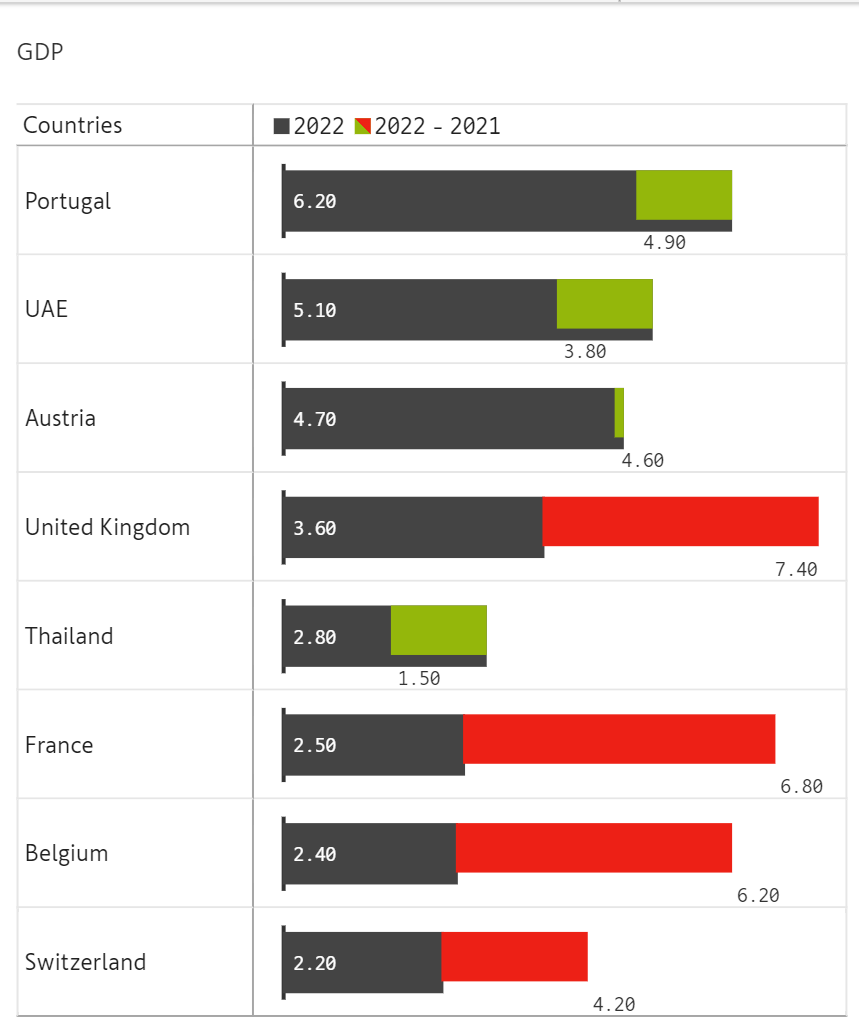
This is where dumbbell charts can help. It reduces the clutter introduced by plotting magnitude, and focuses more on the movement. Take a look at the chart below.
Yes, the magnitude details are not lost, and they are still there. But the clutter is greatly reduced, and a larger emphasis is provided on the movement.
Dumbbell charts are most used when we want to focus on movement rather than the magnitude of past and current values.
You can still use dumbbell charts to plot variance, provided that you are keener on the variance than the magnitude of the achievement.
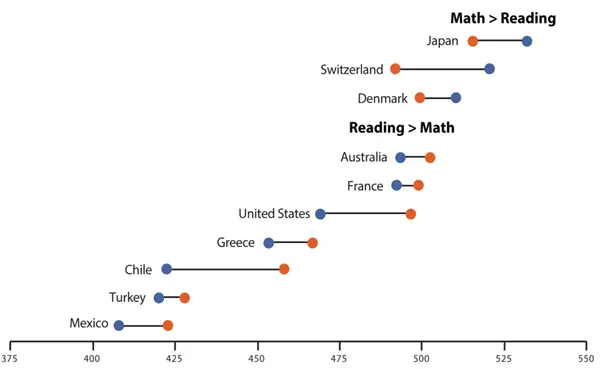
Here is another great example of how a dumbbell chart can be used (source: www.policyviz.com). It not only shows two sets of countries – one where kids typically had higher math scores than reading scores, and another set of countries where the reading scores where better. In this example too, the exact math and reading scores are not as relevant as which score is better for a specific country.

Inforiver helps enterprises consolidate planning, reporting & analytics on a single platform (Power BI). The no-code, self-service award-winning platform has been recognized as the industry’s best and is adopted by many Fortune 100 firms.
Inforiver is a product of Lumel, the #1 Power BI AppSource Partner. The firm serves over 3,000 customers worldwide through its portfolio of products offered under the brands Inforiver, EDITable, ValQ, and xViz.