Upcoming webinar on 'Inforiver Charts : The fastest way to deliver stories in Power BI', Aug 29th , Monday, 10.30 AM CST. Register Now
Upcoming webinar on 'Inforiver Charts : The fastest way to deliver stories in Power BI', Aug 29th , Monday, 10.30 AM CST. Register Now
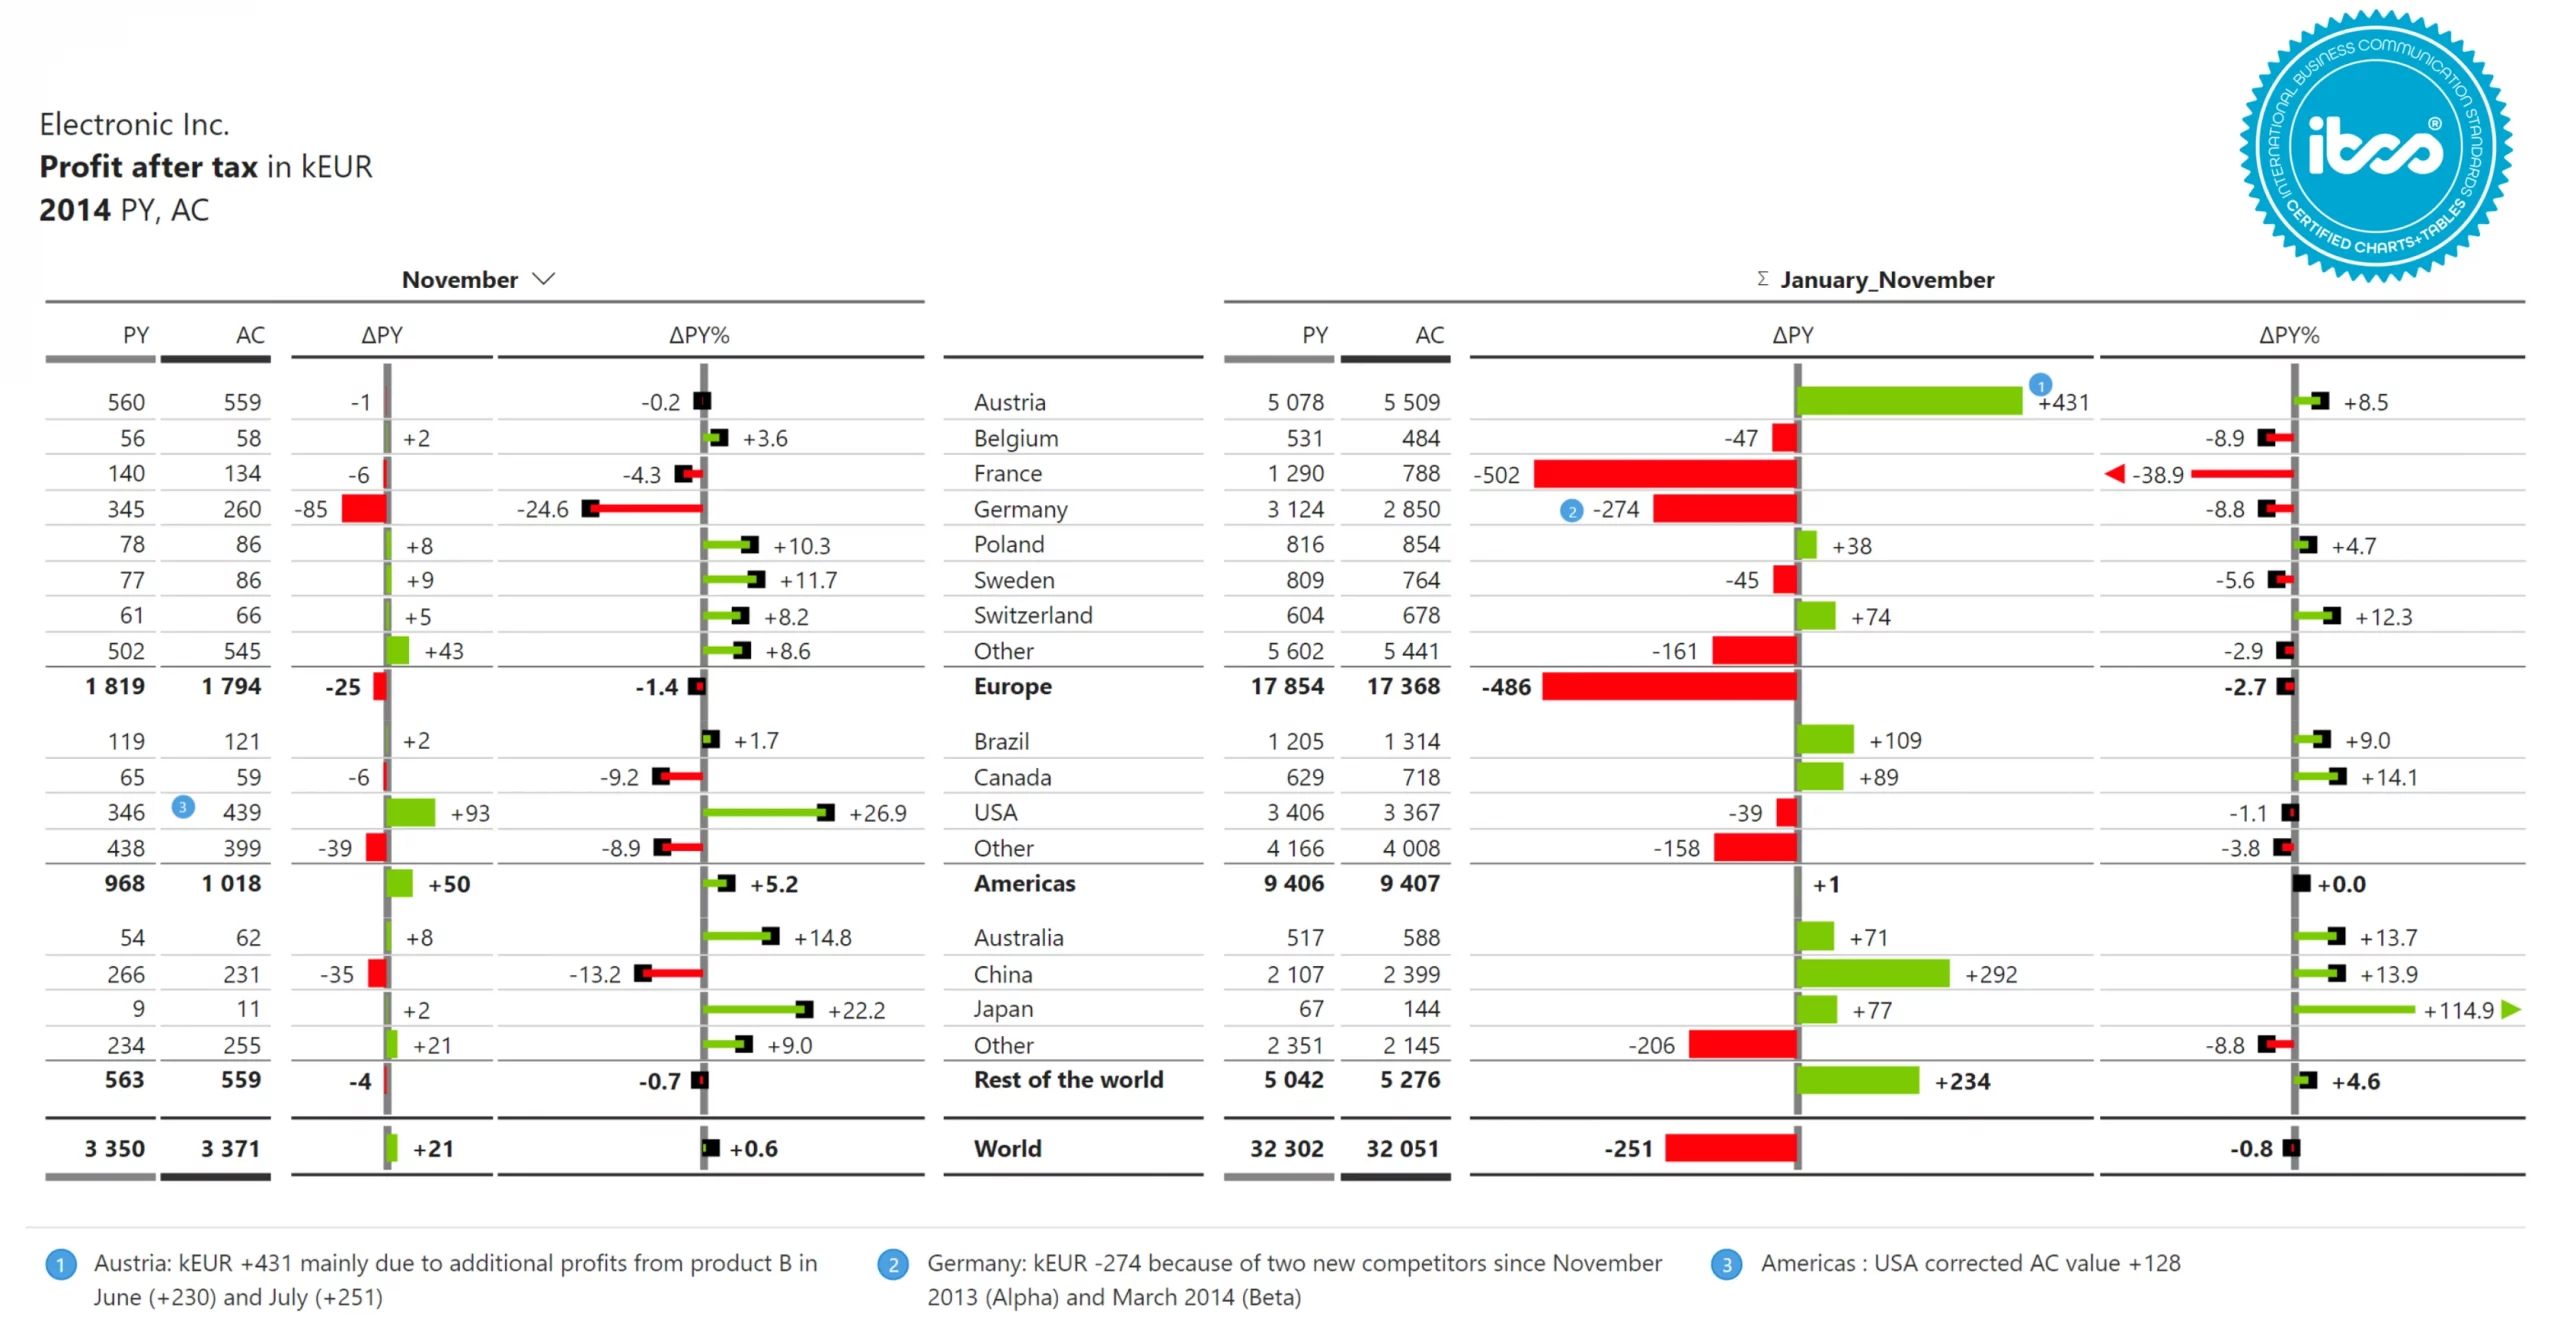
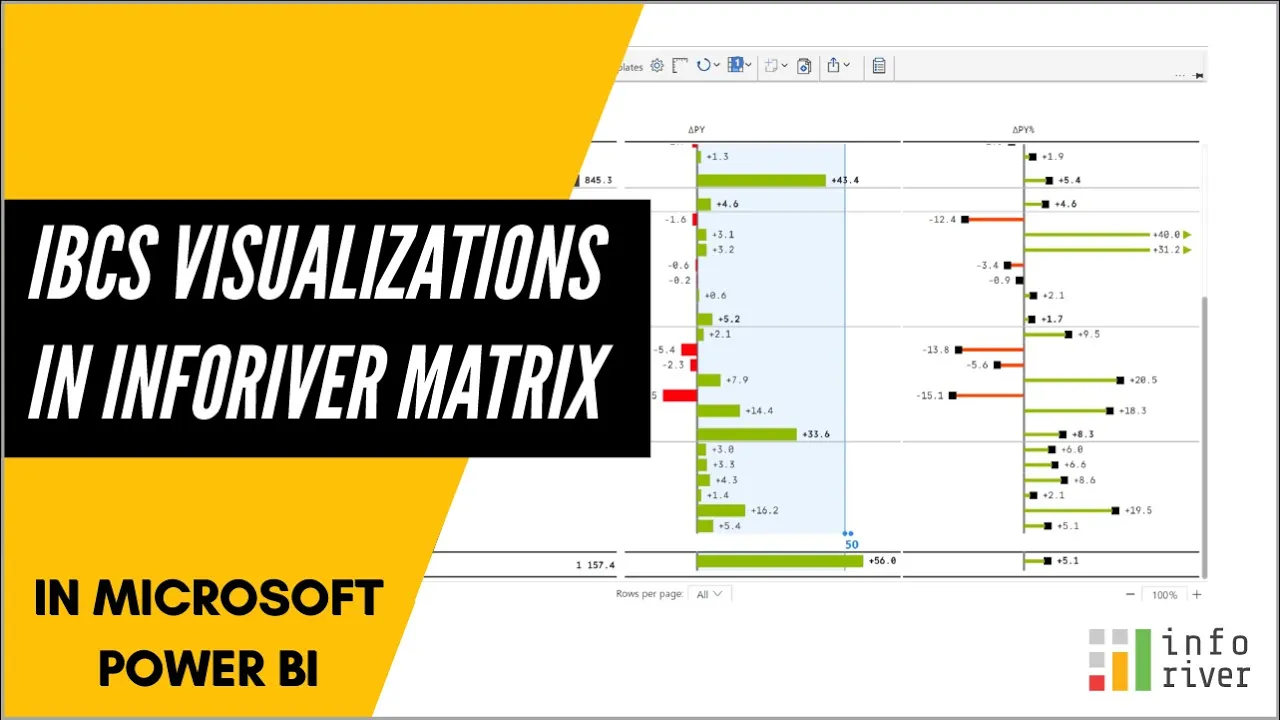
Experience the fastest way to deliver insightful visualizations following IBCS standards using Inforiver Matrix.
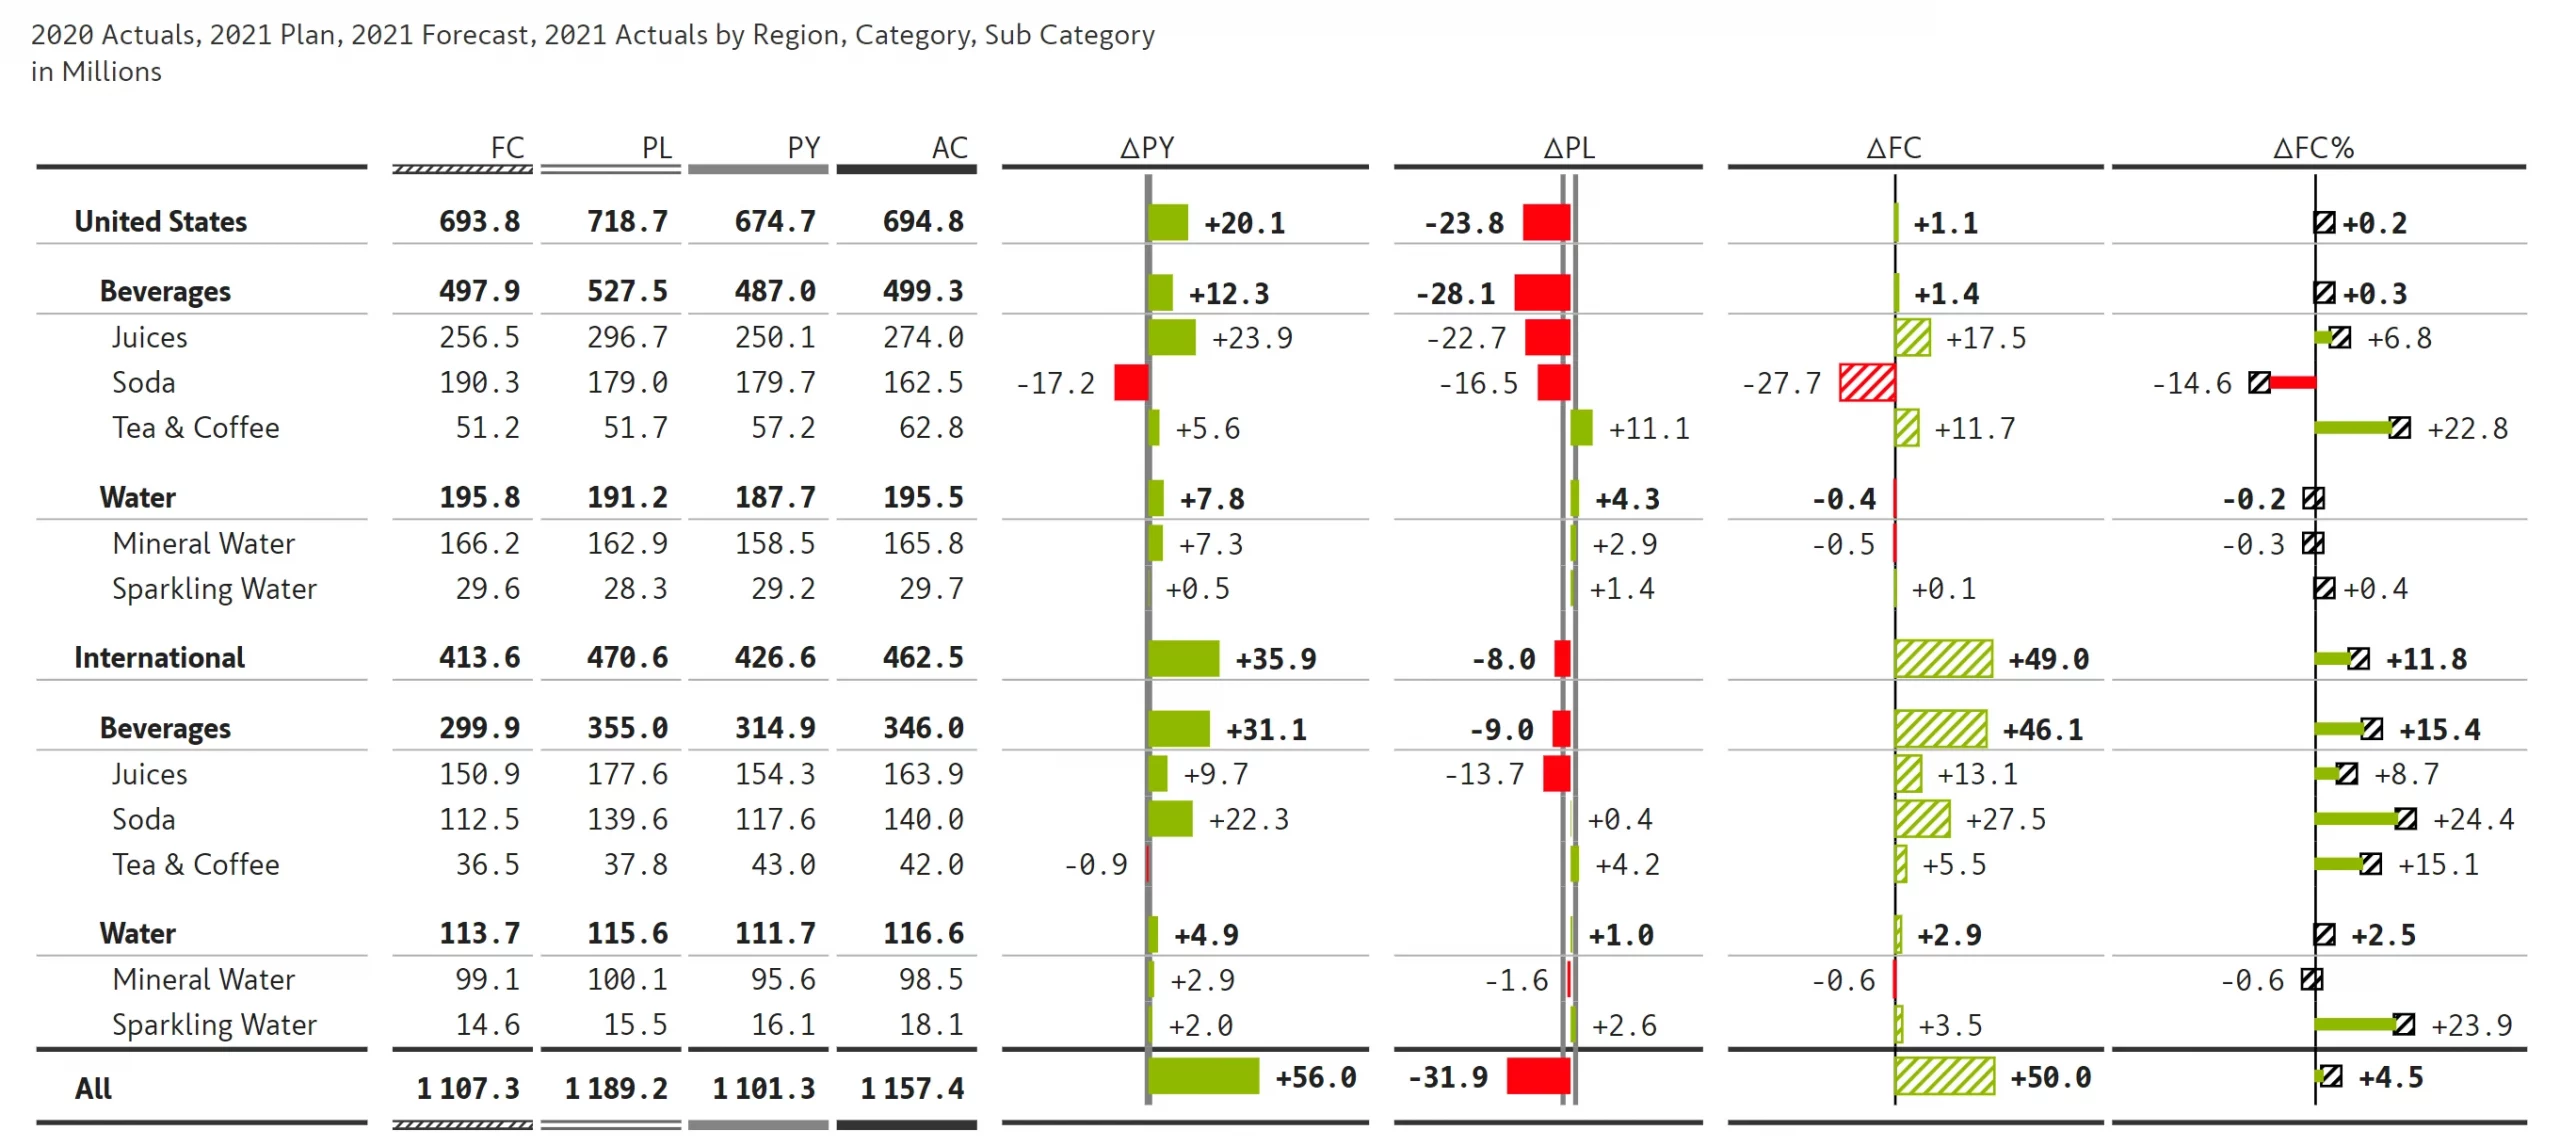
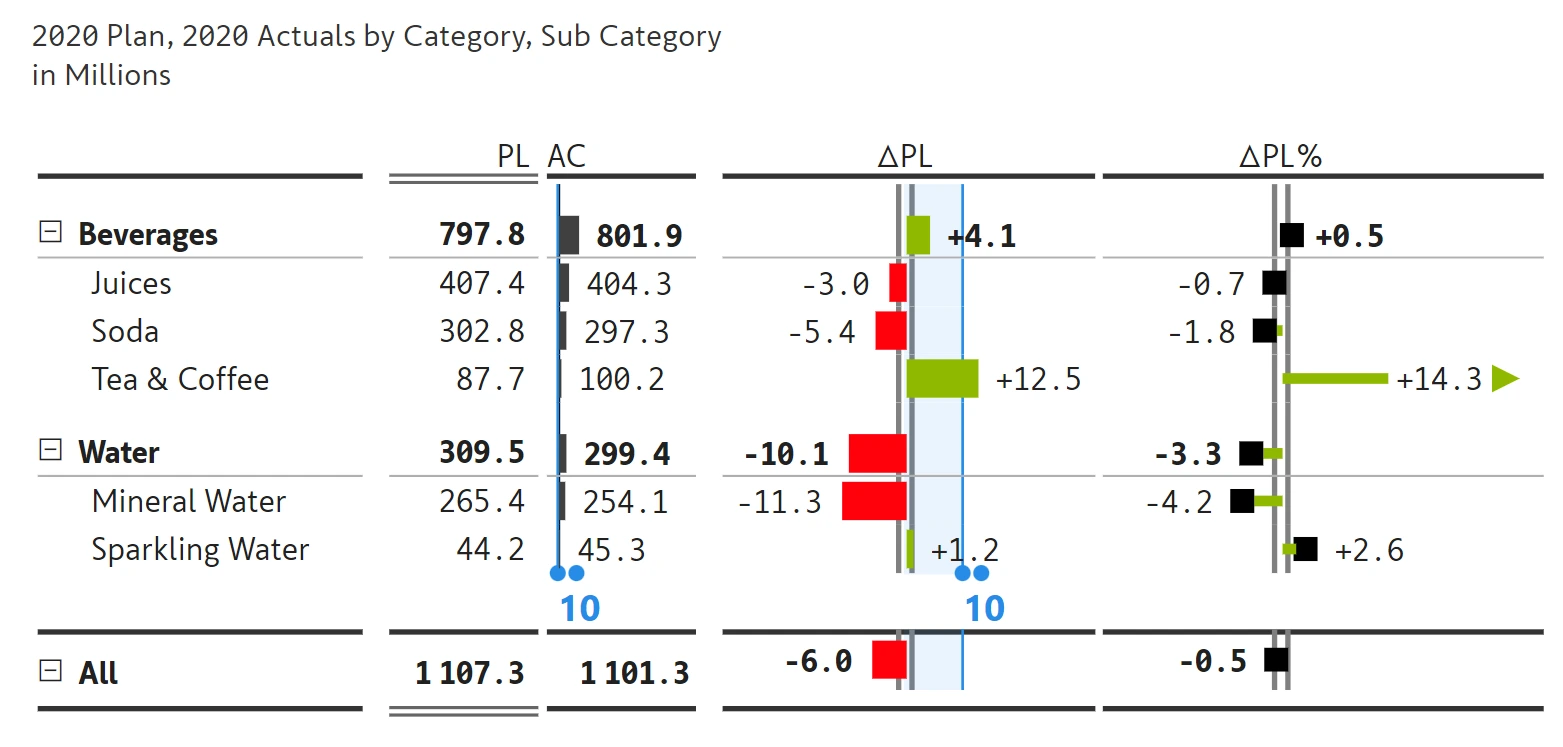
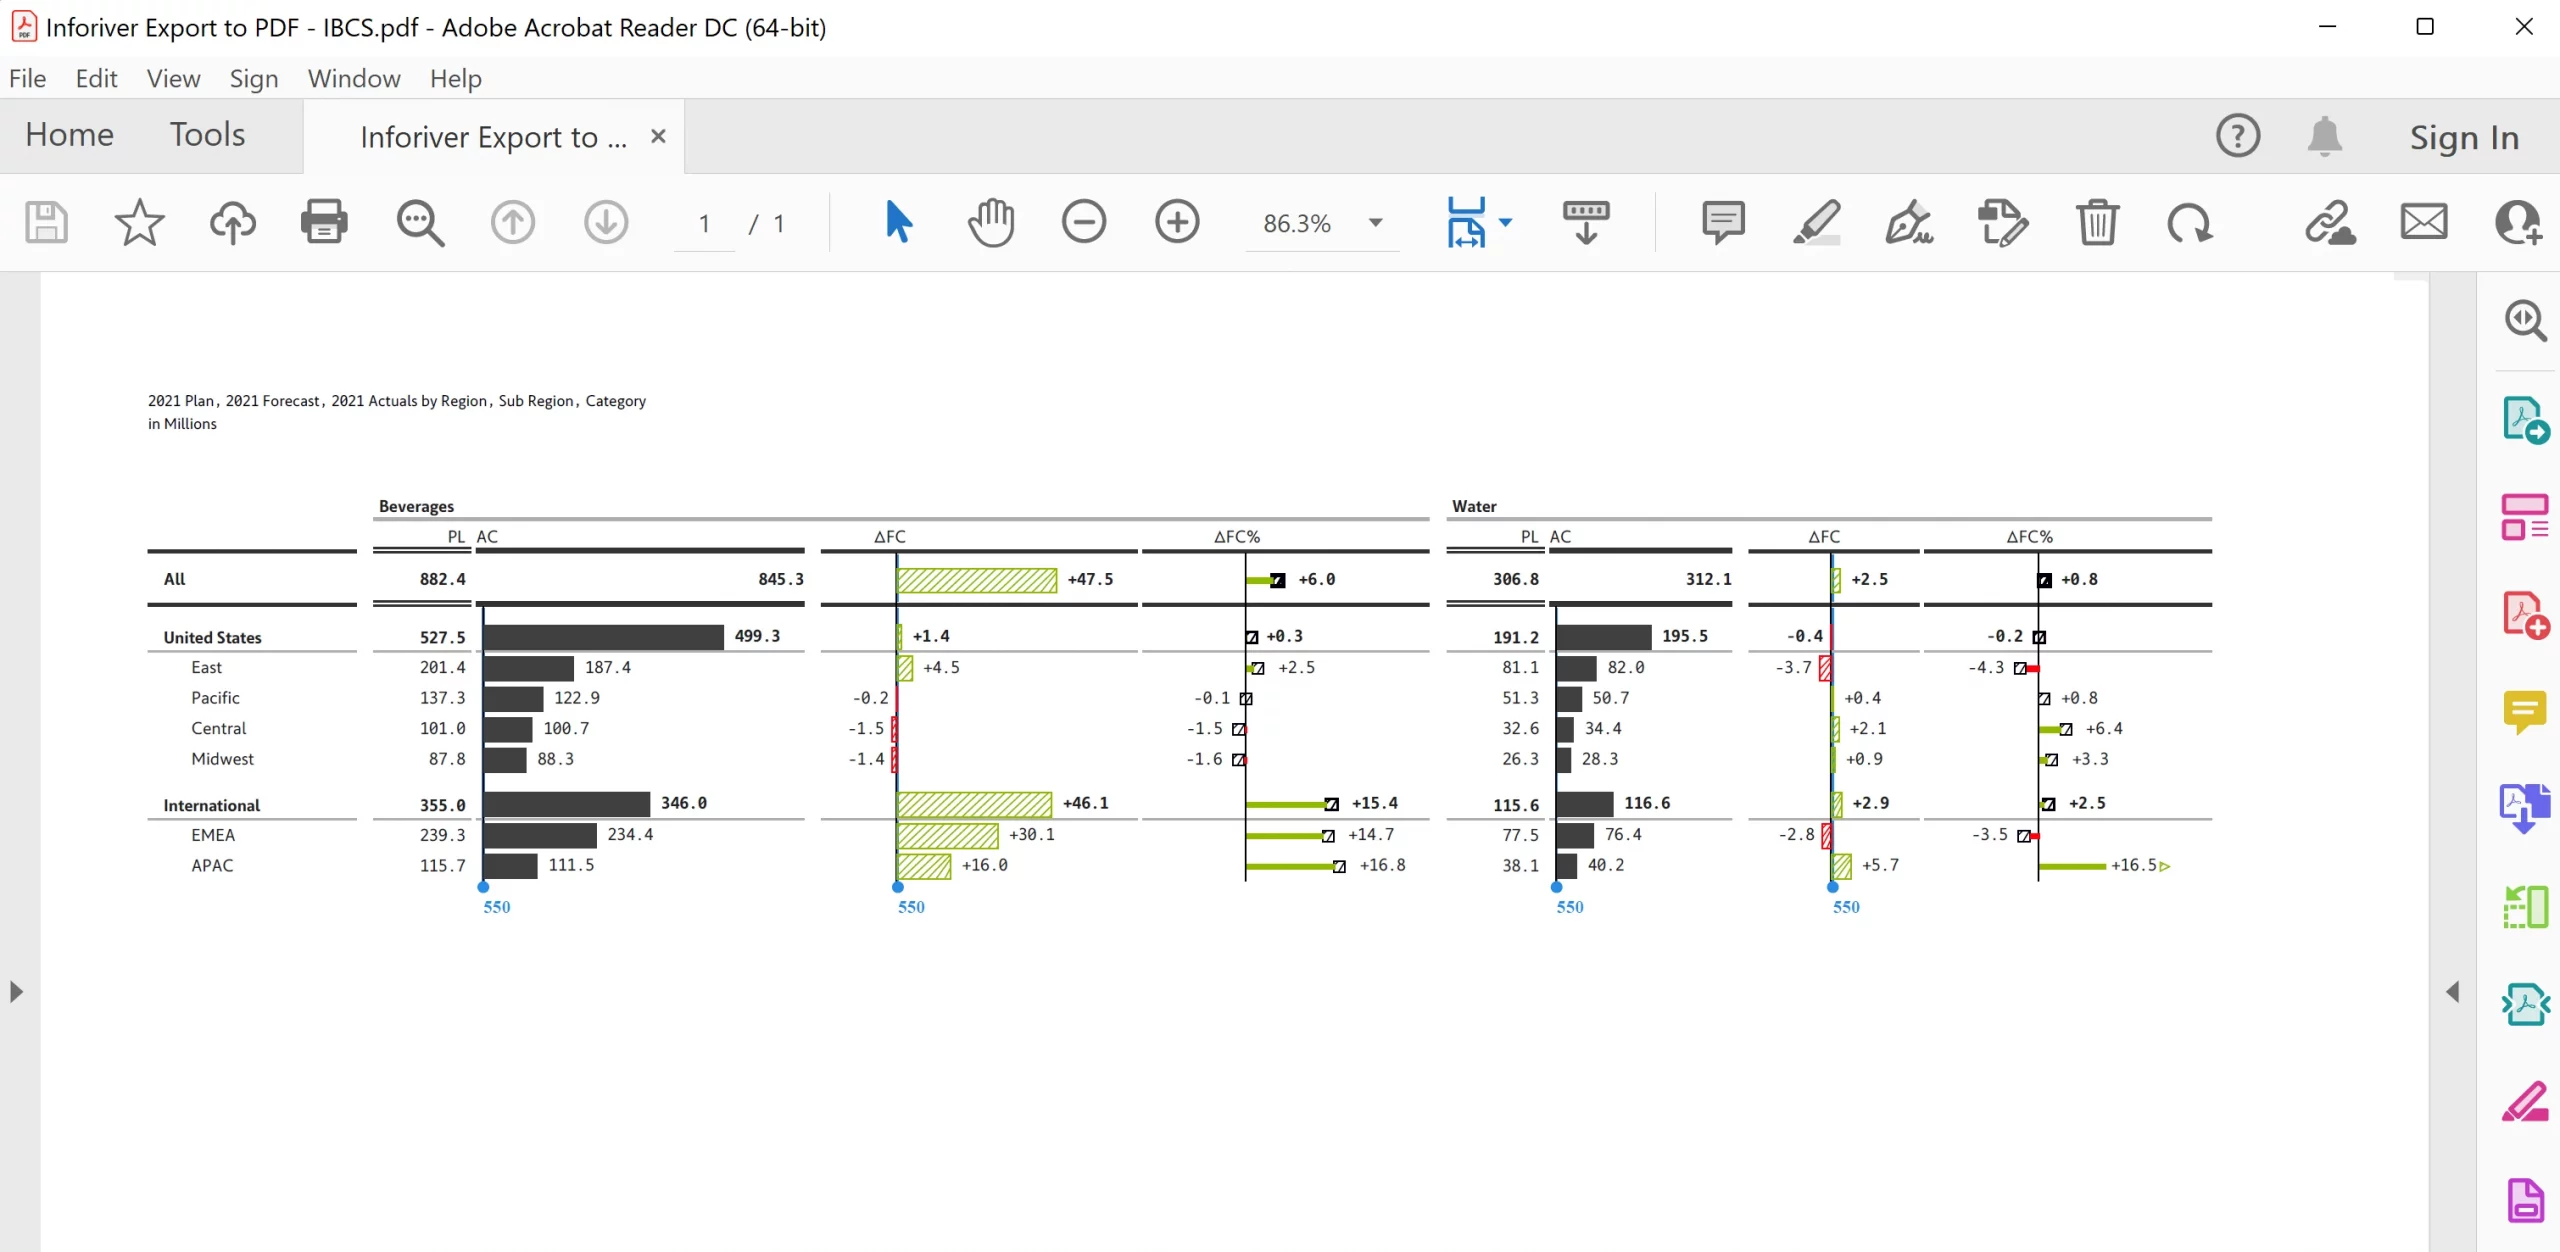
Automatically calculate and visualize variances between actuals, forecasts, plans and prior year
Build IBCS reports from templates in a single click, and switch between templates anytime

Visualize metrics for actuals, forecasts, plans and prior year in relevant IBCS notation
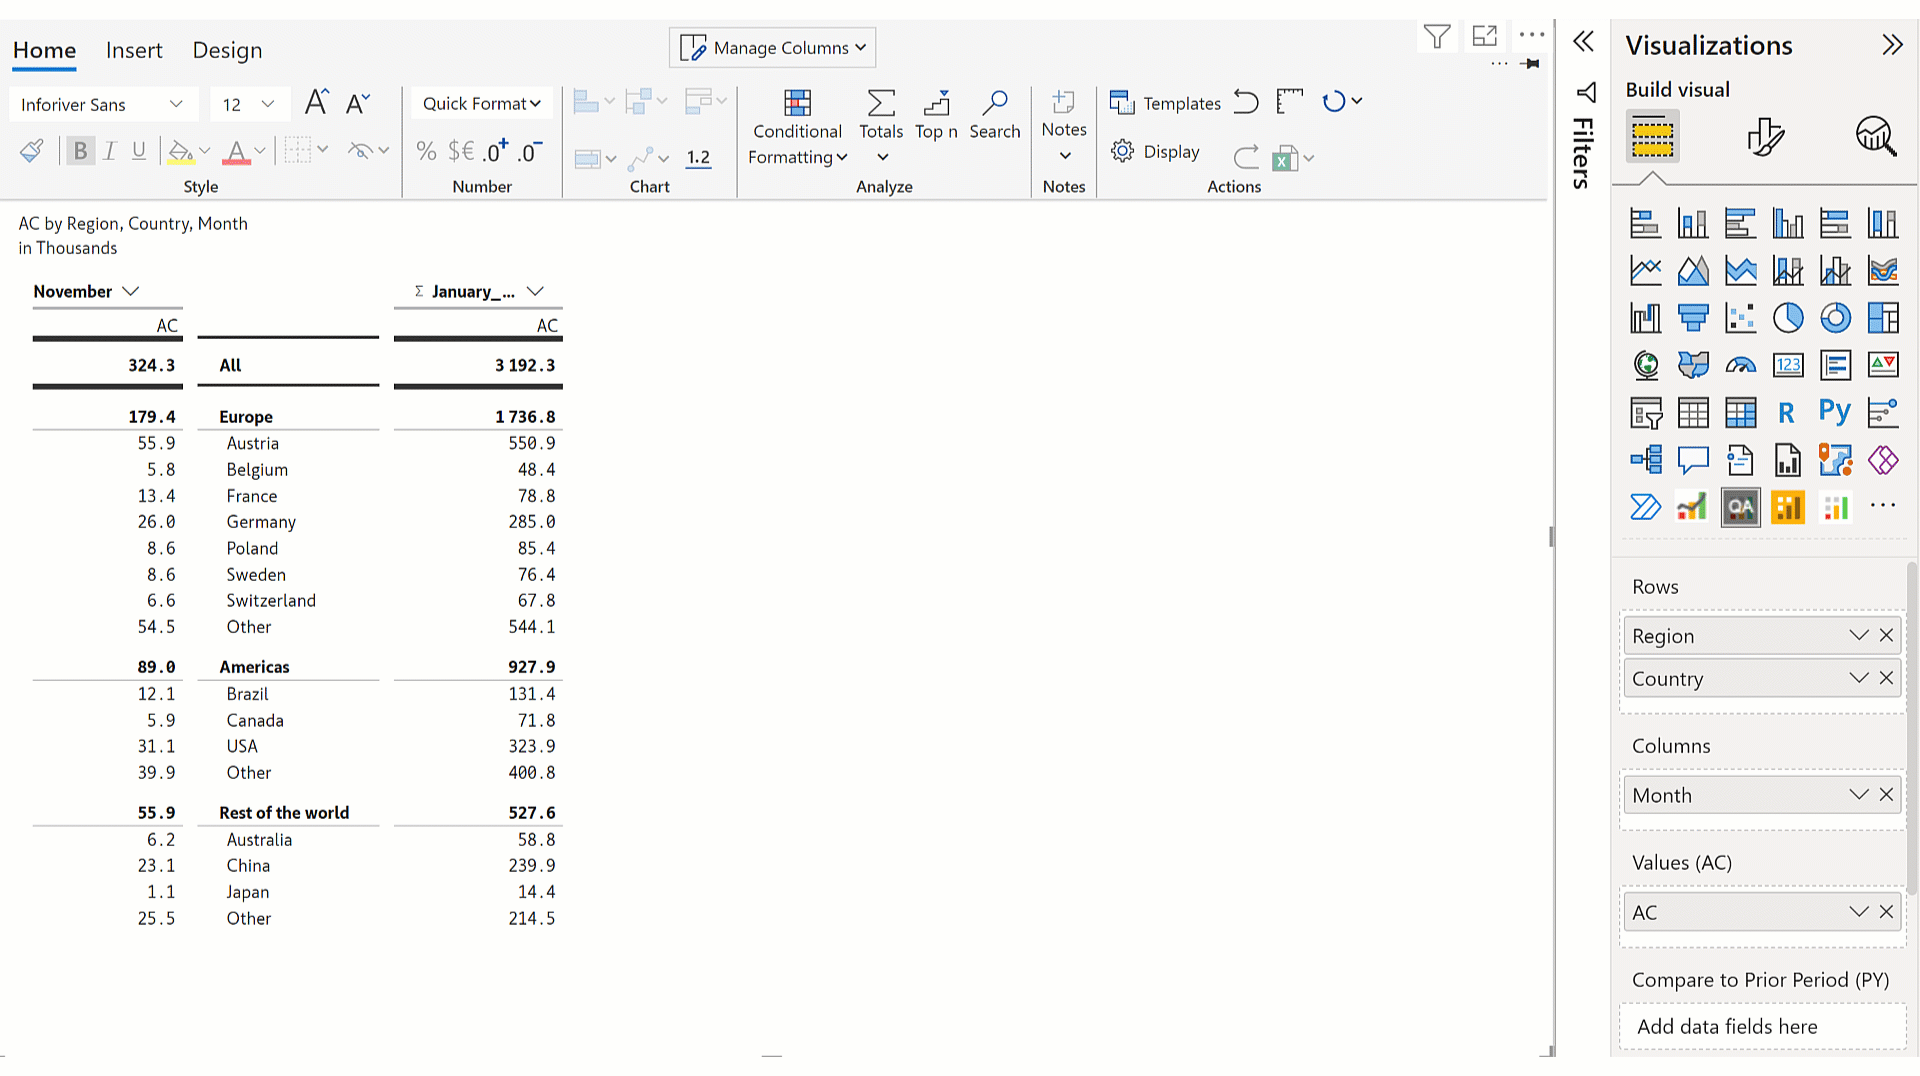
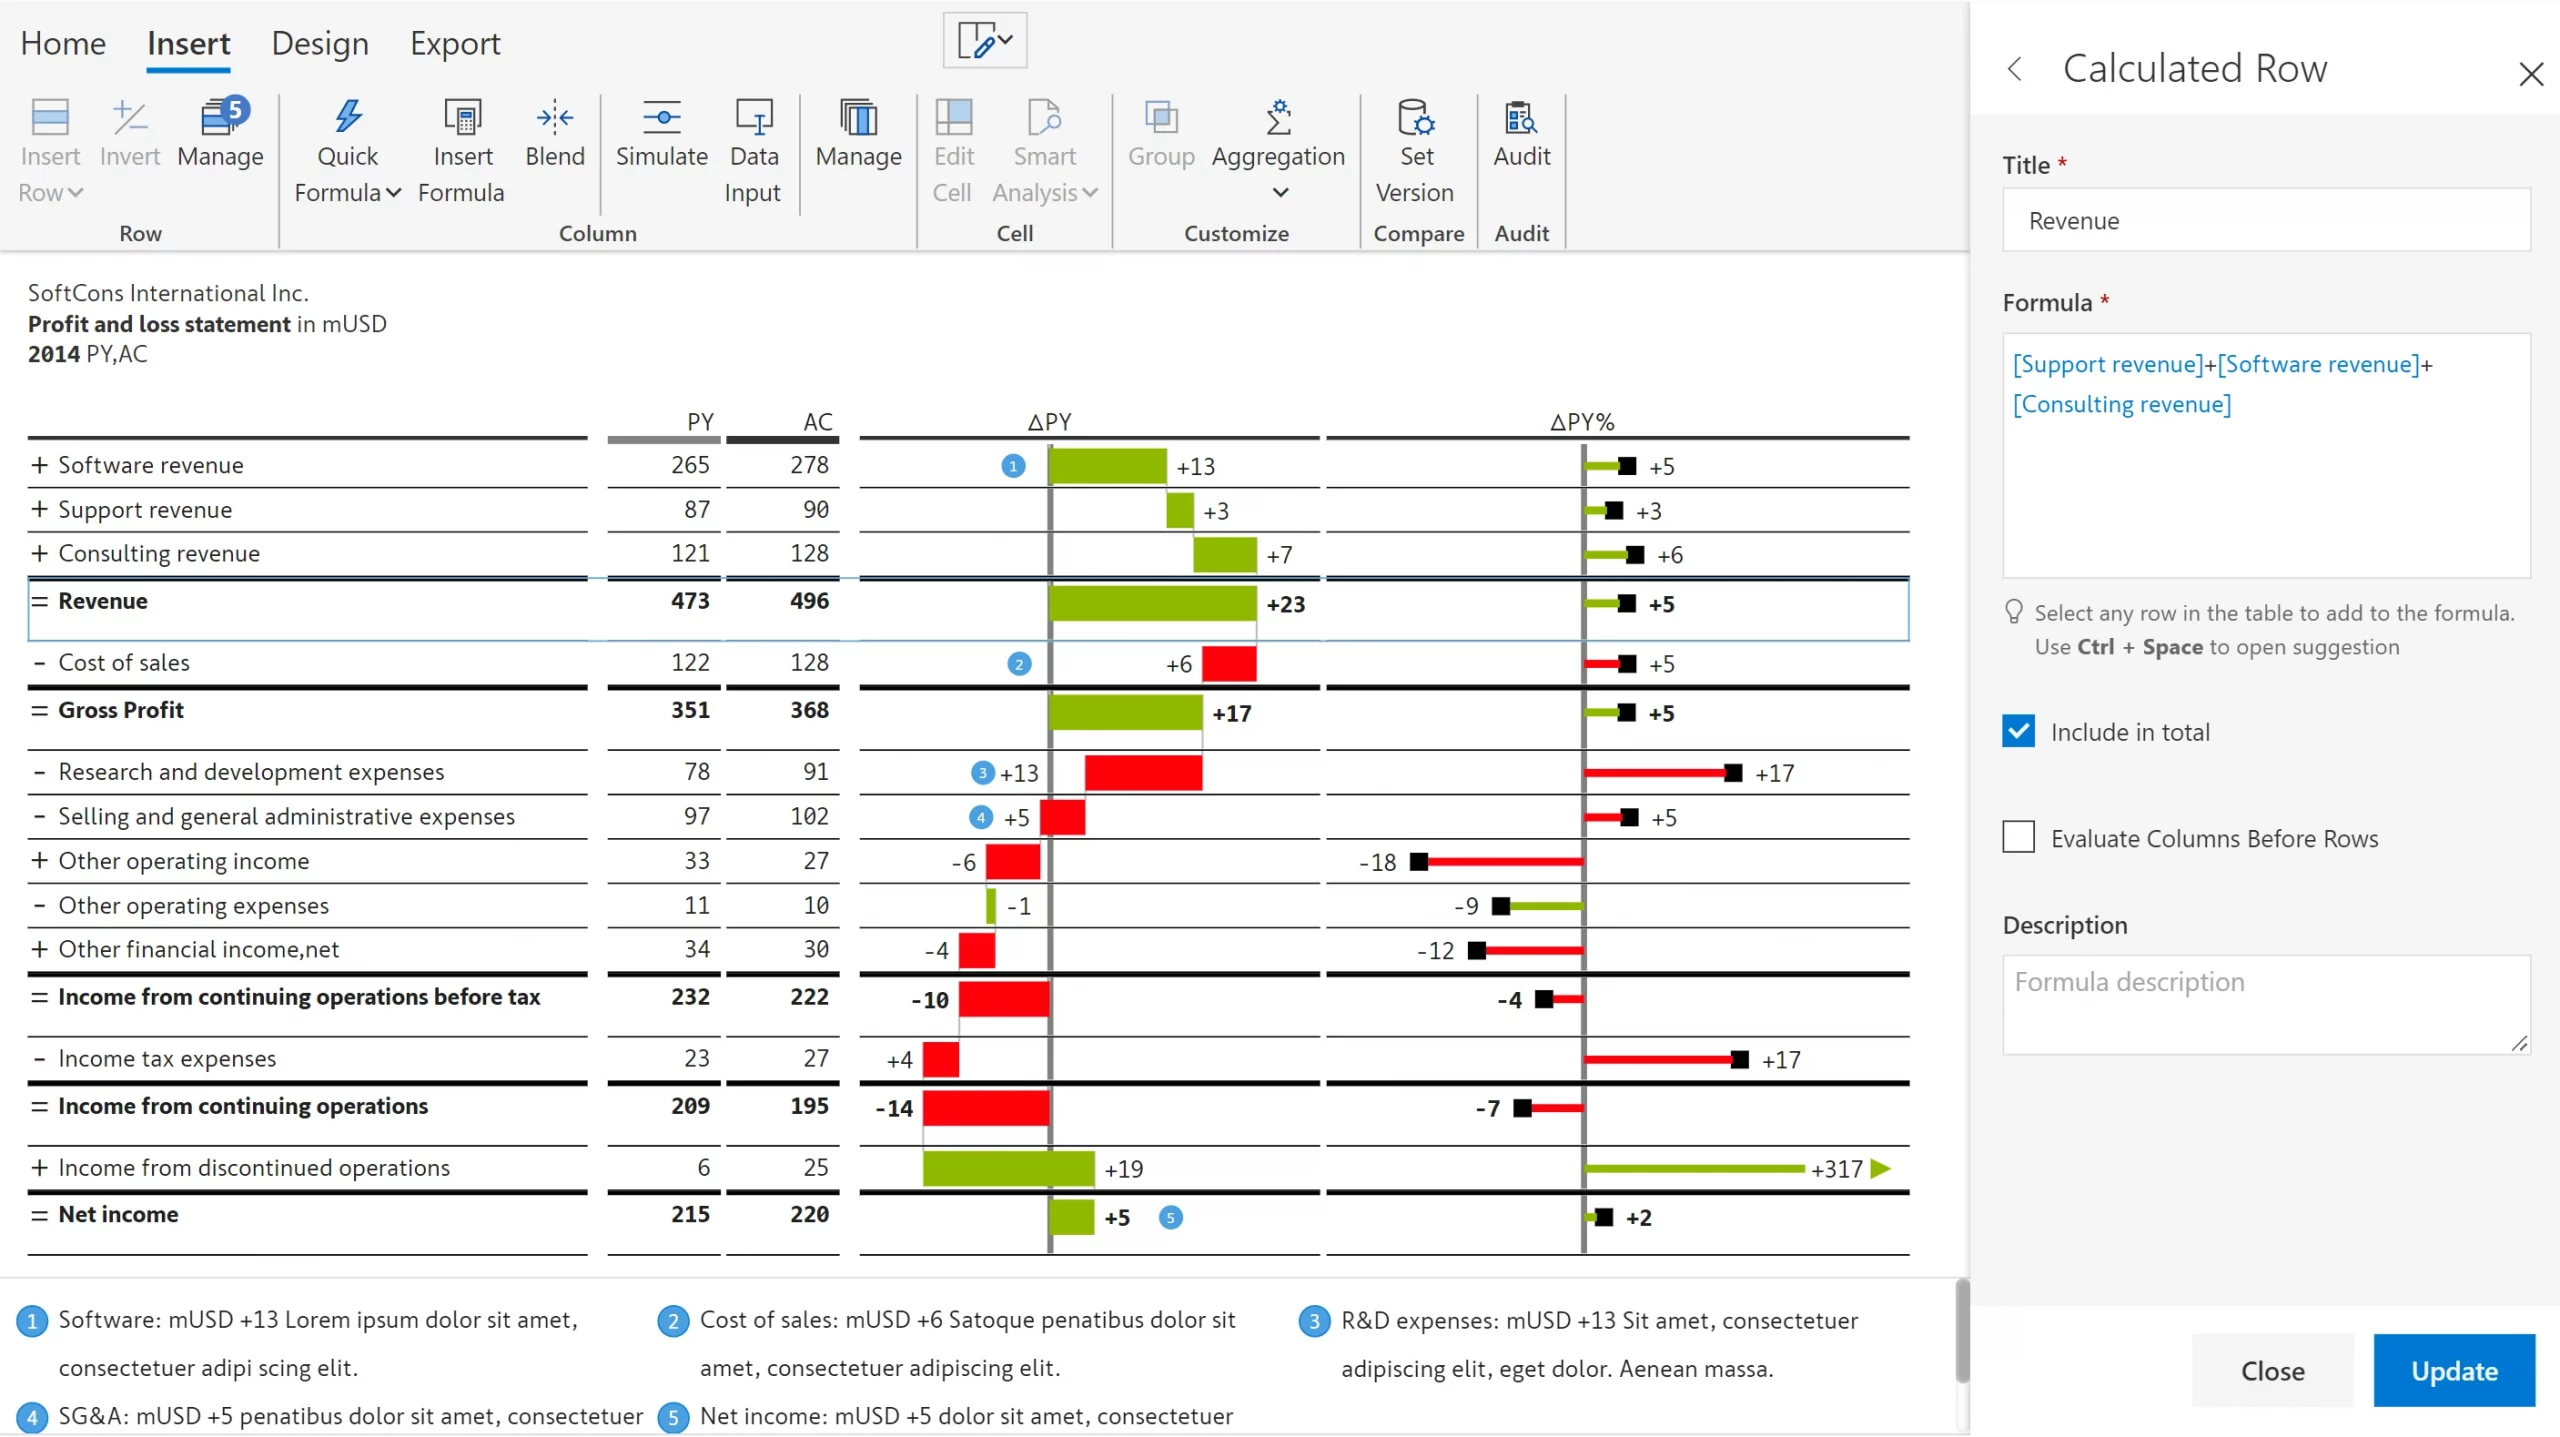
Leverage powerful formula engine to insert rows, columns and measures at the visual-level
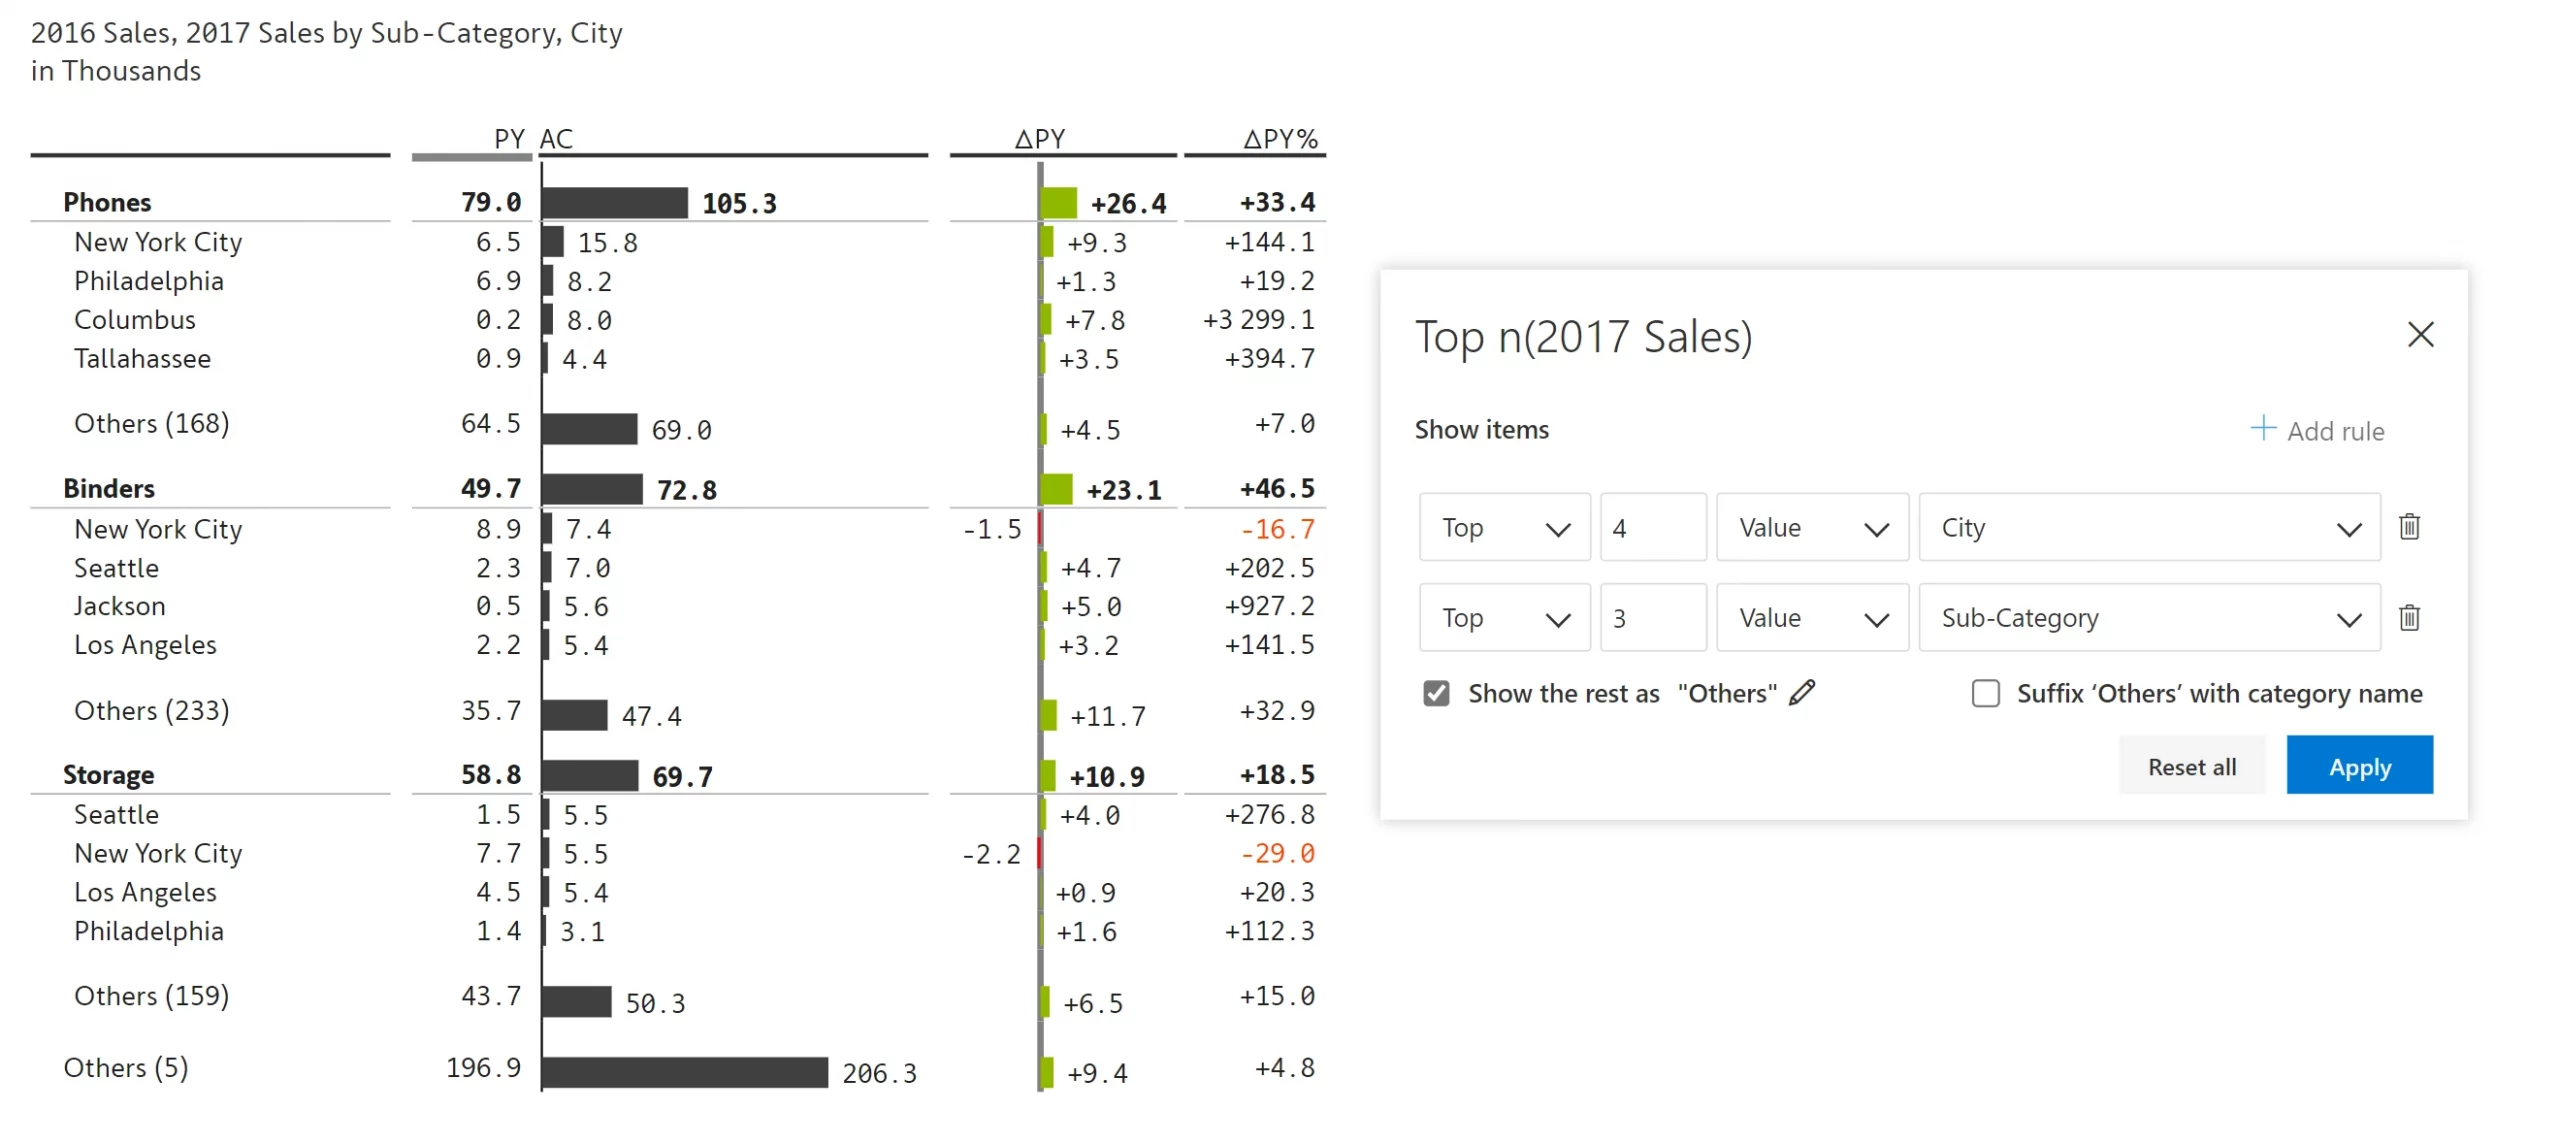
Filter the top/bottom N categories and display the rest as others
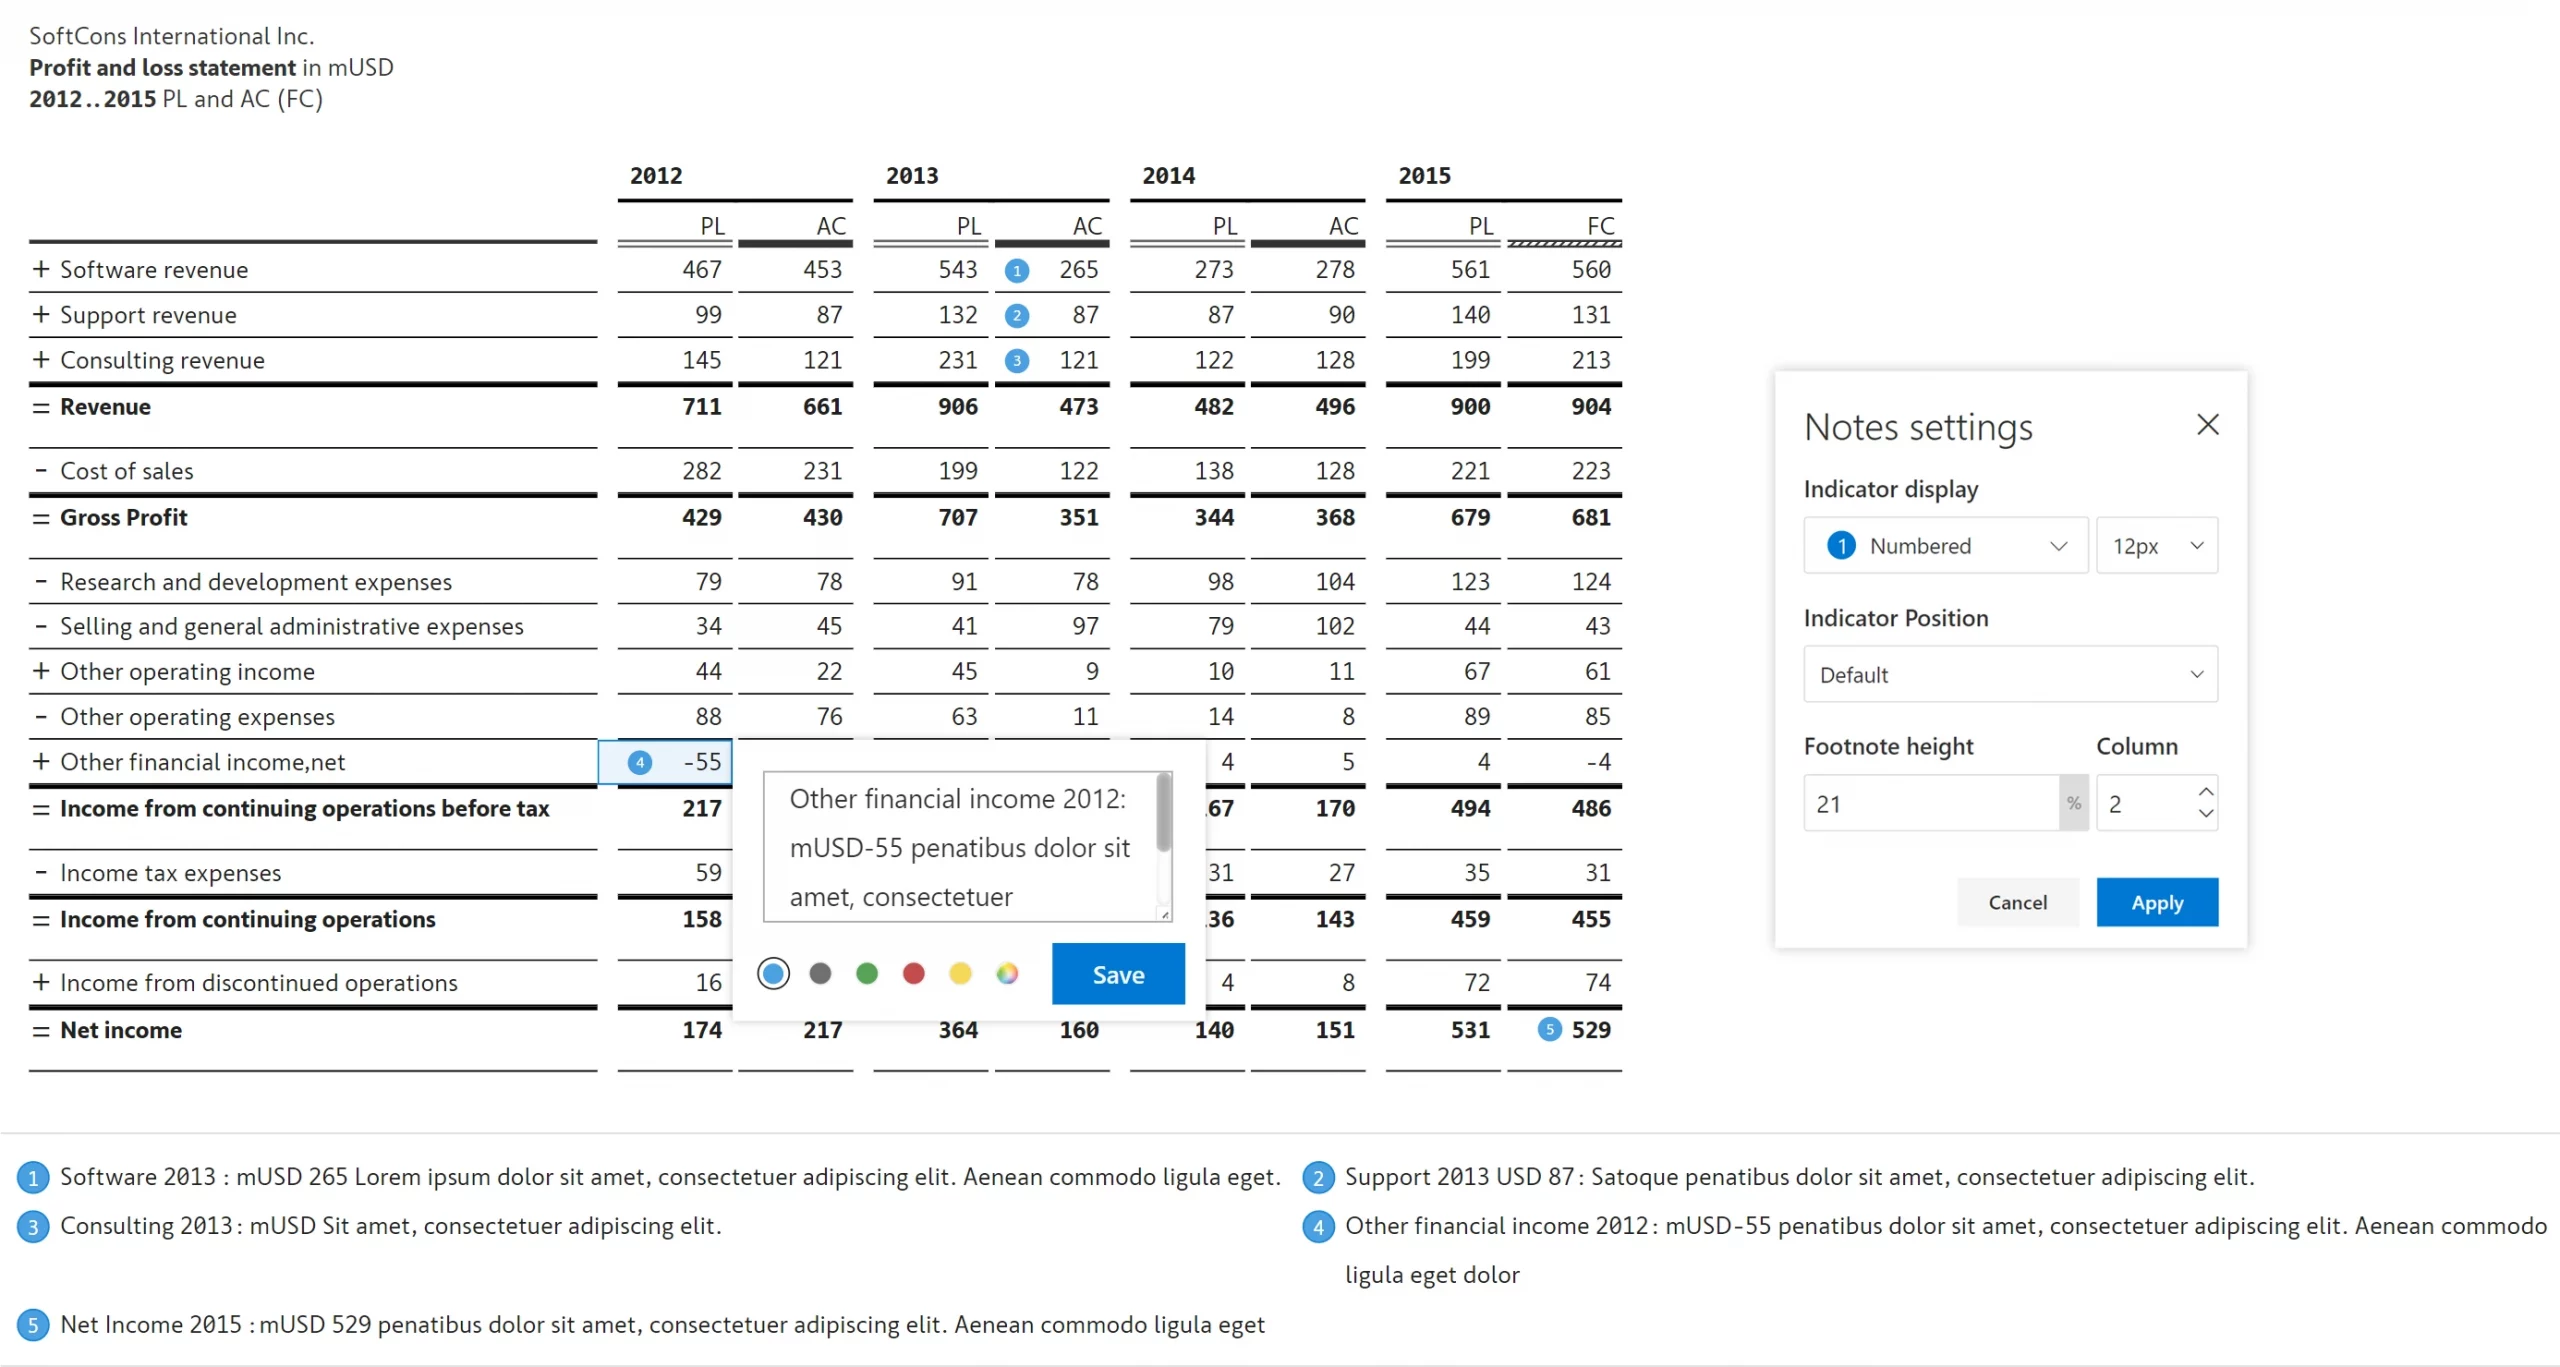
Enhance your IBCS data stories with cell, row & column-level notes, footnotes & annotations
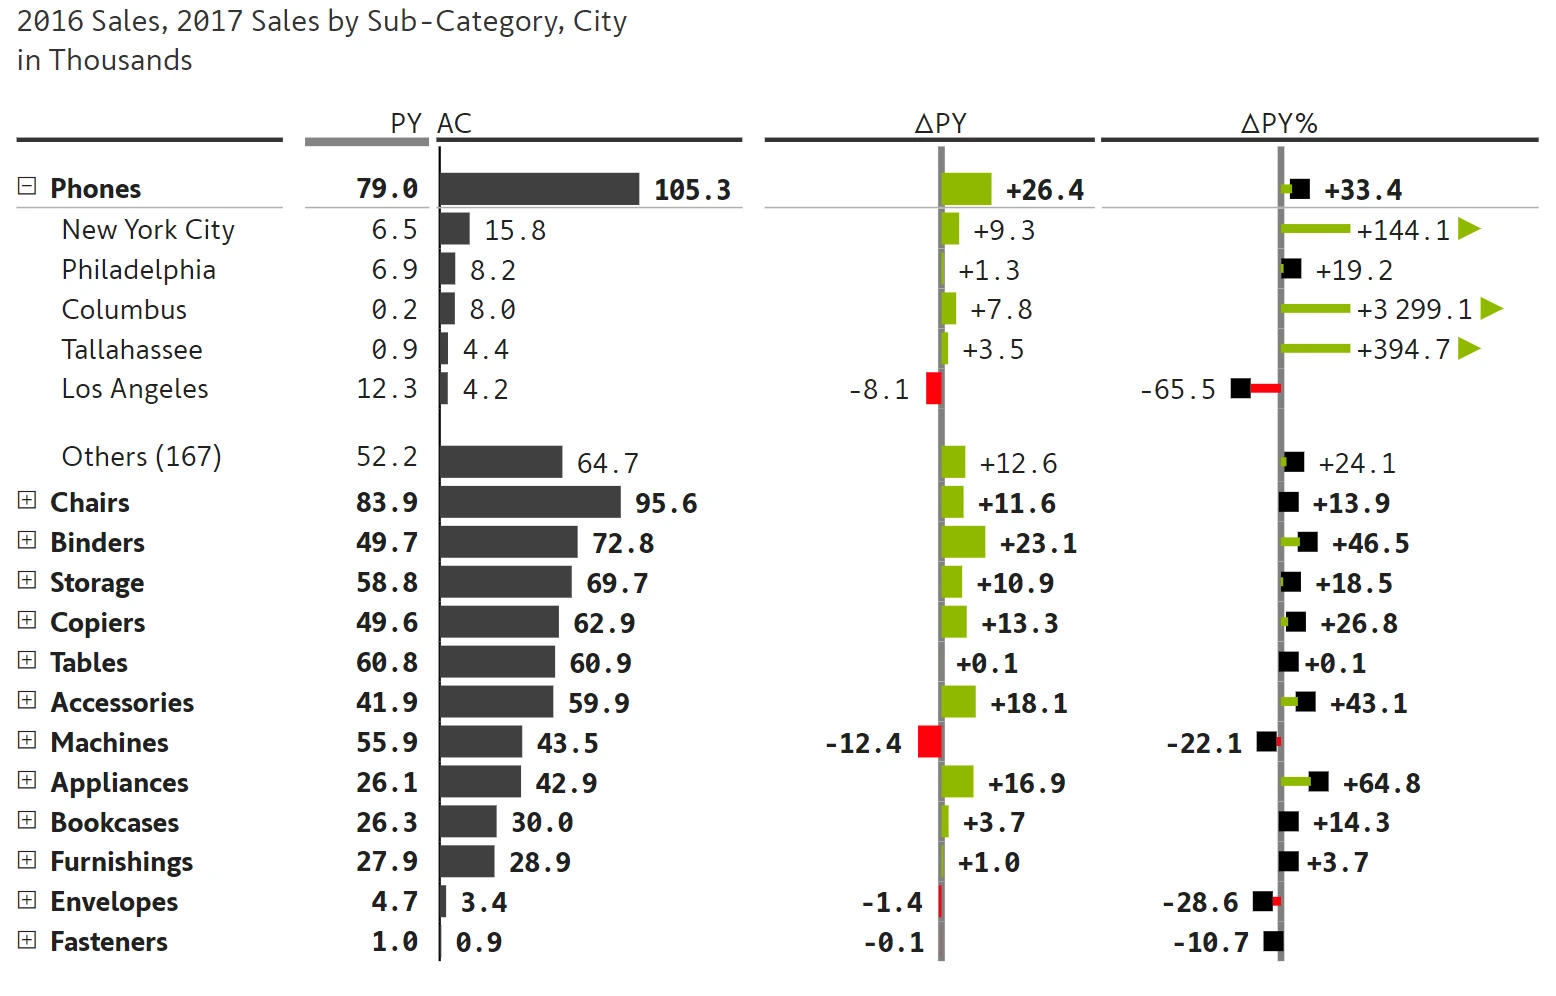
Leverage expandable & collapsible hierarchies in rows & columns
Implement scale bands for enhanced comprehension of variances
Handle accounting signs for expense items using the Invert and Influence total options
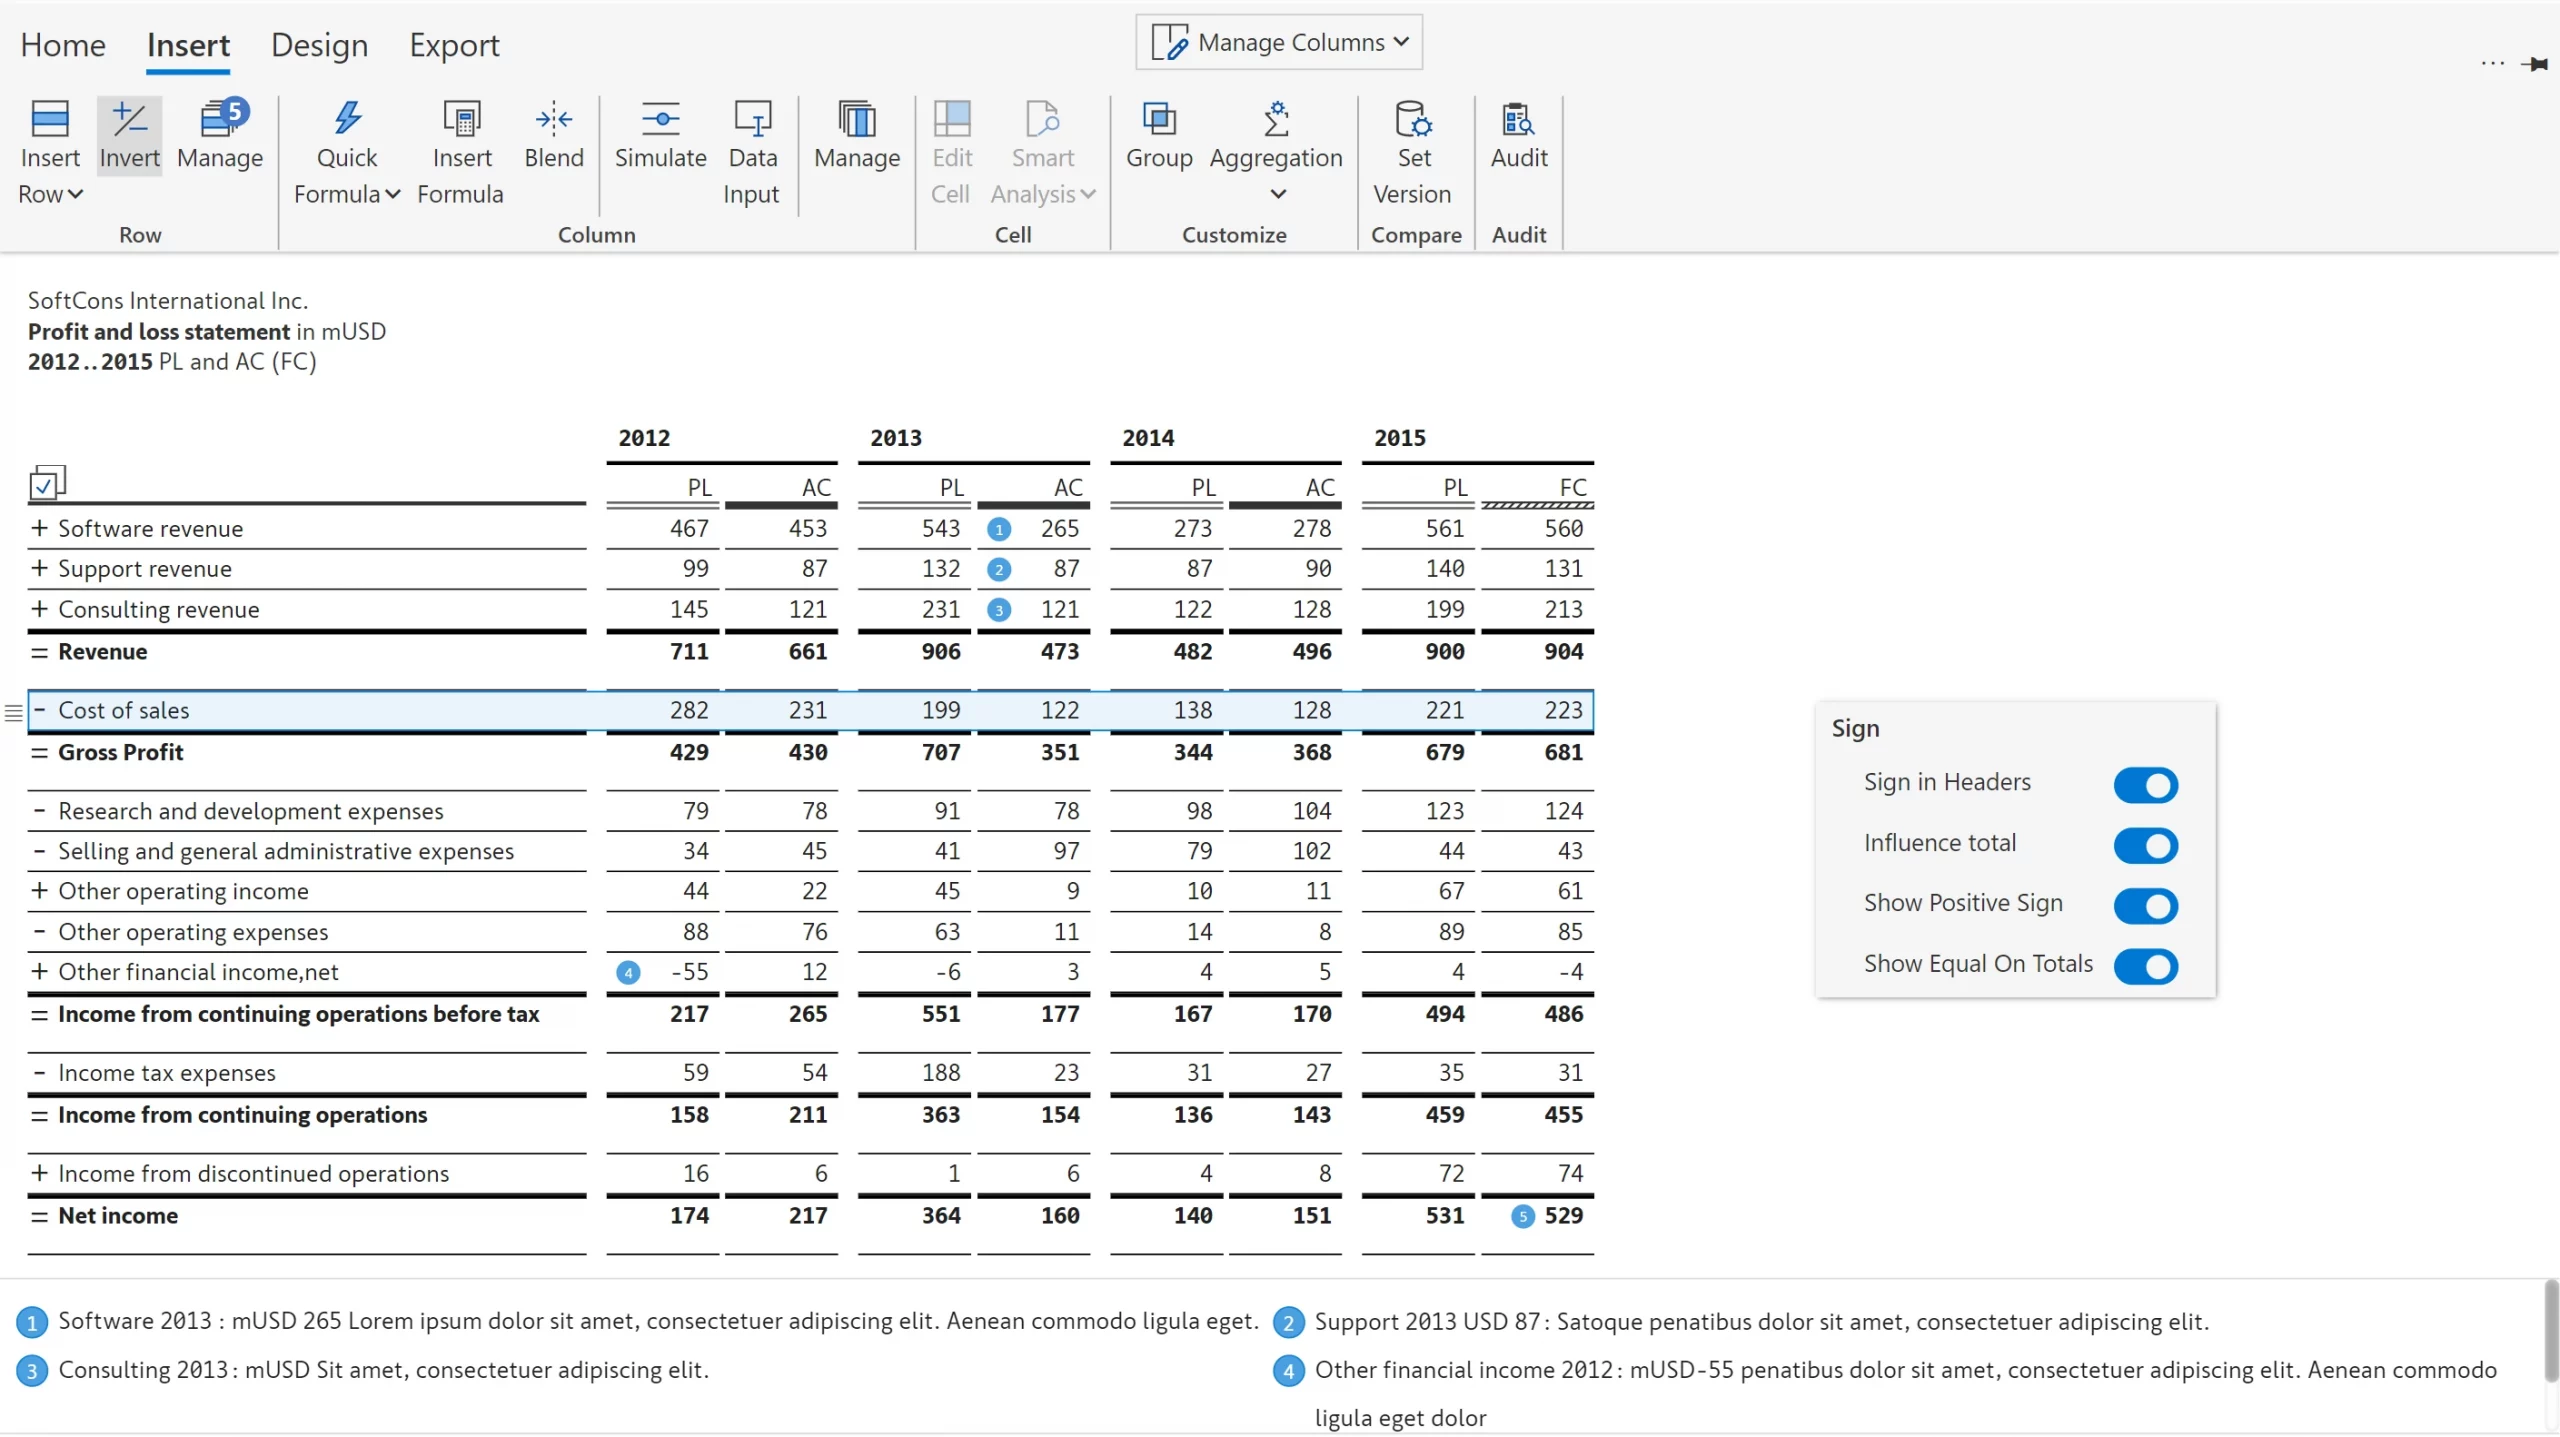
Export to Excel or PDF files along with formatting; Exports to PDF are JSON-based and not image exports

Inforiver helps enterprises consolidate planning, reporting & analytics on a single platform (Power BI). The no-code, self-service award-winning platform has been recognized as the industry’s best and is adopted by many Fortune 100 firms.
Inforiver is a product of Lumel, the #1 Power BI AppSource Partner. The firm serves over 3,000 customers worldwide through its portfolio of products offered under the brands Inforiver, EDITable, ValQ, and xViz.