Upcoming webinar on 'Inforiver Charts : The fastest way to deliver stories in Power BI', Aug 29th , Monday, 10.30 AM CST. Register Now
Upcoming webinar on 'Inforiver Charts : The fastest way to deliver stories in Power BI', Aug 29th , Monday, 10.30 AM CST. Register Now
Explore what Inforiver can do for you
Explore the wide range of Charts and Table templates Inforiver offers
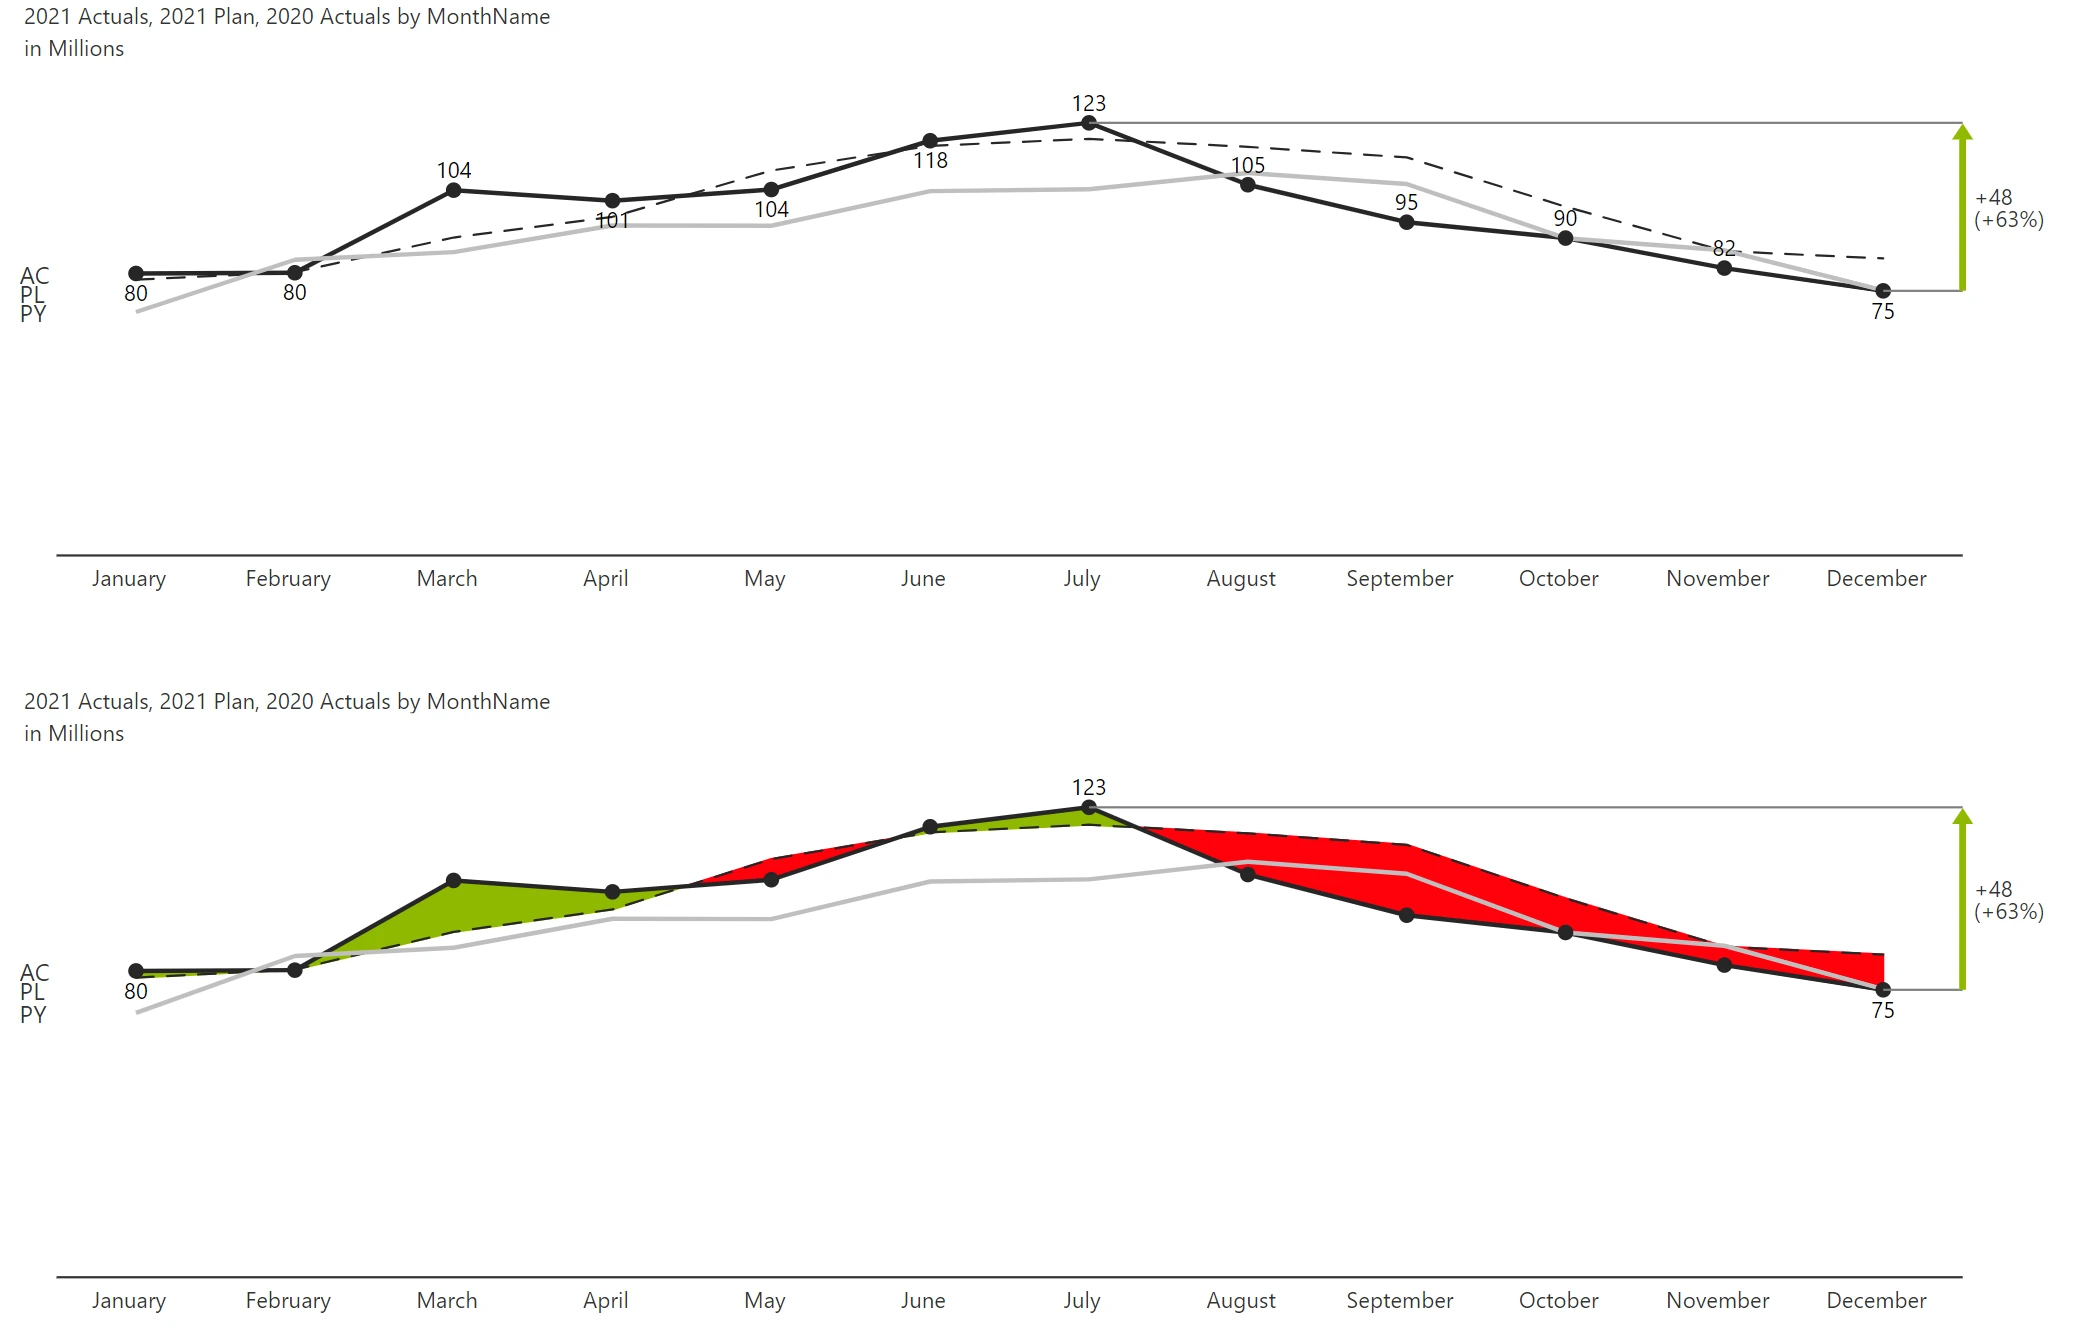
Visualize temporal development of multiple data series
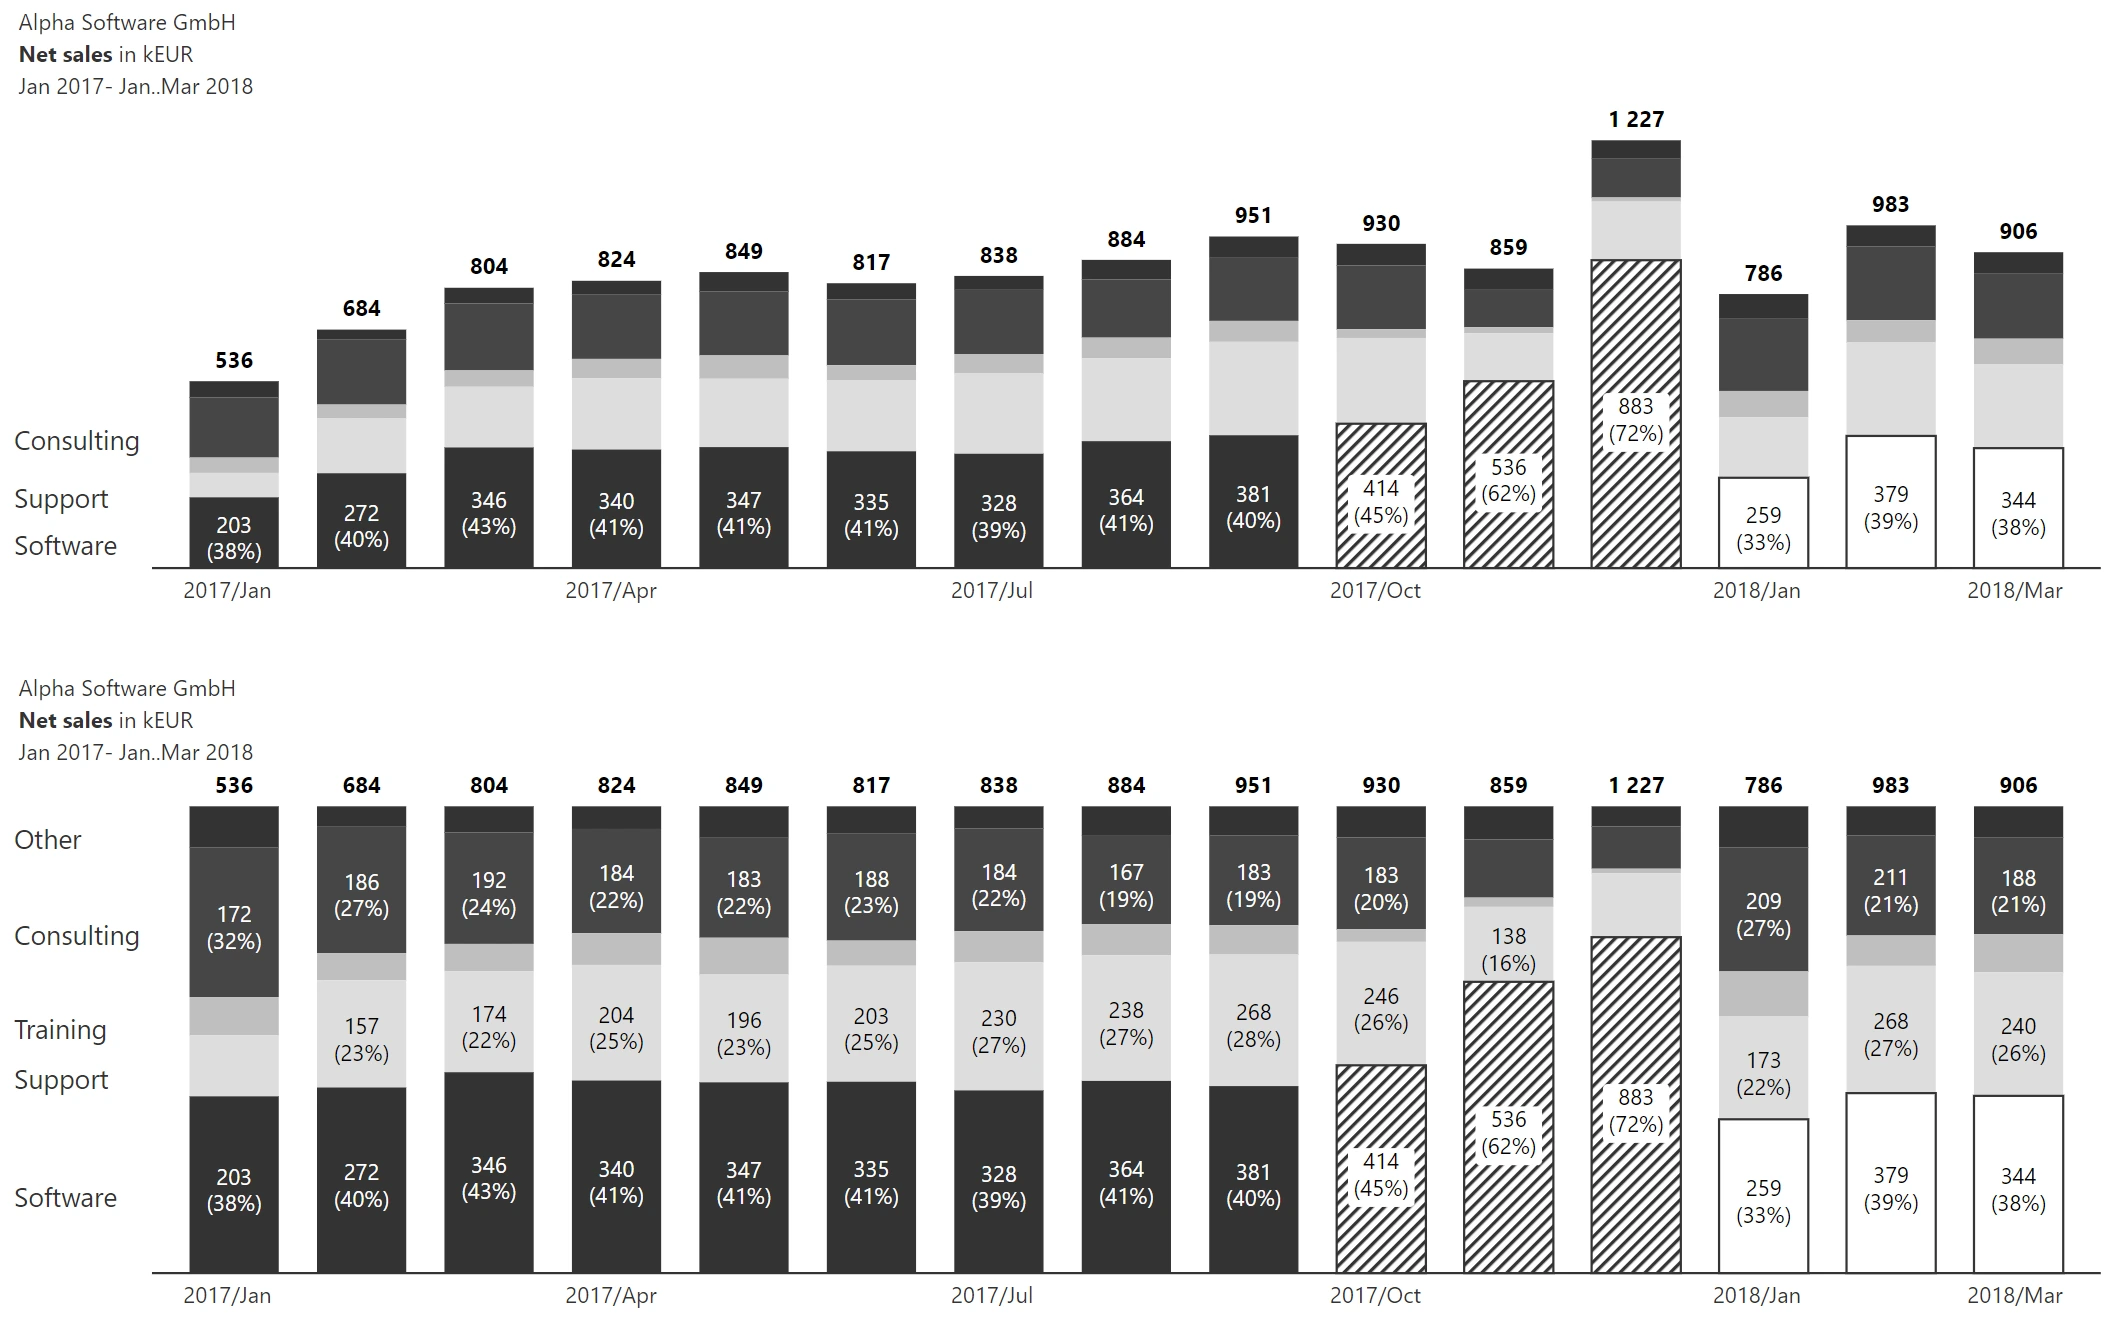
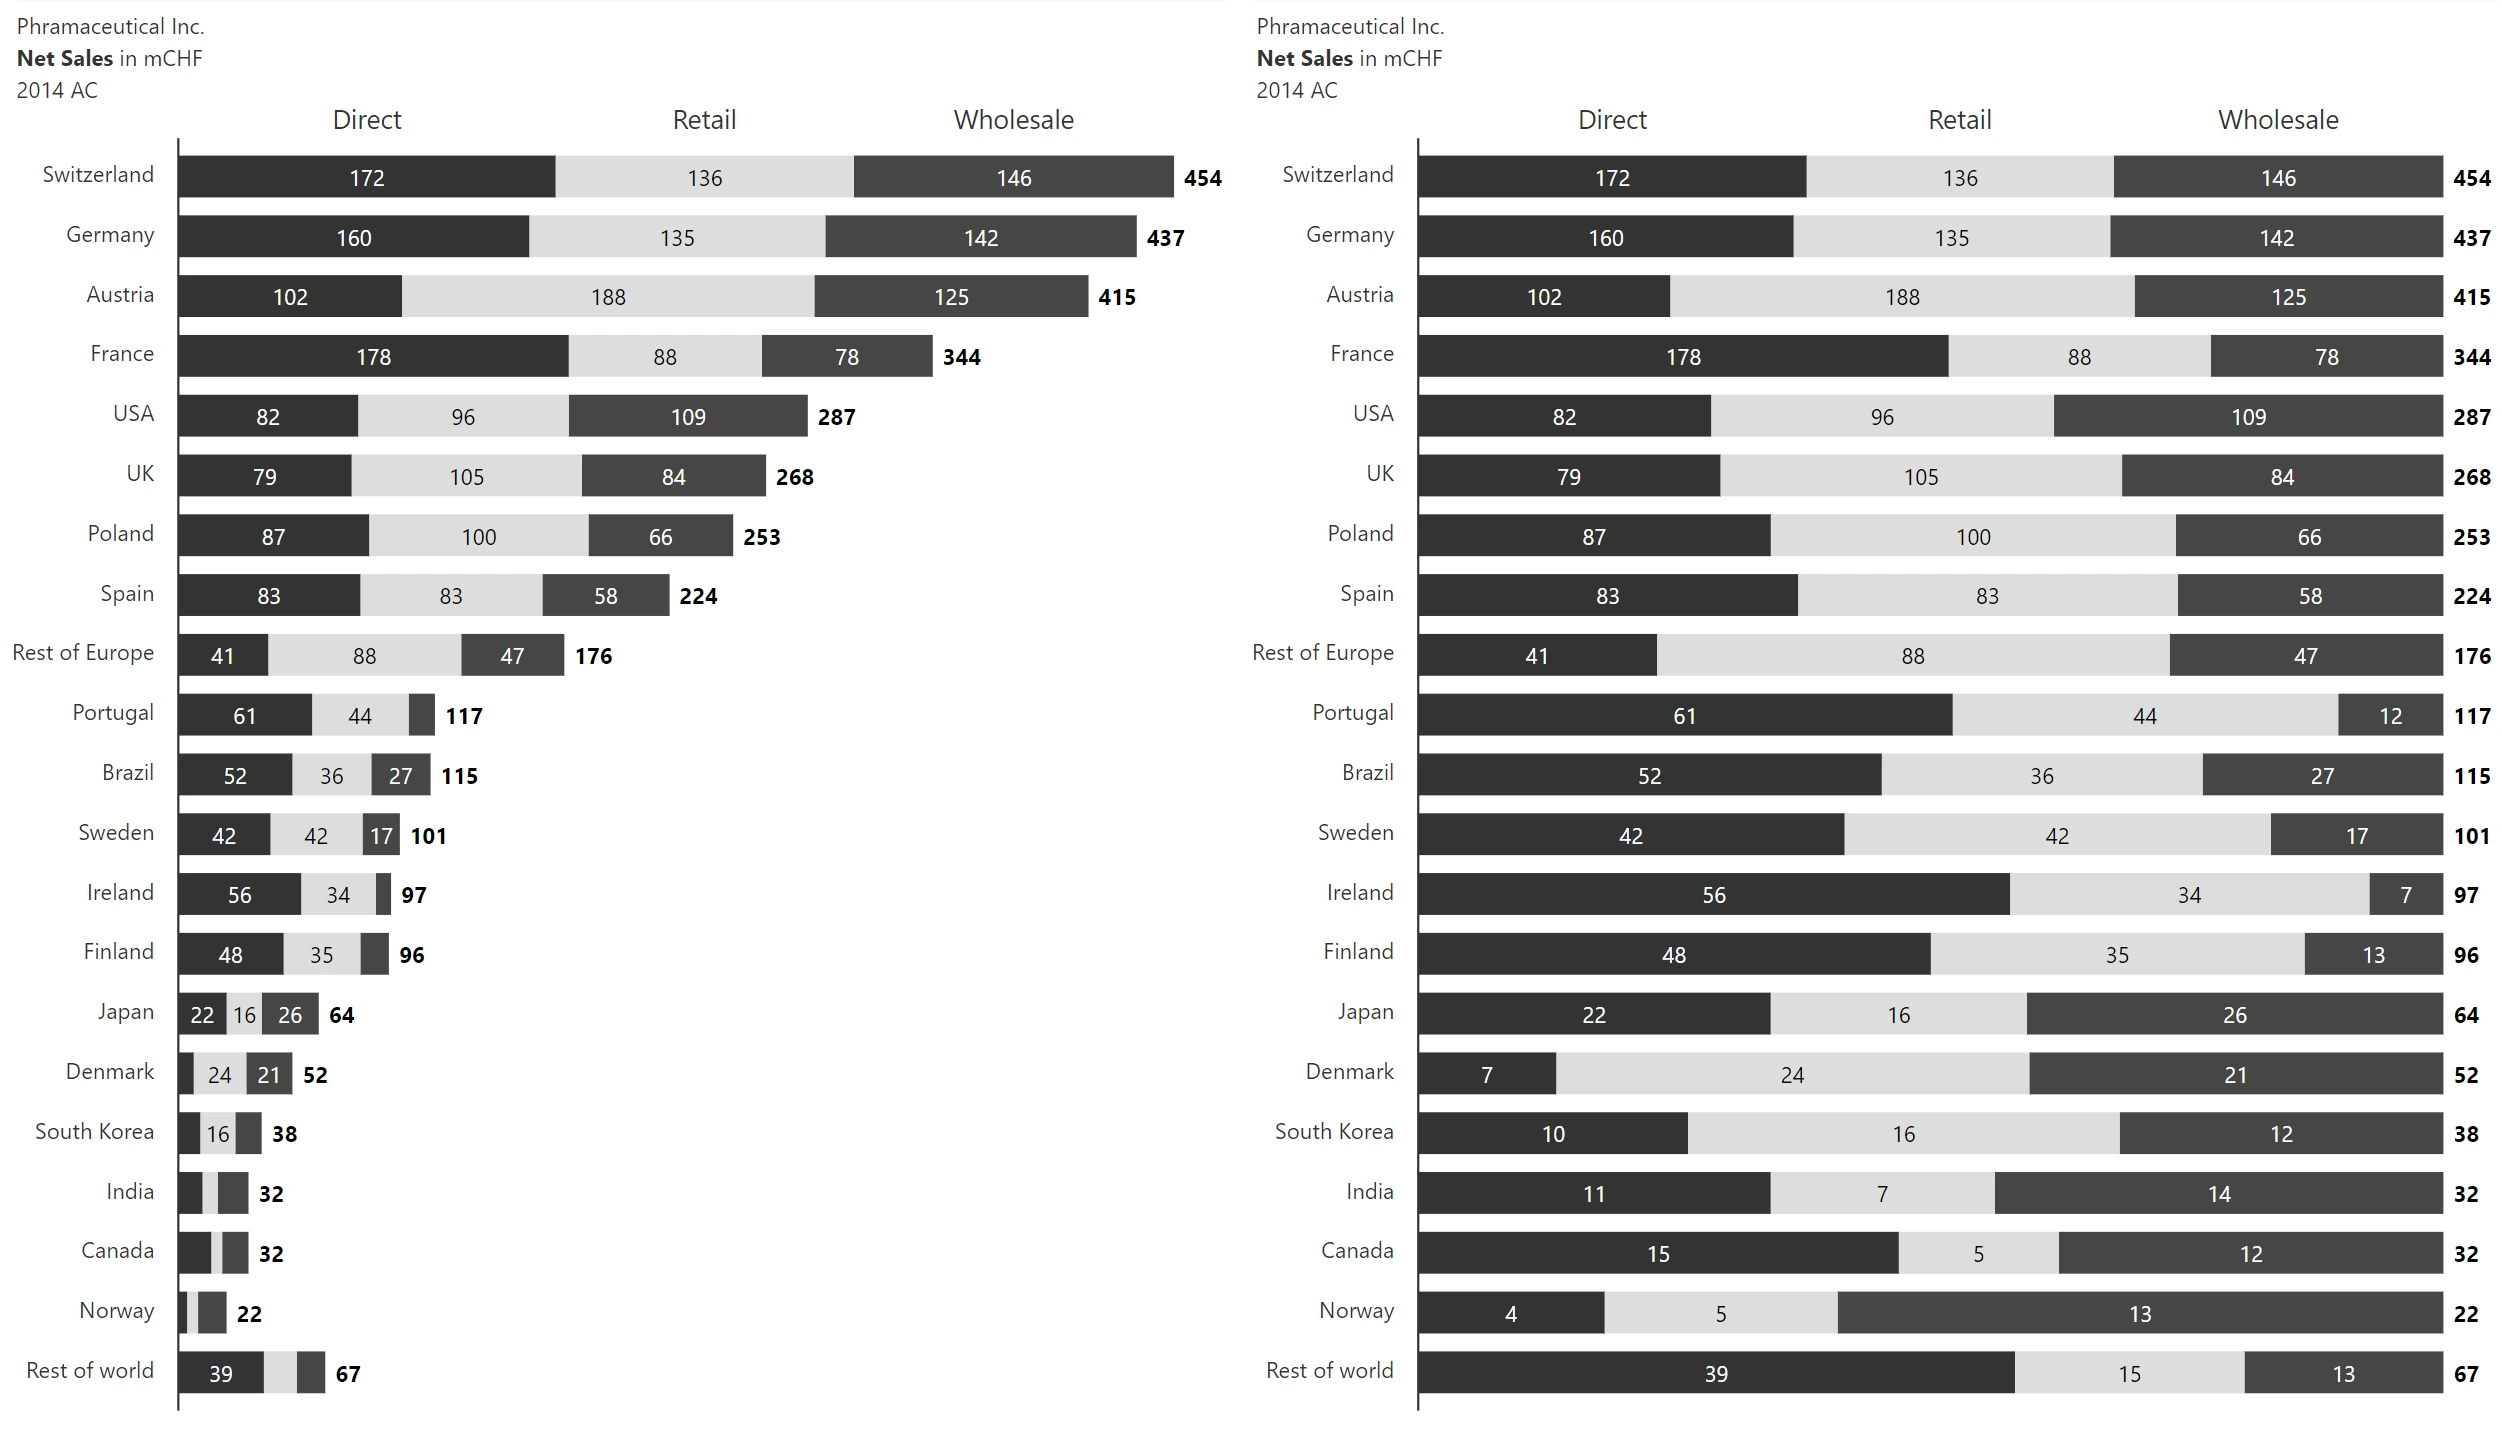
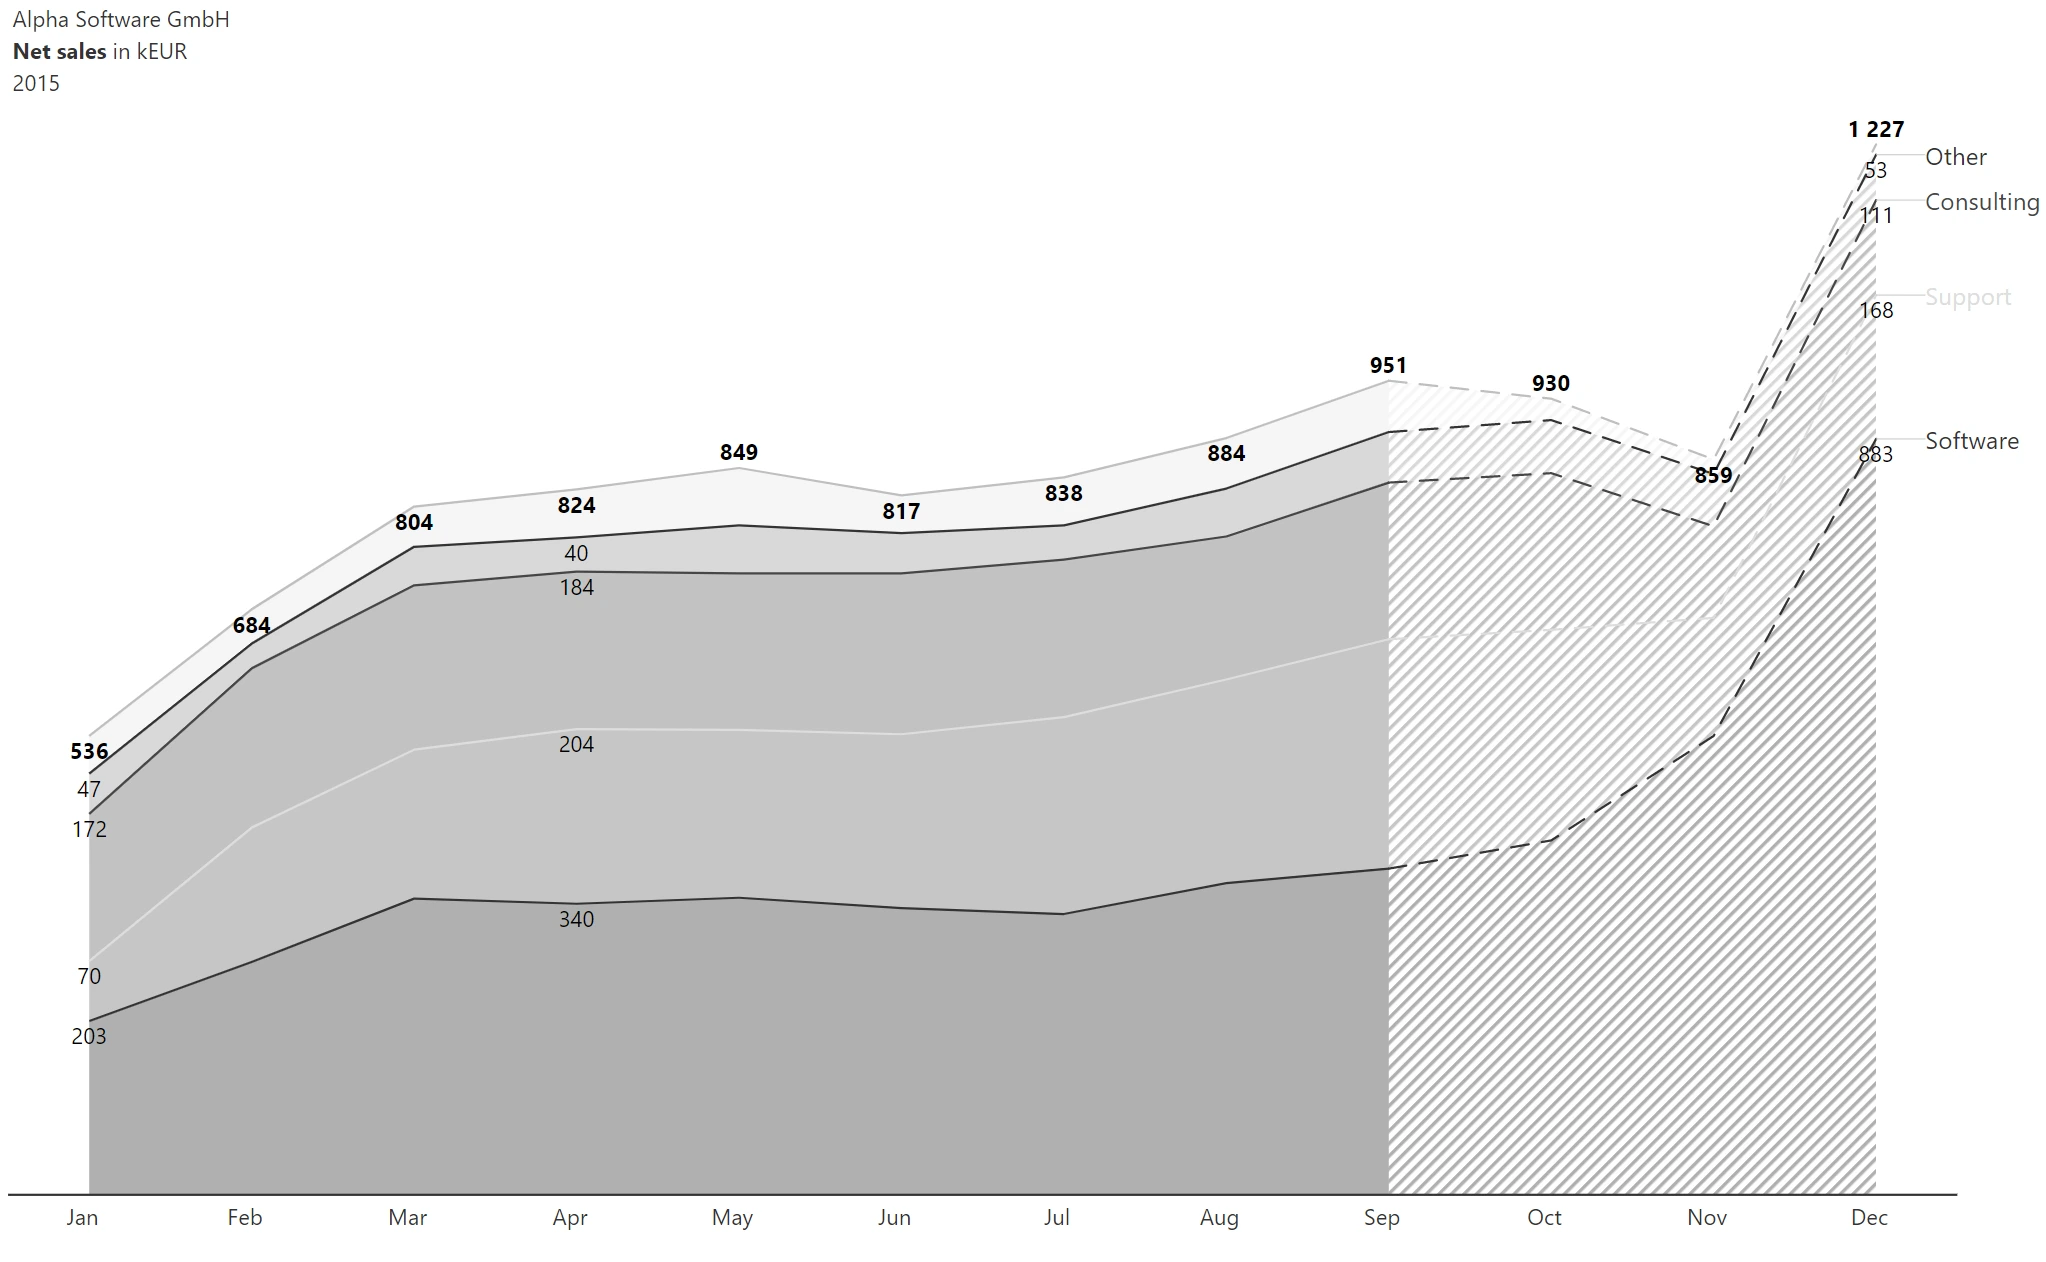
Visualize structure of data for a given time period or at a given point of time.
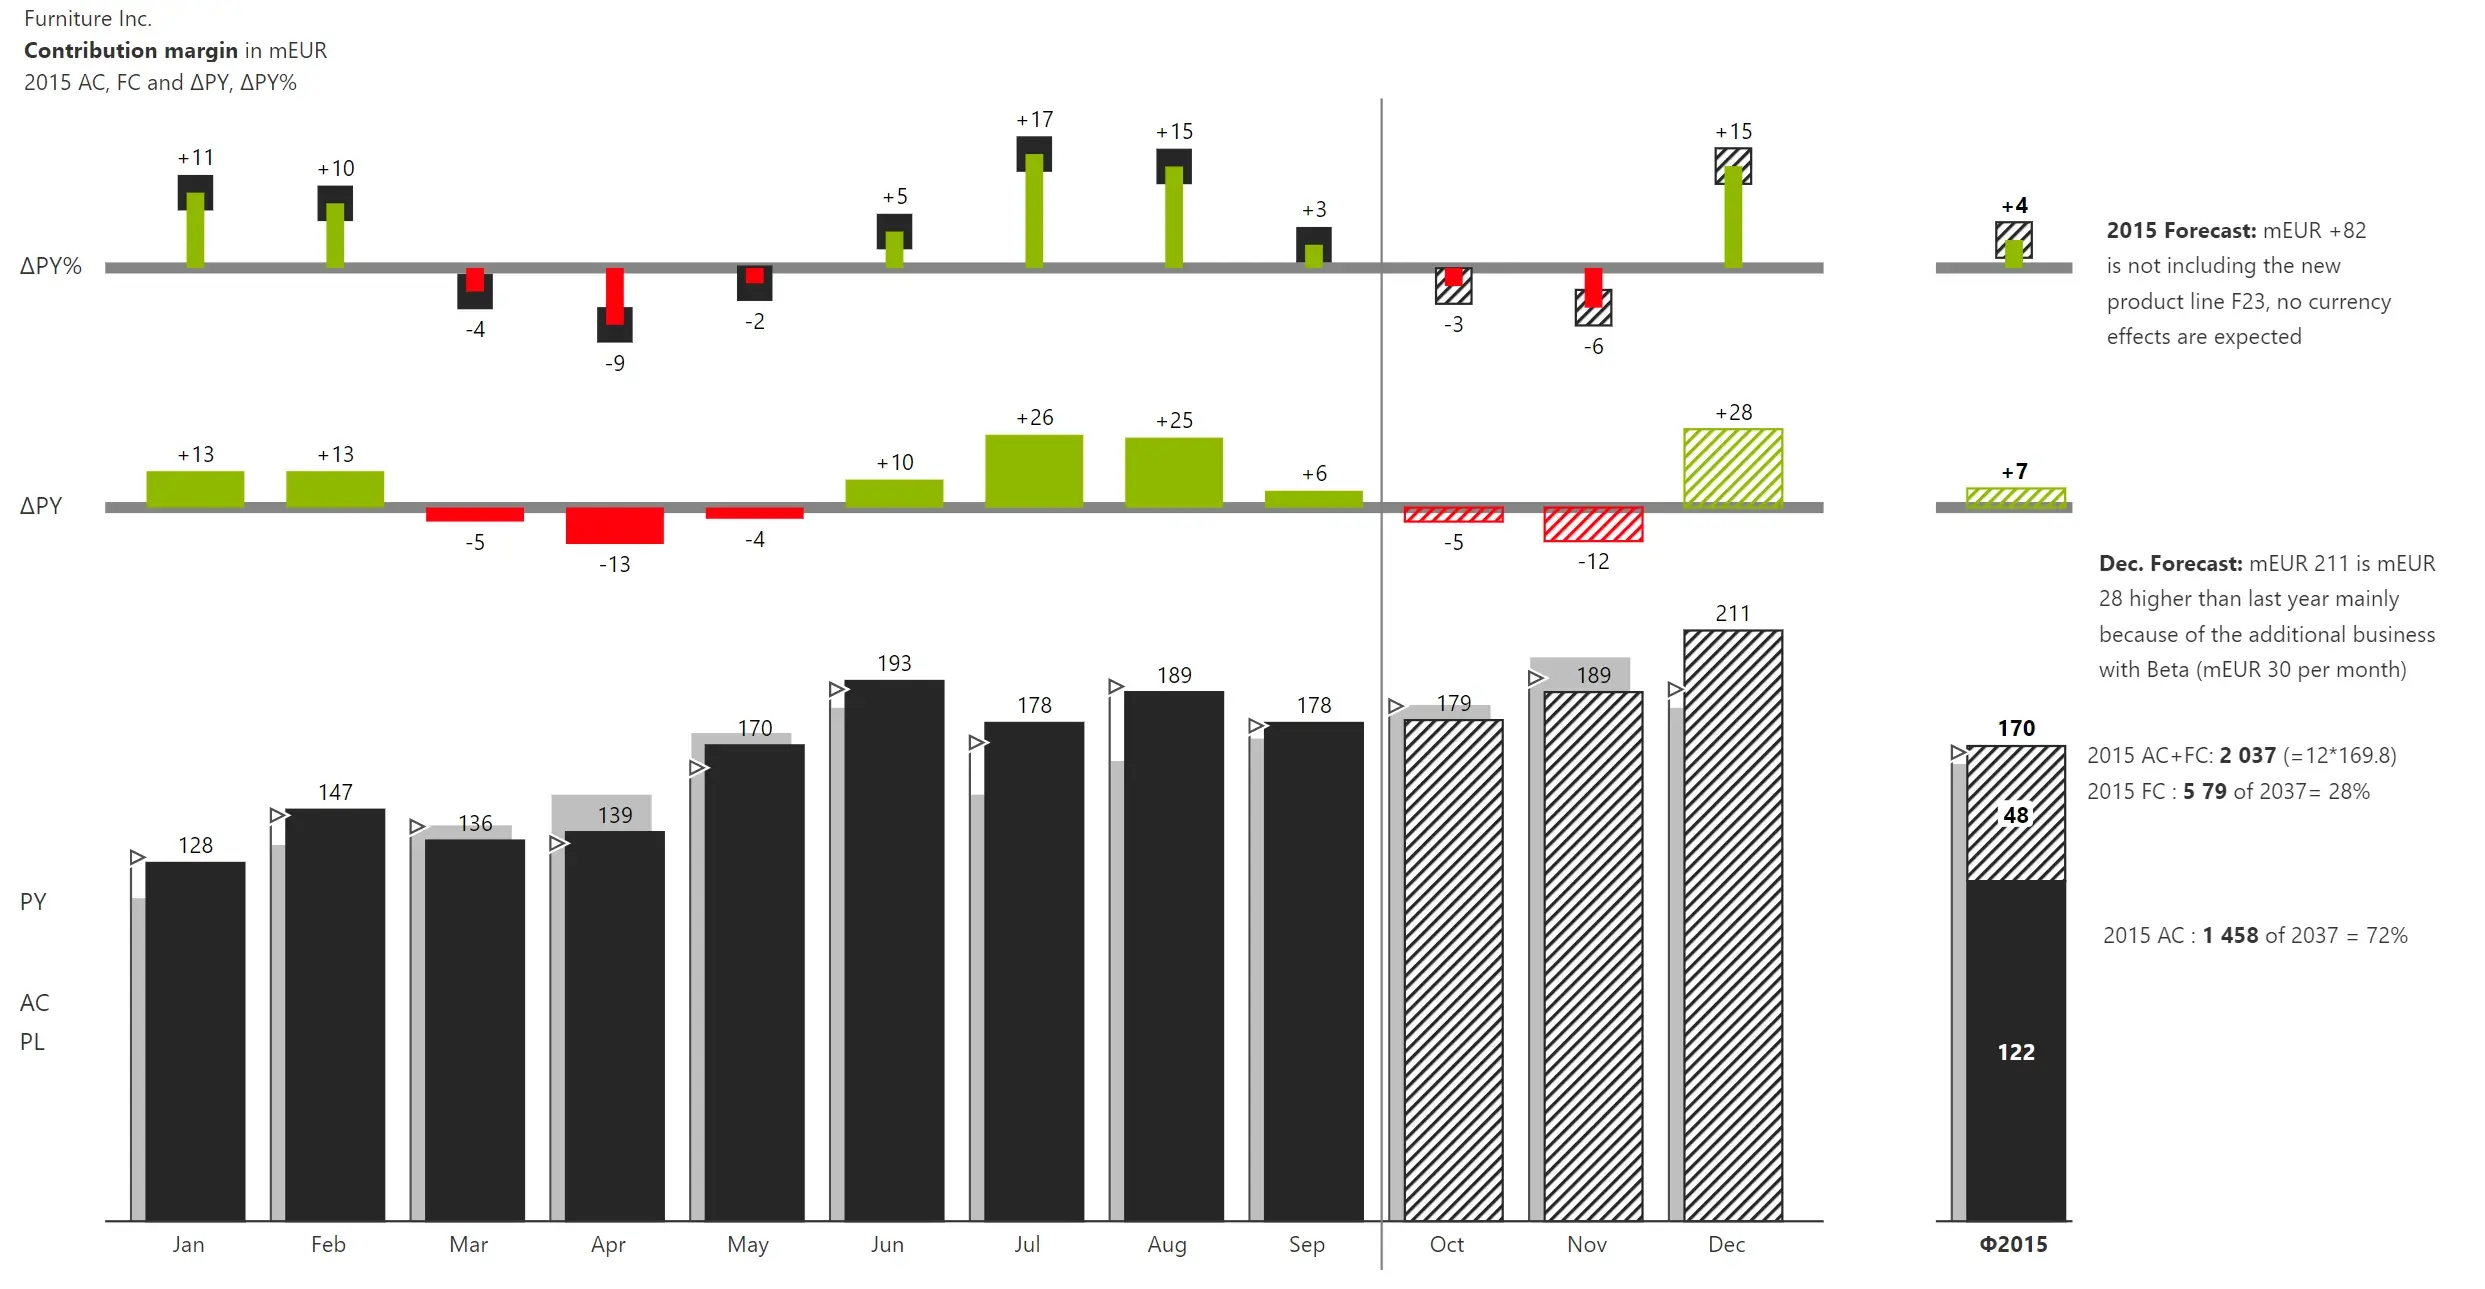
Visualize temporal development of different scenarios as a grouped column chart and the absolute and relative variances as bar and pin charts.
Visualize the data structure of different scenarios as a grouped bar chart and the absolute and relative variances as bar and pin charts
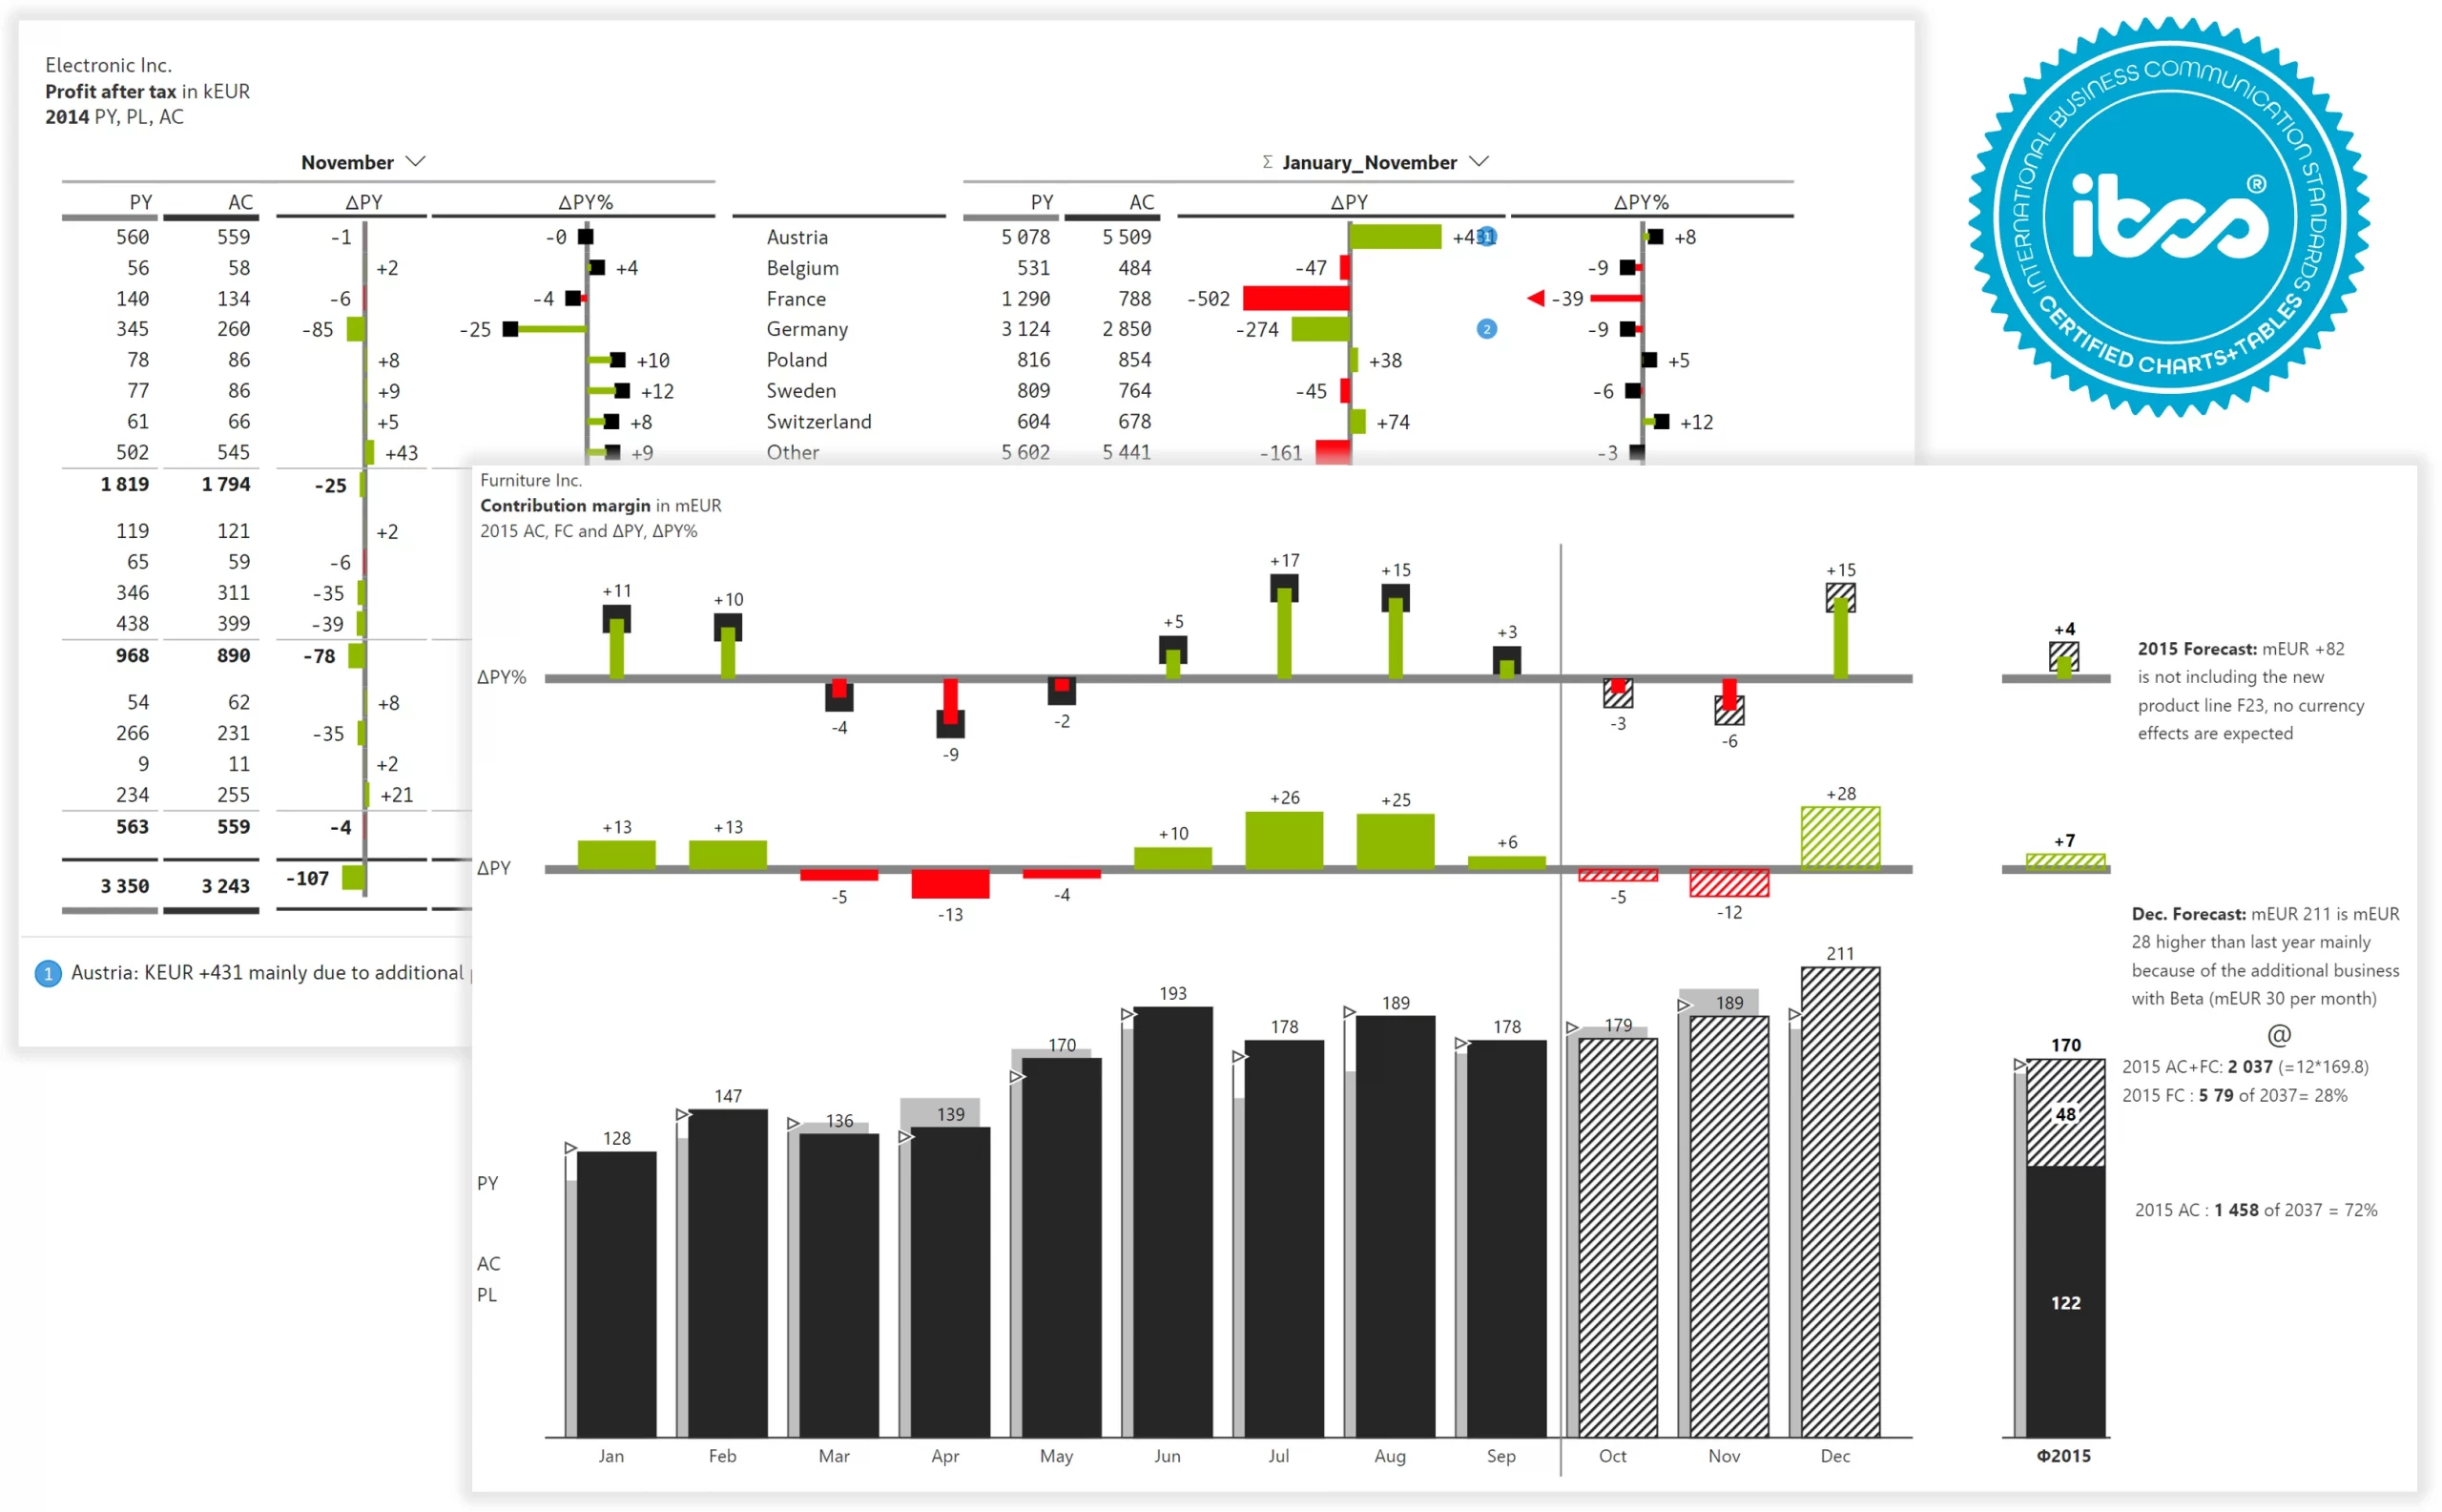
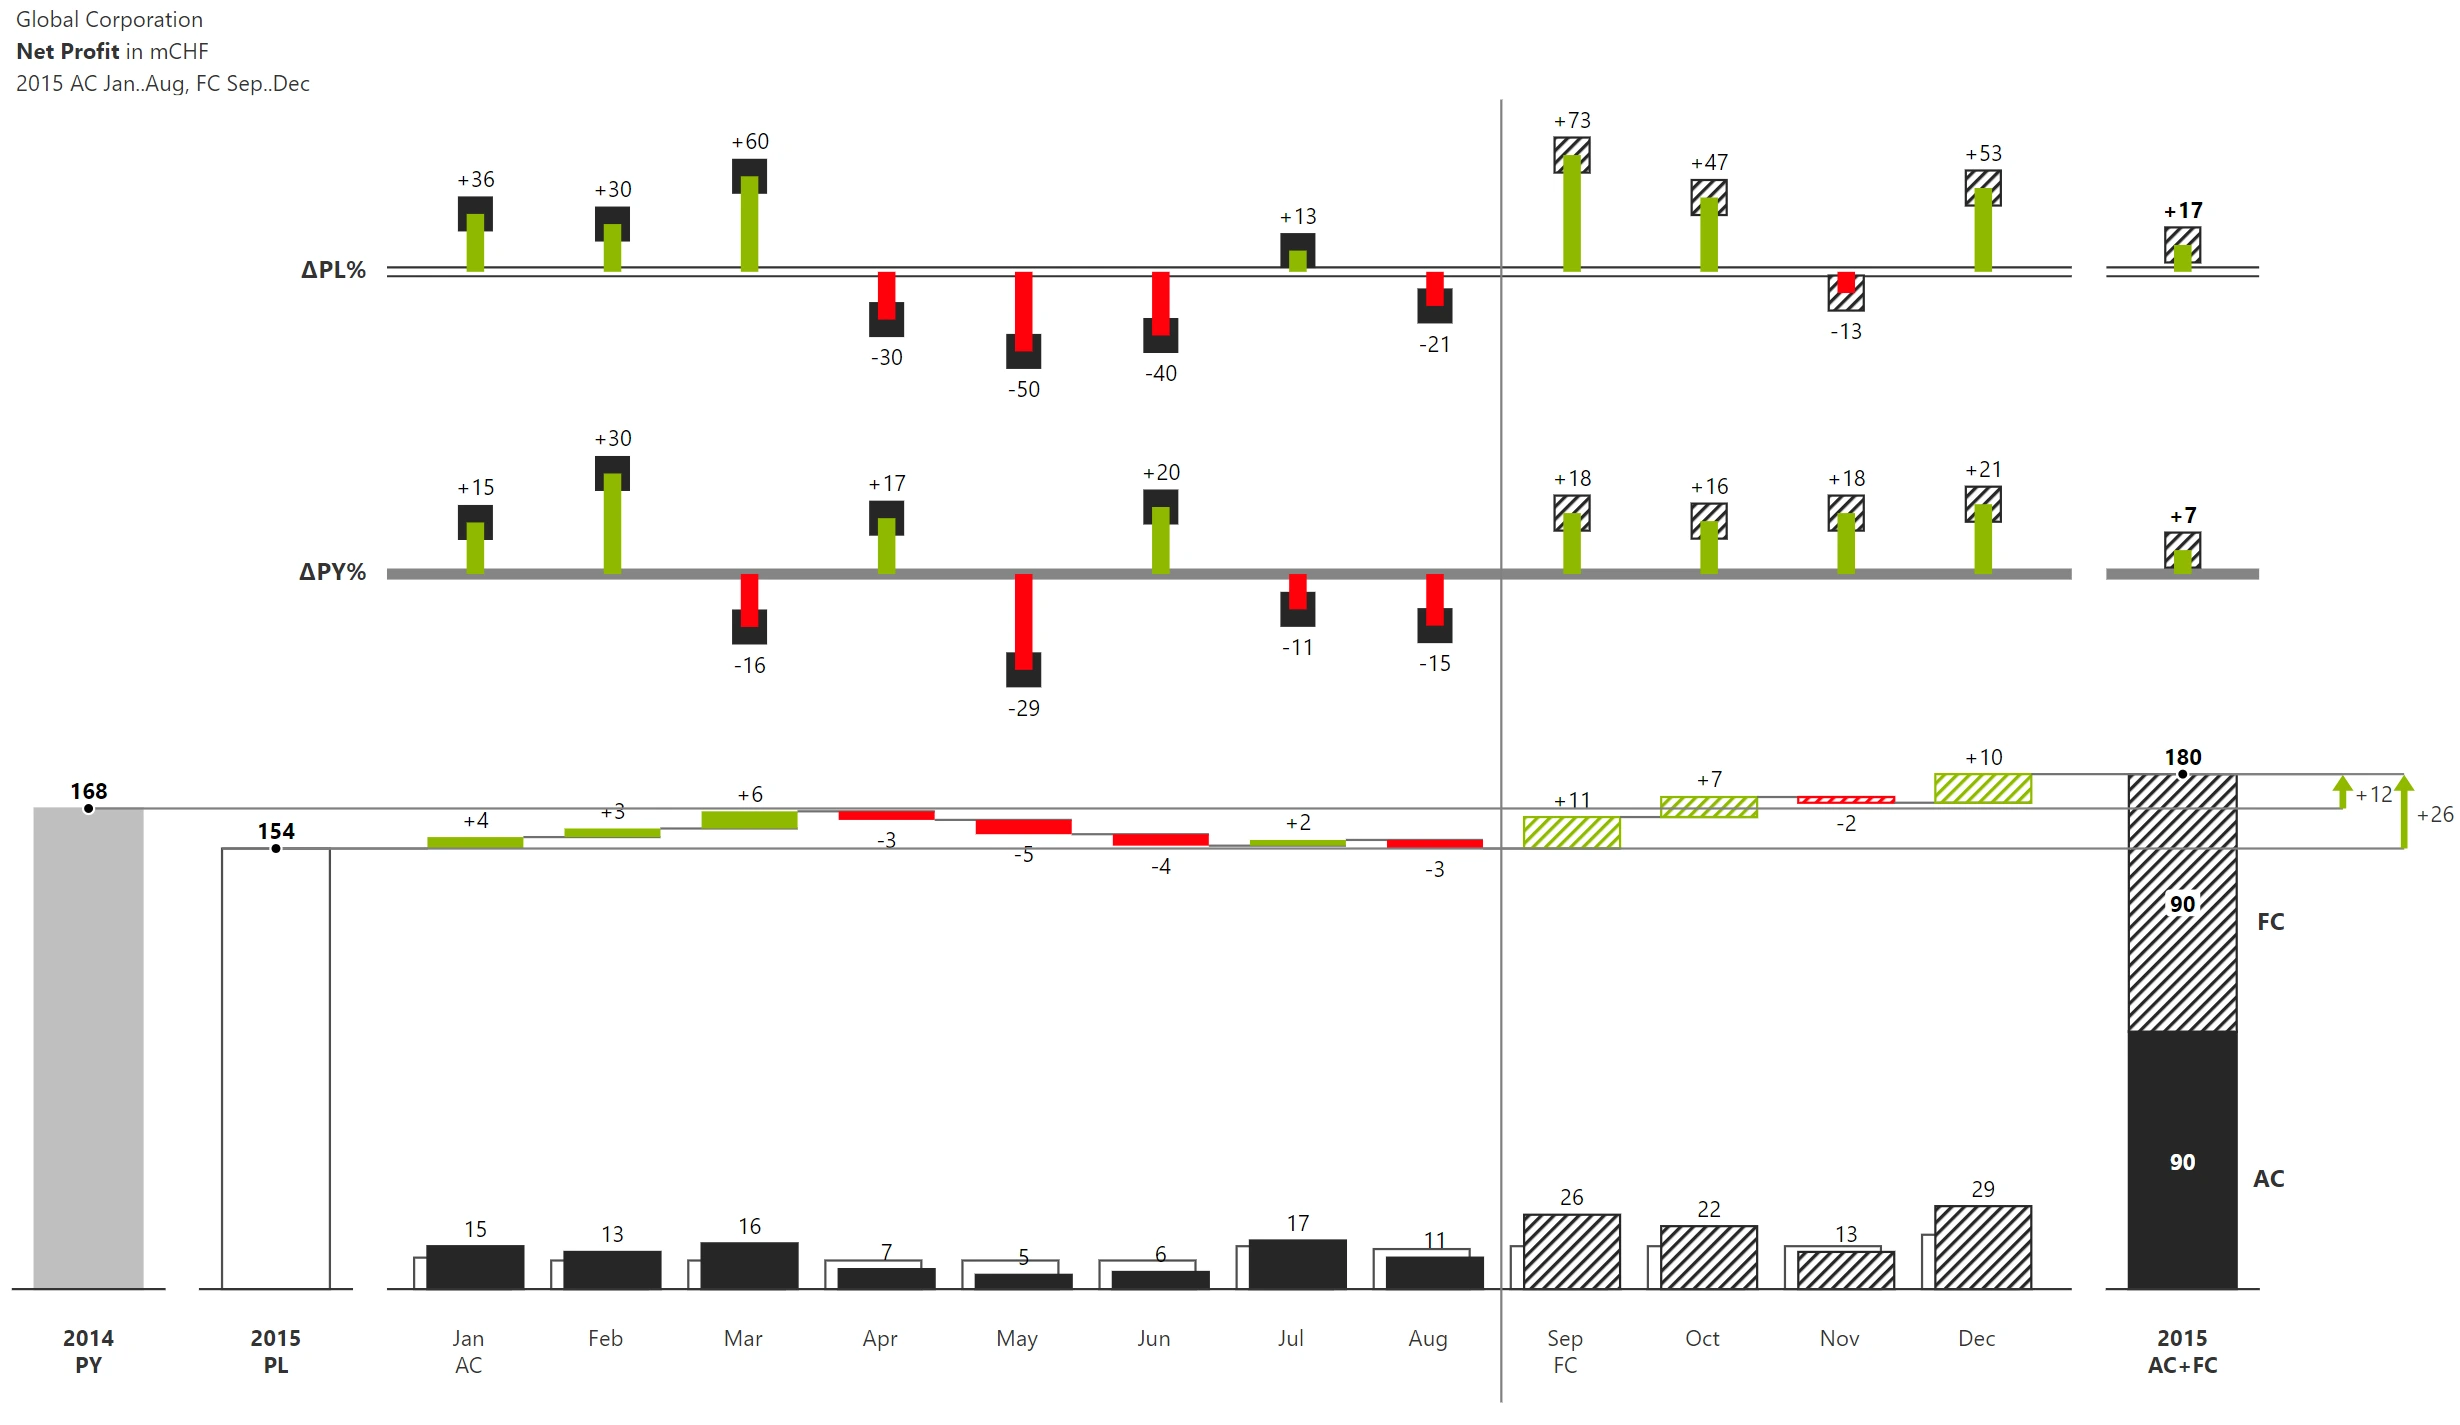
Visualize grouped columns for AC (resp. FC) and PL combined with a horizontal waterfall chart showing the absolute variances. Relative variances of AC (FC) to PL and PY are shown as pins.
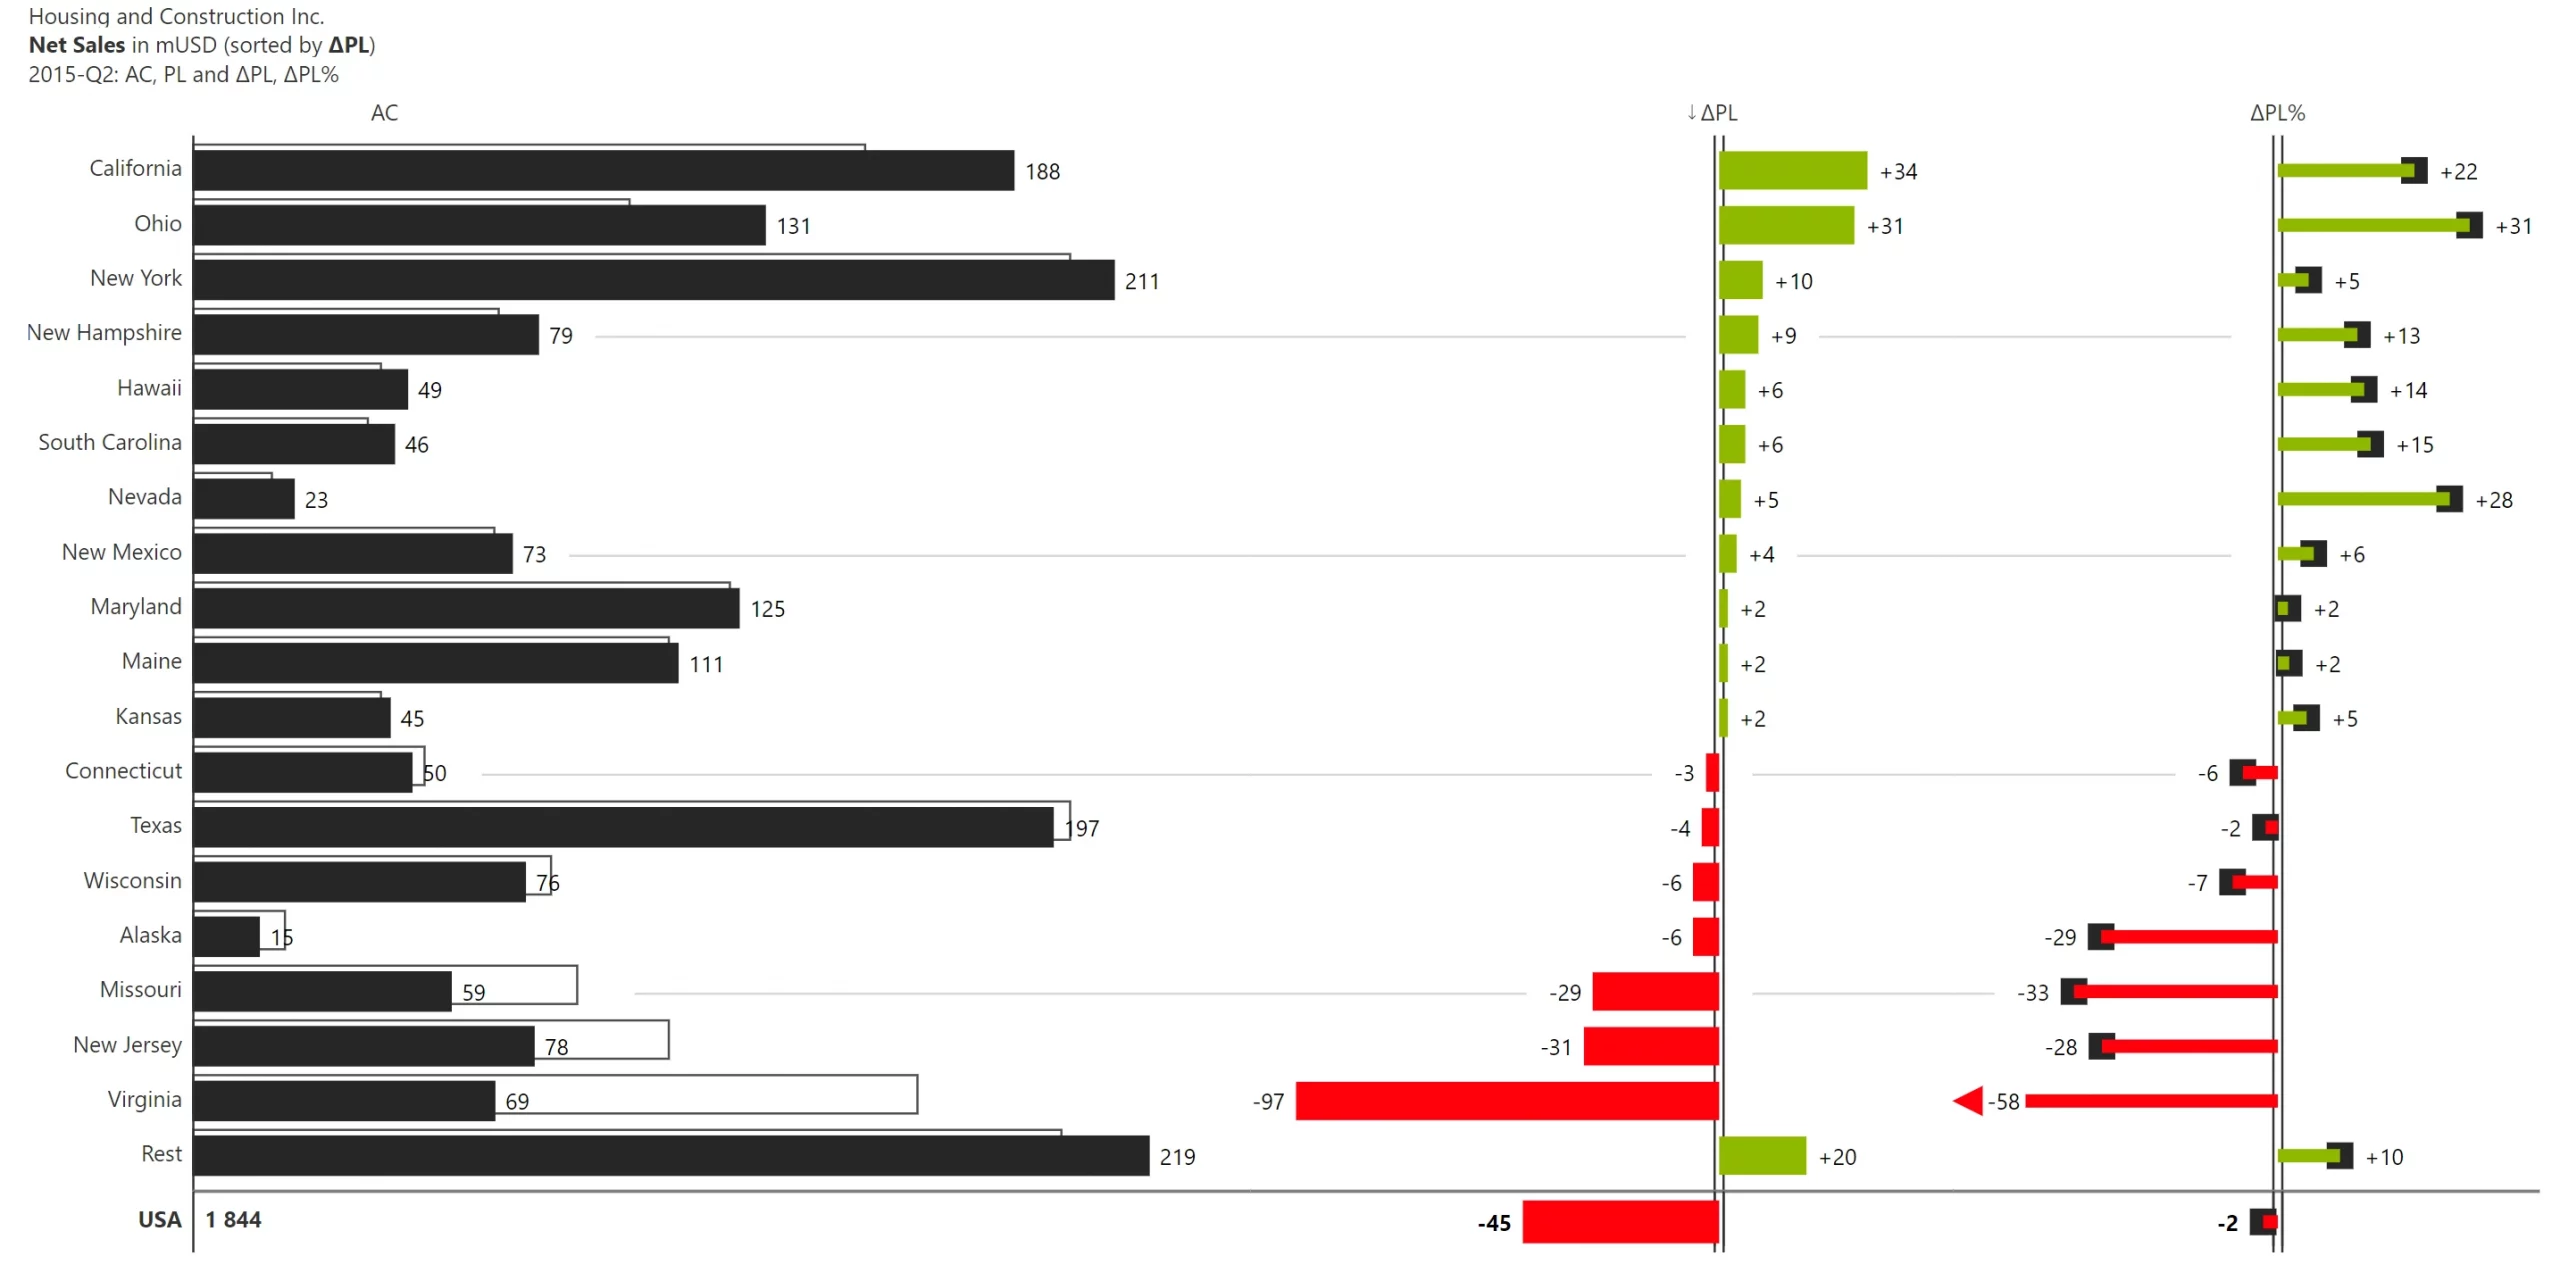
Visualize grouped bars for AC and PL combined with a vertical waterfall chart showing the absolute variances sorted in descending order. Relative variances of AC to PL and PY are shown as pins.
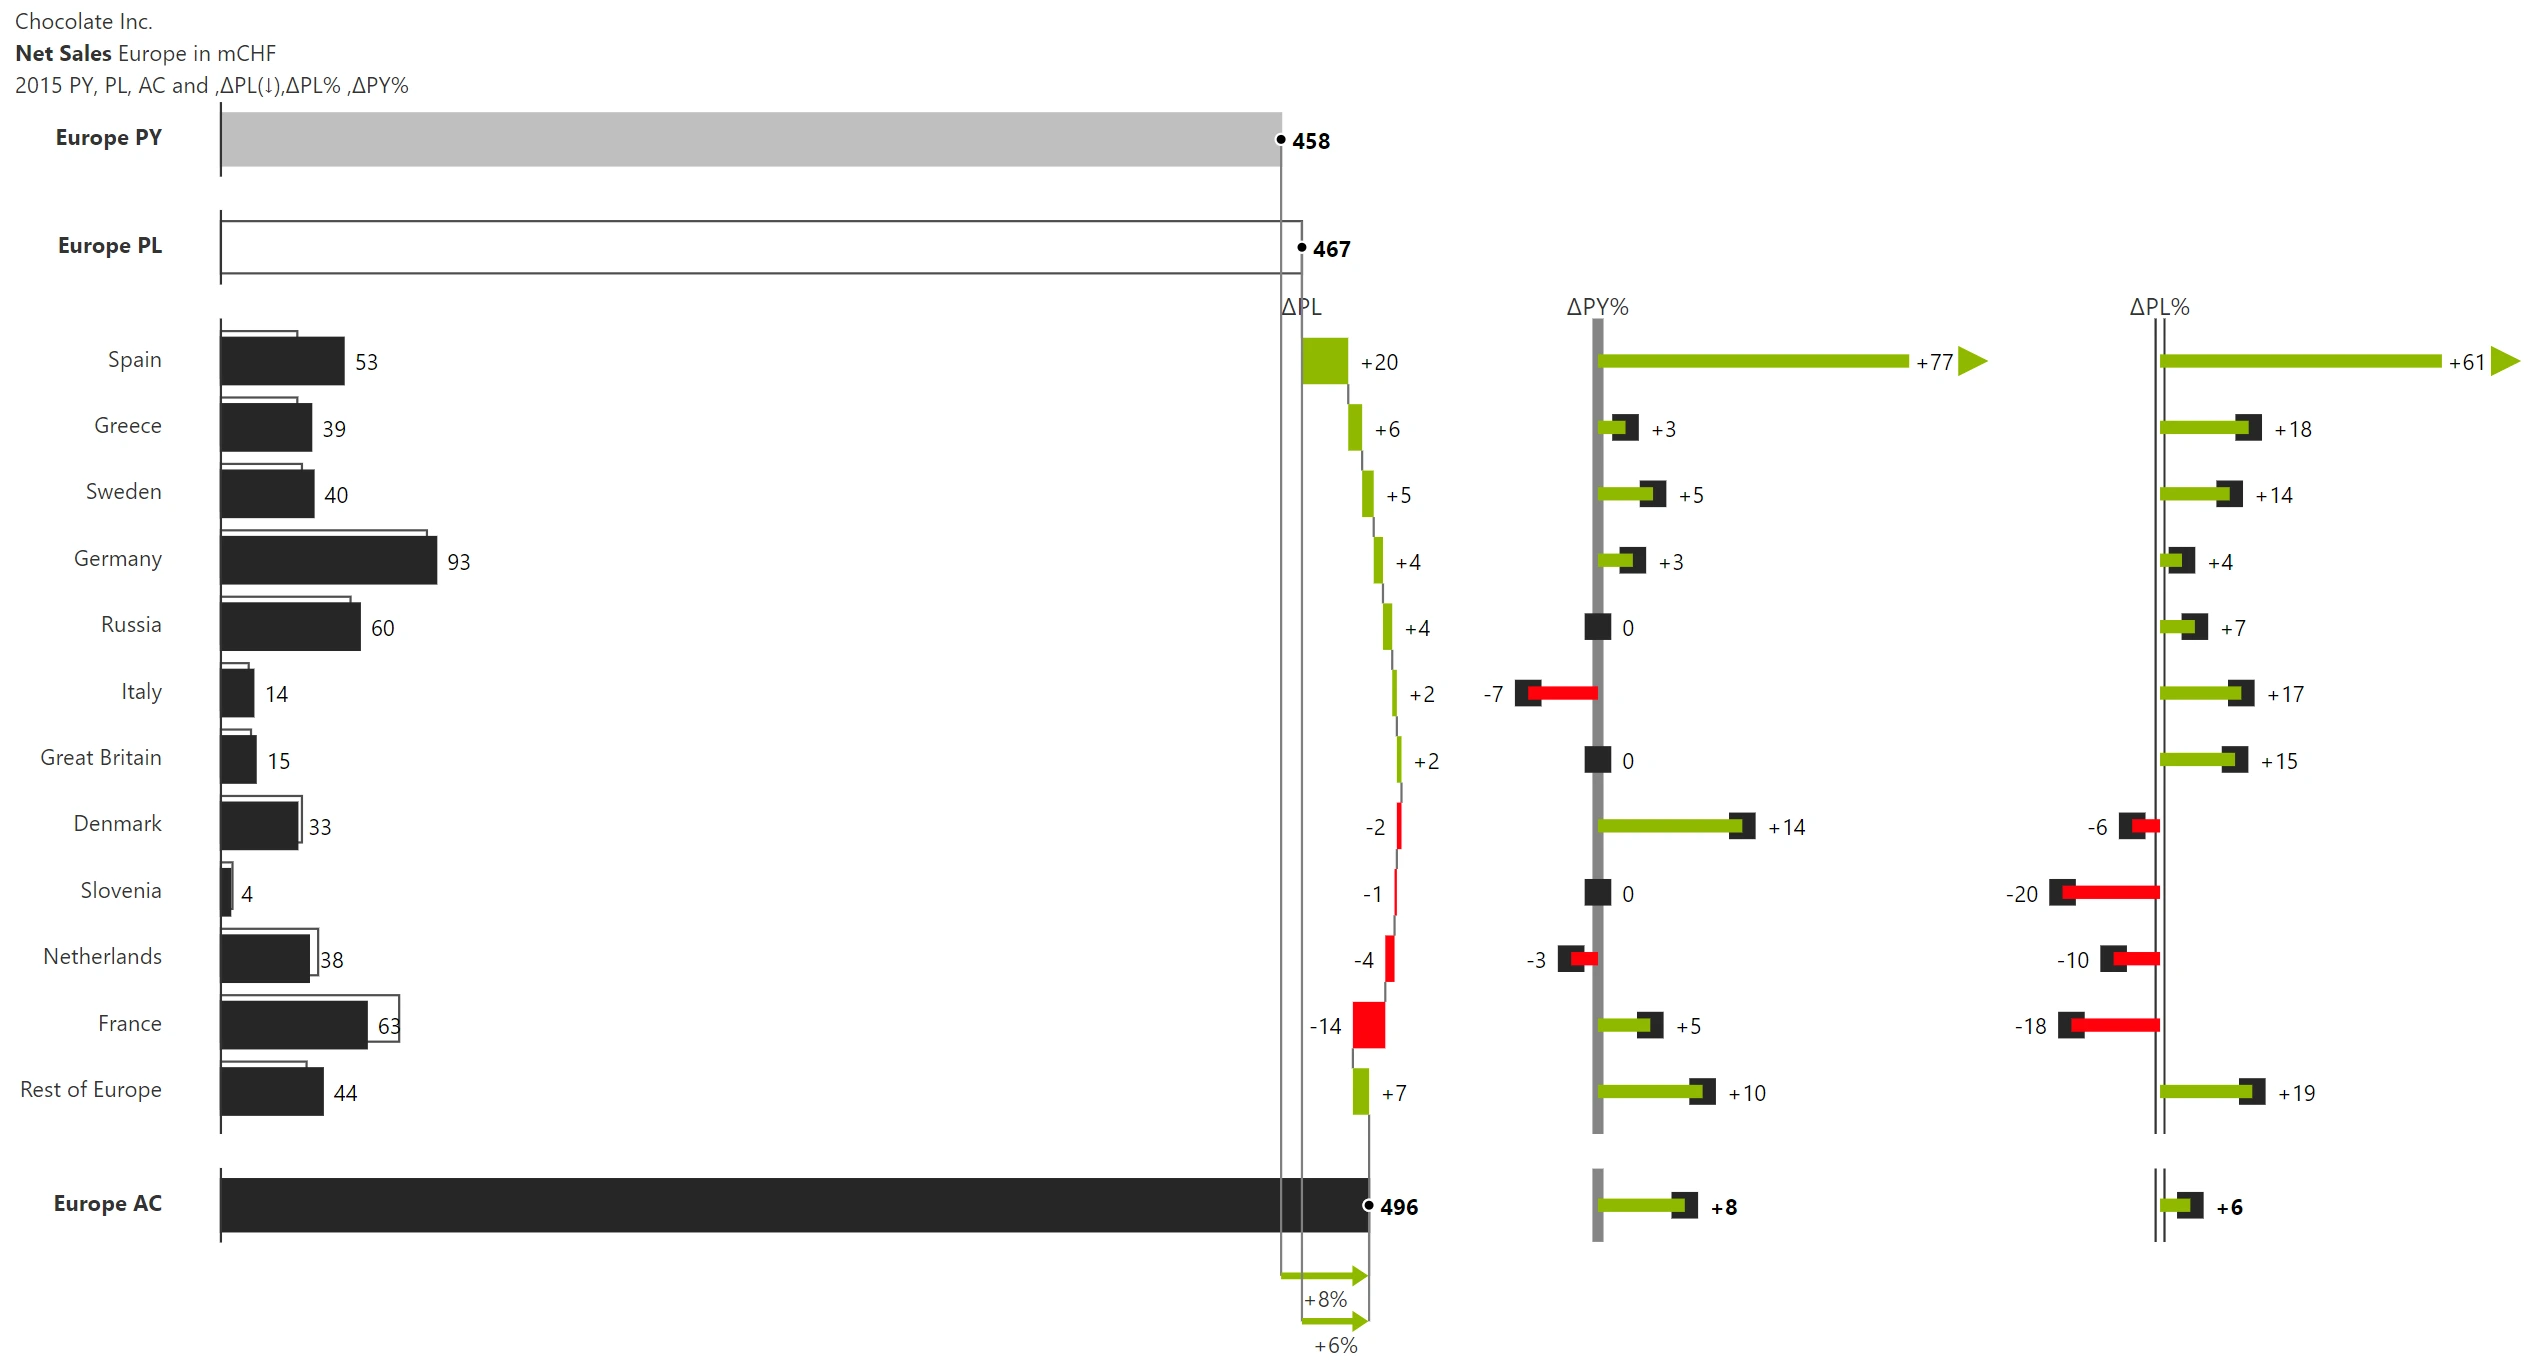
Visualize grouped bars for AC and PL combined with a vertical waterfall chart showing the absolute variances sorted in descending order. Relative variances of AC to PL and PY are shown as pins.
Visualize grouped bars for AC and PL combined with a vertical waterfall chart showing the absolute variances sorted in descending order. Relative variances of AC to PL and PY are shown as pins.
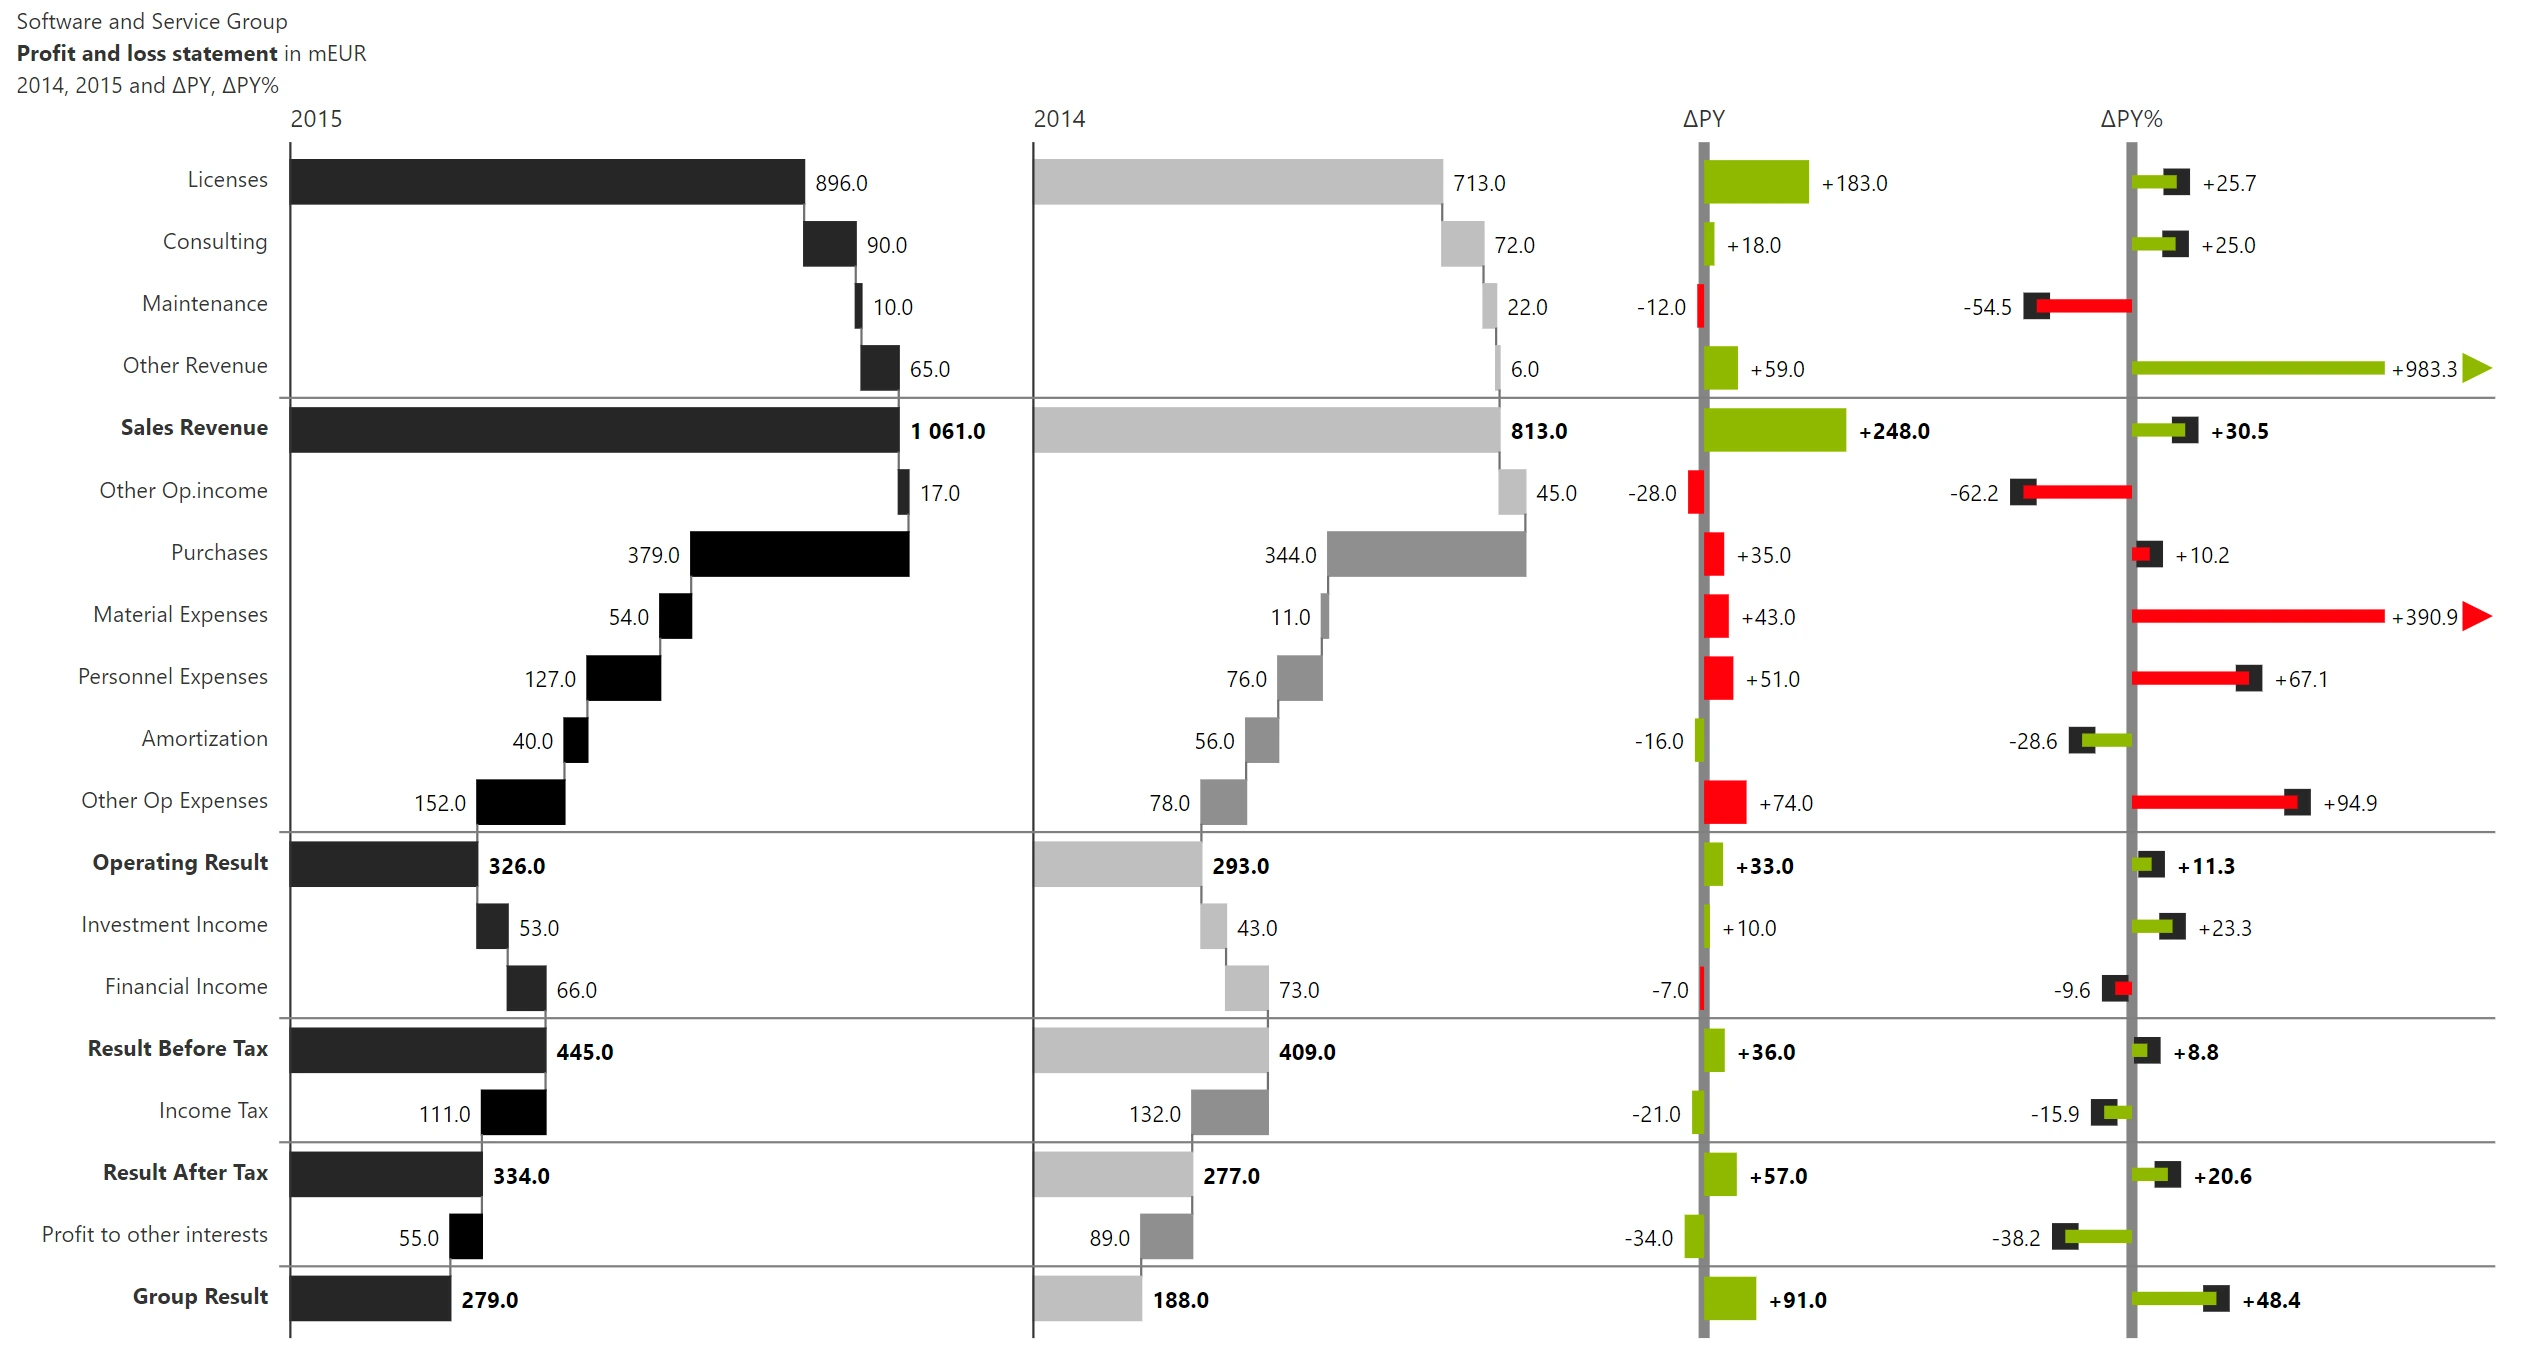
Visualize side by side waterfalls for a calculation scheme with absolute and relative variances in bars and pins.
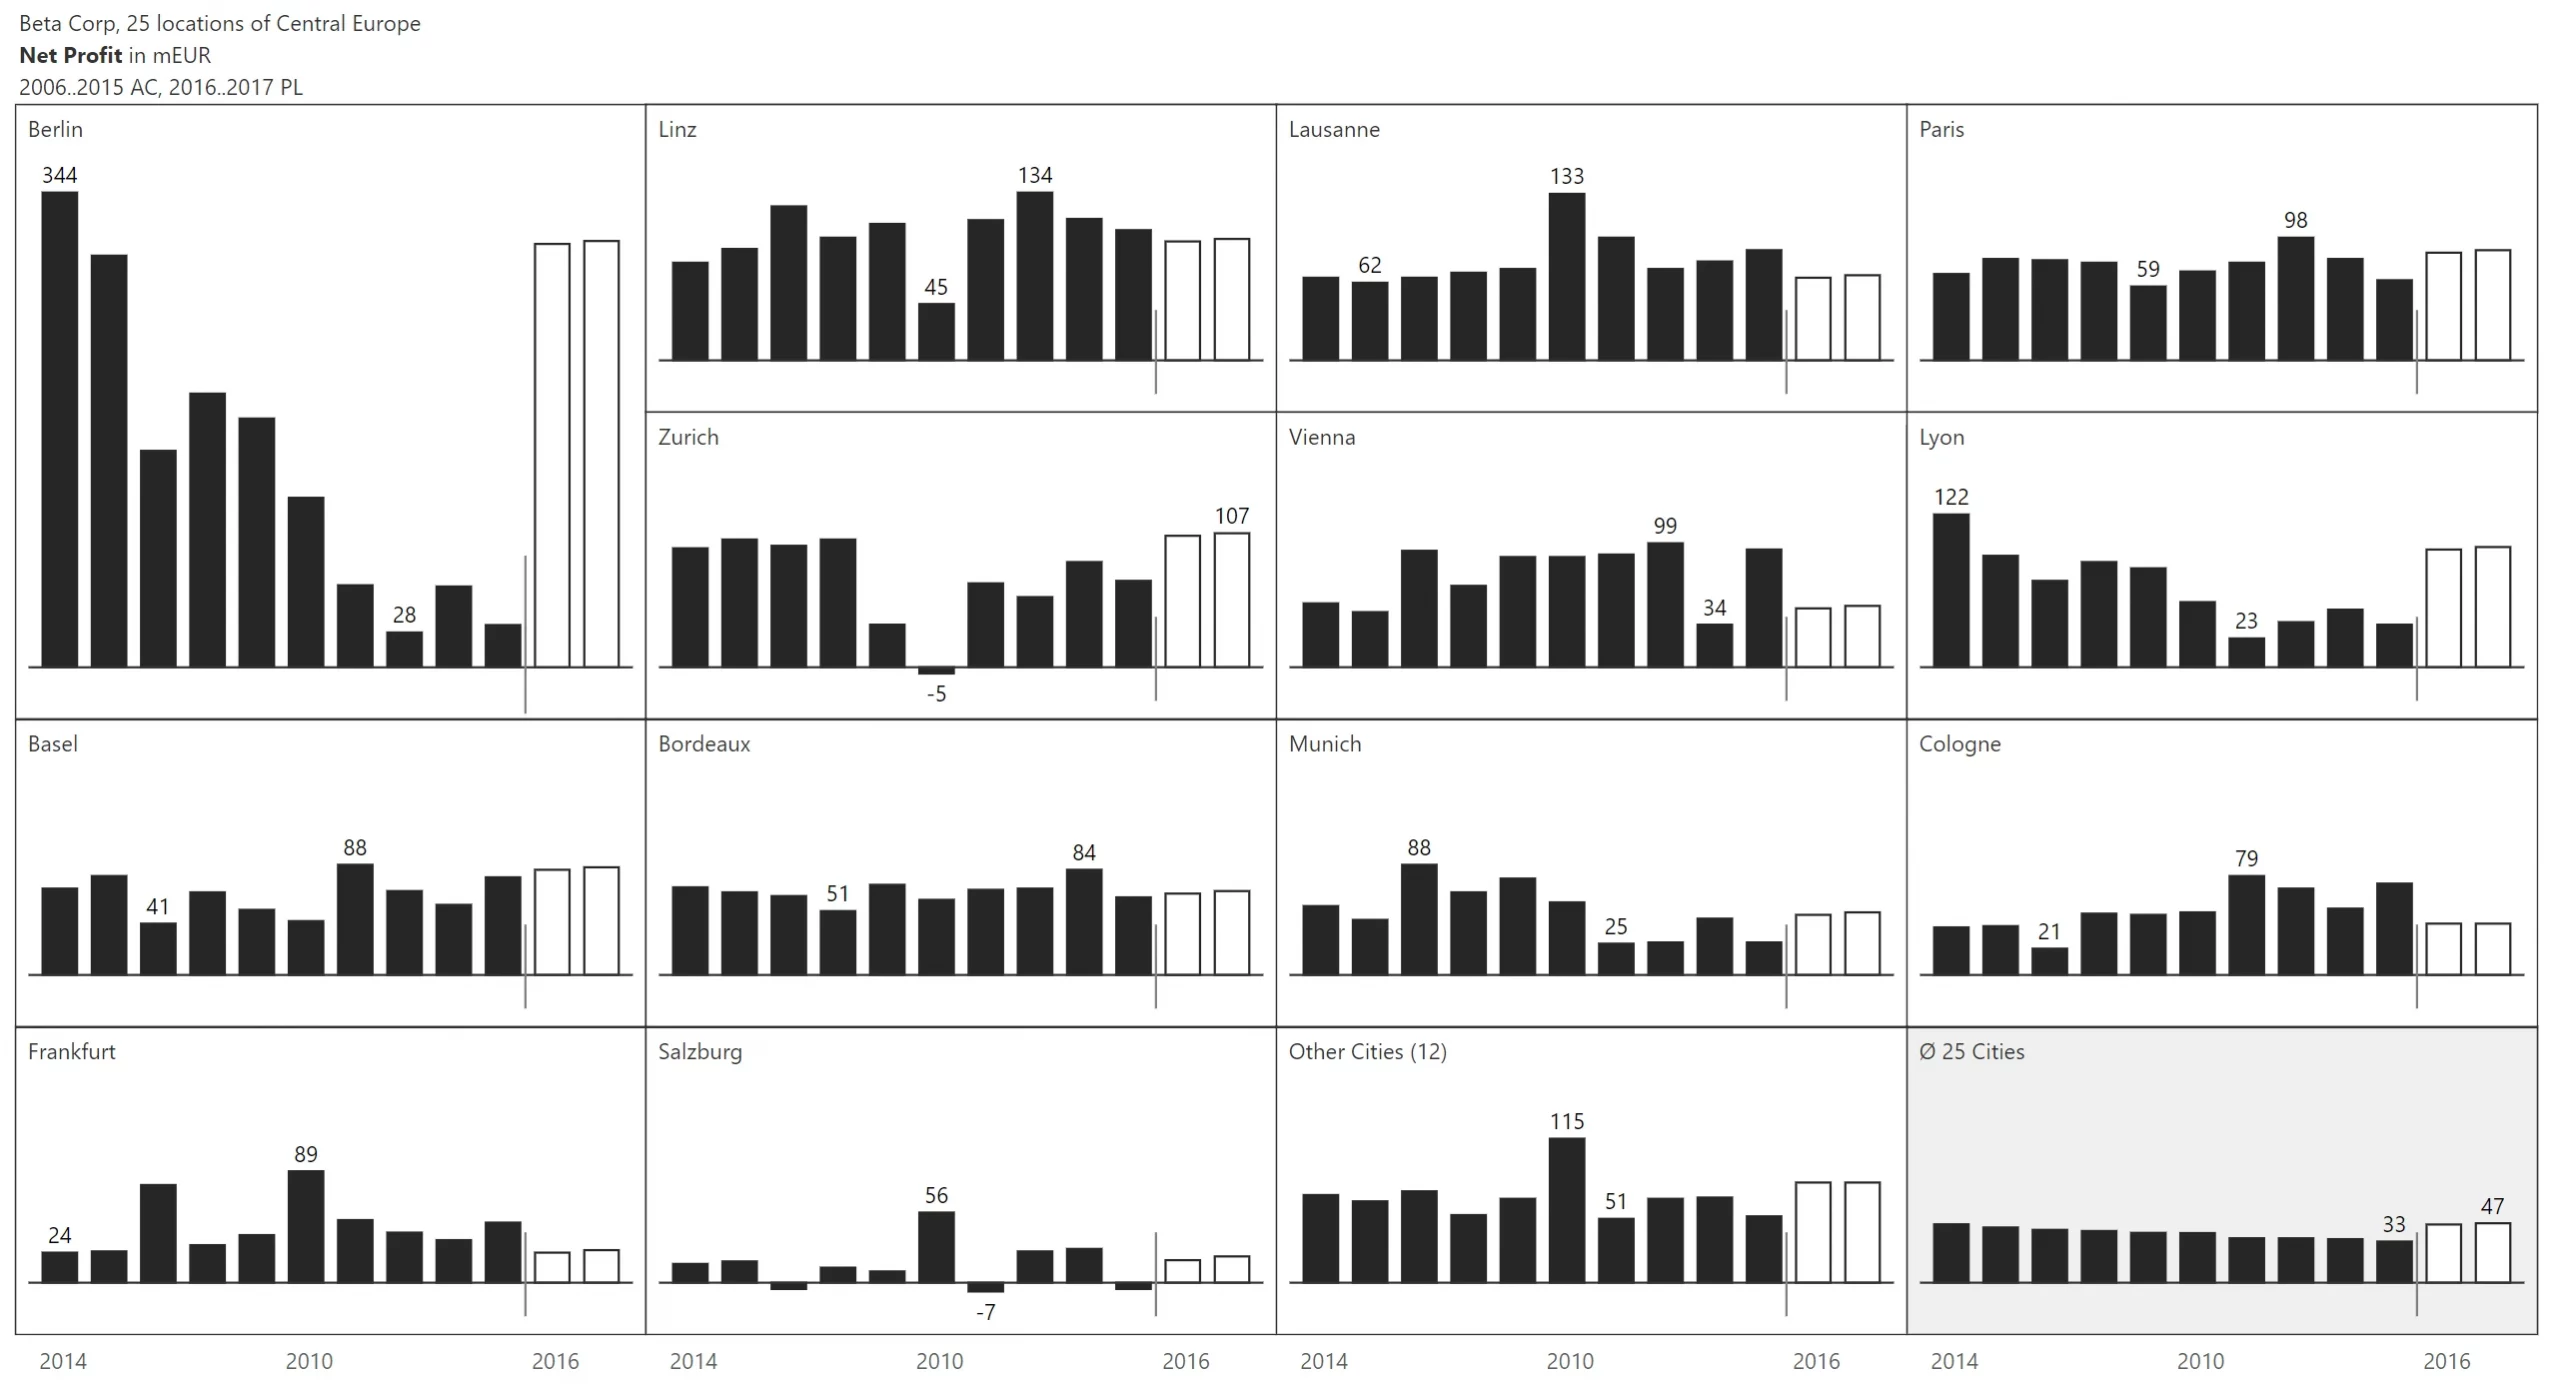
Create highly insightful, high-information-density reports using small multiples.
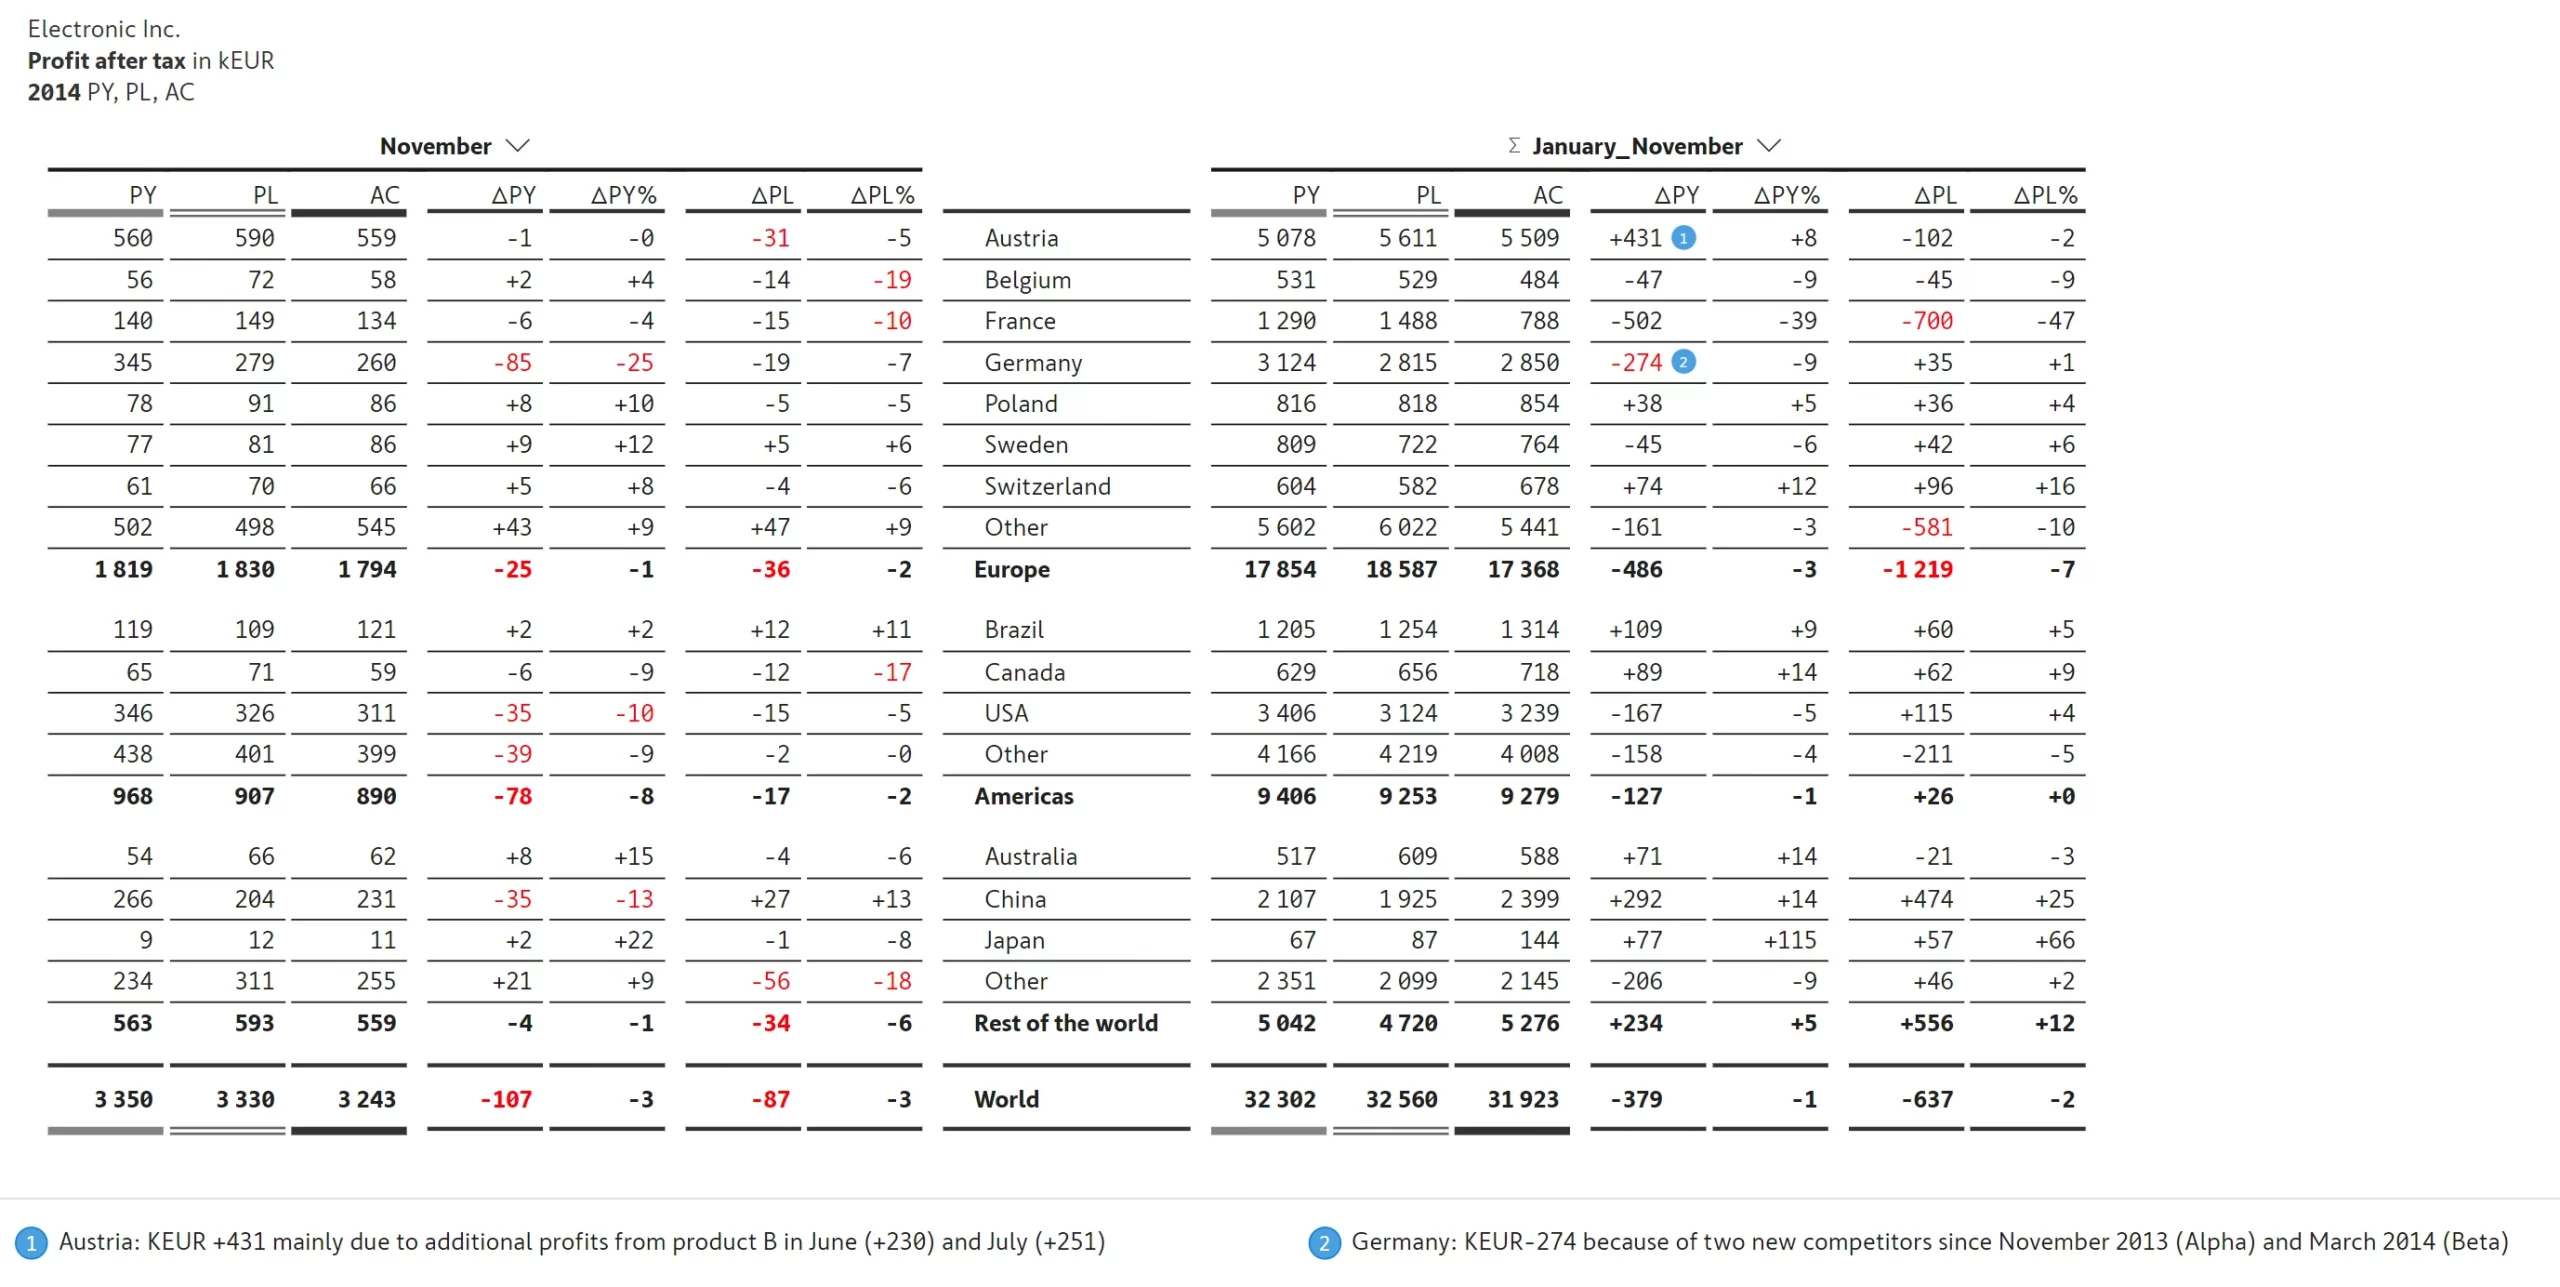
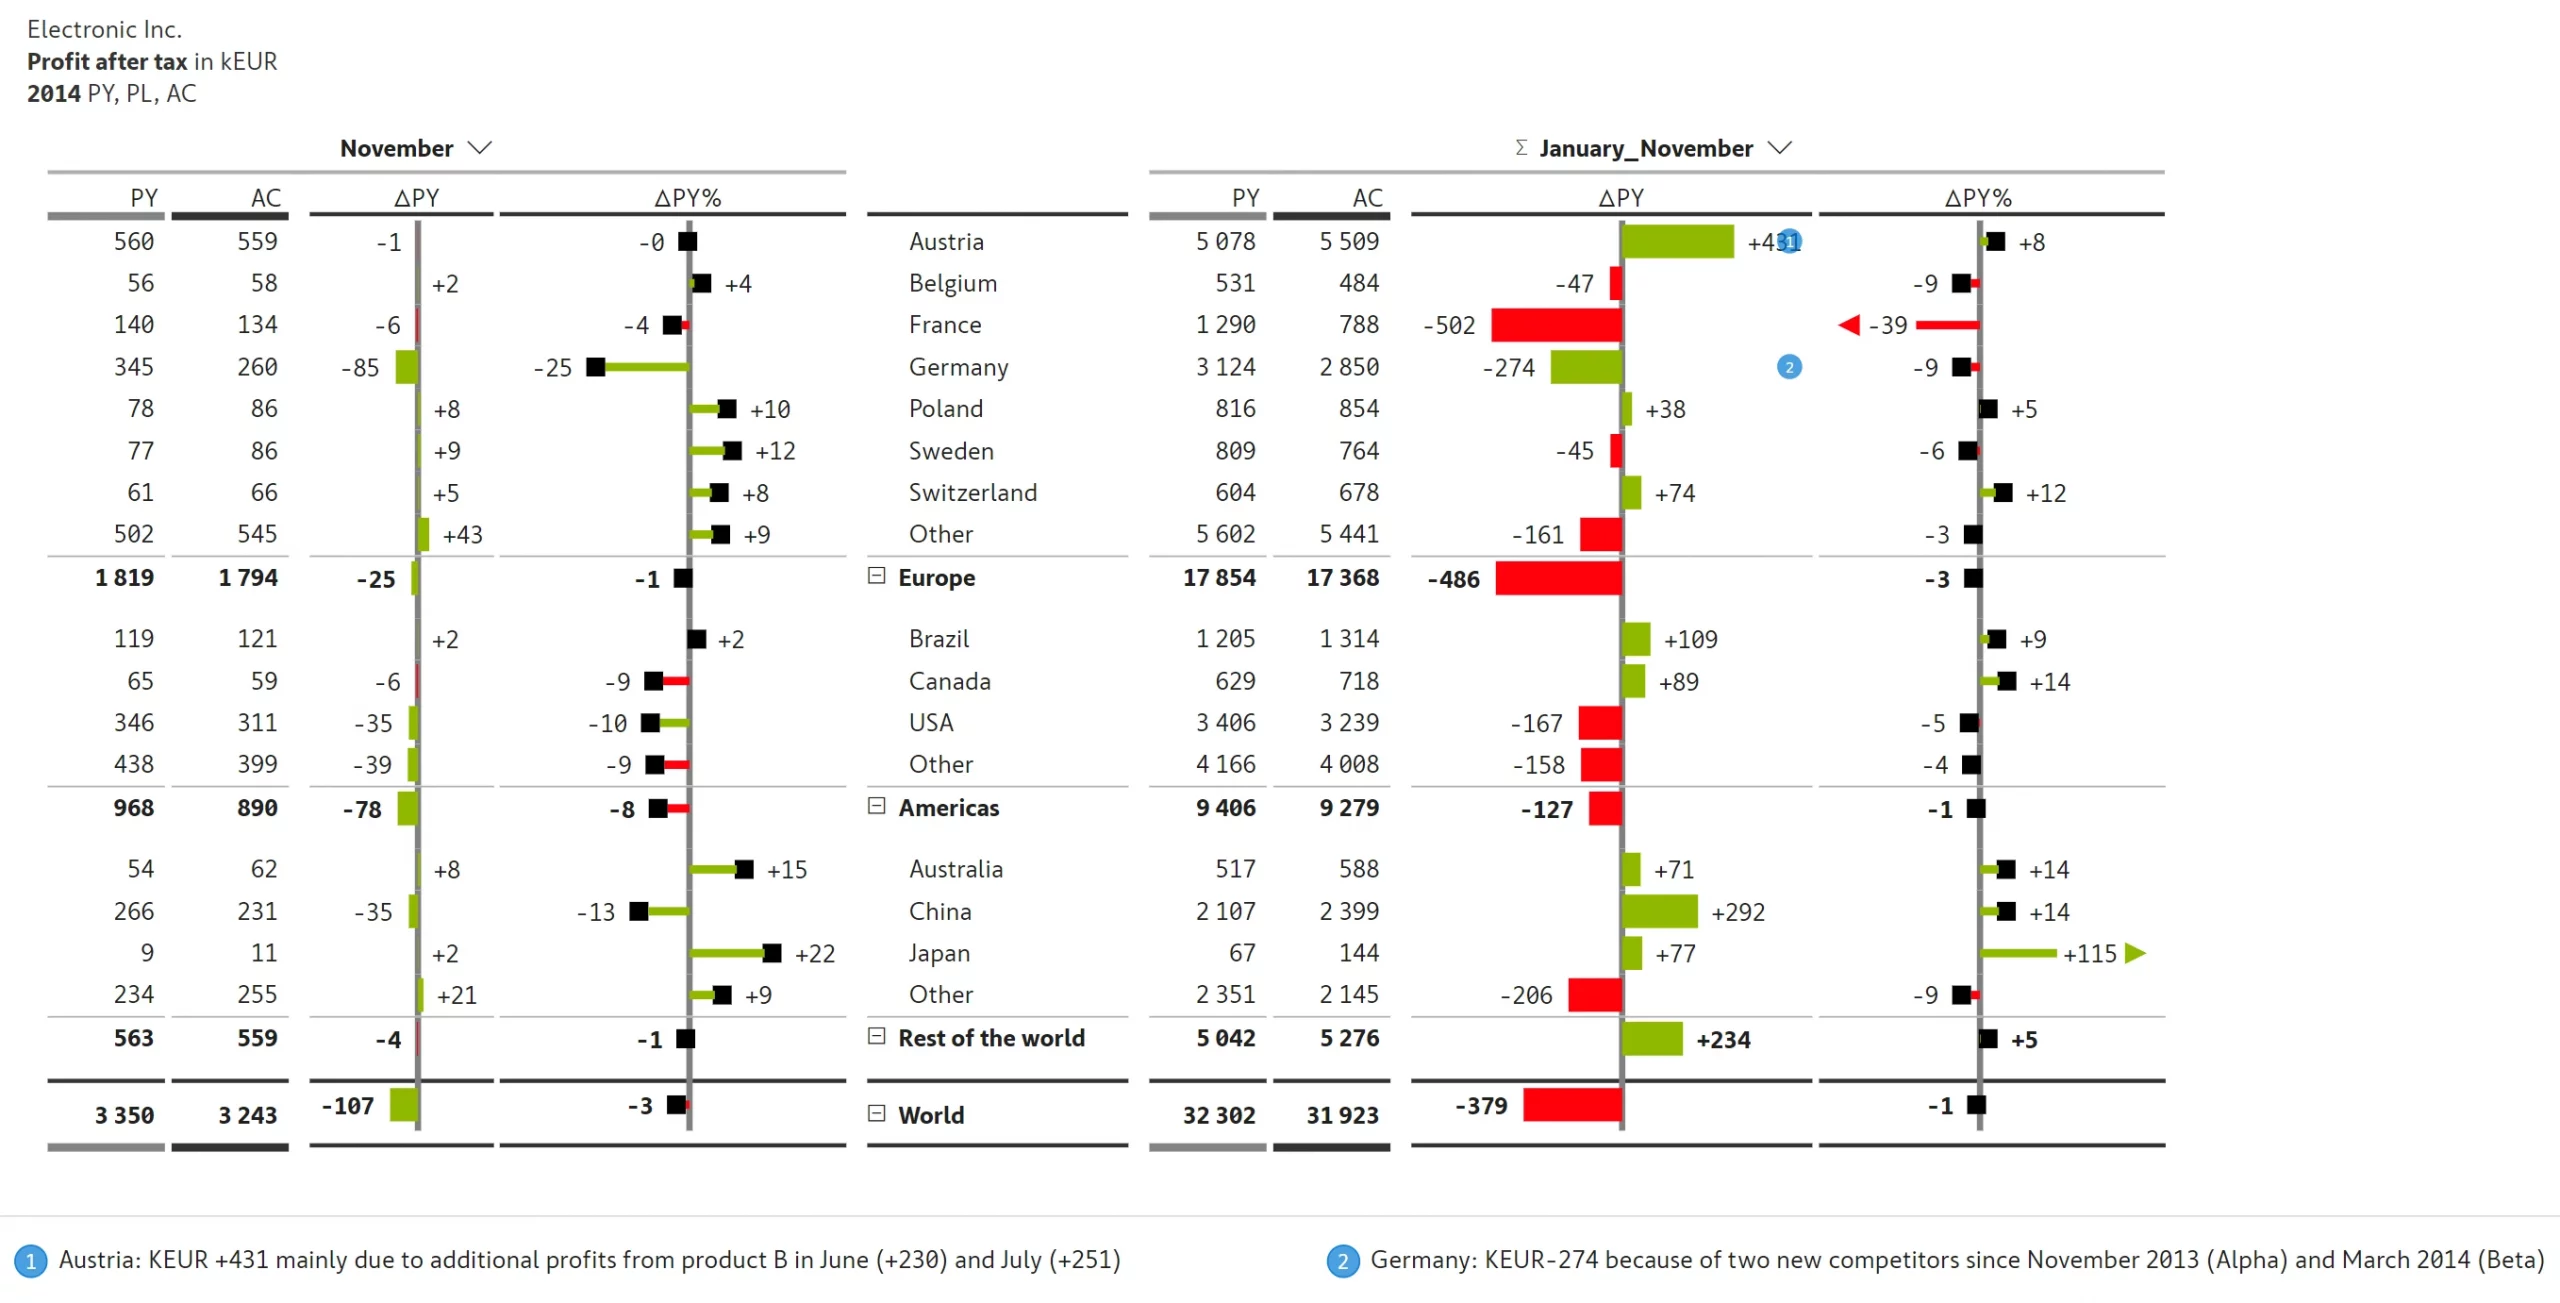
Visualize a measure with rows showing structural data and columns showing absolute and relative variances to previous year and plan.
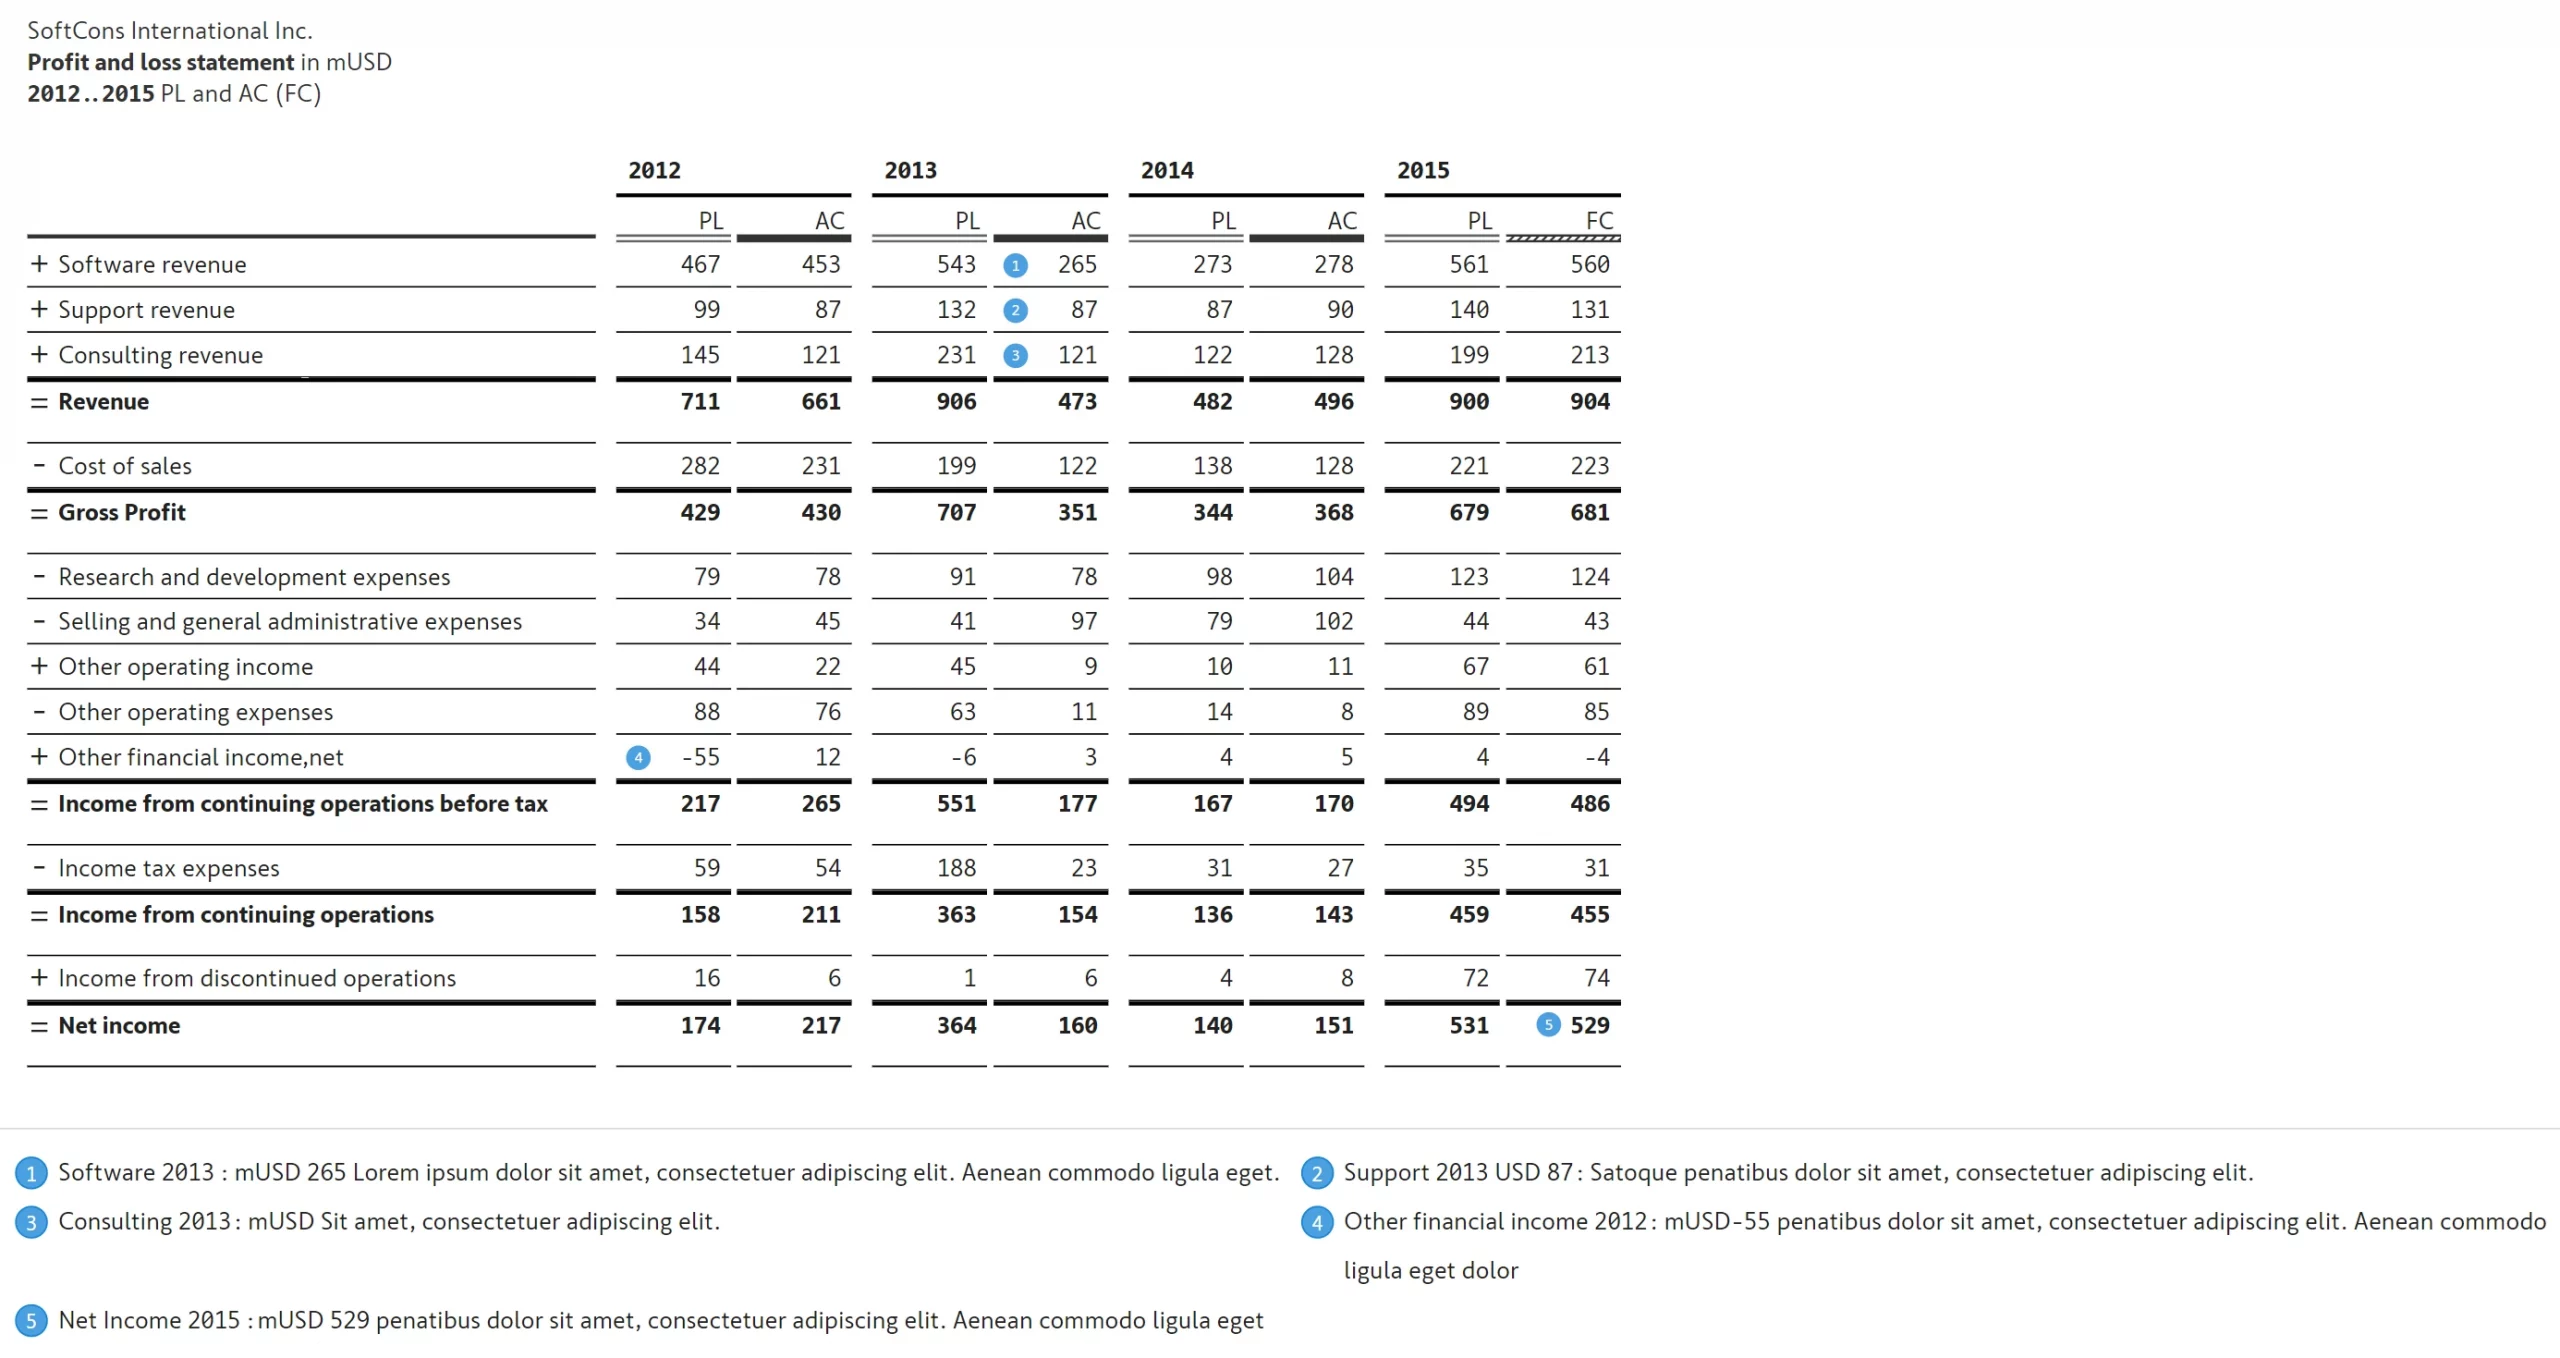
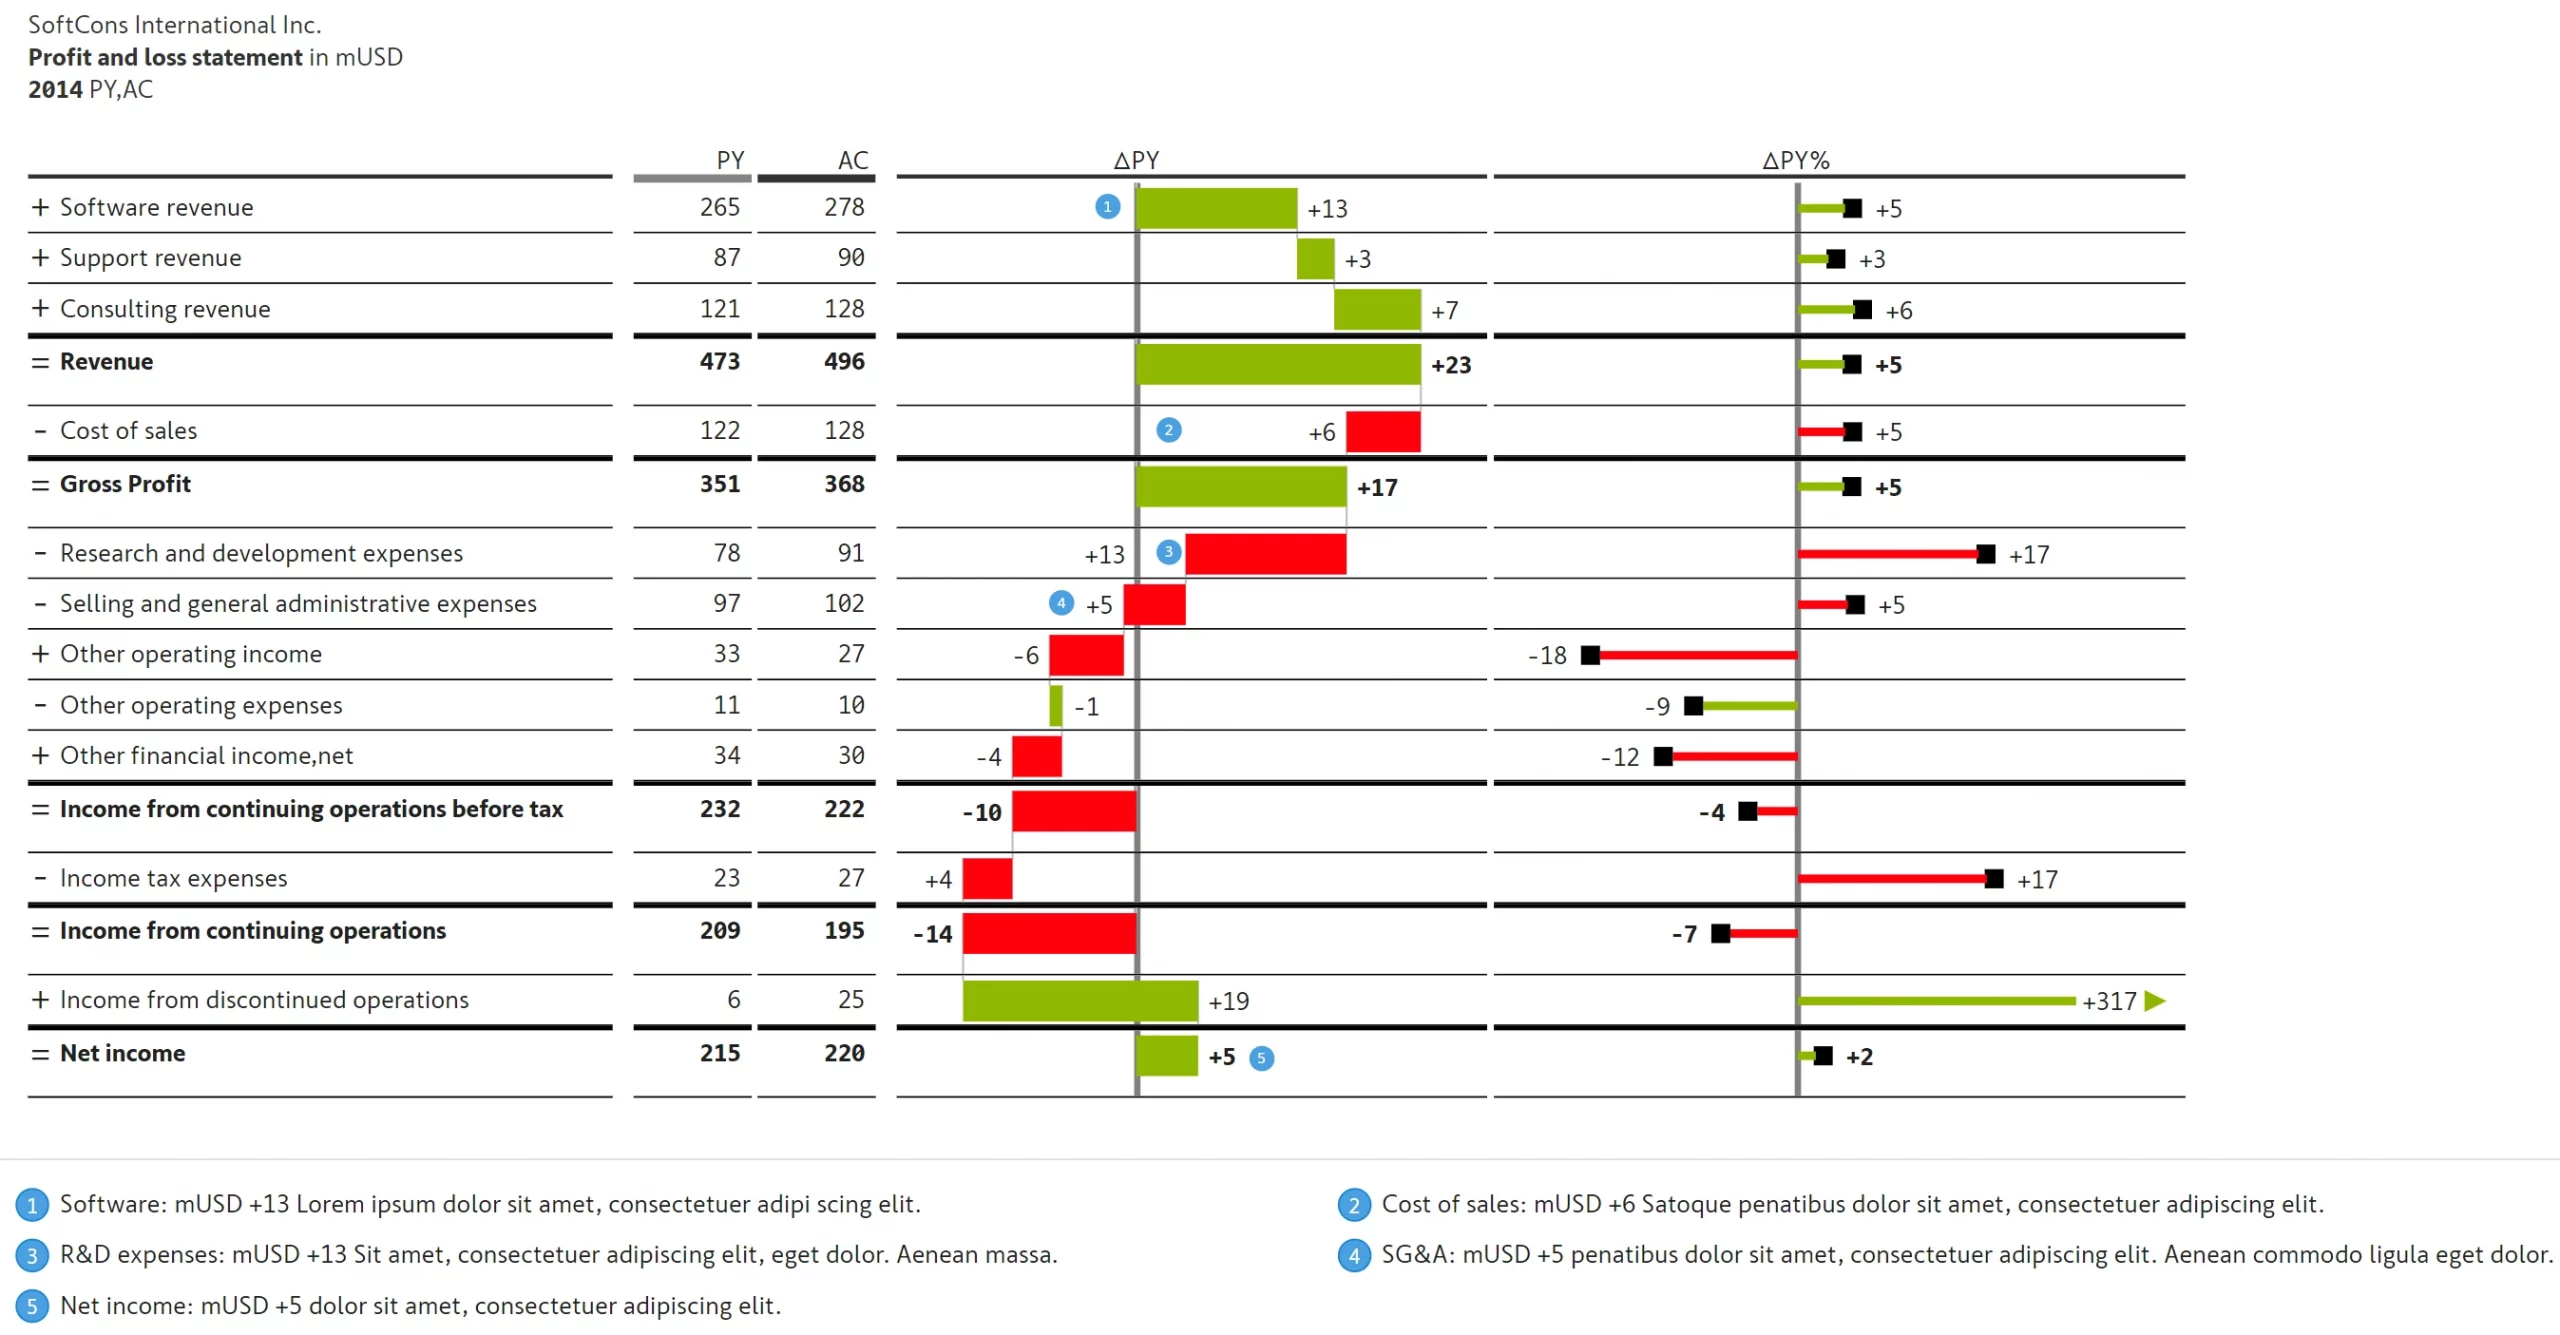
Visualize calculation schemes in rows; used for calculations such as profit and loss statements.
Inforiver helps enterprises consolidate planning, reporting & analytics on a single platform (Power BI). The no-code, self-service award-winning platform has been recognized as the industry’s best and is adopted by many Fortune 100 firms.
Inforiver is a product of Lumel, the #1 Power BI AppSource Partner. The firm serves over 3,000 customers worldwide through its portfolio of products offered under the brands Inforiver, EDITable, ValQ, and xViz.