Upcoming webinar on 'Inforiver Charts : The fastest way to deliver stories in Power BI', Aug 29th , Monday, 10.30 AM CST. Register Now
Upcoming webinar on 'Inforiver Charts : The fastest way to deliver stories in Power BI', Aug 29th , Monday, 10.30 AM CST. Register Now
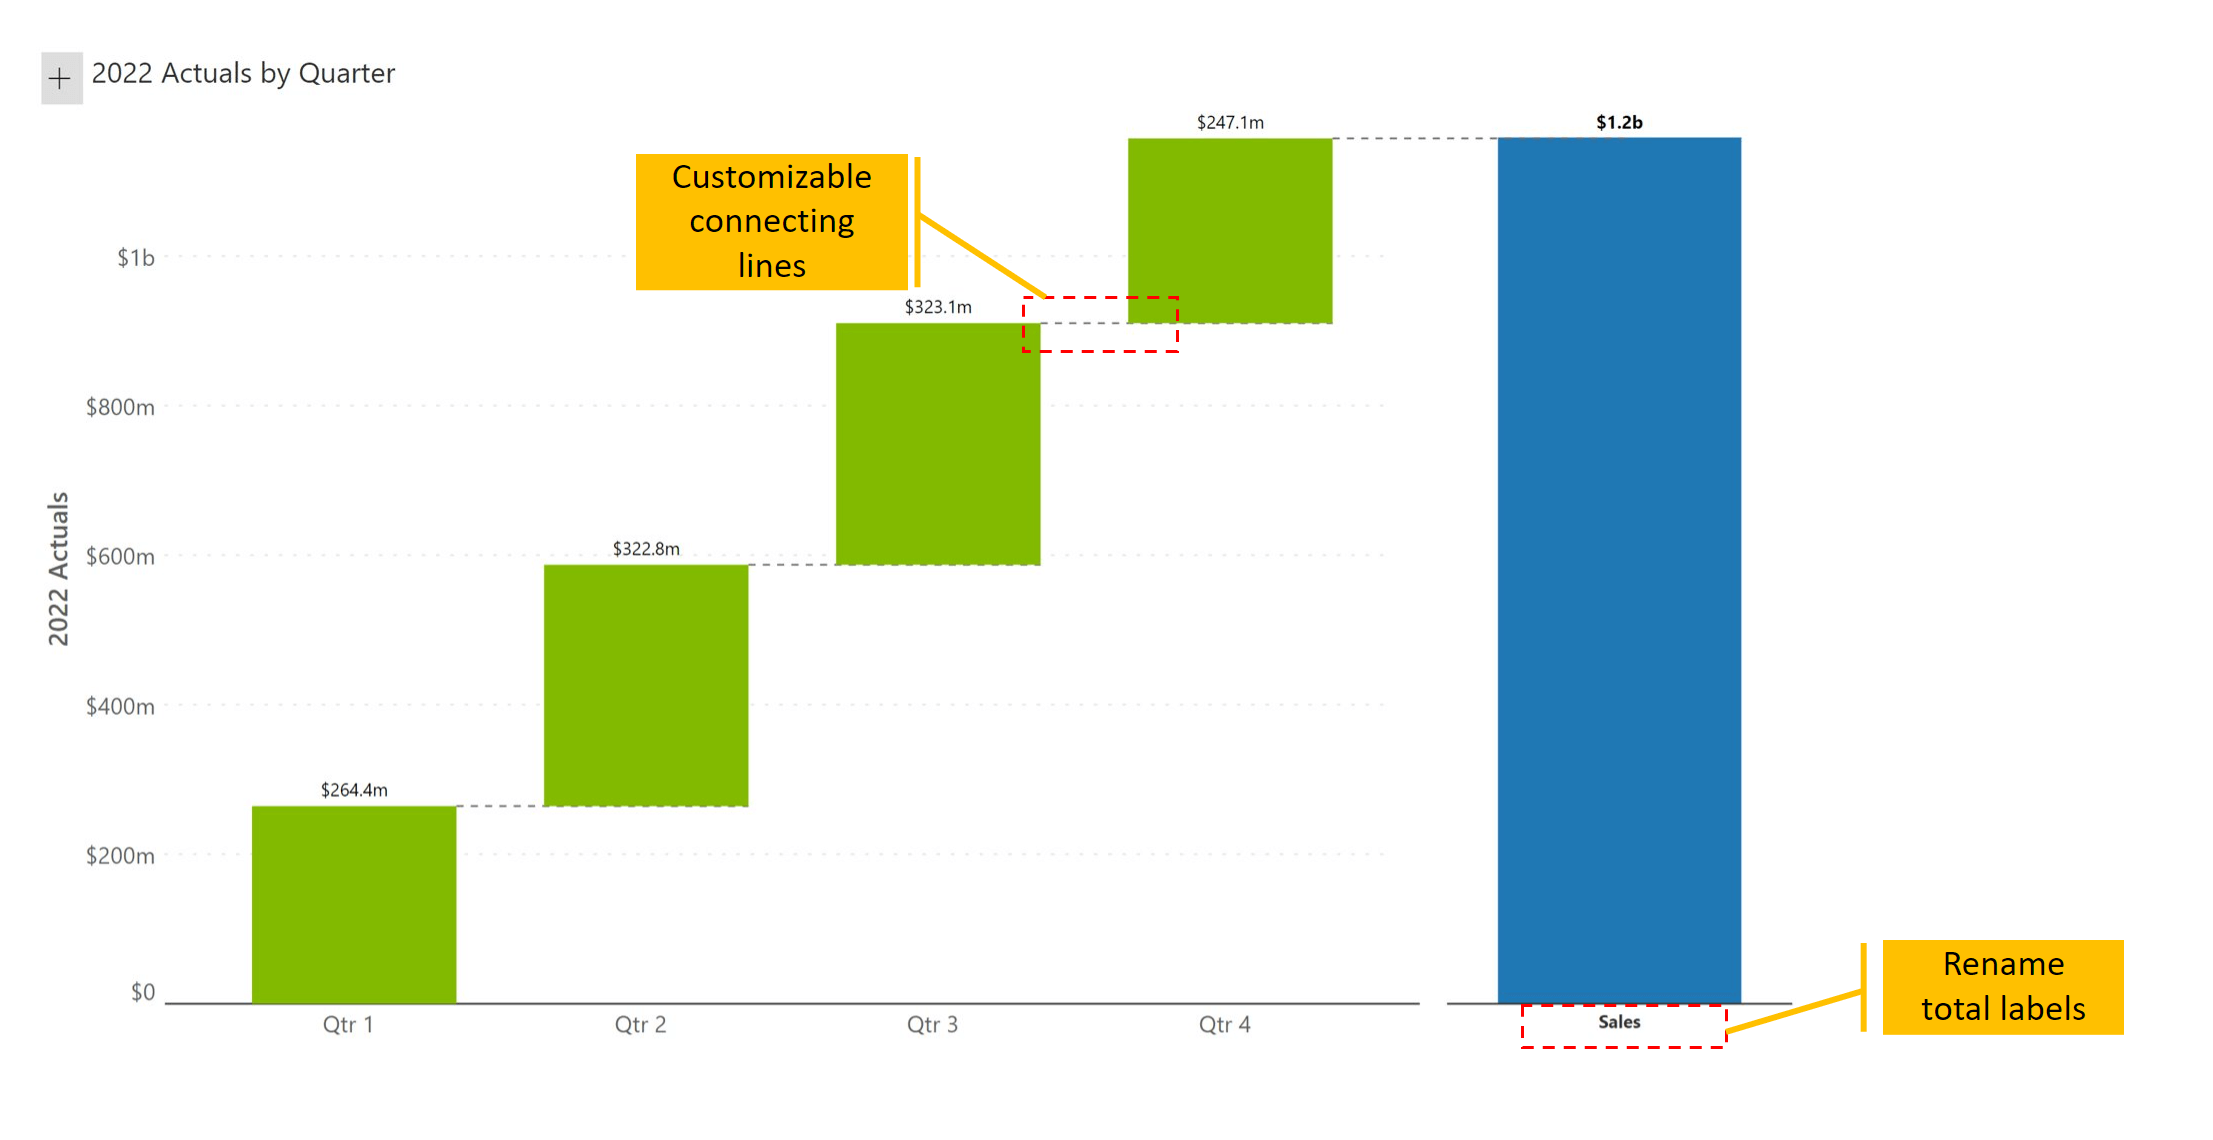
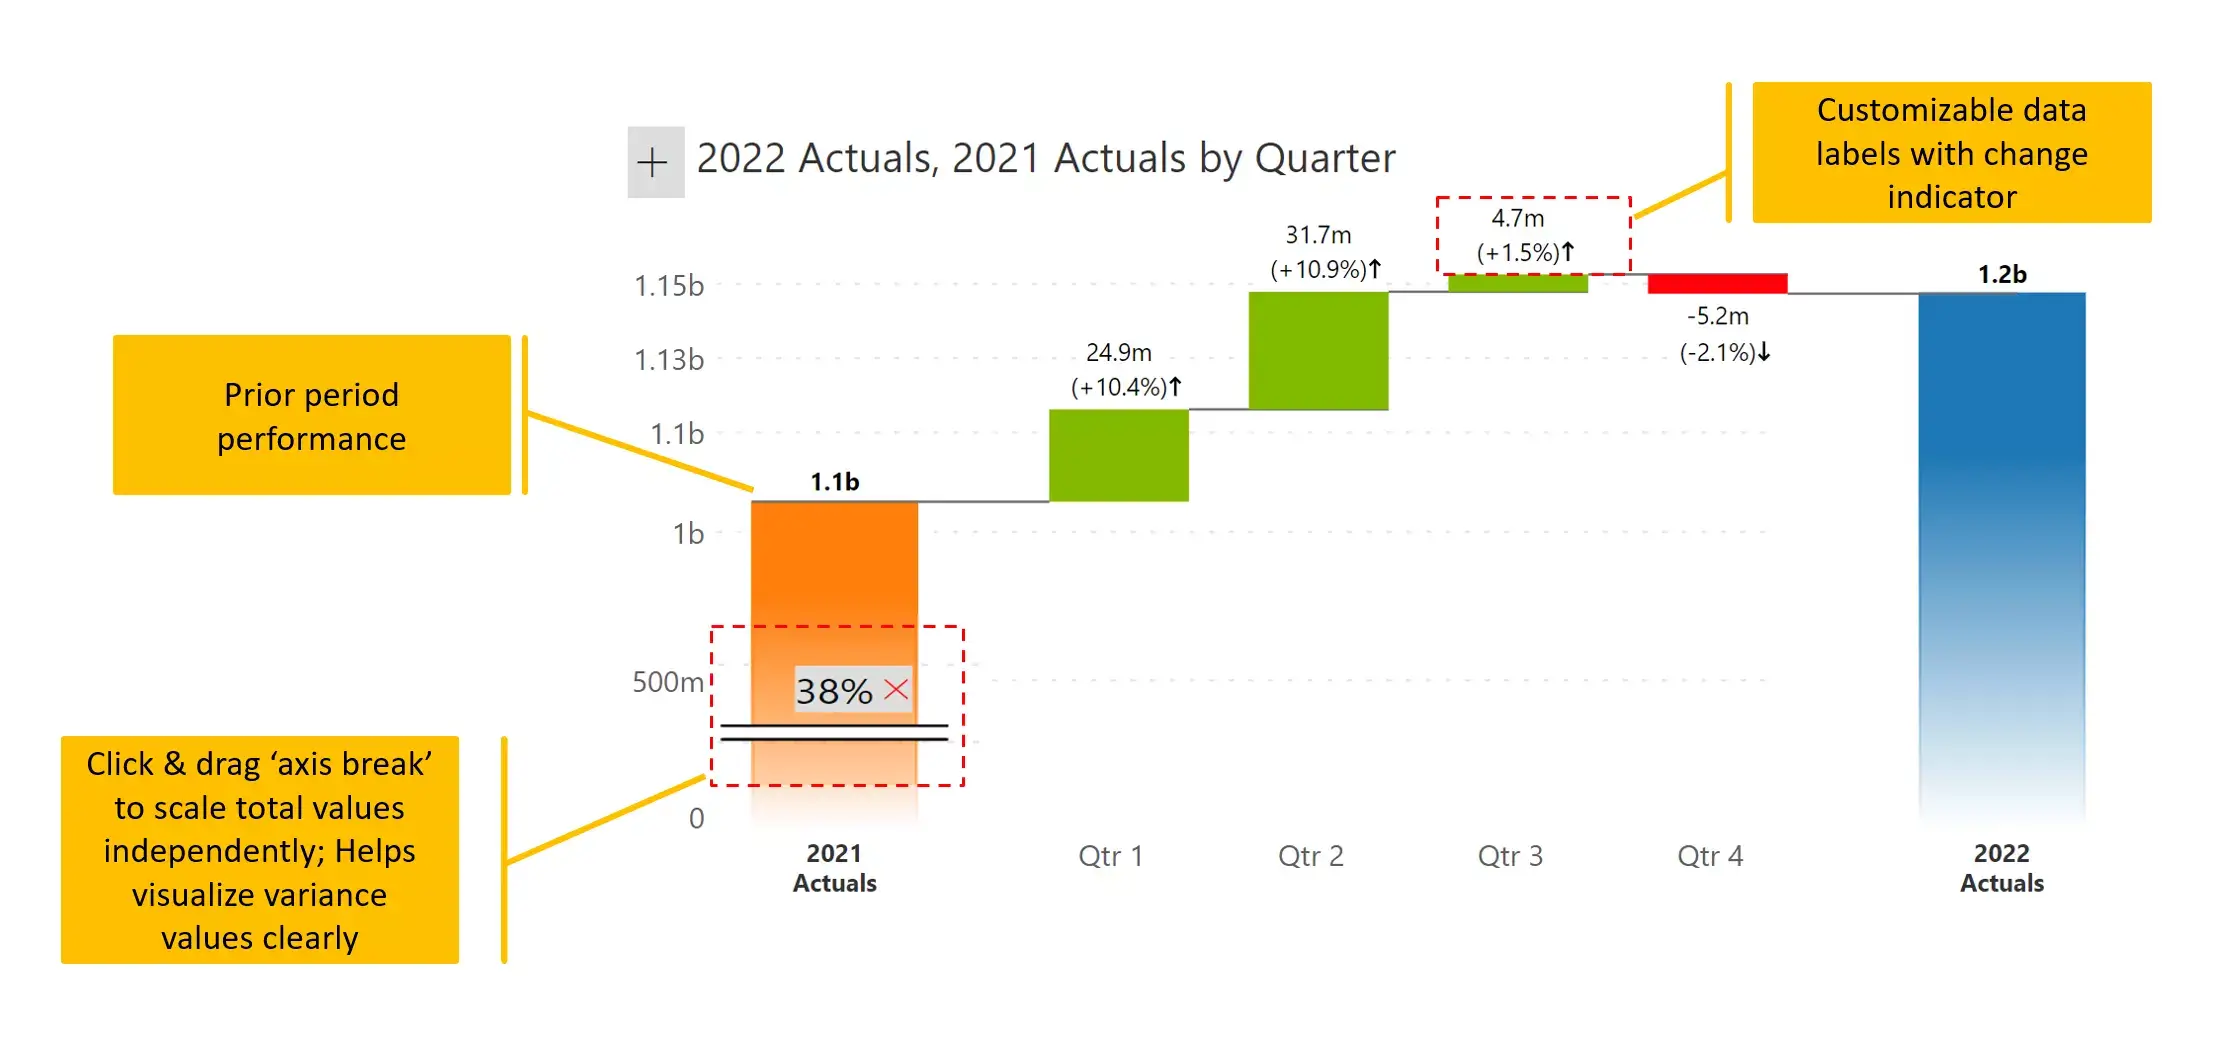
Using the variance waterfall, you can highlight Year-over-Year variances for each quarter to explain which quarters contributed to most of the change from the prior year to the current year.
It is evident that Q1, Q2, and Q3 (green) have contributed the most to the increase in 2022 revenue, while Q4 (red) witnessed a drop.
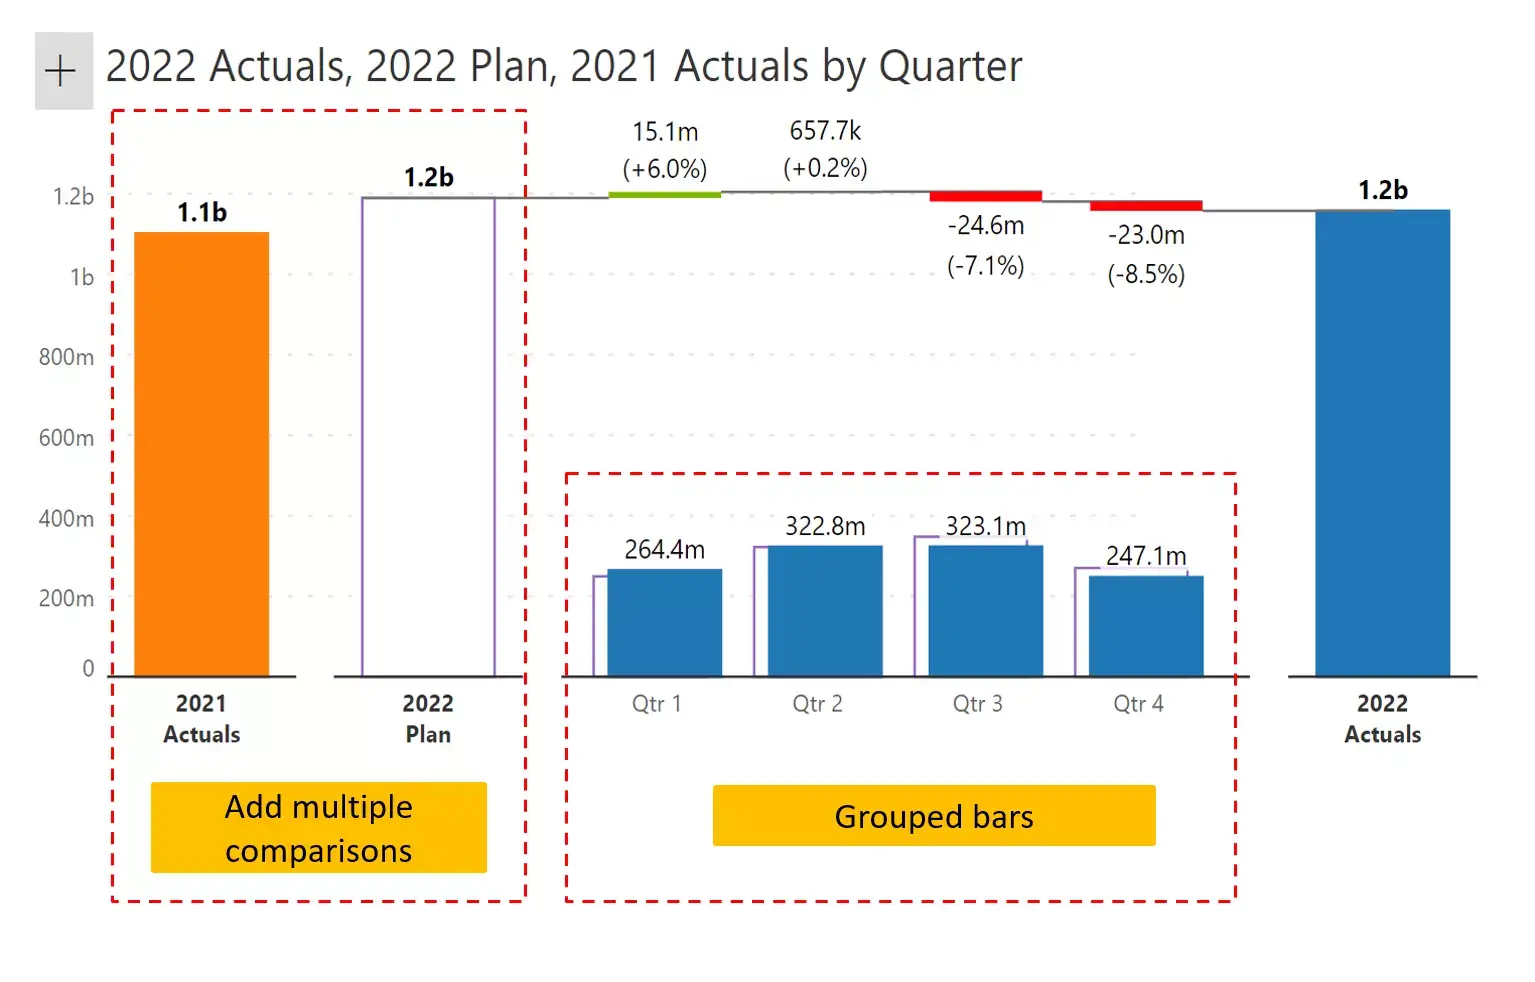
This type of waterfall chart highlights deviations between 2022 Actuals & 2022 Plan by quarter. 2021 Actuals (in orange) is also provided as a reference (without quarterly breakdown). Overall we have three measures shown in this chart, with two of them broken down by quarters.
Inforiver allows up to 4 measures - one pair for granular variance calculations, and another two just for reference.
Note that this chart shows quarterly contributions as grouped bars (touching the x-axis) and the variances separately above.
One drawback in this type of chart is that the variance values may get much smaller. You do have the option to zoom in on variances as shown in the previous chart (#2), but you will not be able to see absolute quarter values at the bottom.
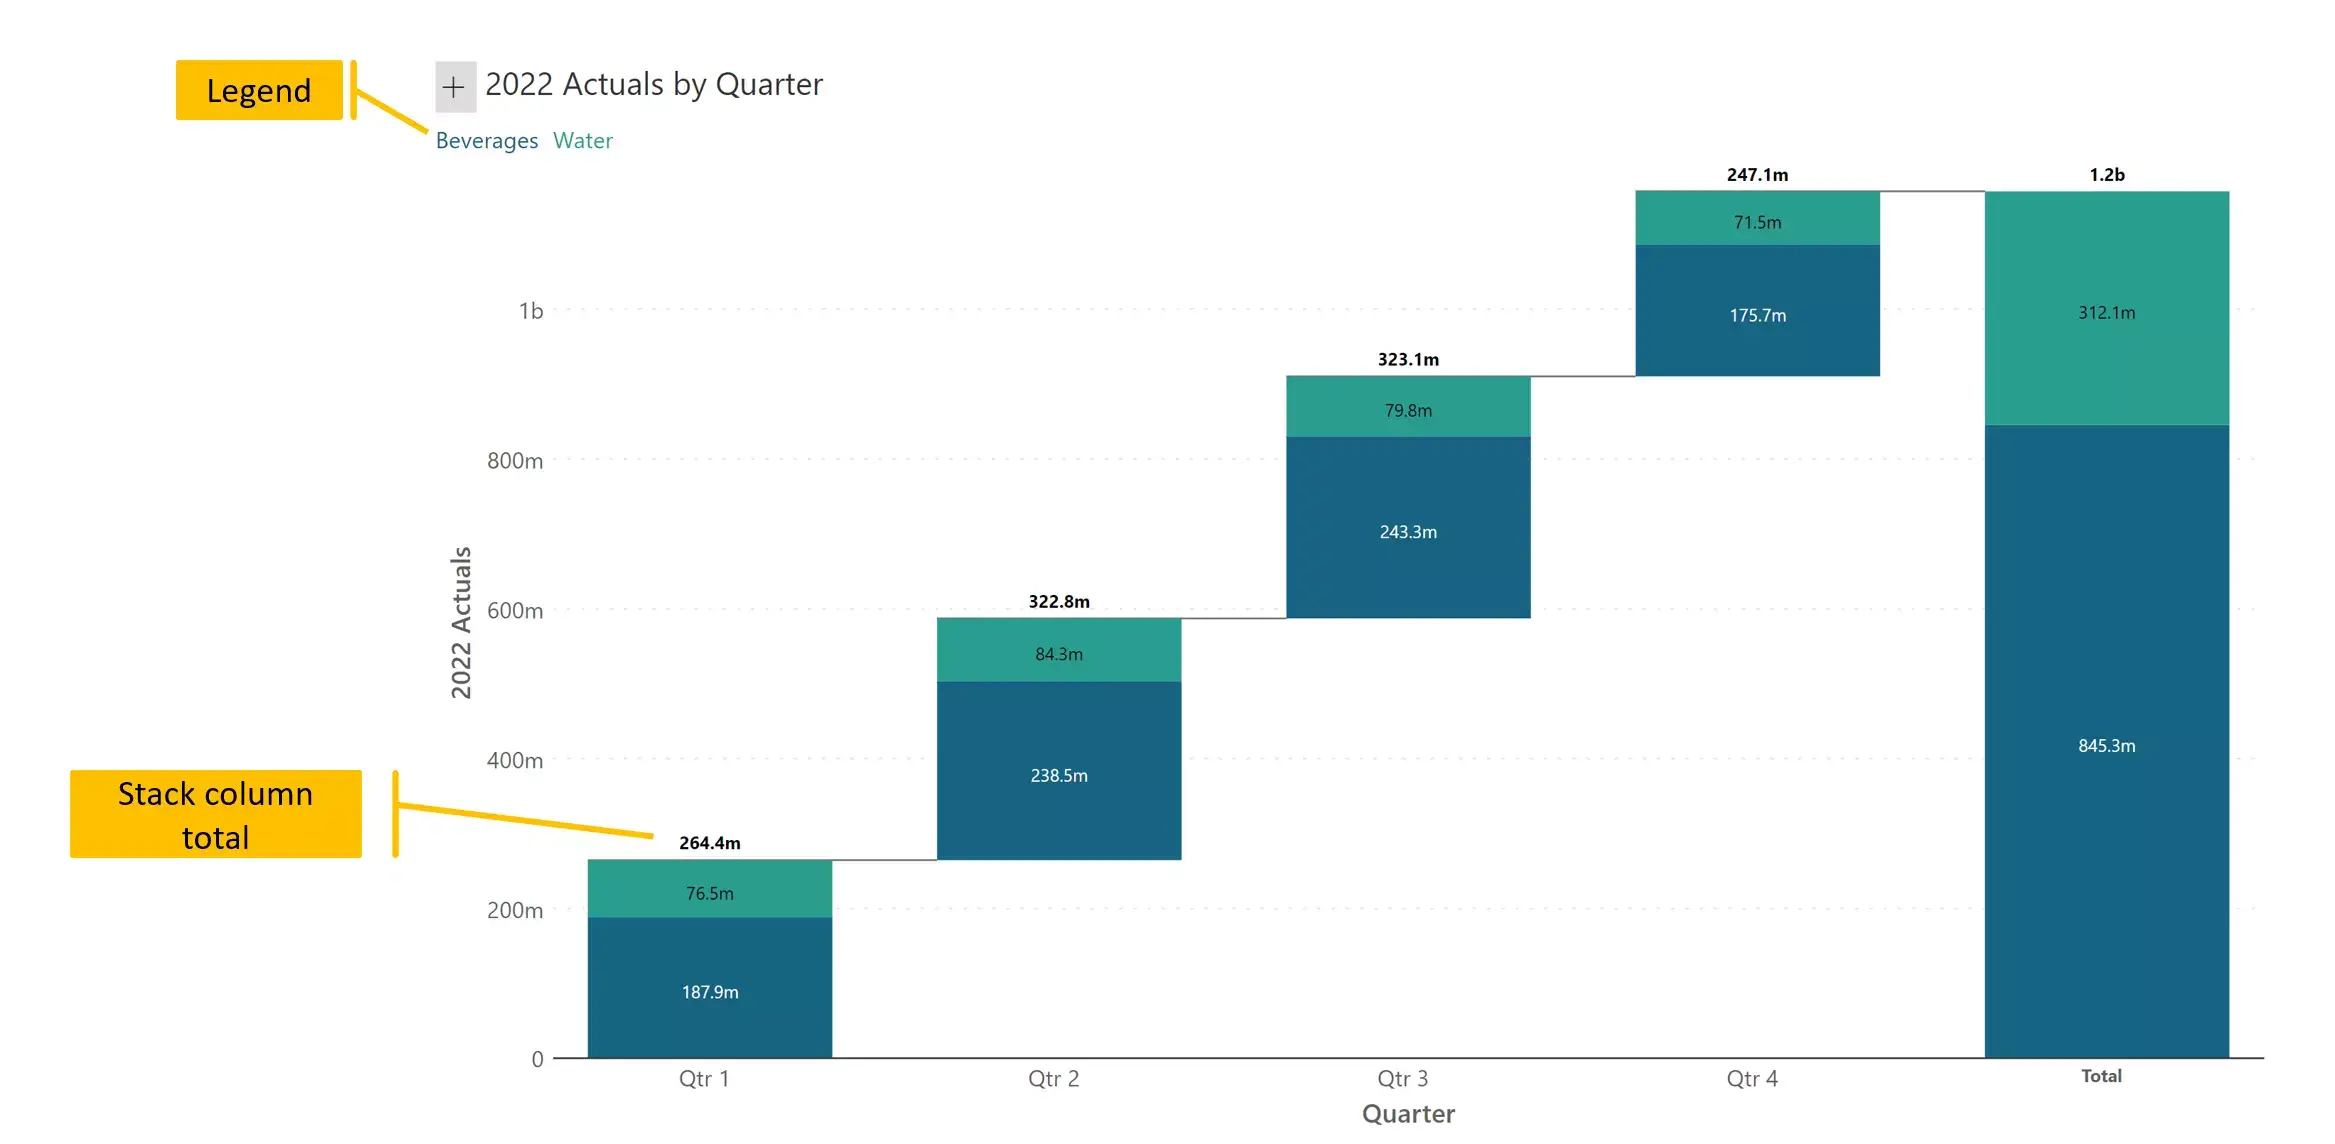
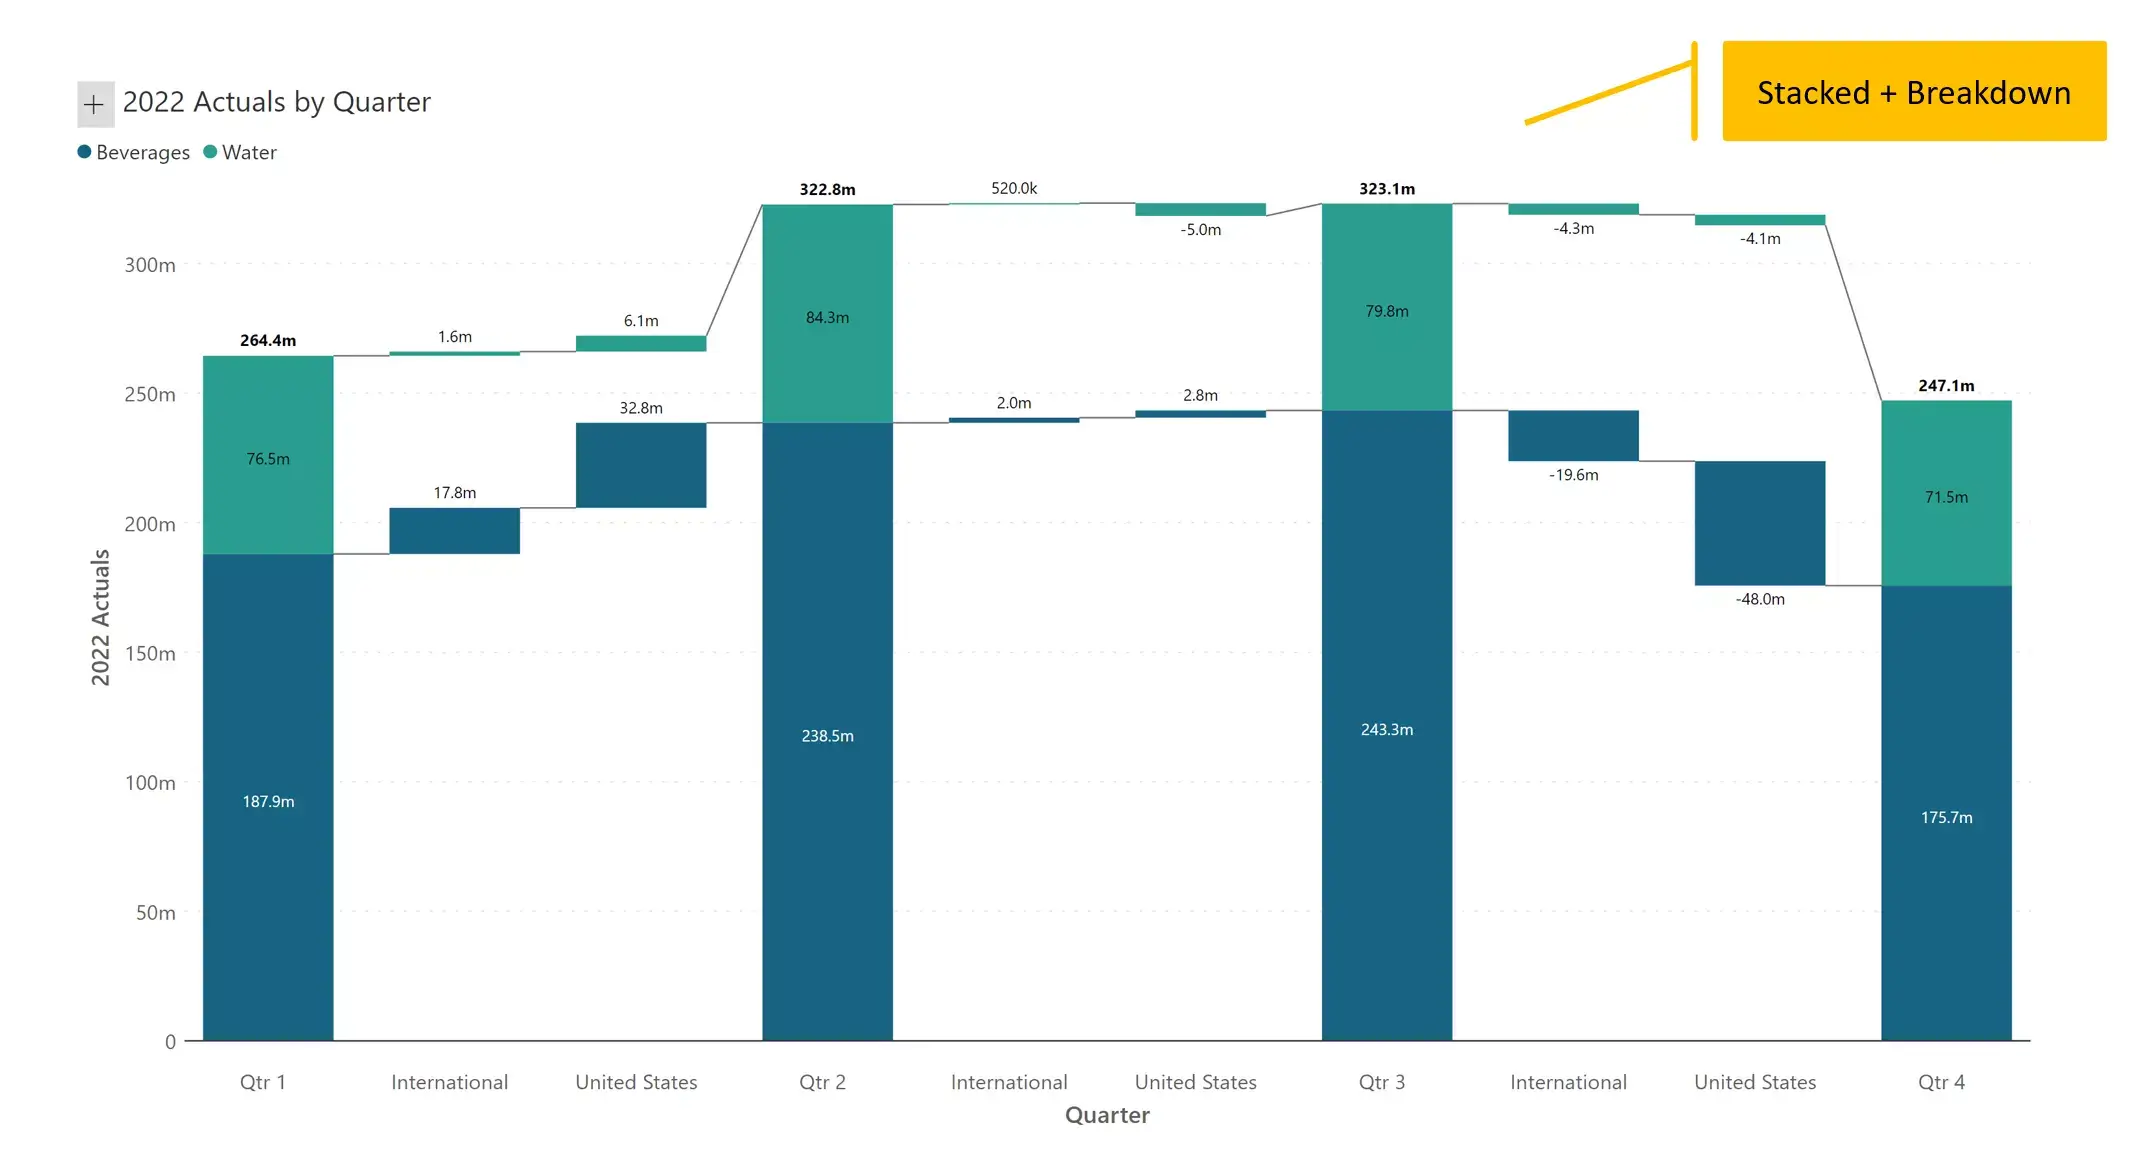
A waterfall chart can be built with stacked columns. In this example, sales from each quarter (and the total) is broken down into two categories (Beverages and Water).
The breakdown waterfall takes a normal column chart (e.g., sales by quarter), and explains the differences through variances.
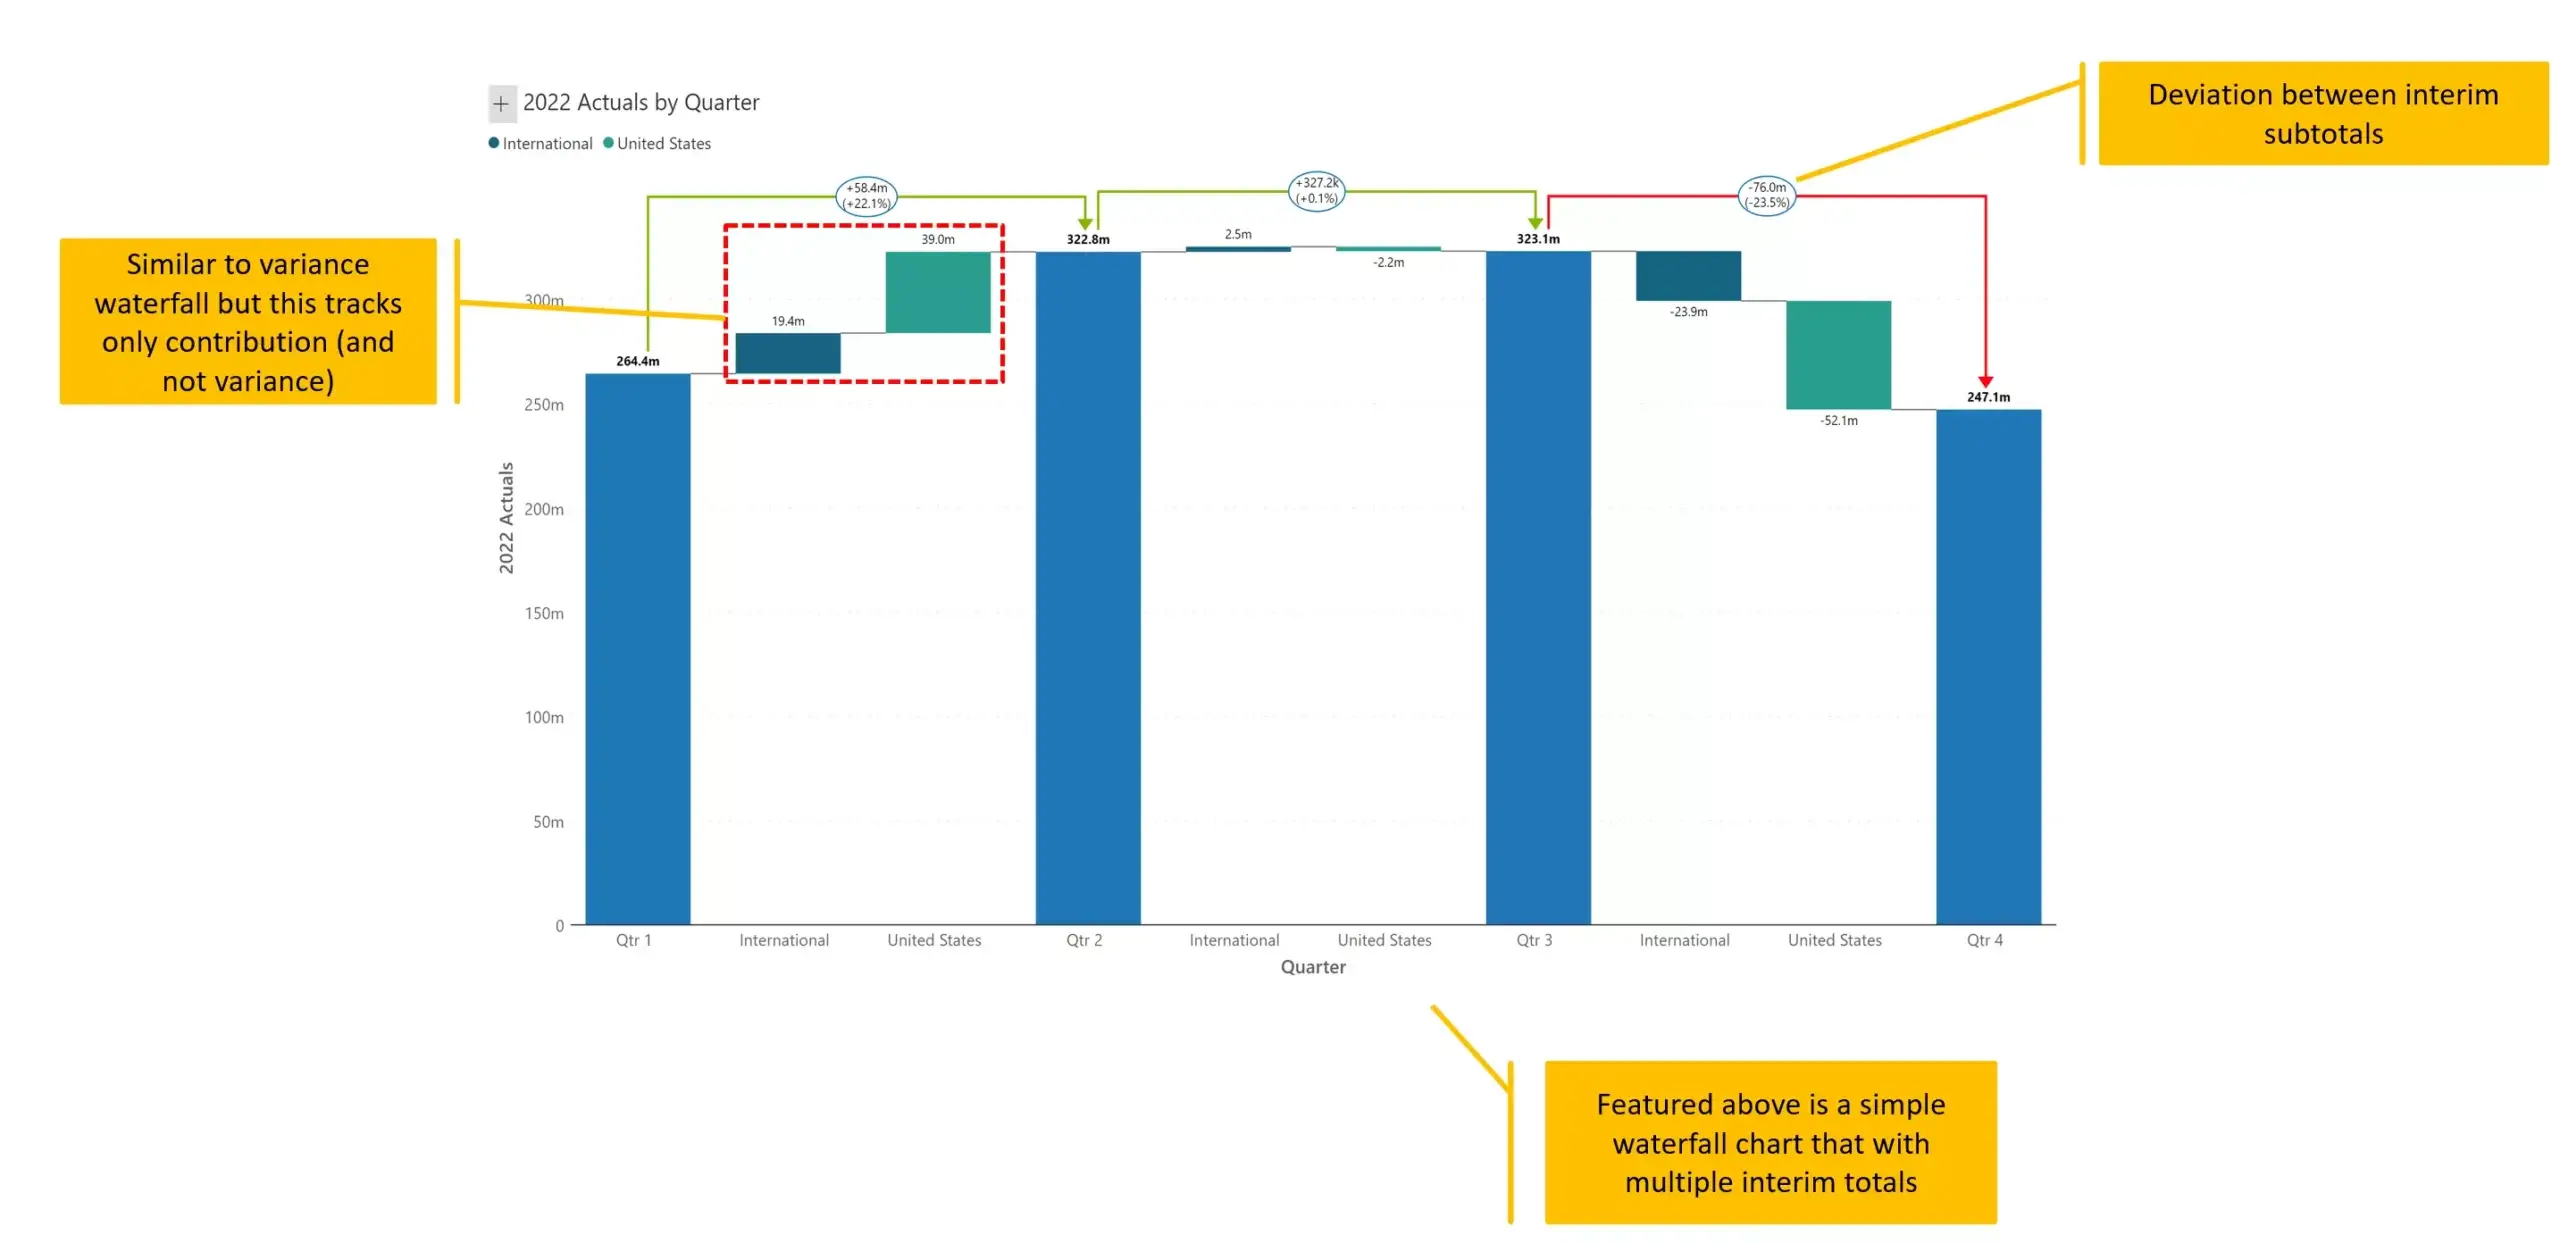
In this case, unlike the previous charts, we have opted for a non-time dimension (geography). We are showing which geography contributes the most to the increase or decrease in sales between any two quarters.
You can also think of this as a waterfall chart with several interim totals (Q2 and Q3) and a final total (Q4).
Unlike a typical variance chart, we cannot show positive variances in green and negative variances in red. It is rather better to color each geography consistently across quarters.
This is a combination of stacked (#4) and breakdown (#5) waterfall chart.
It shows sales from each quarter, and all values including interim and final totals are further broken down into two categories (beverages and water).
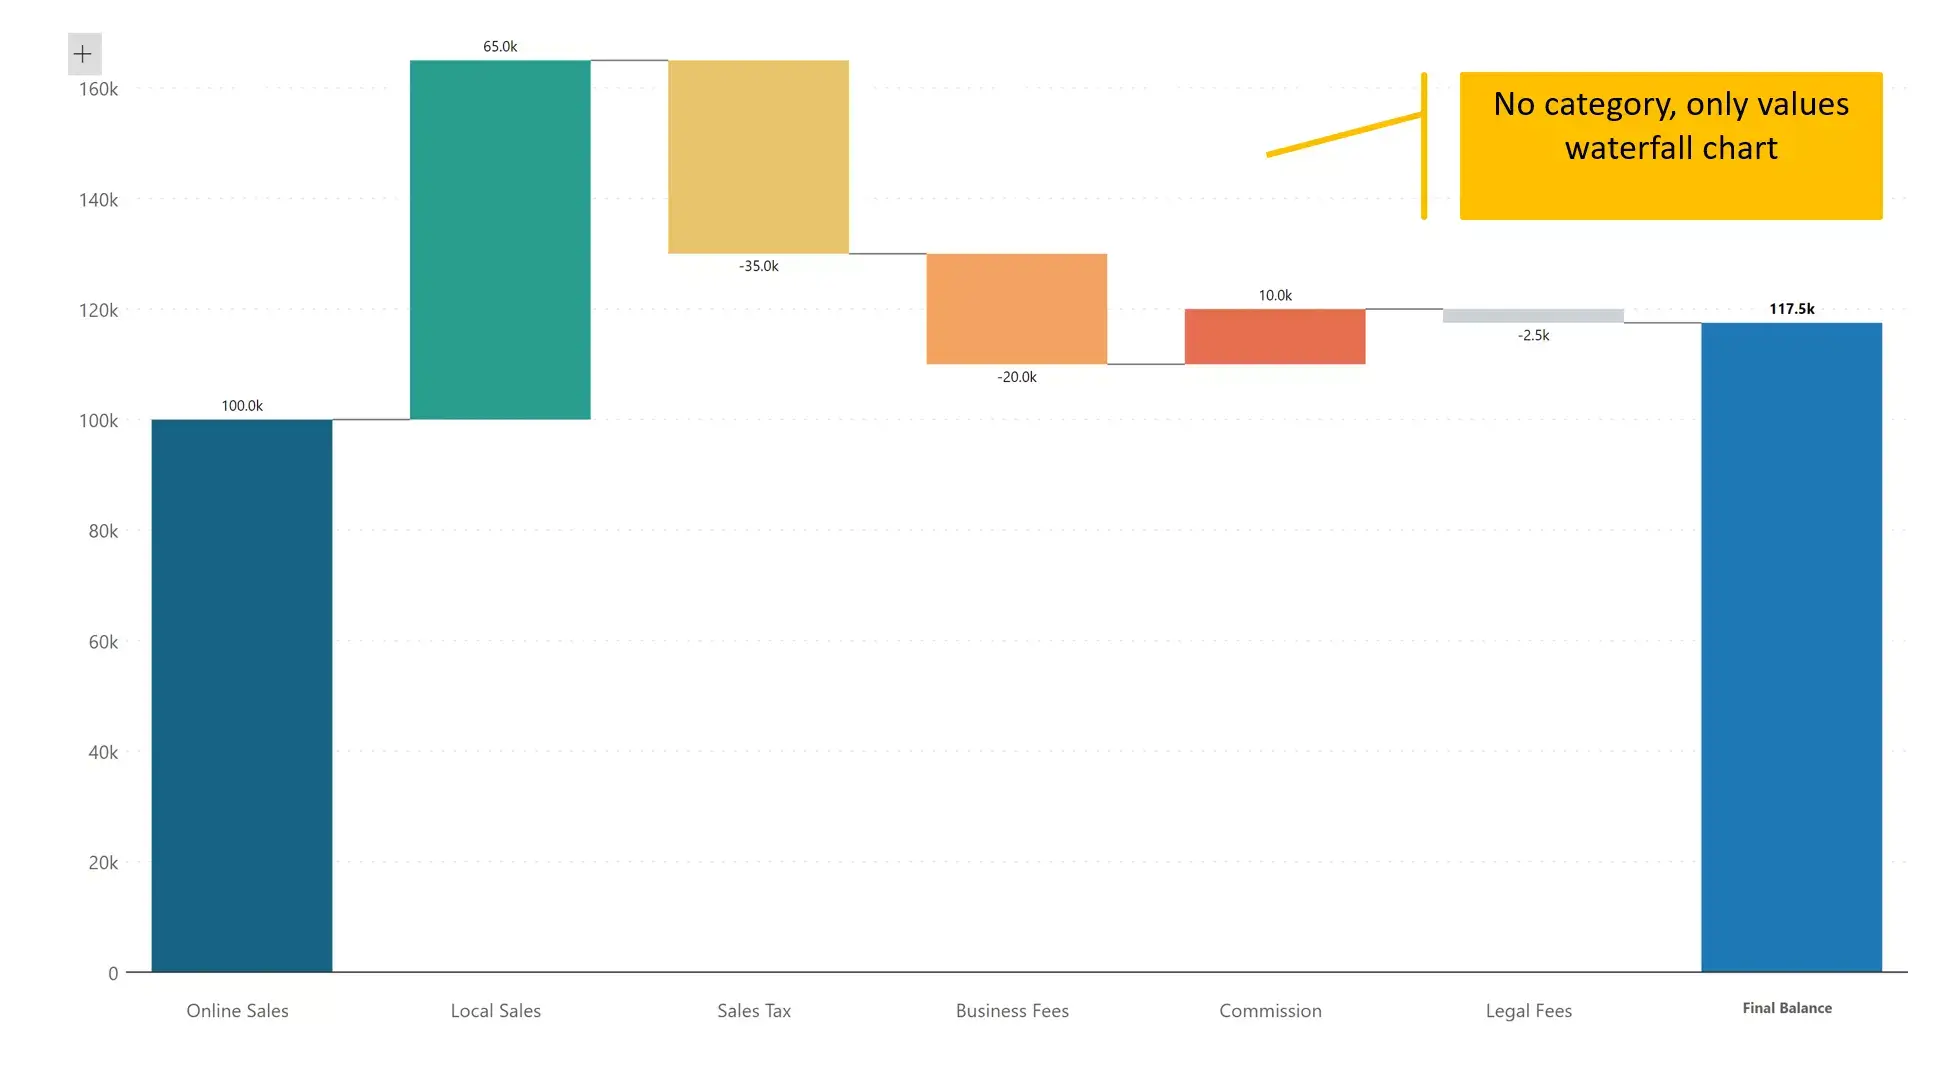
One of the most unusual waterfall chart types as it has neither time nor category dimensions. This chart is made entirely of measures.
You can also recreate this chart using a single dimension and a single measure. The dimension would capture all category values that you see in the x-axis and use a single measure to deliver to capture their respective values. But such a chart would show green for positive values and red for negative values. This would look remarkably similar to a variance waterfall chart (#2).
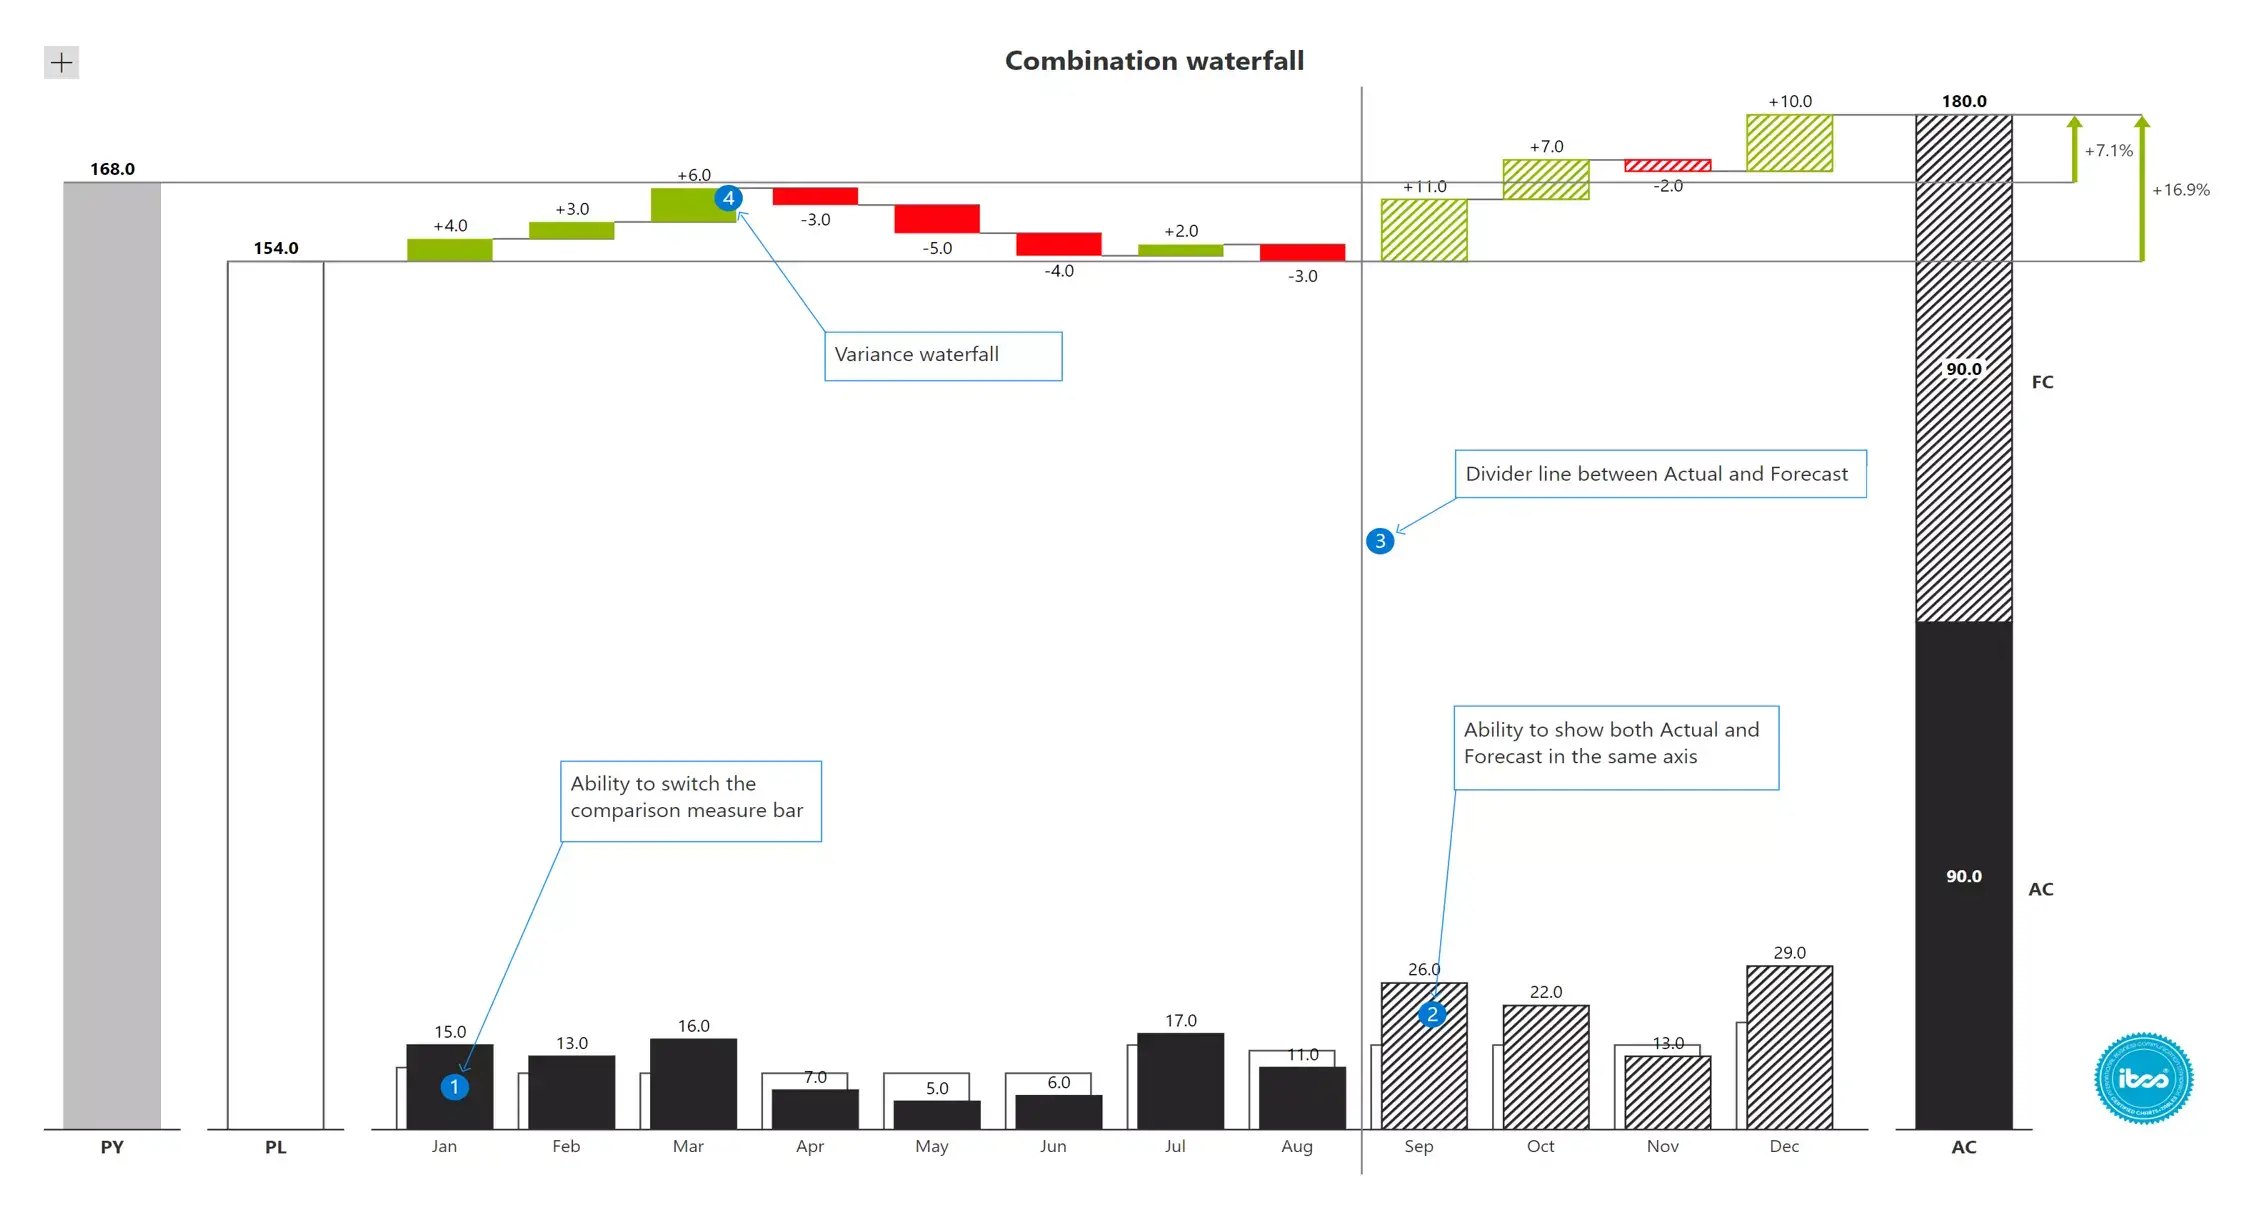
We are in the month of September. We have actual sales data (highlighted in black) from Jan to Aug. We only have sales projections (bars with stripes) from Sep to Dec. The projected sales for the entire year is shown in a stacked column at the end.
You can also observe actual variances (for elapsed period from Jan to Aug), and projected variances (for Sep to Dec) in red and green.
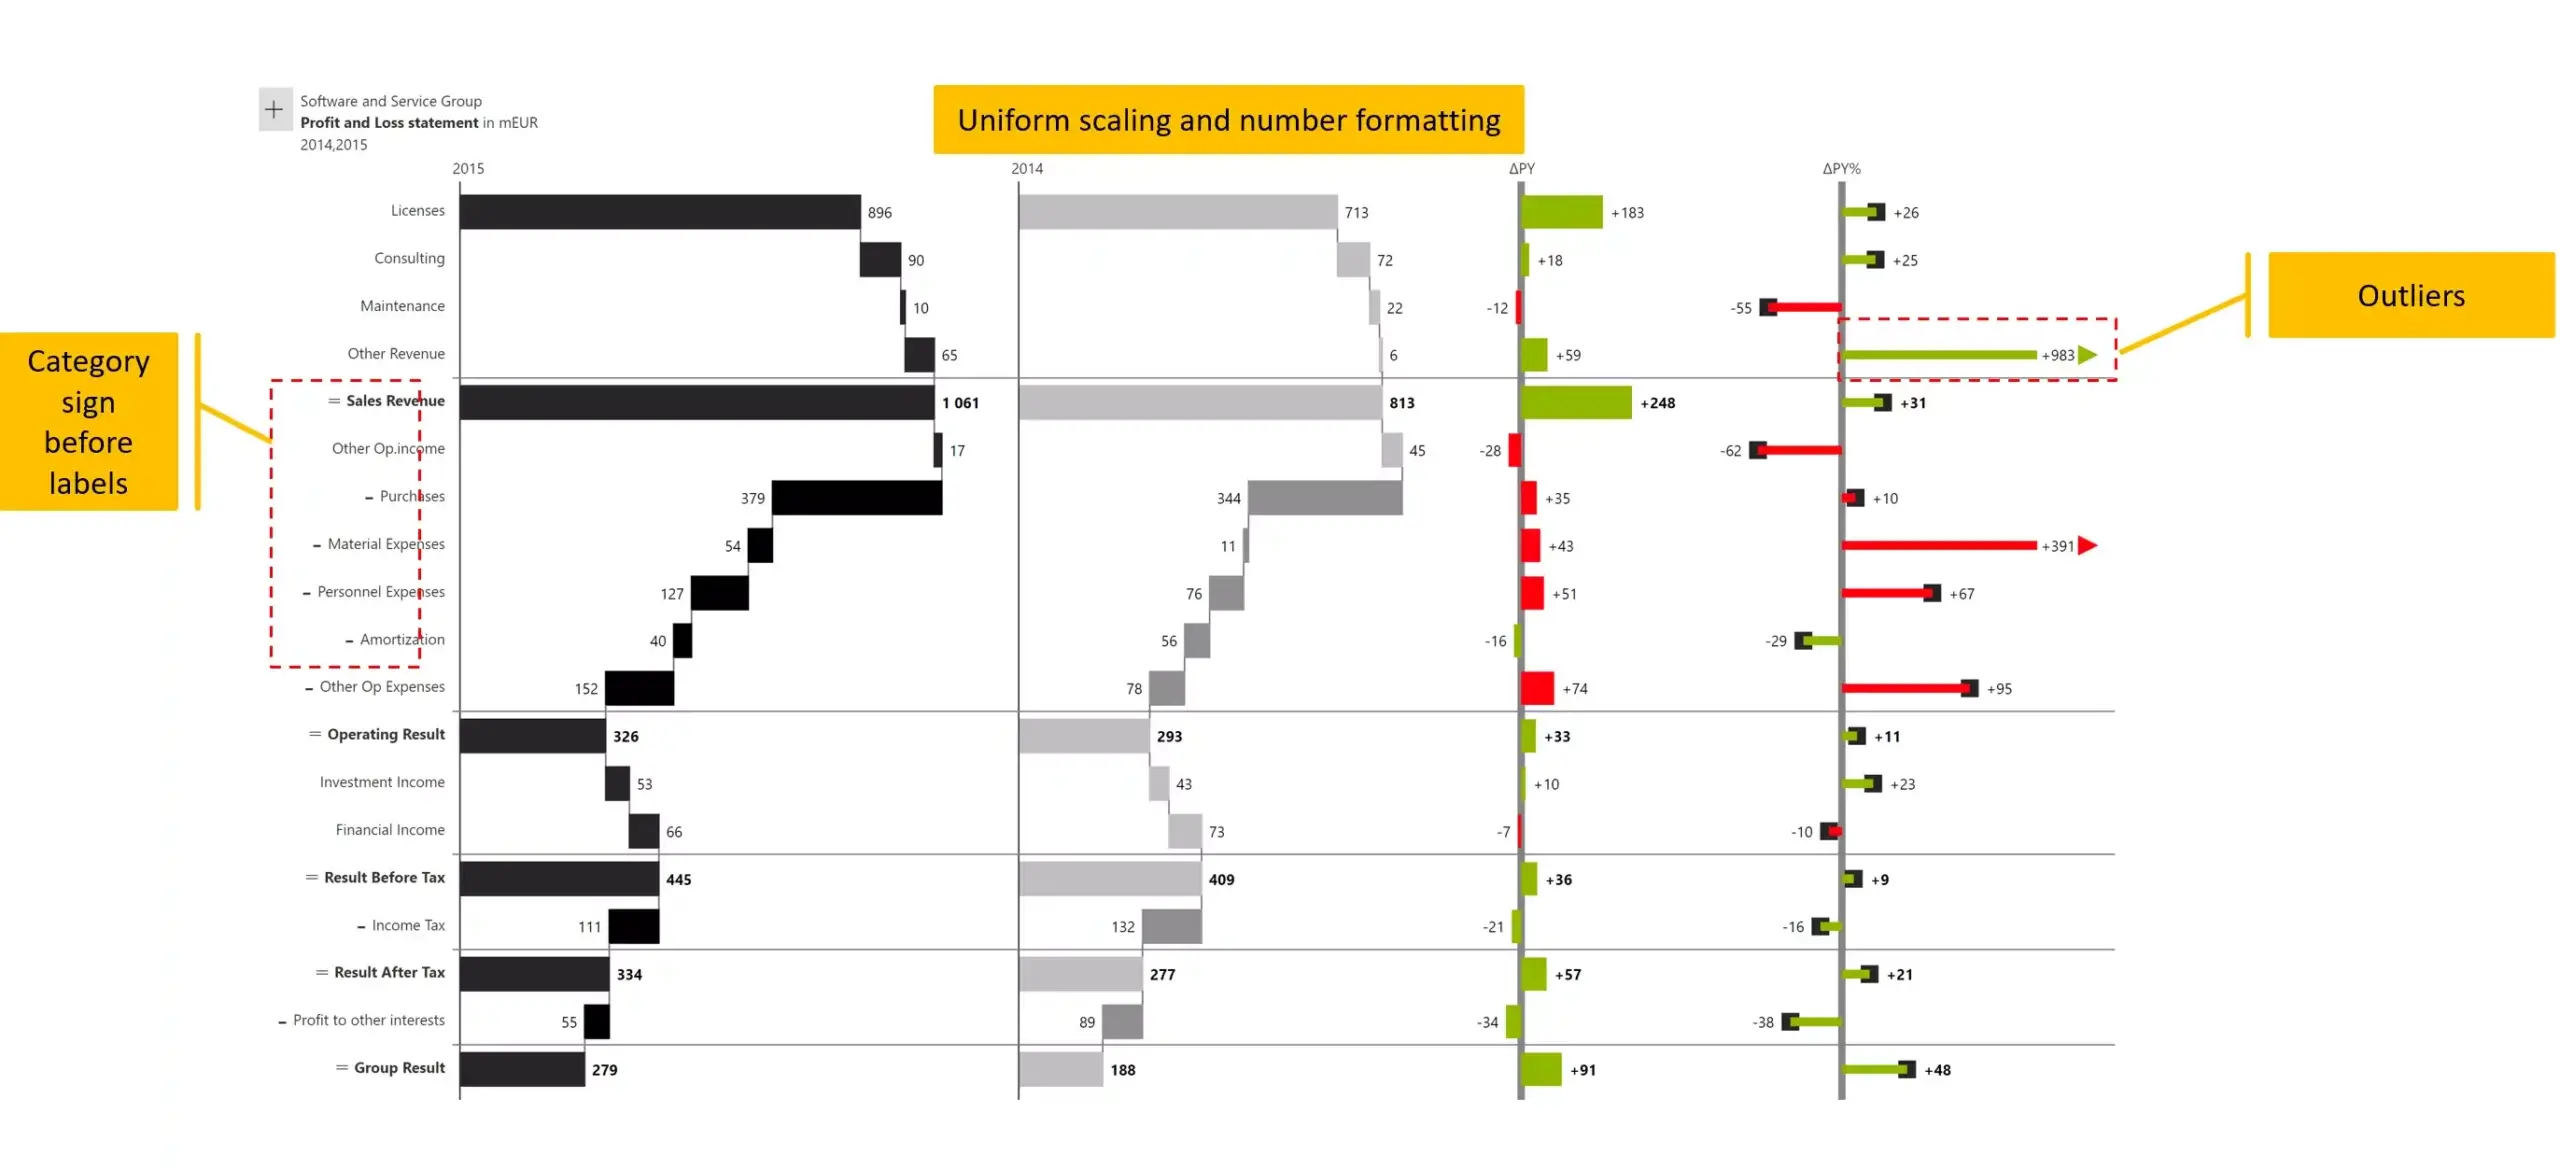
Waterfall charts are great to visualize P&L. In fact, you can even give an idea of calculations performed. In this case, values are typically added, except where a minus (-) sign precedes the name on the Y axis. Interim totals such as Sales Revenue, Operating Result etc are bolded and preceded with a "=" sign.
The last two columns track absolute and percentage variances. The former is in the shape of a bar, while the latter is usually represented by a pin/lollipop
Did you know that you need not create multiple waterfall charts for multiple regions or geographies?
Visualize sales by product category across two separate regions in a single visual using a simple small multiple.
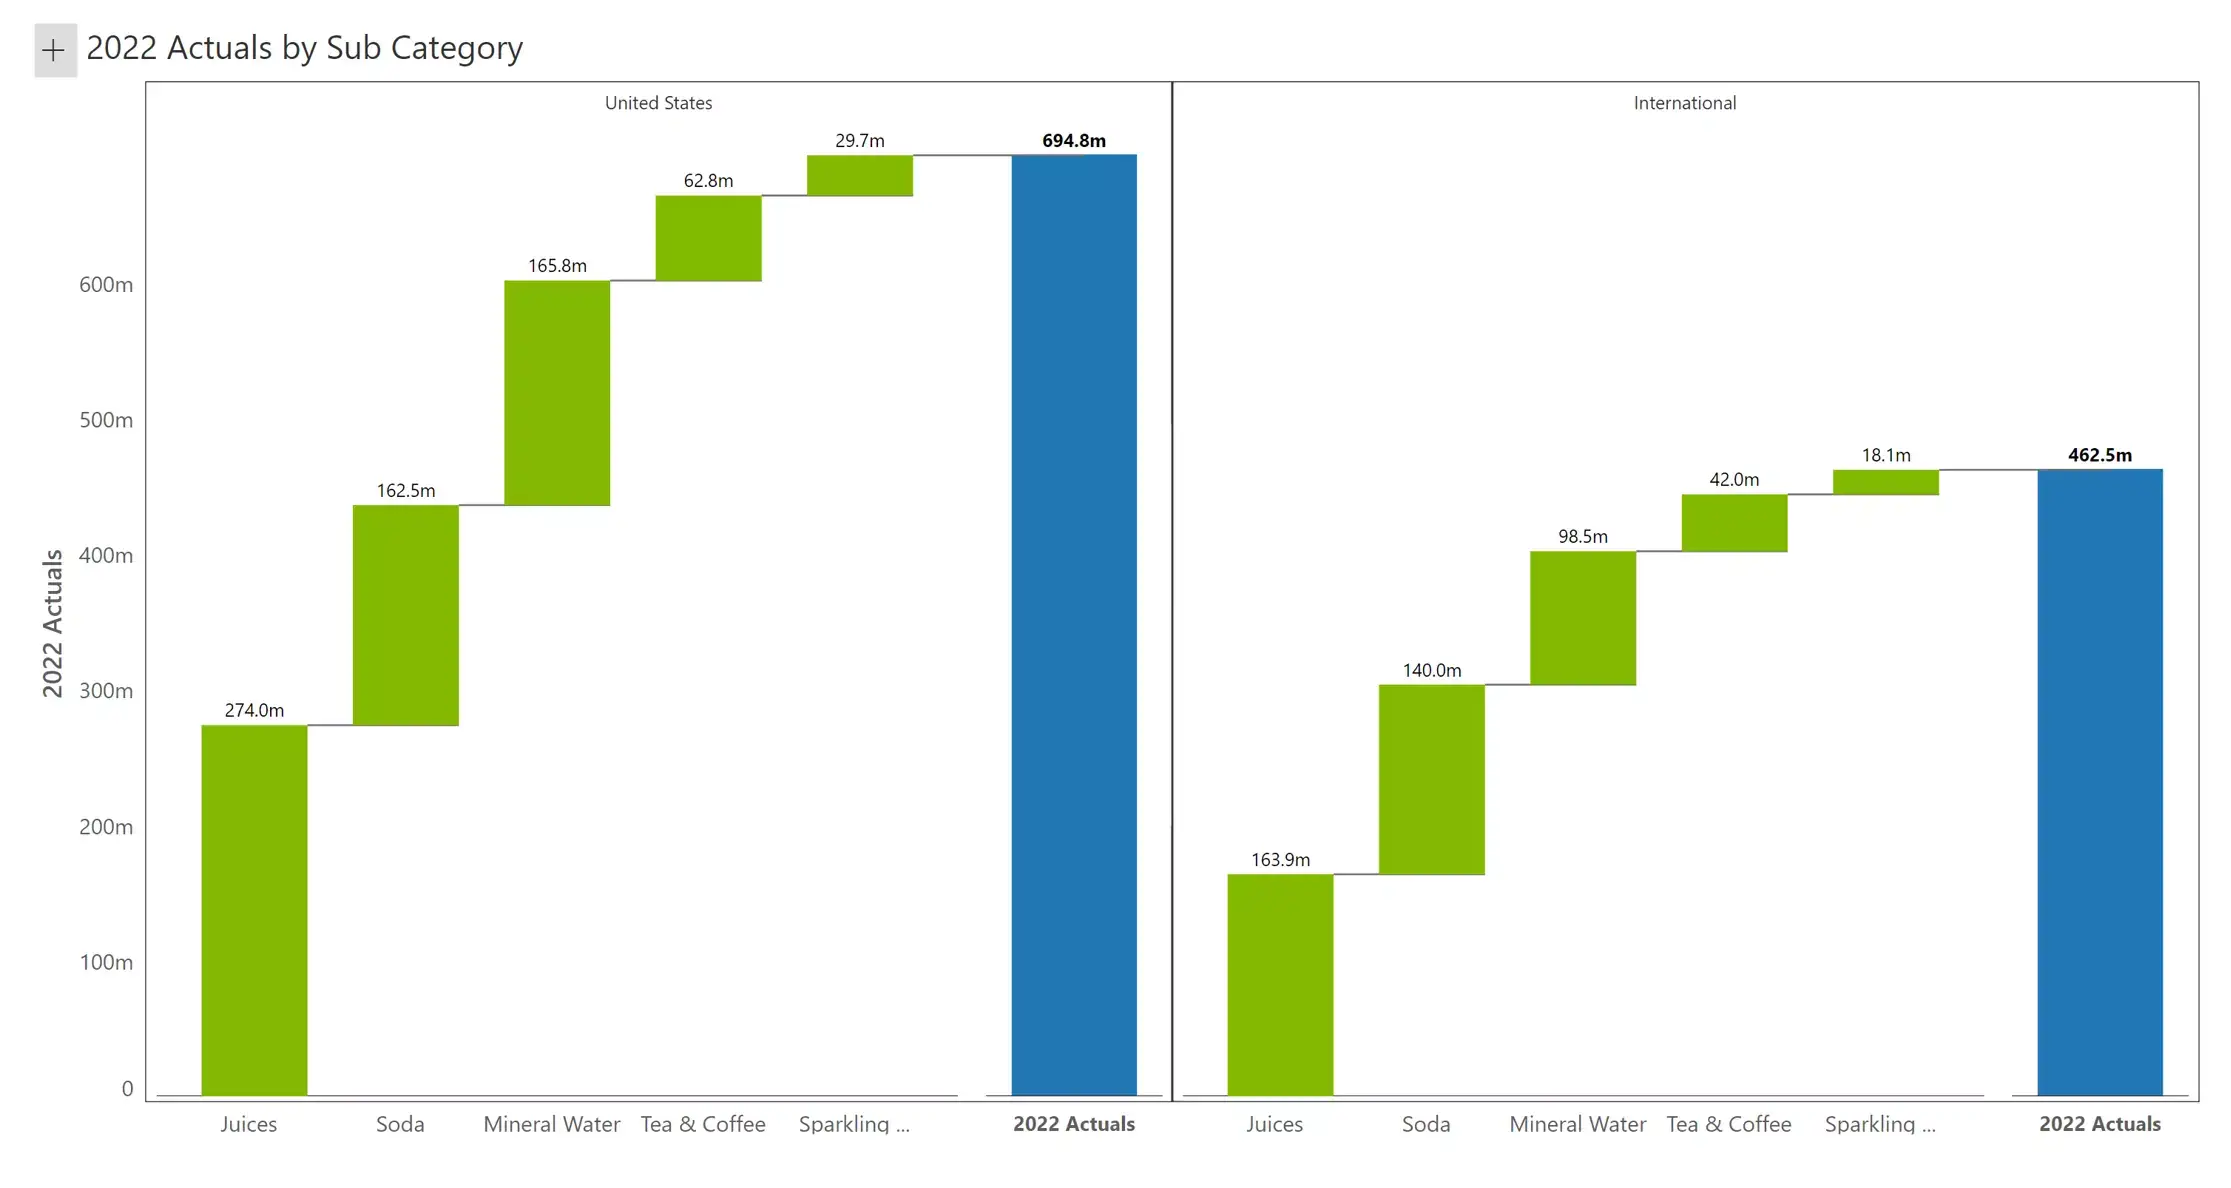
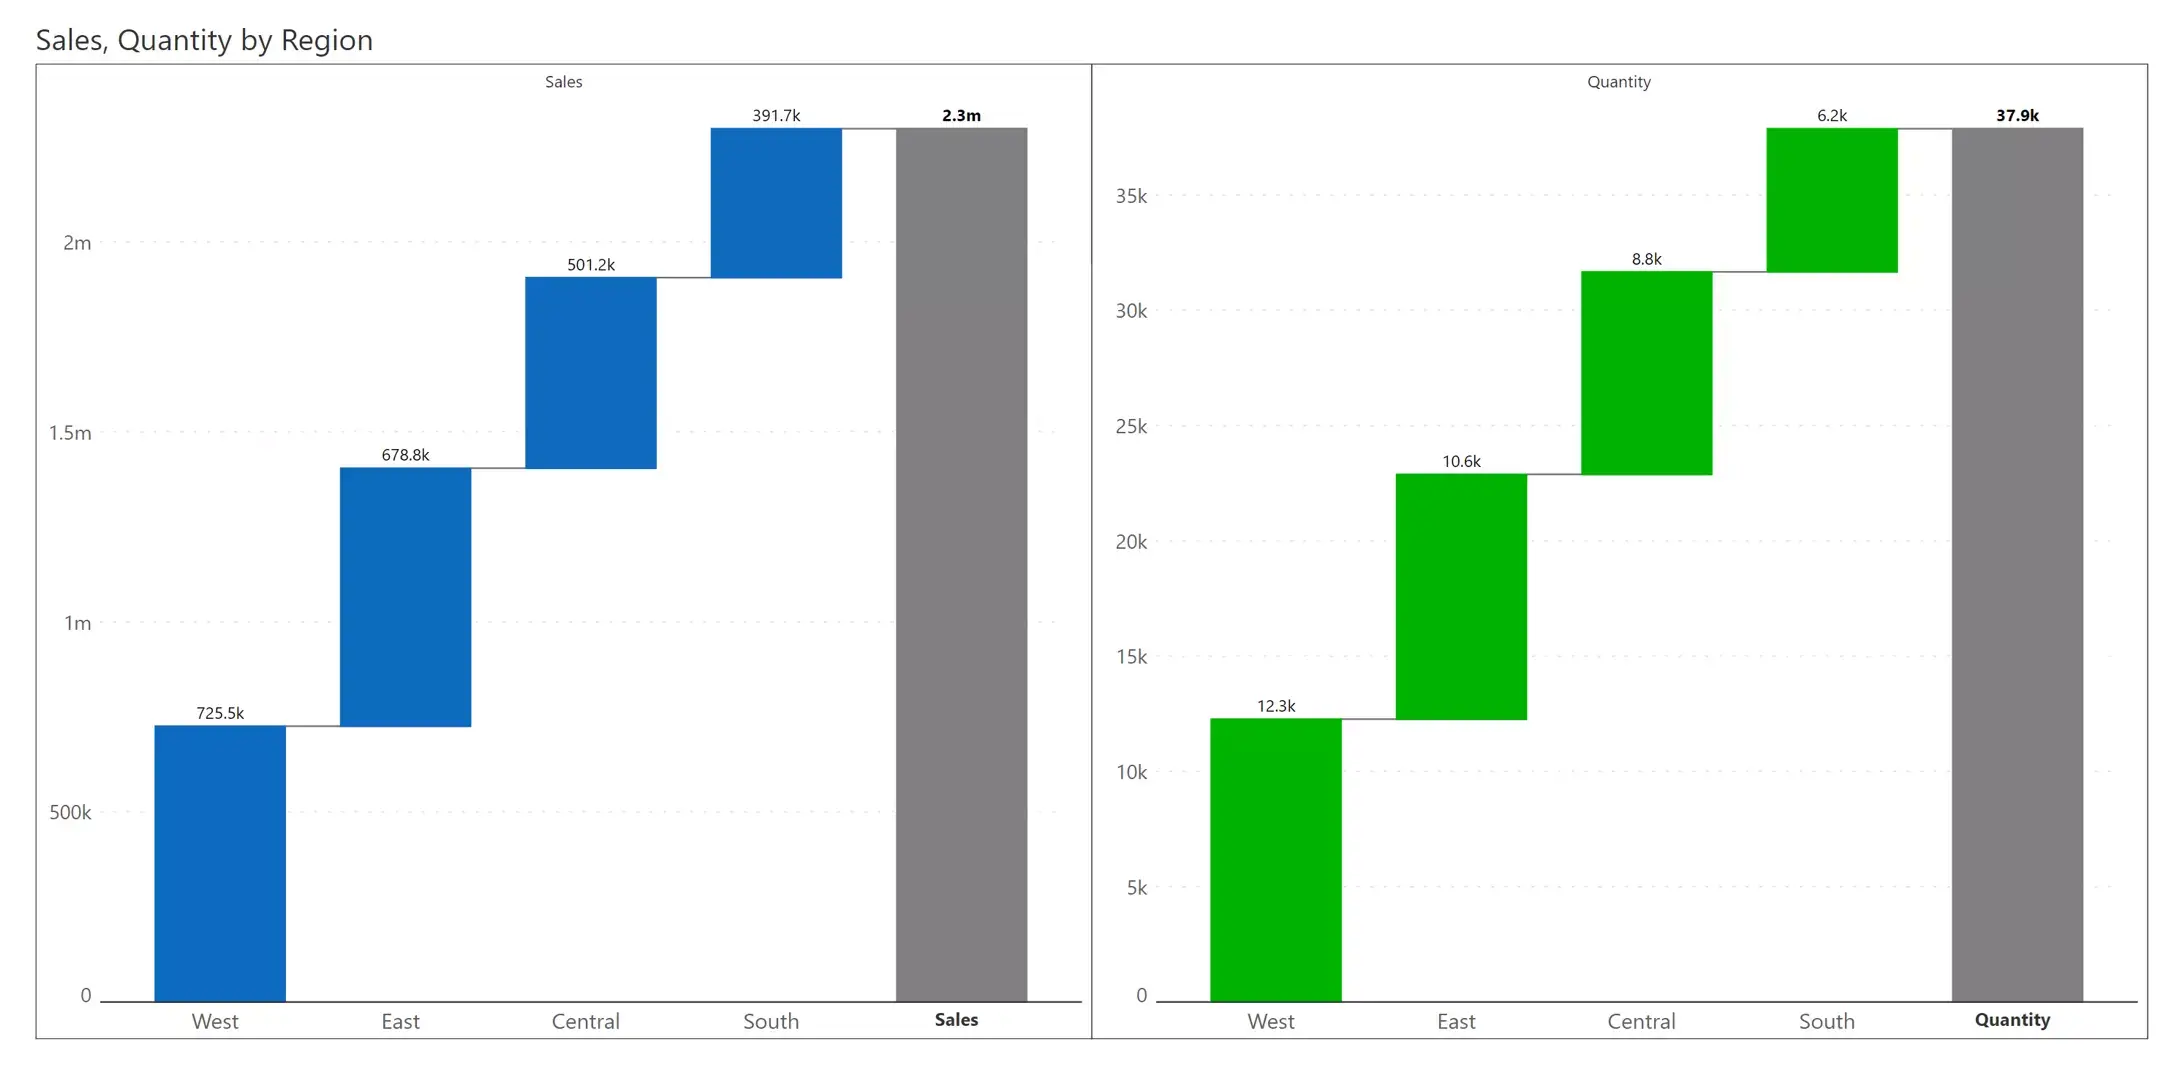
The previous chart (#10) used a category-based small multiple. In other words, each geography was represented in a separate chart.
In this case, we are using a measure-based small multiple waterfall chart.
We are visualizing Sales (blue) in the first chart and Quantity (green) in the second chart.
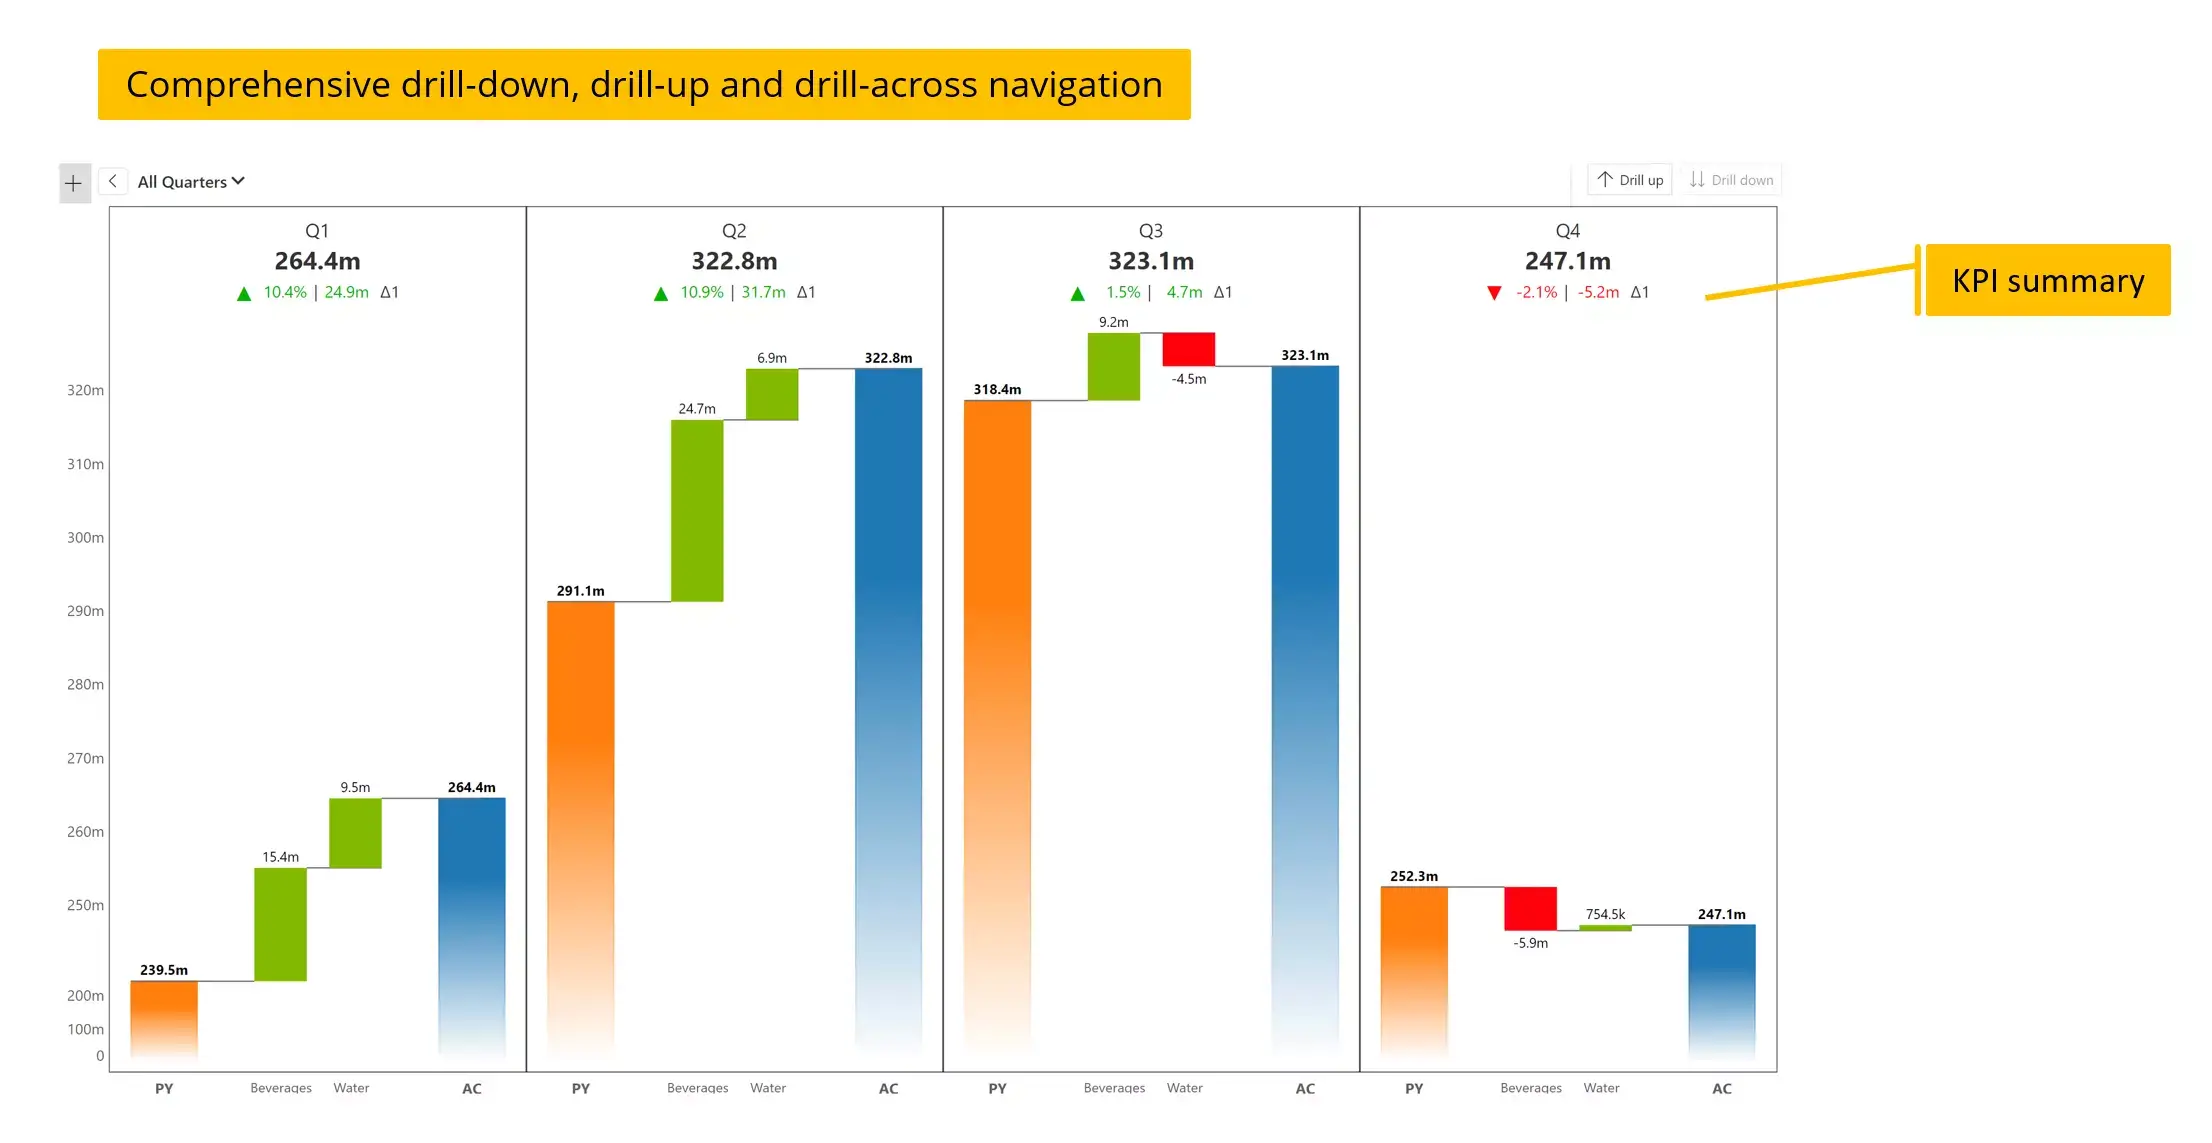
Each small multiple waterfall tile can have an integrated KPI Summary card. This KPI card will summarize the variance between actual (AC) and prior year (PY) values for each quarter, in absolute and % terms.
Q1 netted 264.4M, which is a 24.9M increase during the same quarter prior year. This is an effective increase of 10.4%.
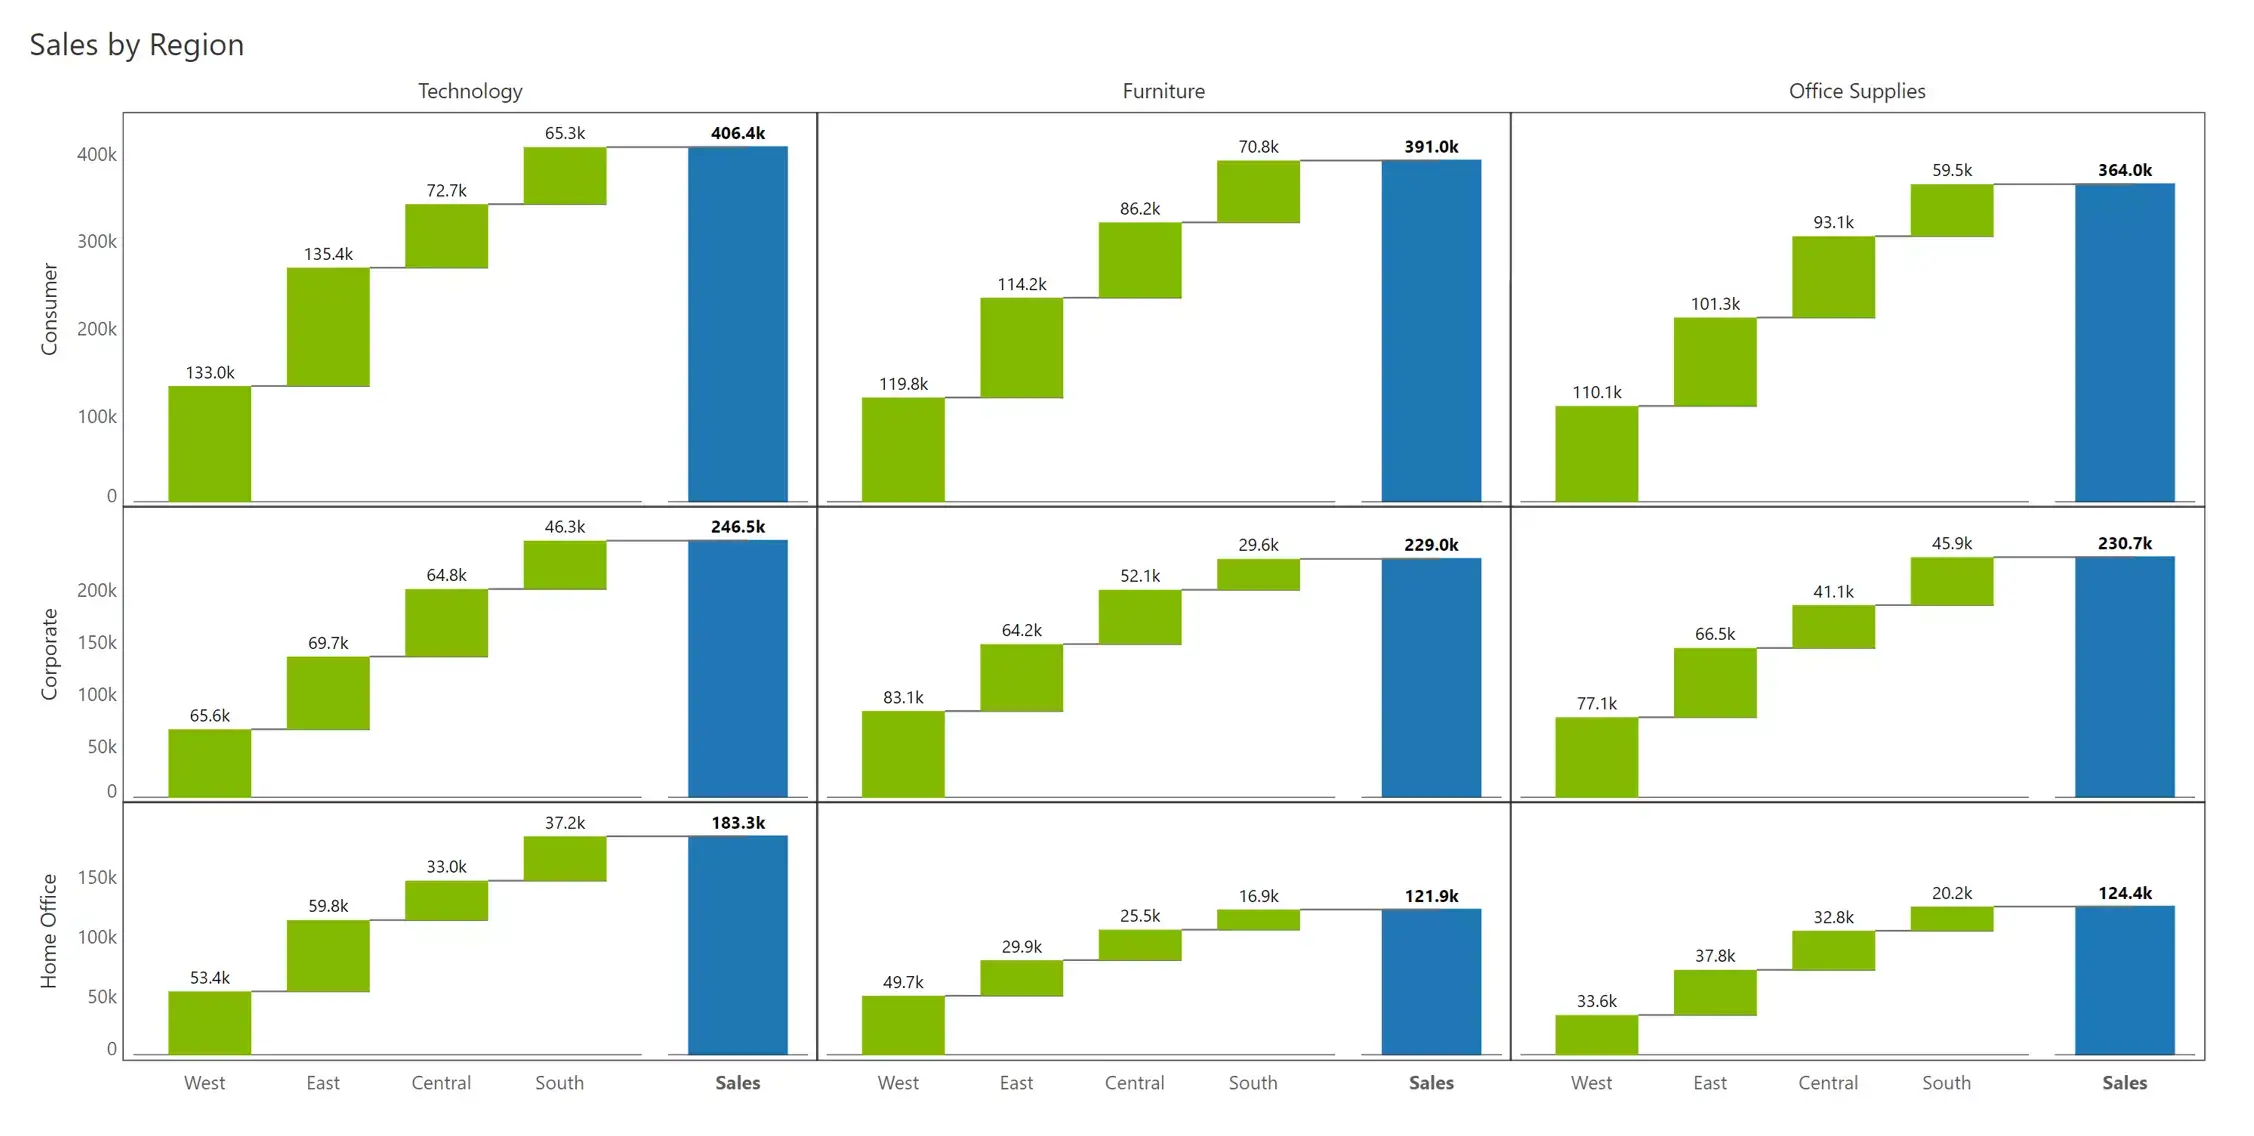
Waterfall charts become more insightful when used in small multiples with multiple dimensions.
You have the first category, Region, in the x-axis, in each of the 9 charts.
You have the product group in each column (Technology, Furniture & Office Supplies).
The segment is listed in each row (Consumer, Corporate and Home Office).
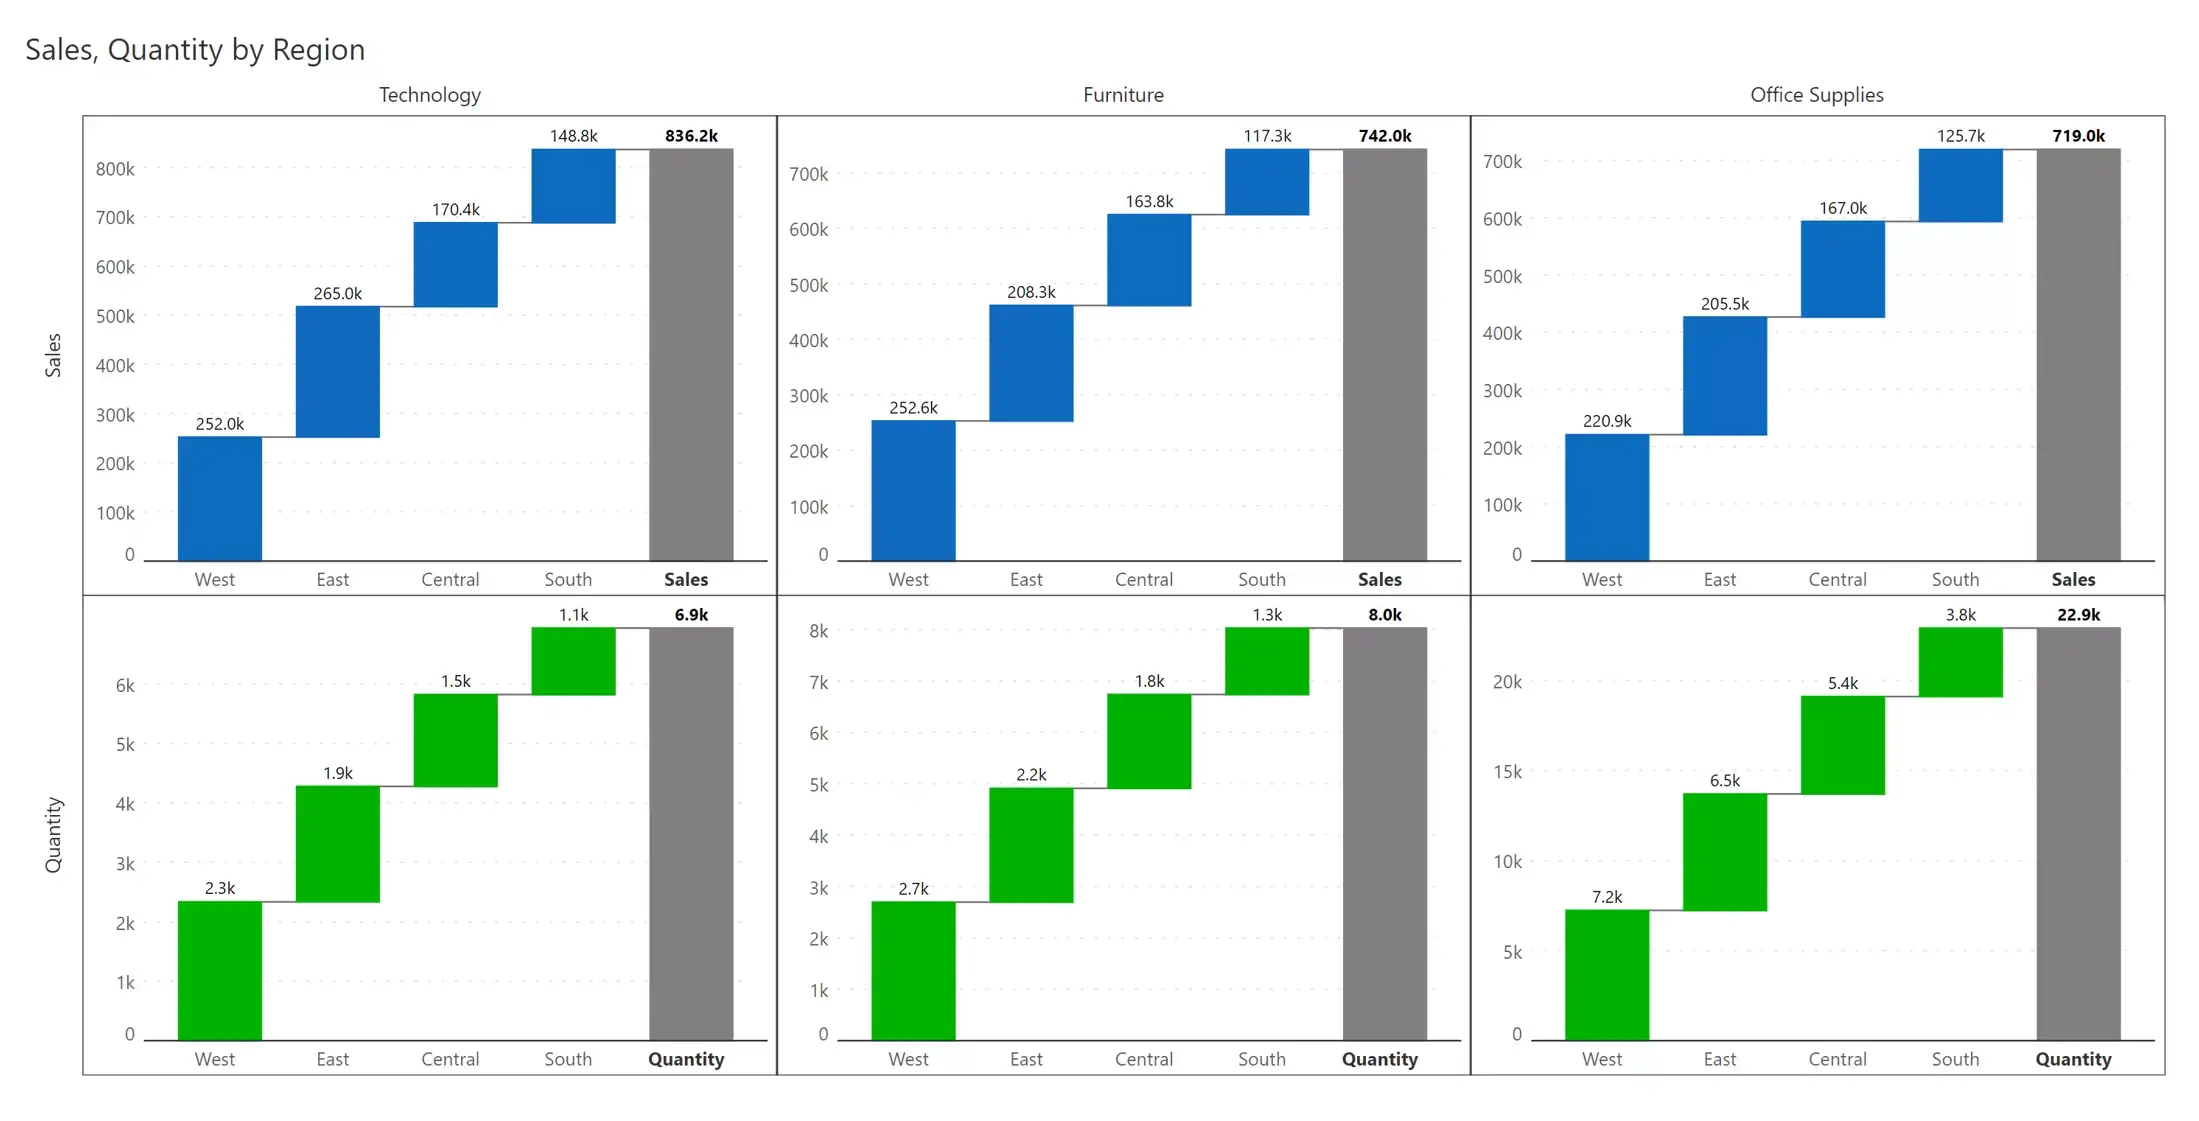
Combining examples #11 and #13, you can also deliver multi-dimensional measure-based small multiple. The chart shows sales (blue) in the first row and quantity (green) in the second row. The columns depict the three categories (technology, furniture, and office supplies).
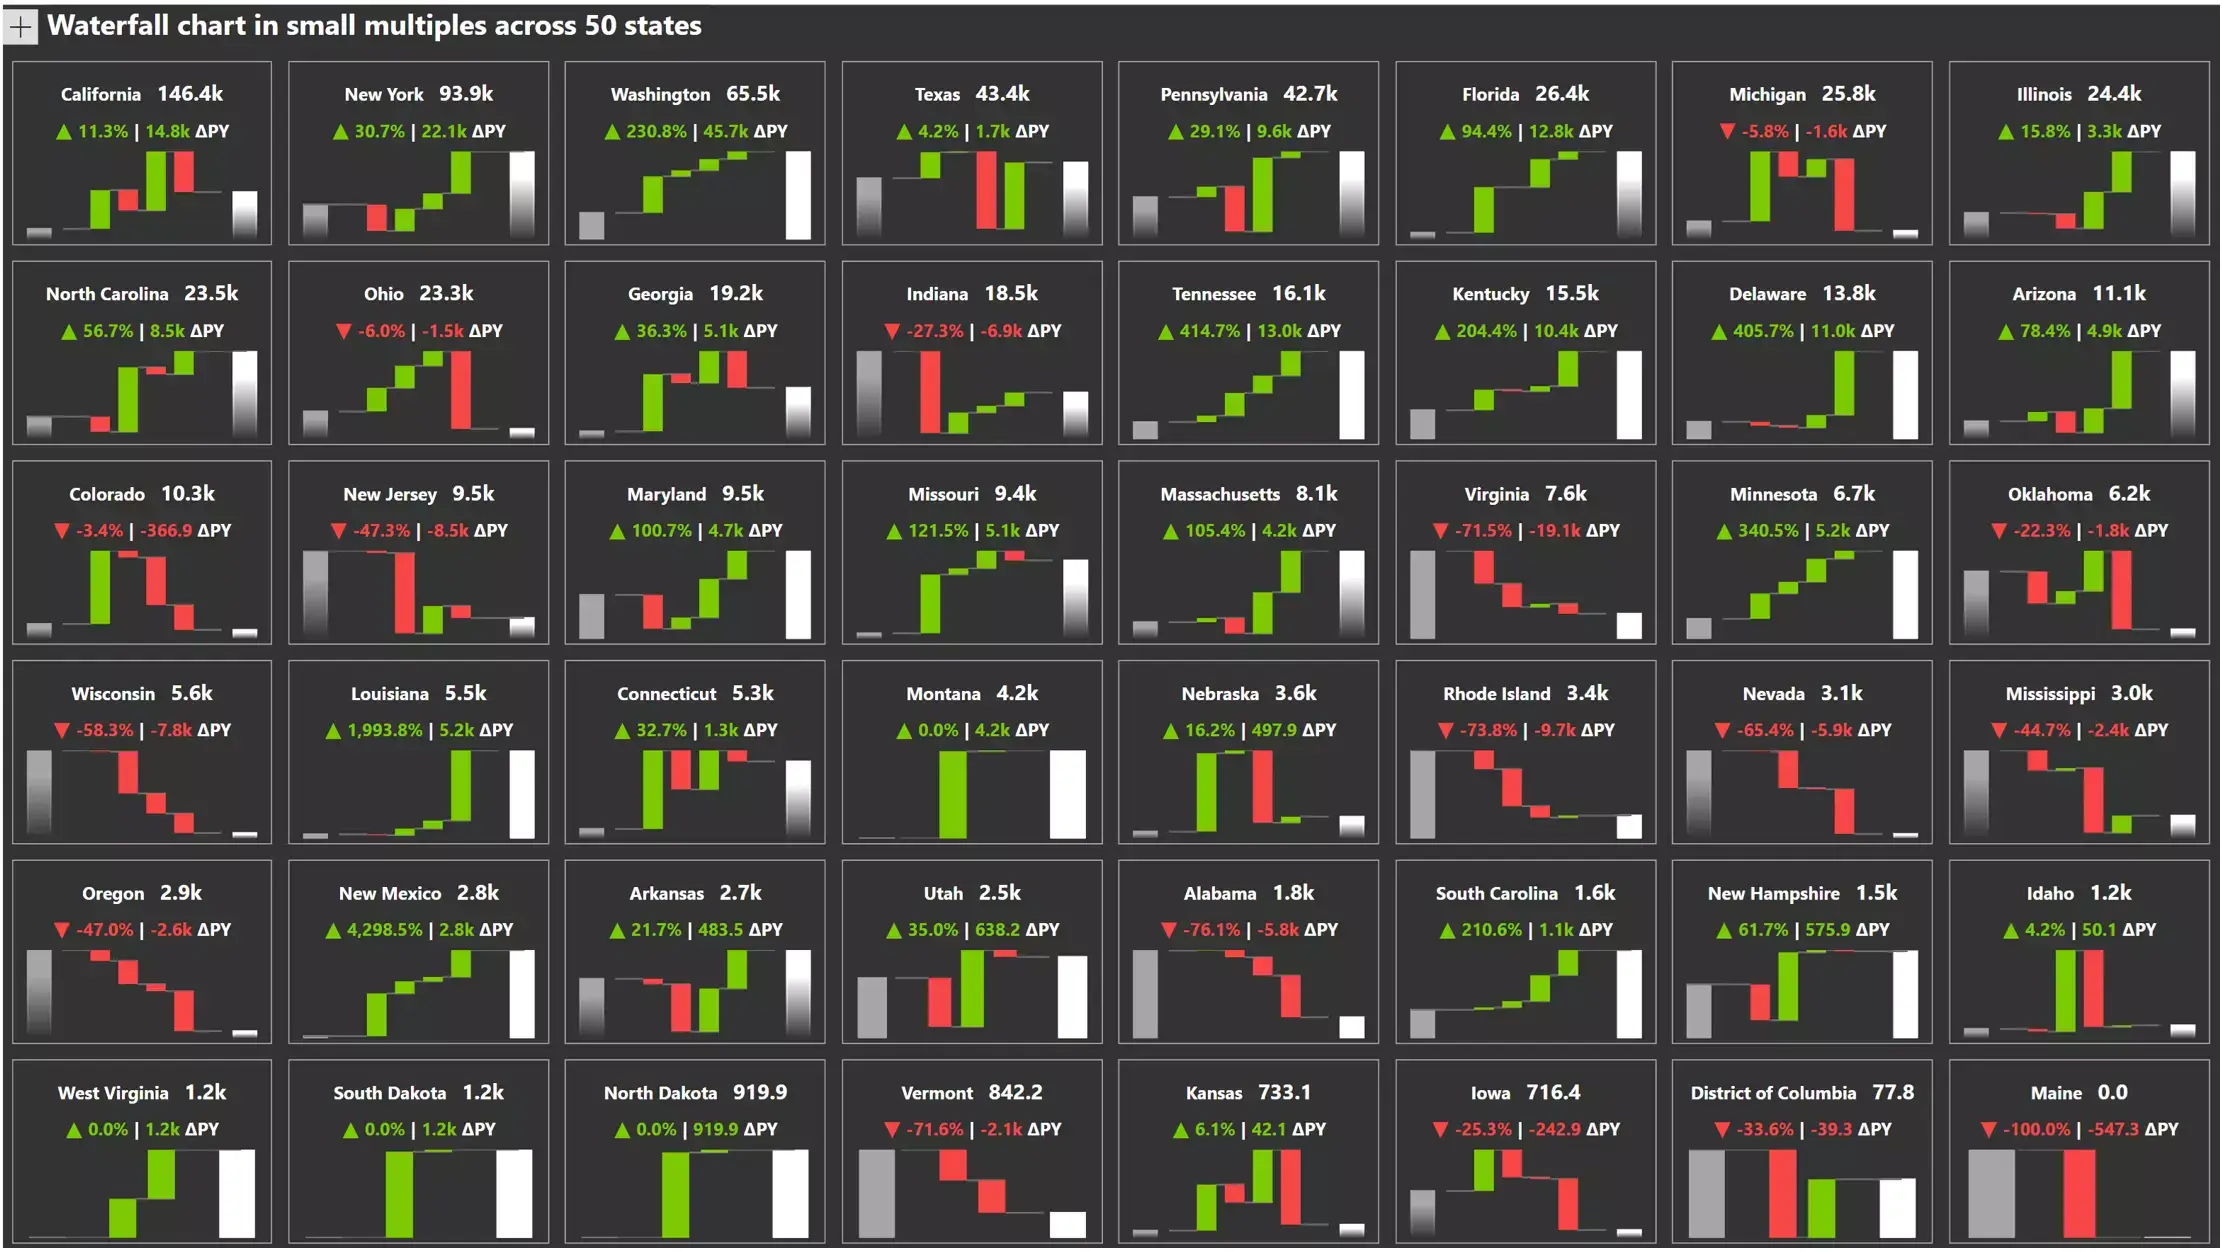
Small multiples are not just restricted to 3x3 or 4x4 matrices.
You can visualise as many rows and columns as you want. Here is an example containing 50 states and their respective KPI summaries. But such a cluttered view must be used very carefully as it sometimes occupies too much space for the insights it delivers.
Falling in Love with Waterfall Charts
Explore a world of possibilities with waterfall charts. Get the free eBook and build each chart on your own in Power BI without using scripting or DAX.

Inforiver helps enterprises consolidate planning, reporting & analytics on a single platform (Power BI). The no-code, self-service award-winning platform has been recognized as the industry’s best and is adopted by many Fortune 100 firms.
Inforiver is a product of Lumel, the #1 Power BI AppSource Partner. The firm serves over 3,000 customers worldwide through its portfolio of products offered under the brands Inforiver, EDITable, ValQ, and xViz.