
Upcoming webinar on 'Inforiver Charts : The fastest way to deliver stories in Power BI', Aug 29th , Monday, 10.30 AM CST. Register Now
Upcoming webinar on 'Inforiver Charts : The fastest way to deliver stories in Power BI', Aug 29th , Monday, 10.30 AM CST. Register Now

A snapshot is a frozen, read-only view of your report data, captured at a specific point in time. It represents the exact state of the report as it was when the snapshot was created. Snapshots are invaluable for preserving and revisiting report data in its original form for future reference.
While traditional reporting processes focus on delivering real-time insights and current performance metrics, snapshot reporting complements this by offering a historical perspective. By capturing data at key intervals, snapshots provide a comprehensive view of trends over time, enabling organizations to perform comparative analyses, track progress, and identify patterns that inform strategic decisions.
This chapter explores how reporting snapshots function in Power BI natively and highlights how Inforiver offers an efficient and effective approach for creating and managing them.
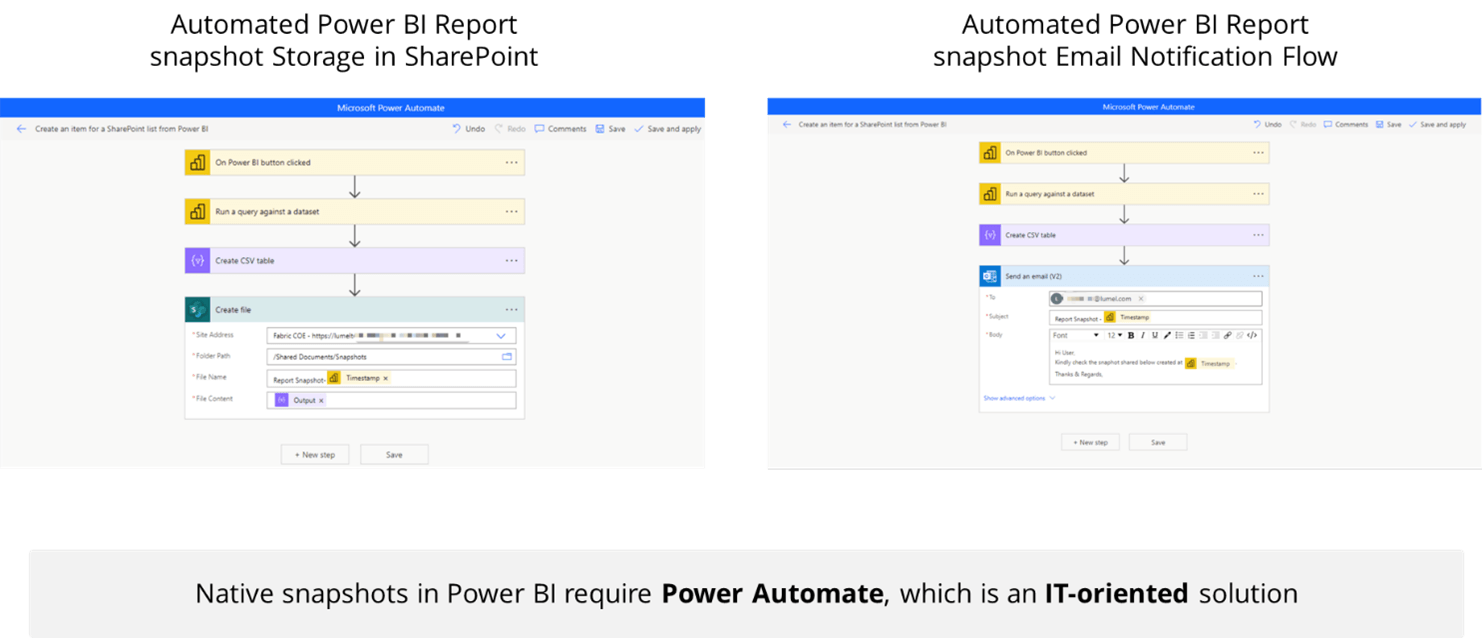
Yes, snapshots are possible natively in Power BI, but they come with a few considerations. To create snapshots in Power BI, you would need to use the “Power Automate” feature as part of the process. While Power BI doesn't currently have a built-in snapshot functionality, Power Automate allows you to schedule and capture data at specific intervals, creating a snapshot of the report or dataset.
However, this solution can quickly become IT-support intensive due to the technical nature of setting up Power Automate and the need to ensure it integrates smoothly with your Power BI reports. The process typically involves automating the export of Power BI reports to a specific file format or location (e.g., SharePoint, Email), which essentially functions as creating snapshots at predetermined times.
With Inforiver Writeback Matrix, users can take advantage of no-code automated snapshots in Power BI. Designed for casual business users, this solution offers a convenient and user-friendly way to capture data snapshots with a range of powerful features, while minimizing or eliminating the dependency on consultants and IT.
Let us explore some of these features:
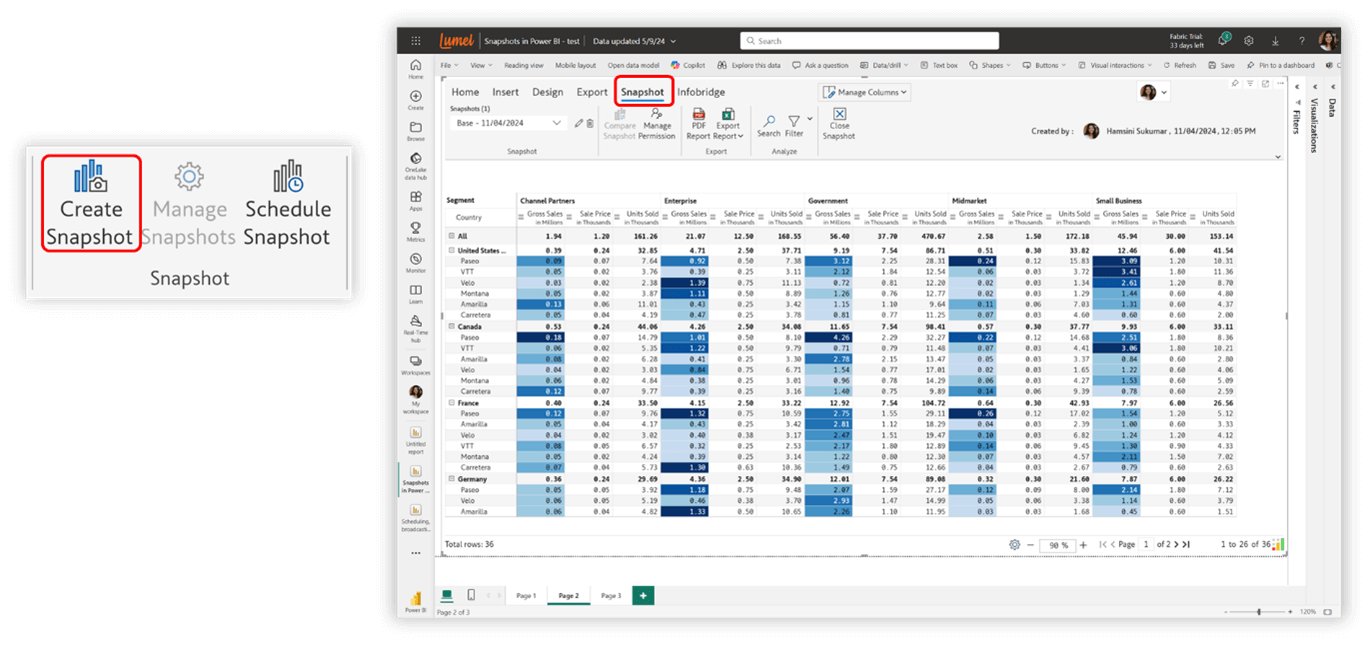
Create snapshots in a single click
One of the key features of Inforiver Writeback Matrix is the ability to create snapshots with just a single click. This no-code solution is designed with business users in mind, enabling easy snapshot creation without requiring IT involvement.
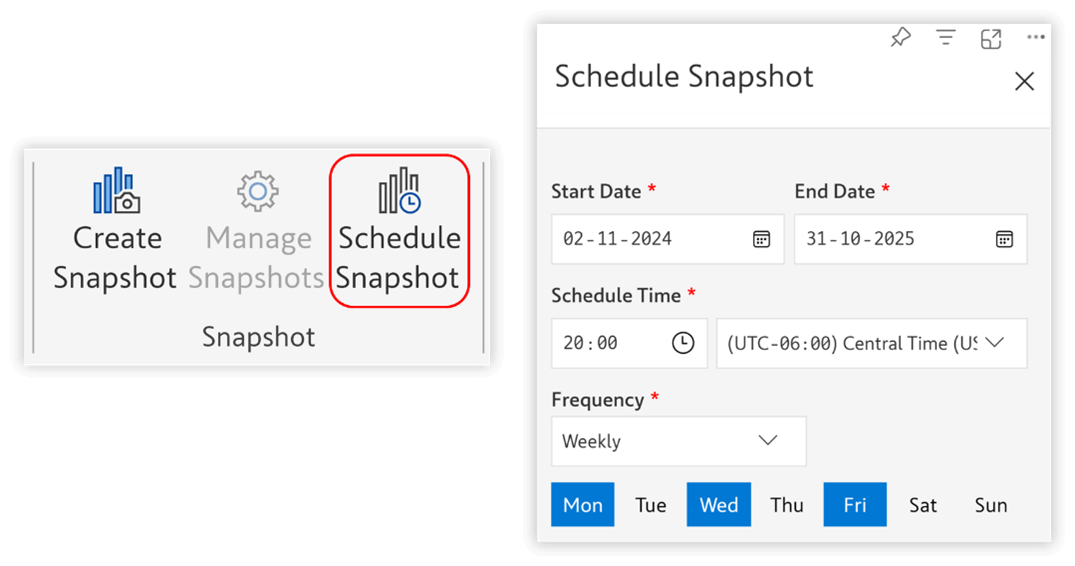
Another great feature of Inforiver Writeback Matrix is the ability to schedule snapshots at custom frequencies. Whether you need daily, weekly, or monthly snapshots, you can choose the specific days that best fit your business needs, ensuring data is captured at the optimal time.
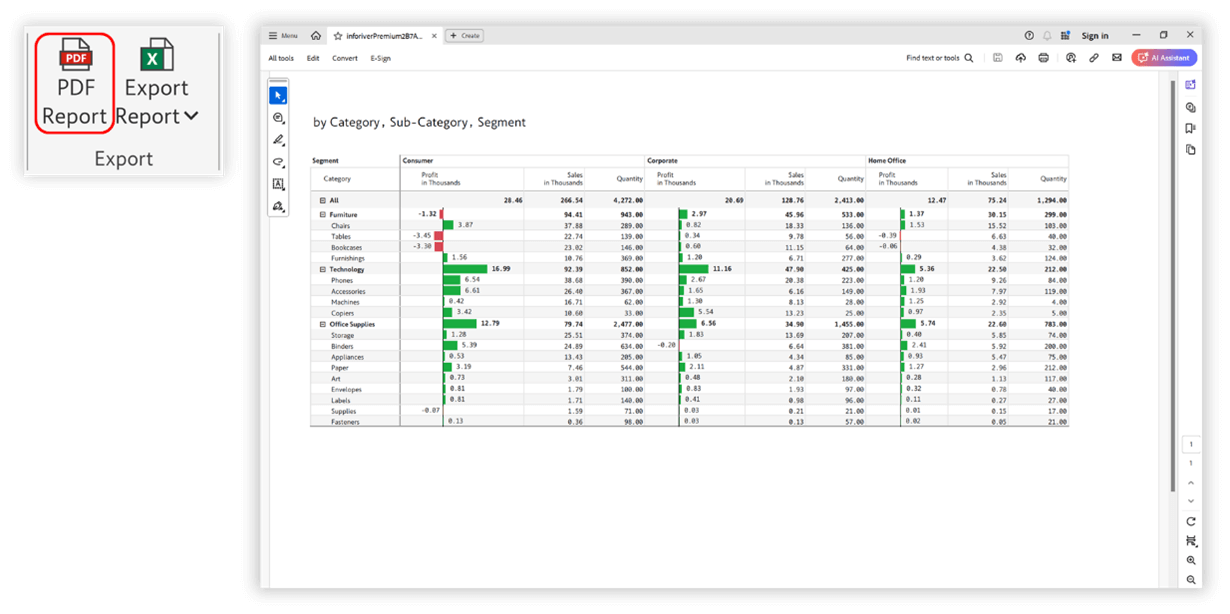
In addition to exporting snapshots to high-quality PDFs, Inforiver allows you to export snapshots to Excel. This feature provides various options for handling hierarchies, making it easy to work with your snapshots in Excel while maintaining the necessary formatting and data integrity
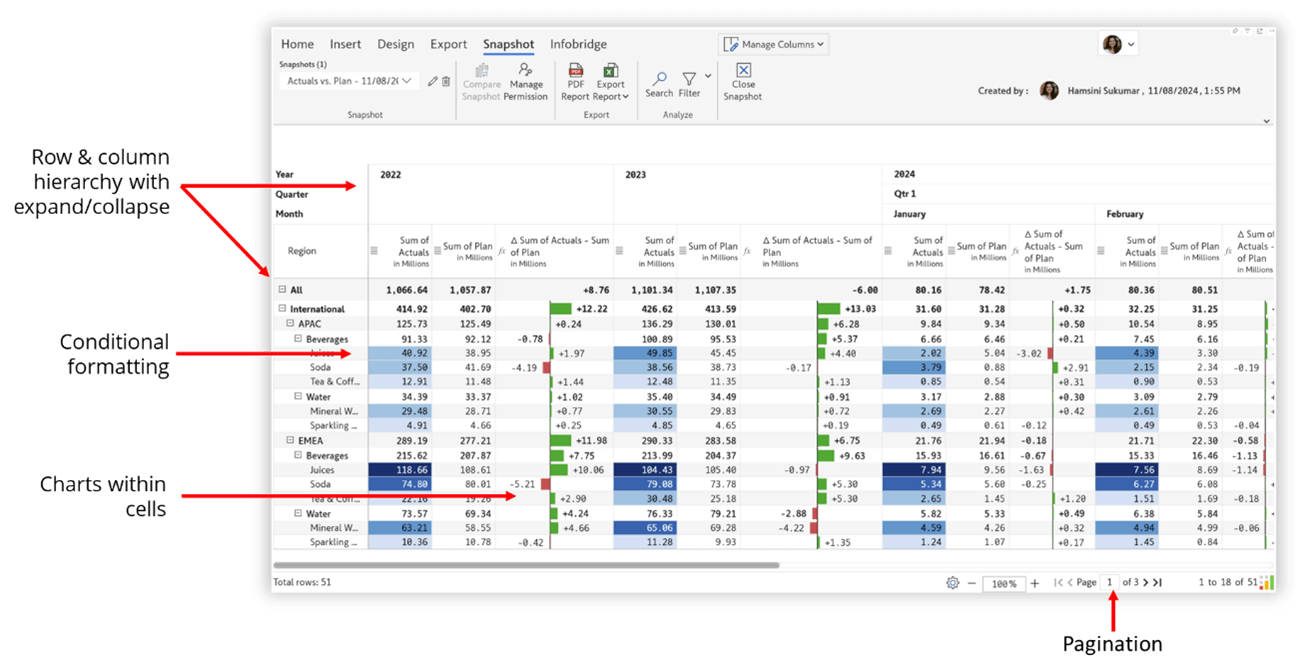
In addition to creating the snapshot, features like expandable and collapsible hierarchies, conditional formatting, and charts within cells are preserved in the snapshot.
For paginated reports, users can easily navigate between pages within the snapshot, ensuring a seamless experience when working with complex or multi-page reports.
This chapter discusses the practical steps to create easy snapshots in Power BI using Inforiver. Learn how to capture and store data snapshots in Power BI with Inforiver, enabling effective tracking and analysis over time.
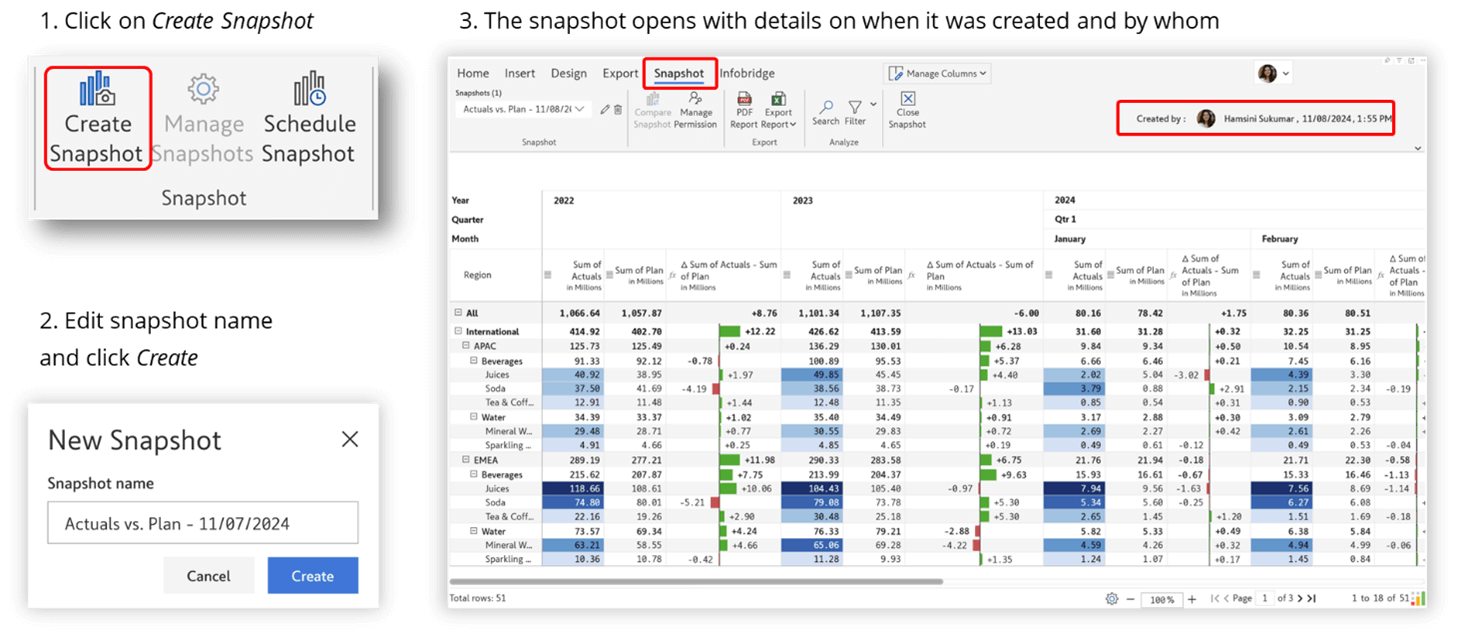
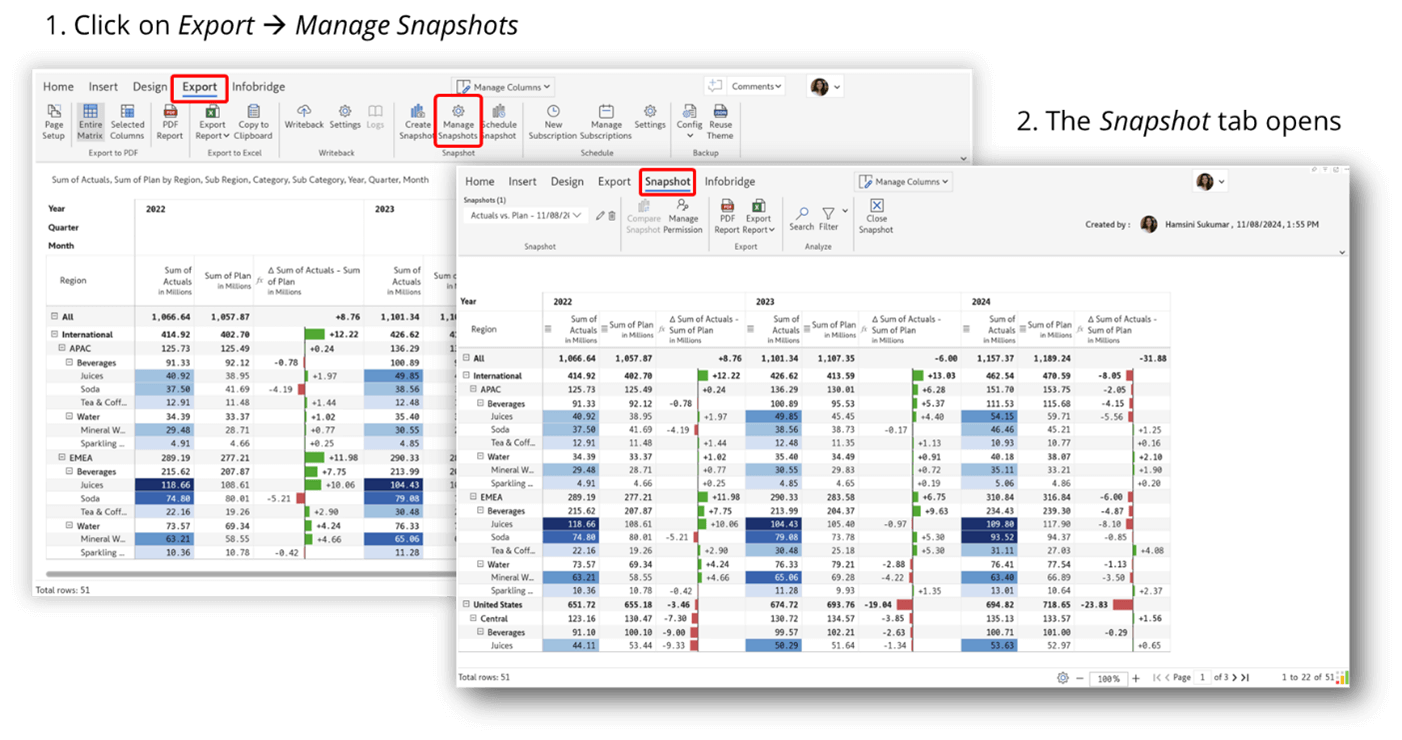
To create a snapshot, simply open your report in the Inforiver interface and navigate to the export tab. From there, click on "Create Snapshot." You can customize the snapshot name, for example, "Actual vs. Plan," and with just a click, your snapshot is ready to go.
As soon a snapshot is created, the snapshot tab opens, displaying all the details and features of the snapshot just created.
The snapshot also displays the creator's name, along with the date and time when it was created, providing clear context and traceability for the snapshot's origin.
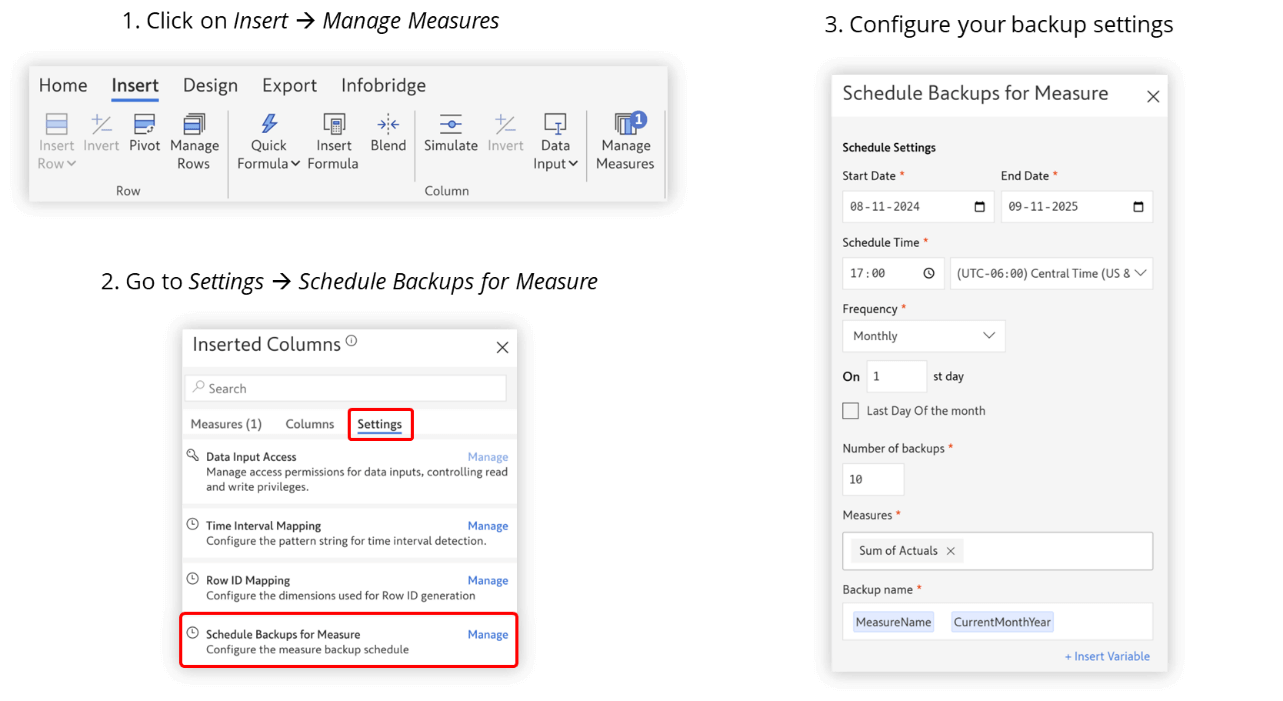
Individual measures can also be captured using snapshots in Inforiver, allowing them to be brought into the report as columns that can be used for calculations. To create snapshots of individual measures, follow these steps:
Within the scheduled settings, users can configure the frequency of backups and select specific measures to include (Actual values in the image below). This flexibility ensures that snapshots capture the necessary data for effective analysis.
To schedule snapshots at custom frequencies, follow these steps:
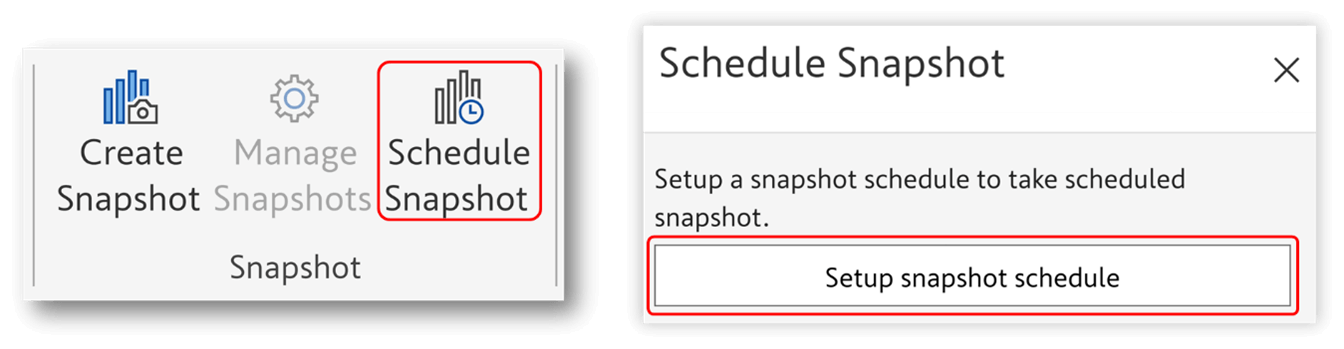
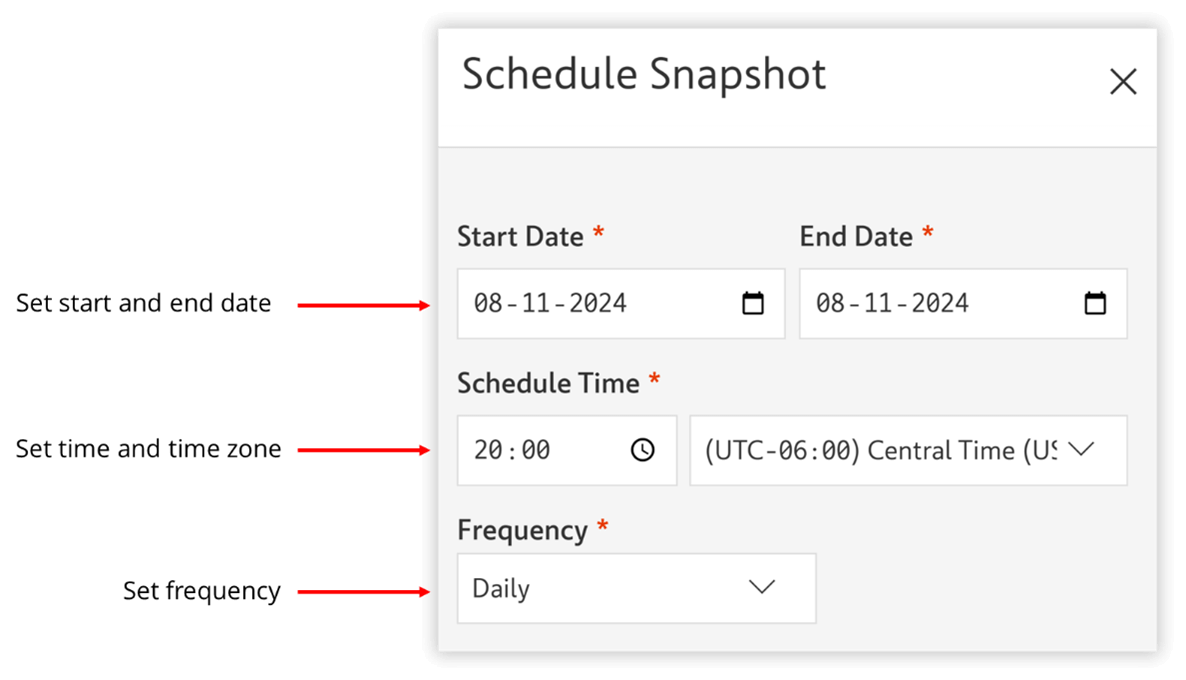
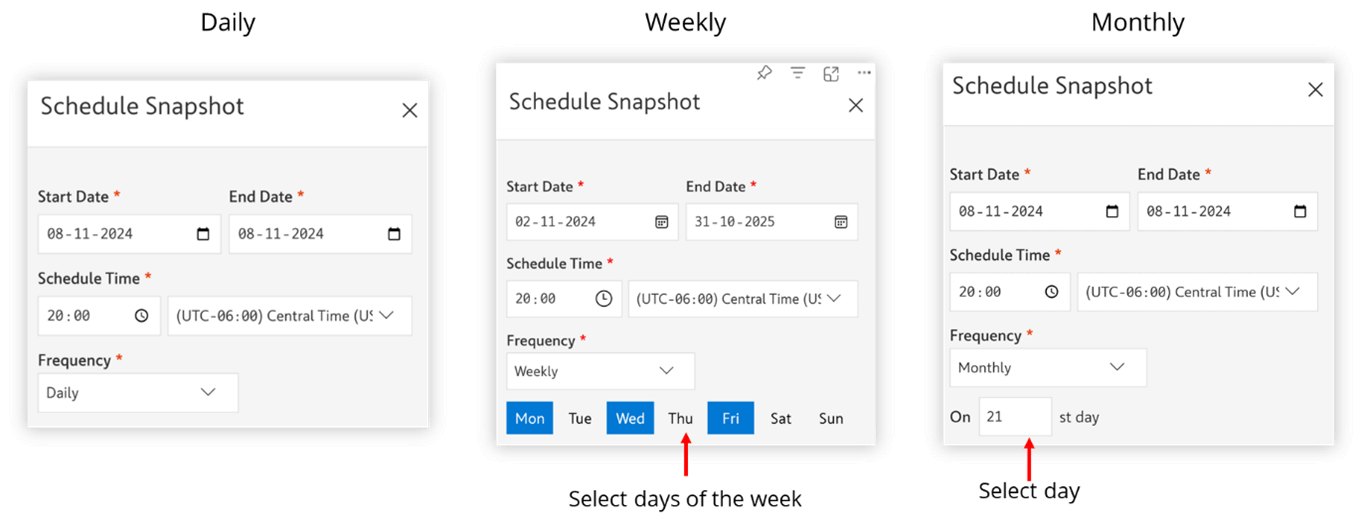
When setting up a snapshot schedule, users can choose from three frequency options:
These options enable users to customize how frequently snapshots are created, depending on their reporting needs.
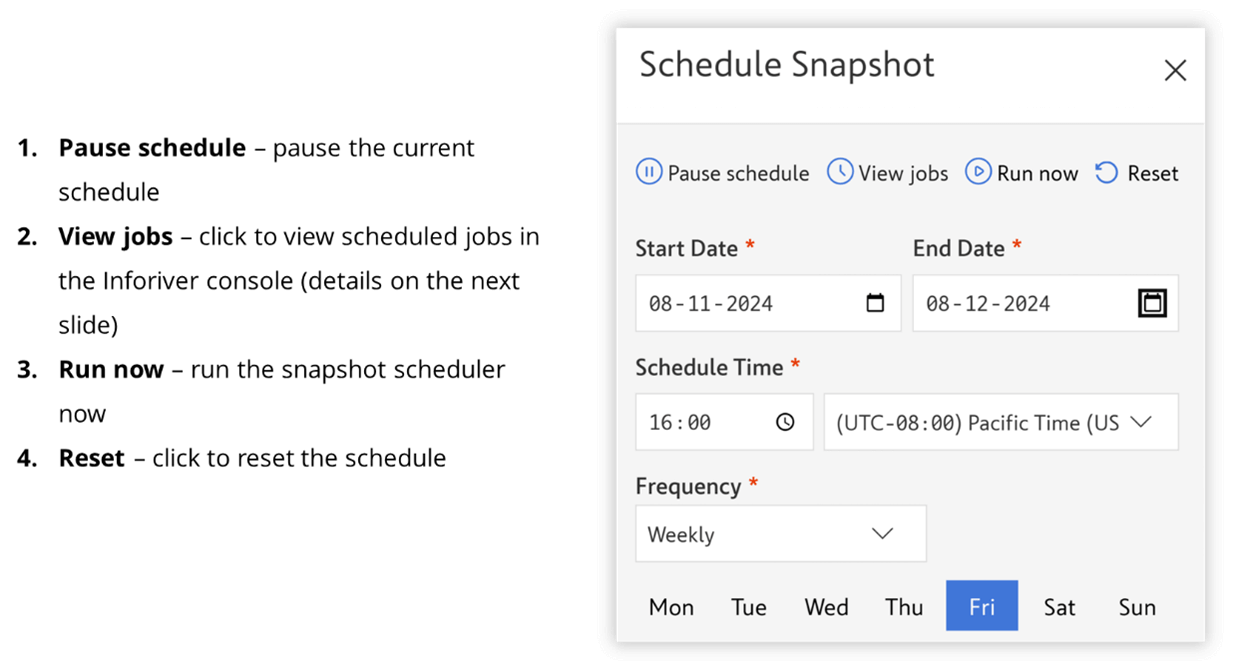
Once the snapshot schedule is set up, users have several options for managing the schedule:
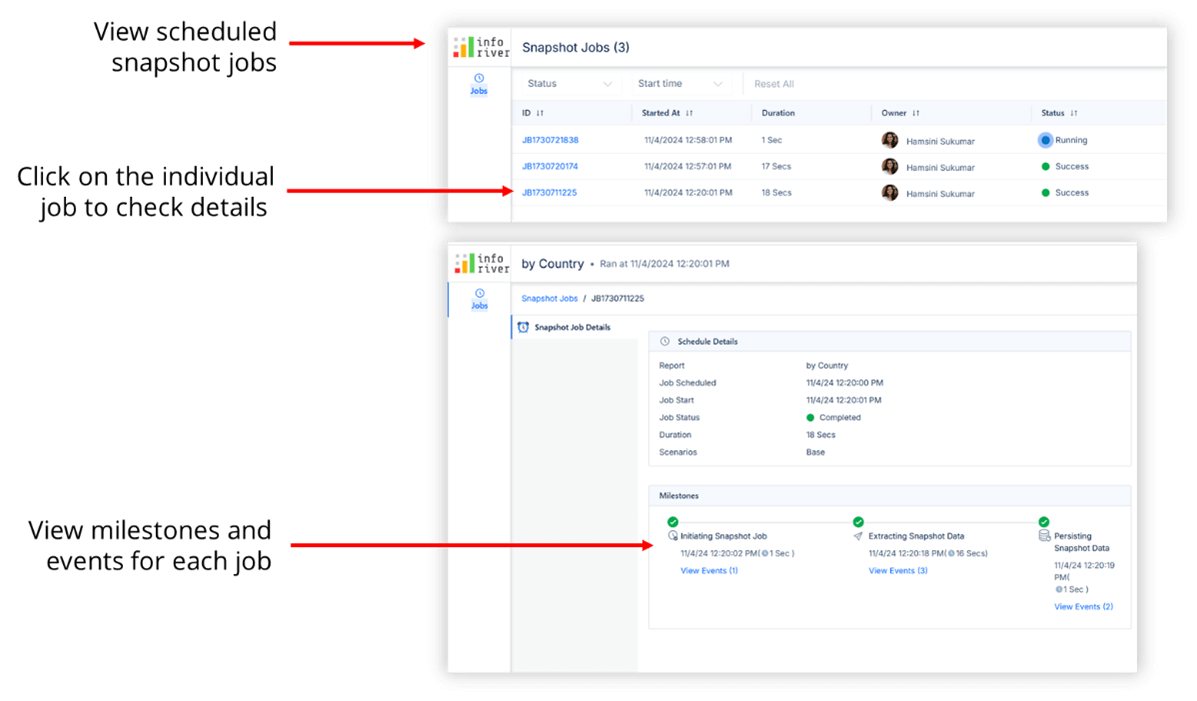
After clicking on View Jobs, users will be redirected to the Inforiver Console, where they can track all their scheduled snapshot jobs. The console provides the following features:
In this chapter, you will learn how to organize and maintain the snapshots you have created. The Manage Snapshots feature in Inforiver provides robust options to view, compare, edit, or delete snapshots as needed. Users can easily compare snapshots to identify trends or variances over time, providing valuable insights for performance tracking and decision-making. Additionally, you can rename snapshots for better organization and export them for sharing or offline analysis.
To manage snapshots, users can access the Manage Snapshot button in the Export tab of the Inforiver toolbar. Here’s how it works:
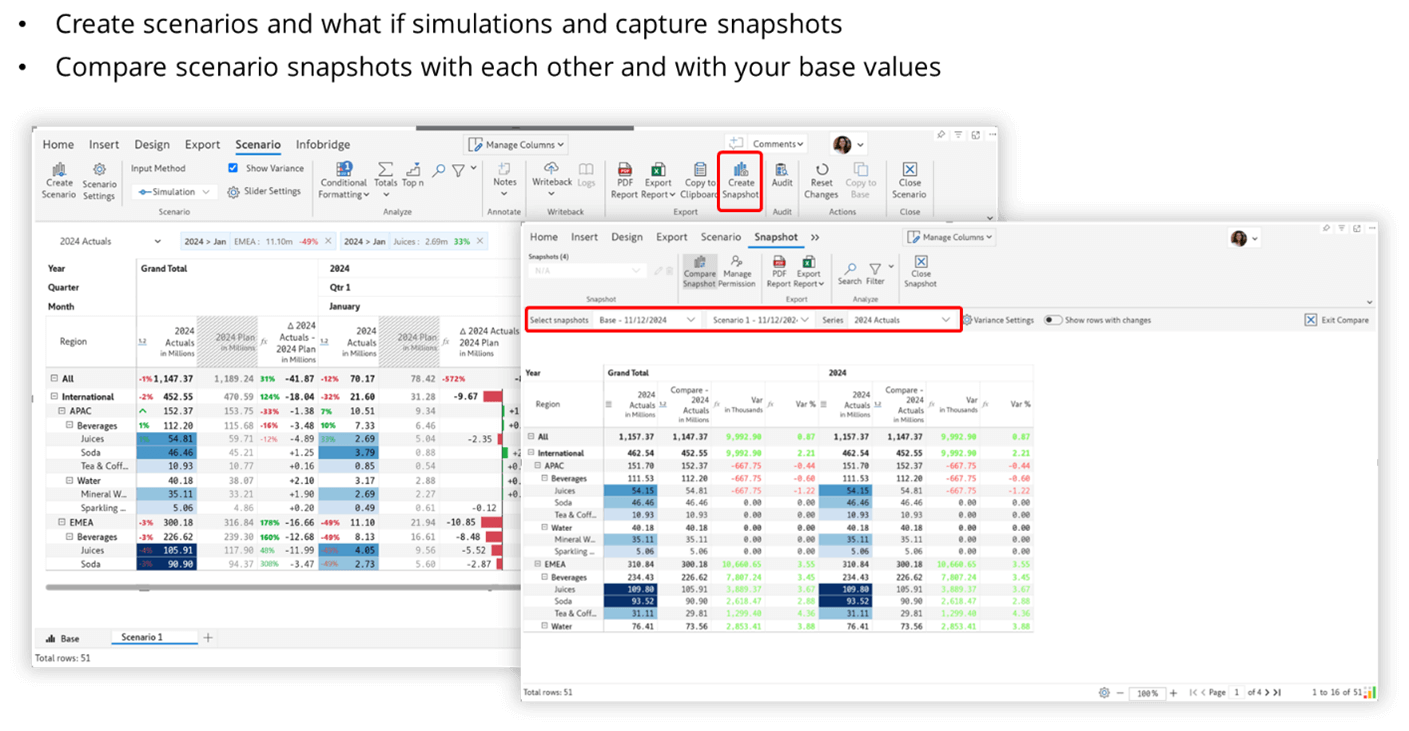
Snapshots enable powerful scenario creation and what-if analysis directly within Power BI. By leveraging snapshot data, you can simulate outcomes, adjust values, and propagate changes across hierarchies. This makes snapshots an effective tool for exploring alternate business scenarios, comparing them with historical data, and making informed, data-driven decisions.
After creating the scenario, you can capture a snapshot of it. You can also create a snapshot of the base values to compare against the scenario or even compare different scenarios with each other. For example, you can create one snapshot for a "best-case" scenario and another for a "worst-case" scenario and then compare them side by side.
The "show rows with changes" toggle helps you view only the rows where changes occurred, making it easy to analyze the differences between scenarios and base values.
Snapshot reporting in Power BI is a powerful tool for capturing, comparing, and analyzing data over time, offering businesses valuable insights into trends, performance, and variances. By taking periodic snapshots of key metrics and scenarios, users can easily compare historical data with live, real-time information, facilitating better decision-making and forecasting.
With Inforiver, the ability to create, manage, and customize snapshots is faster, easier, and more efficient. Features such as advanced variance analysis, scenario modeling, and easy comparison of multiple snapshots provide greater flexibility and accuracy in reporting. These capabilities empower users to track actuals versus targets, conduct detailed what-if analyses and quickly assess the impact of changes.
Ultimately, mastering snapshot reporting in Power BI, especially with Inforiver's added features, helps businesses improve transparency, streamline reporting processes, and achieve a deeper understanding of their data, driving more informed and strategic business decisions.
Explore our webinar, "Snapshot reporting in Power BI - What, Why & How?’ here.
A snapshot is a frozen, read-only view of your report data, captured at a specific point in time. It represents the exact state of the report as it was when the snapshot was created. Snapshots are invaluable for preserving and revisiting report data in its original form for future reference.
While traditional reporting processes focus on delivering real-time insights and current performance metrics, snapshot reporting complements this by offering a historical perspective. By capturing data at key intervals, snapshots provide a comprehensive view of trends over time, enabling organizations to perform comparative analyses, track progress, and identify patterns that inform strategic decisions.
This chapter explores how reporting snapshots function in Power BI natively and highlights how Inforiver offers an efficient and effective approach for creating and managing them.
Yes, snapshots are possible natively in Power BI, but they come with a few considerations. To create snapshots in Power BI, you would need to use the “Power Automate” feature as part of the process. While Power BI doesn't currently have a built-in snapshot functionality, Power Automate allows you to schedule and capture data at specific intervals, creating a snapshot of the report or dataset.
However, this solution can quickly become IT-support intensive due to the technical nature of setting up Power Automate and the need to ensure it integrates smoothly with your Power BI reports. The process typically involves automating the export of Power BI reports to a specific file format or location (e.g., SharePoint, Email), which essentially functions as creating snapshots at predetermined times.
With Inforiver Writeback Matrix, users can take advantage of no-code automated snapshots in Power BI. Designed for casual business users, this solution offers a convenient and user-friendly way to capture data snapshots with a range of powerful features, while minimizing or eliminating the dependency on consultants and IT.
Let us explore some of these features:
Create snapshots in a single click
One of the key features of Inforiver Writeback Matrix is the ability to create snapshots with just a single click. This no-code solution is designed with business users in mind, enabling easy snapshot creation without requiring IT involvement.
Another great feature of Inforiver Writeback Matrix is the ability to schedule snapshots at custom frequencies. Whether you need daily, weekly, or monthly snapshots, you can choose the specific days that best fit your business needs, ensuring data is captured at the optimal time.
In addition to exporting snapshots to high-quality PDFs, Inforiver allows you to export snapshots to Excel. This feature provides various options for handling hierarchies, making it easy to work with your snapshots in Excel while maintaining the necessary formatting and data integrity
In addition to creating the snapshot, features like expandable and collapsible hierarchies, conditional formatting, and charts within cells are preserved in the snapshot.
For paginated reports, users can easily navigate between pages within the snapshot, ensuring a seamless experience when working with complex or multi-page reports.
This chapter discusses the practical steps to create easy snapshots in Power BI using Inforiver. Learn how to capture and store data snapshots in Power BI with Inforiver, enabling effective tracking and analysis over time.
To create a snapshot, simply open your report in the Inforiver interface and navigate to the export tab. From there, click on "Create Snapshot." You can customize the snapshot name, for example, "Actual vs. Plan," and with just a click, your snapshot is ready to go.
As soon a snapshot is created, the snapshot tab opens, displaying all the details and features of the snapshot just created.
The snapshot also displays the creator's name, along with the date and time when it was created, providing clear context and traceability for the snapshot's origin.
Individual measures can also be captured using snapshots in Inforiver, allowing them to be brought into the report as columns that can be used for calculations. To create snapshots of individual measures, follow these steps:
Within the scheduled settings, users can configure the frequency of backups and select specific measures to include (Actual values in the image below). This flexibility ensures that snapshots capture the necessary data for effective analysis.
To schedule snapshots at custom frequencies, follow these steps:
When setting up a snapshot schedule, users can choose from three frequency options:
These options enable users to customize how frequently snapshots are created, depending on their reporting needs.
Once the snapshot schedule is set up, users have several options for managing the schedule:
After clicking on View Jobs, users will be redirected to the Inforiver Console, where they can track all their scheduled snapshot jobs. The console provides the following features:
In this chapter, you will learn how to organize and maintain the snapshots you have created. The Manage Snapshots feature in Inforiver provides robust options to view, compare, edit, or delete snapshots as needed. Users can easily compare snapshots to identify trends or variances over time, providing valuable insights for performance tracking and decision-making. Additionally, you can rename snapshots for better organization and export them for sharing or offline analysis.
To manage snapshots, users can access the Manage Snapshot button in the Export tab of the Inforiver toolbar. Here’s how it works:
Snapshots enable powerful scenario creation and what-if analysis directly within Power BI. By leveraging snapshot data, you can simulate outcomes, adjust values, and propagate changes across hierarchies. This makes snapshots an effective tool for exploring alternate business scenarios, comparing them with historical data, and making informed, data-driven decisions.
After creating the scenario, you can capture a snapshot of it. You can also create a snapshot of the base values to compare against the scenario or even compare different scenarios with each other. For example, you can create one snapshot for a "best-case" scenario and another for a "worst-case" scenario and then compare them side by side.
The "show rows with changes" toggle helps you view only the rows where changes occurred, making it easy to analyze the differences between scenarios and base values.
Snapshot reporting in Power BI is a powerful tool for capturing, comparing, and analyzing data over time, offering businesses valuable insights into trends, performance, and variances. By taking periodic snapshots of key metrics and scenarios, users can easily compare historical data with live, real-time information, facilitating better decision-making and forecasting.
With Inforiver, the ability to create, manage, and customize snapshots is faster, easier, and more efficient. Features such as advanced variance analysis, scenario modeling, and easy comparison of multiple snapshots provide greater flexibility and accuracy in reporting. These capabilities empower users to track actuals versus targets, conduct detailed what-if analyses and quickly assess the impact of changes.
Ultimately, mastering snapshot reporting in Power BI, especially with Inforiver's added features, helps businesses improve transparency, streamline reporting processes, and achieve a deeper understanding of their data, driving more informed and strategic business decisions.
Explore our webinar, "Snapshot reporting in Power BI - What, Why & How?’ here.

Inforiver helps enterprises consolidate planning, reporting & analytics on a single platform (Power BI). The no-code, self-service award-winning platform has been recognized as the industry’s best and is adopted by many Fortune 100 firms.
Inforiver is a product of Lumel, the #1 Power BI AppSource Partner. The firm serves over 3,000 customers worldwide through its portfolio of products offered under the brands Inforiver, EDITable, ValQ, and xViz.