Upcoming webinar on 'Inforiver Charts : The fastest way to deliver stories in Power BI', Aug 29th , Monday, 10.30 AM CST. Register Now
Upcoming webinar on 'Inforiver Charts : The fastest way to deliver stories in Power BI', Aug 29th , Monday, 10.30 AM CST. Register Now
Box plots are a type of statistical chart that provides valuable insights into the distribution of data. They are particularly useful for displaying the spread of data, identifying outliers, and understanding the underlying patterns in the data.
Box plots are characterized by their four-part structure: the box, the median line, the whiskers, and the outliers. The box represents the middle 50% of the data, while the median line divides the datapoints into two equal-size groups. The whiskers extend from the box to the minimum and maximum values, showing the range of values that fall within 1.5 times the interquartile range (IQR) of the data. Outliers are plotted separately, usually as individual points or small circles, to emphasize their extreme values.
Feel free to explore the sections that interest you:
A box plot, also known as a box-and-whisker plot, is a graphical representation that summarizes the distribution of a dataset. At its core, it showcases a central value (the median), spread (interquartile range), and overall range (from minimum to maximum values) of the data. It also highlights outliers, offering a clear picture of data variability and symmetry.
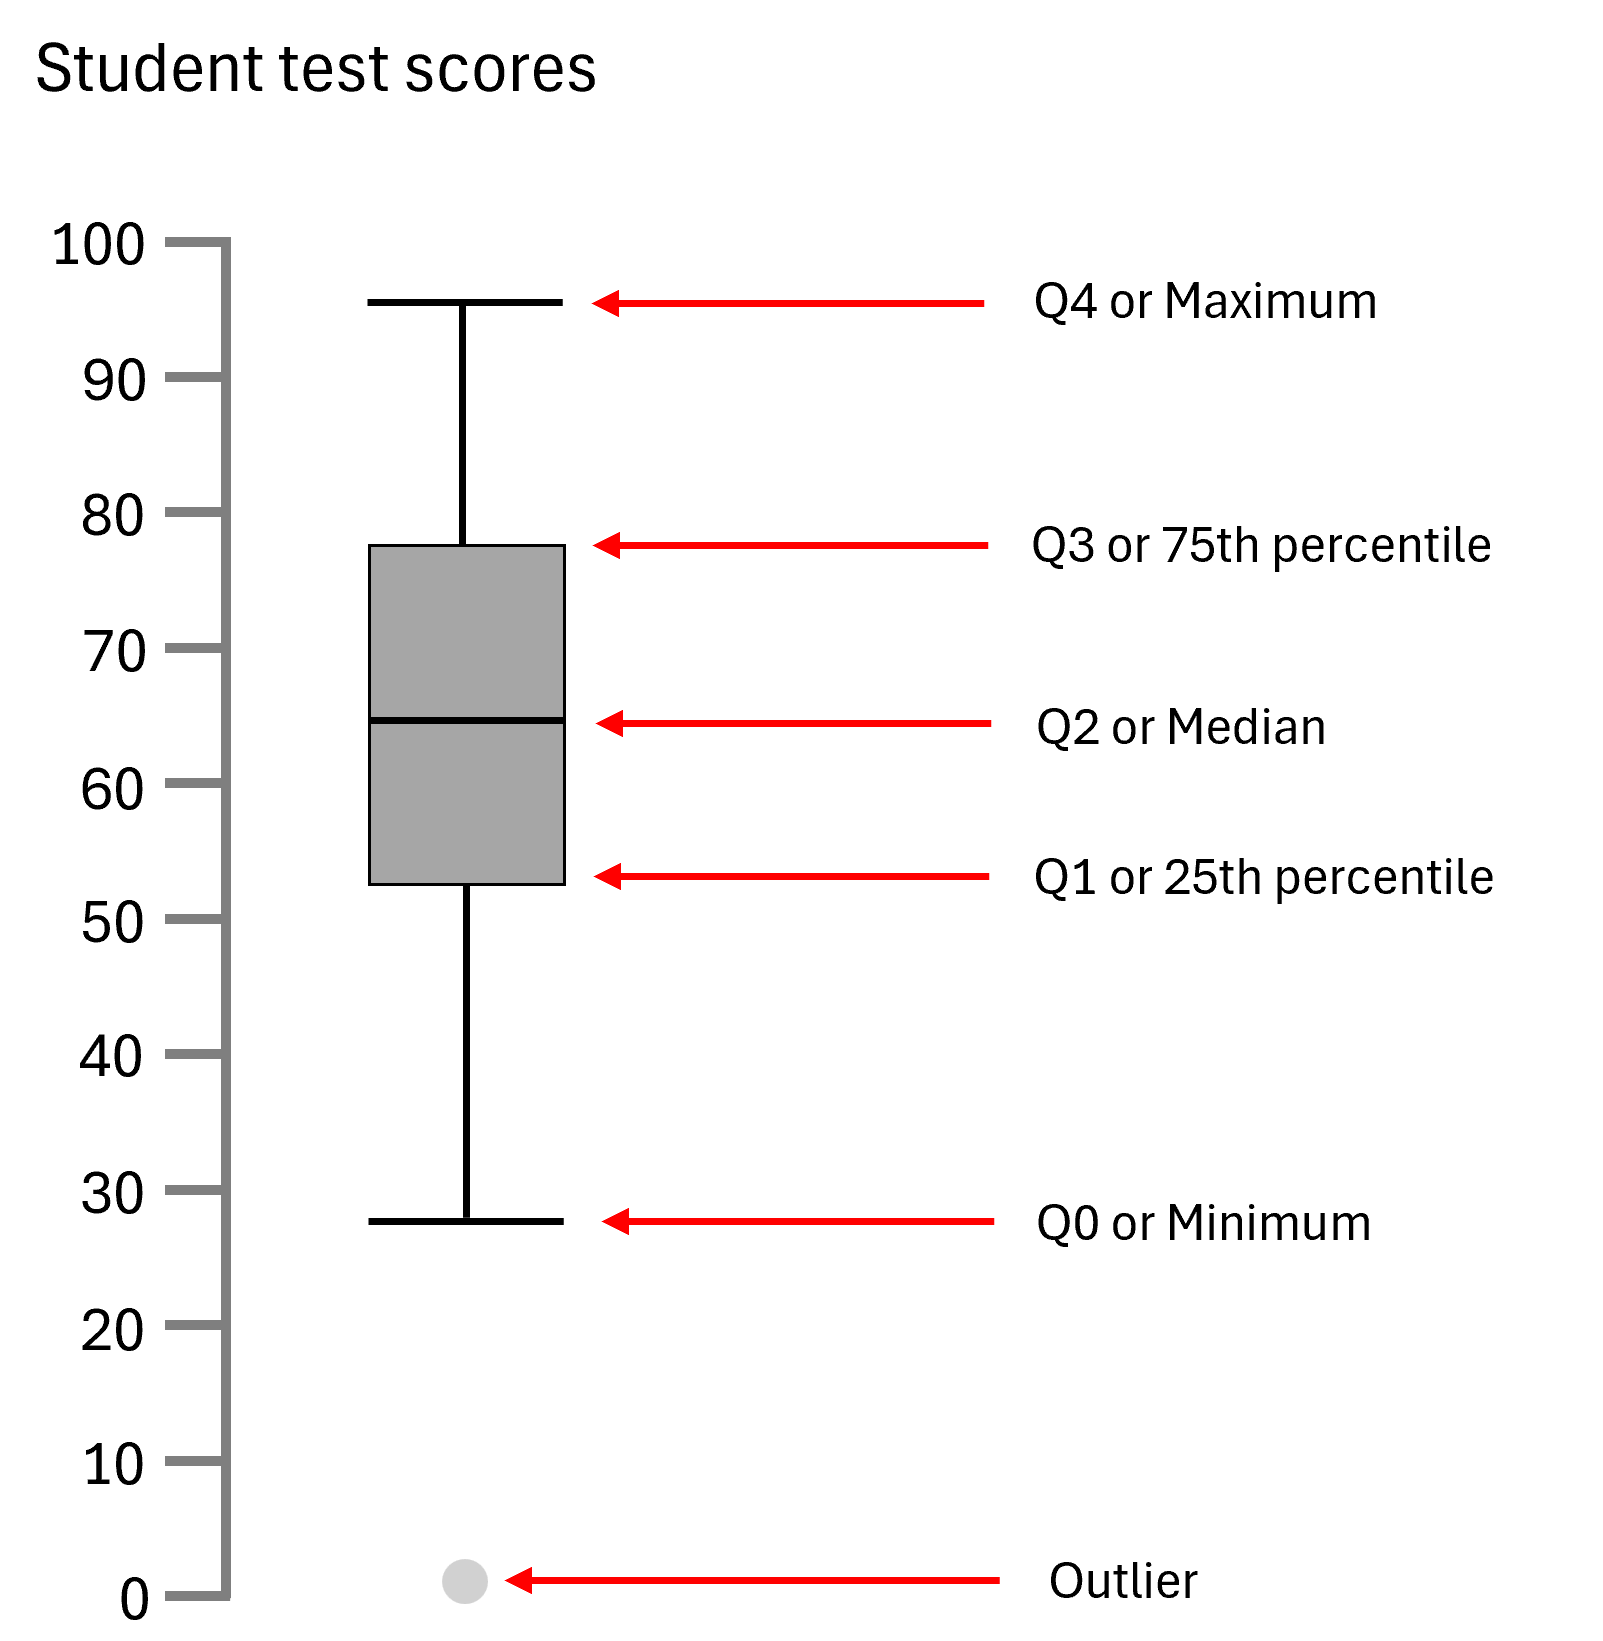
This visualization tool stands out for its efficiency in displaying a dataset's key characteristics through a simple, uncluttered format.
A box plot divides the data into quartiles, with the "box" depicting the middle two quartiles around the median, and "whiskers" extending to show the range or variability of the data. Outliers are typically marked as individual points outside the whiskers, providing immediate insight into the data's distribution nuances.
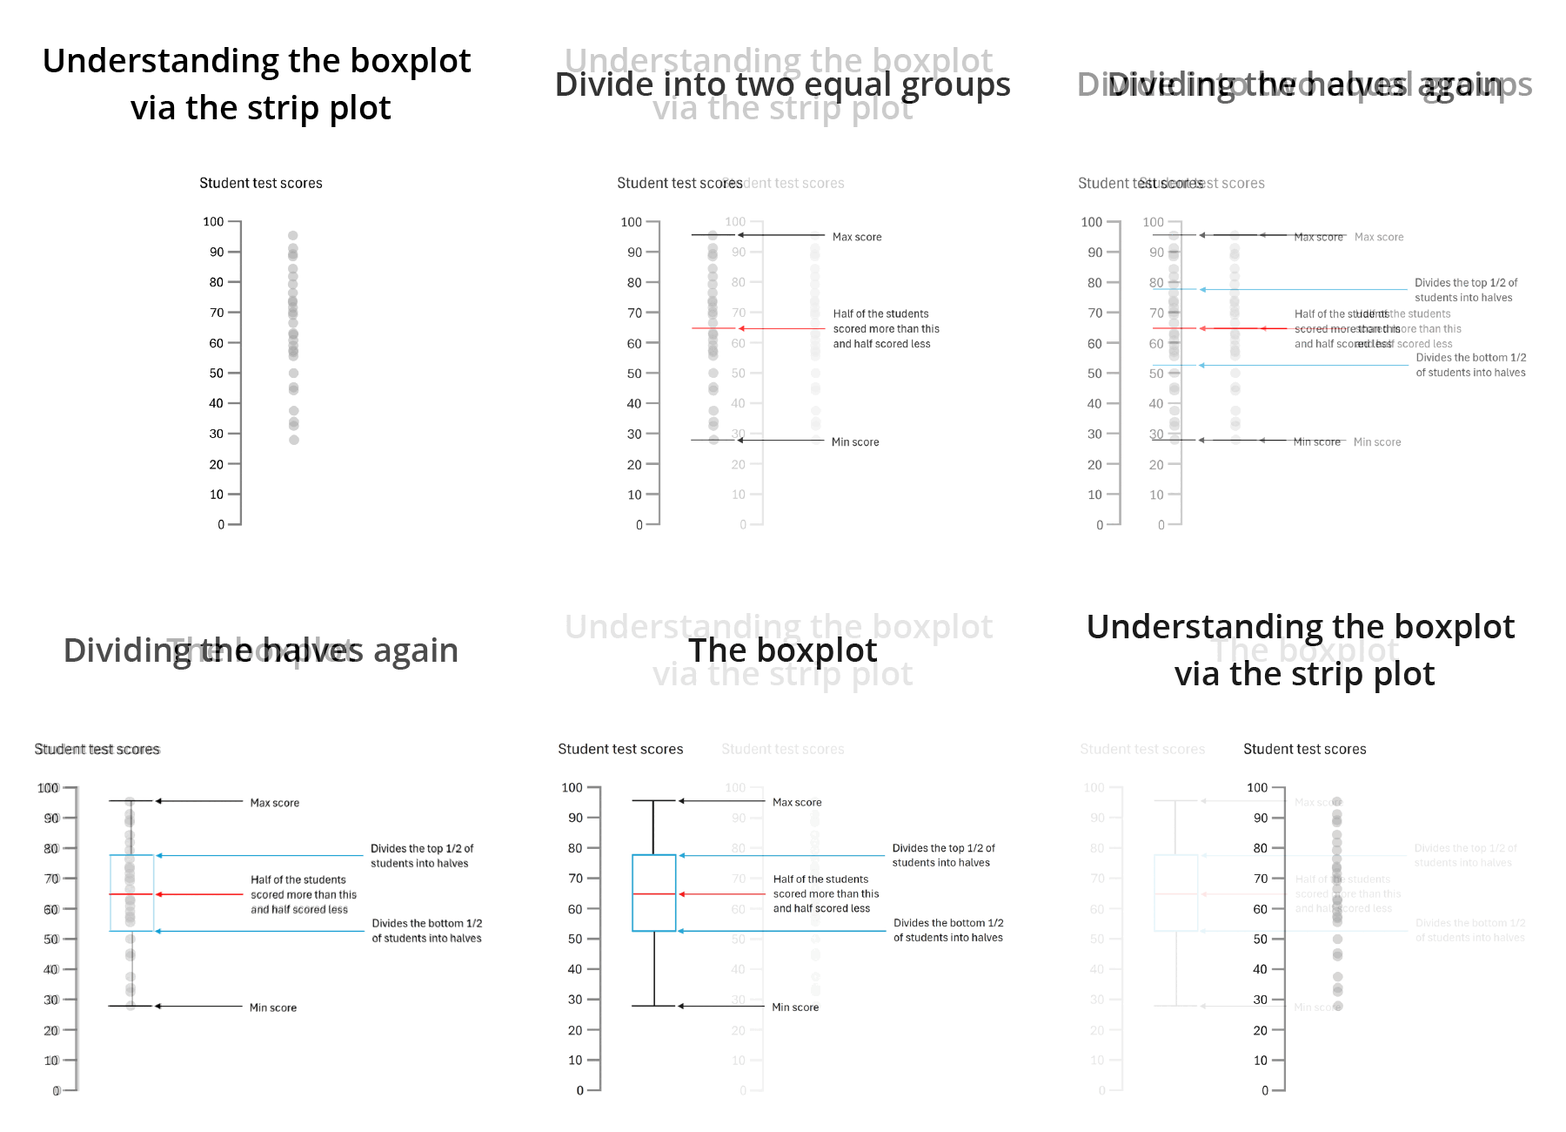
The strip plot illustrates individual student test scores as dots, with black lines indicating the range from the minimum to the maximum score. The red line represents the median, dividing scores evenly, while the blue lines mark quartiles for the top and bottom halves of scores. Connecting these lines forms the 'box' in a box plot, depicting the central 50% of scores around the median. This visualizes how scores are distributed around the median, creating a clear representation of the core data range. The resulting box plot highlights where most scores lie and the median's division of the score distribution.
Data analysis using box plots offers a comprehensive approach to understanding data characteristics. With a well-crafted box plot, one can quickly ascertain the degree of dispersion, identify outliers, and understand the data’s central tendency.
This chapter delves into how box plots articulate these complex statistical concepts through their elegant design, facilitating a deeper analysis and enabling insightful interpretations in exploratory data analysis.
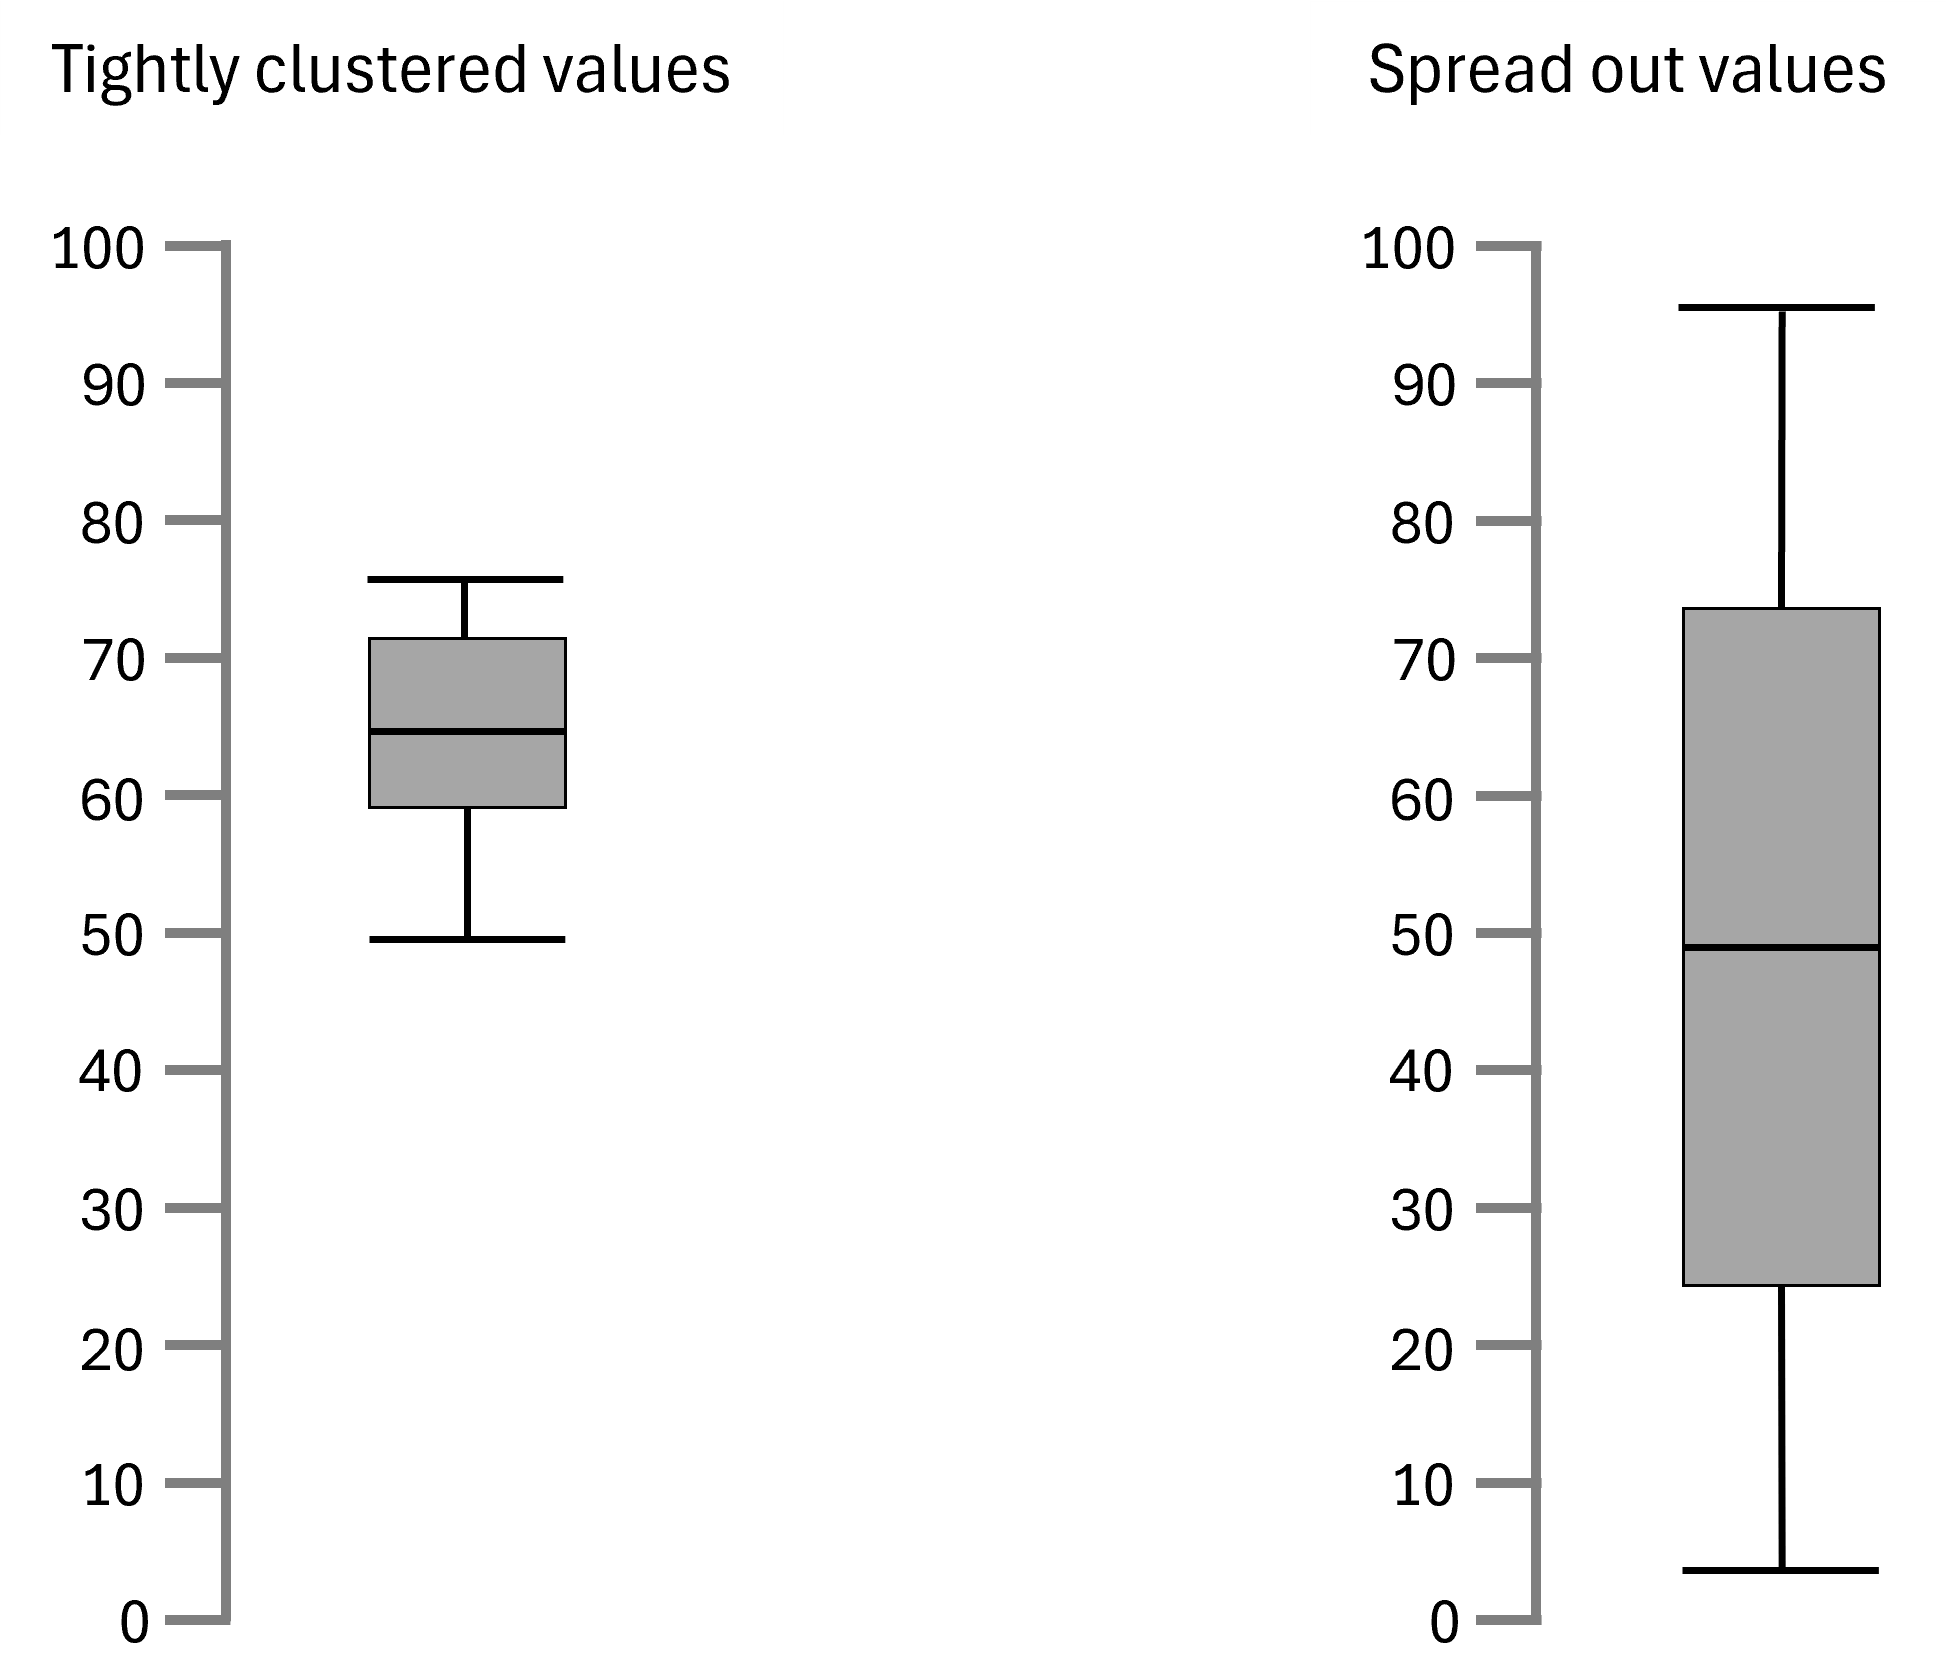
The dispersion of datapoints is reflected in a box plot by the range between the minimum and maximum values, indicated by the whiskers. The interquartile range (IQR), or the length of the box, shows how the middle 50% of data values are spread out.
A longer IQR or a larger range suggests a wider spread in the values, while a shorter IQR or range indicates datapoints that are more closely clustered together. Analysts can use these insights to understand the data’s overall variability, which informs subsequent analysis or decision-making processes.
Box plots help in reading the skewness of data by visually displaying the symmetry or asymmetry of the dataset.
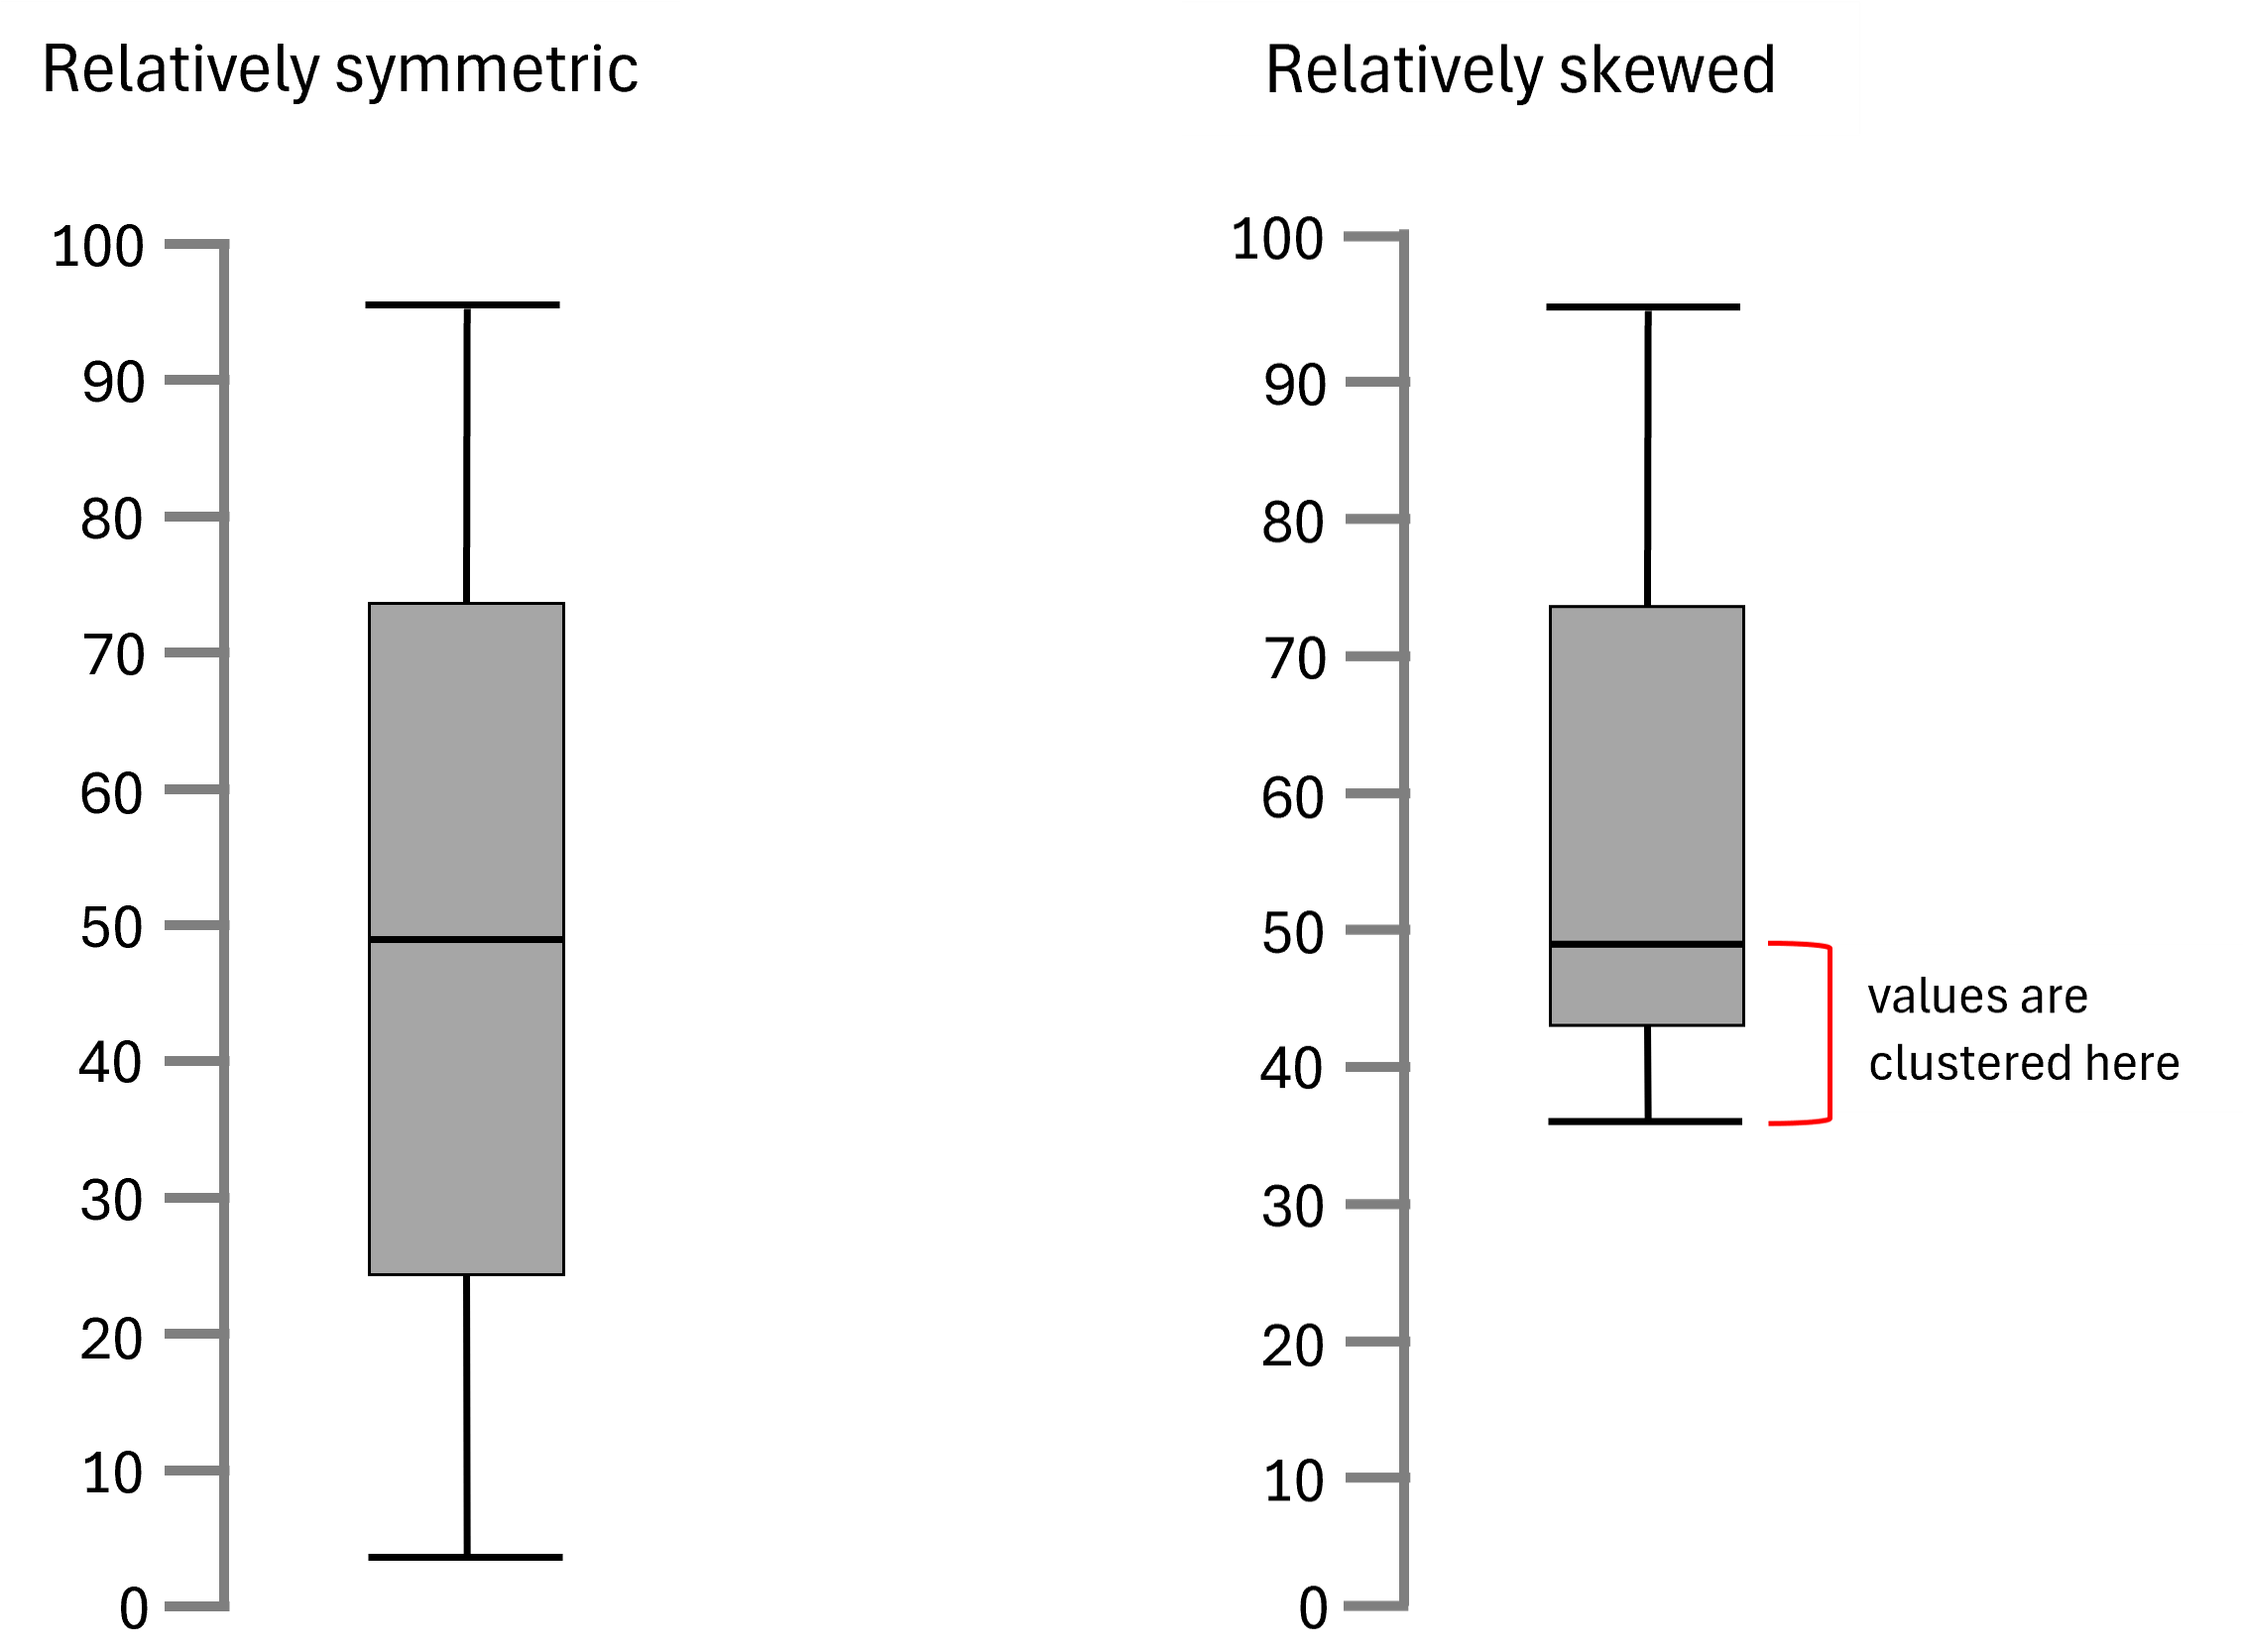
In the example below the first box plot demonstrates relative symmetry, indicating a more uniform distribution of data around the median. Both whiskers are of similar length, and the median line is centered within the box, suggesting a balanced distribution.
In the second box plot, the median line is closer to the bottom of the box and the minimum value, suggesting that the values in the lower half of the dataset are more tightly grouped than those in the upper half.
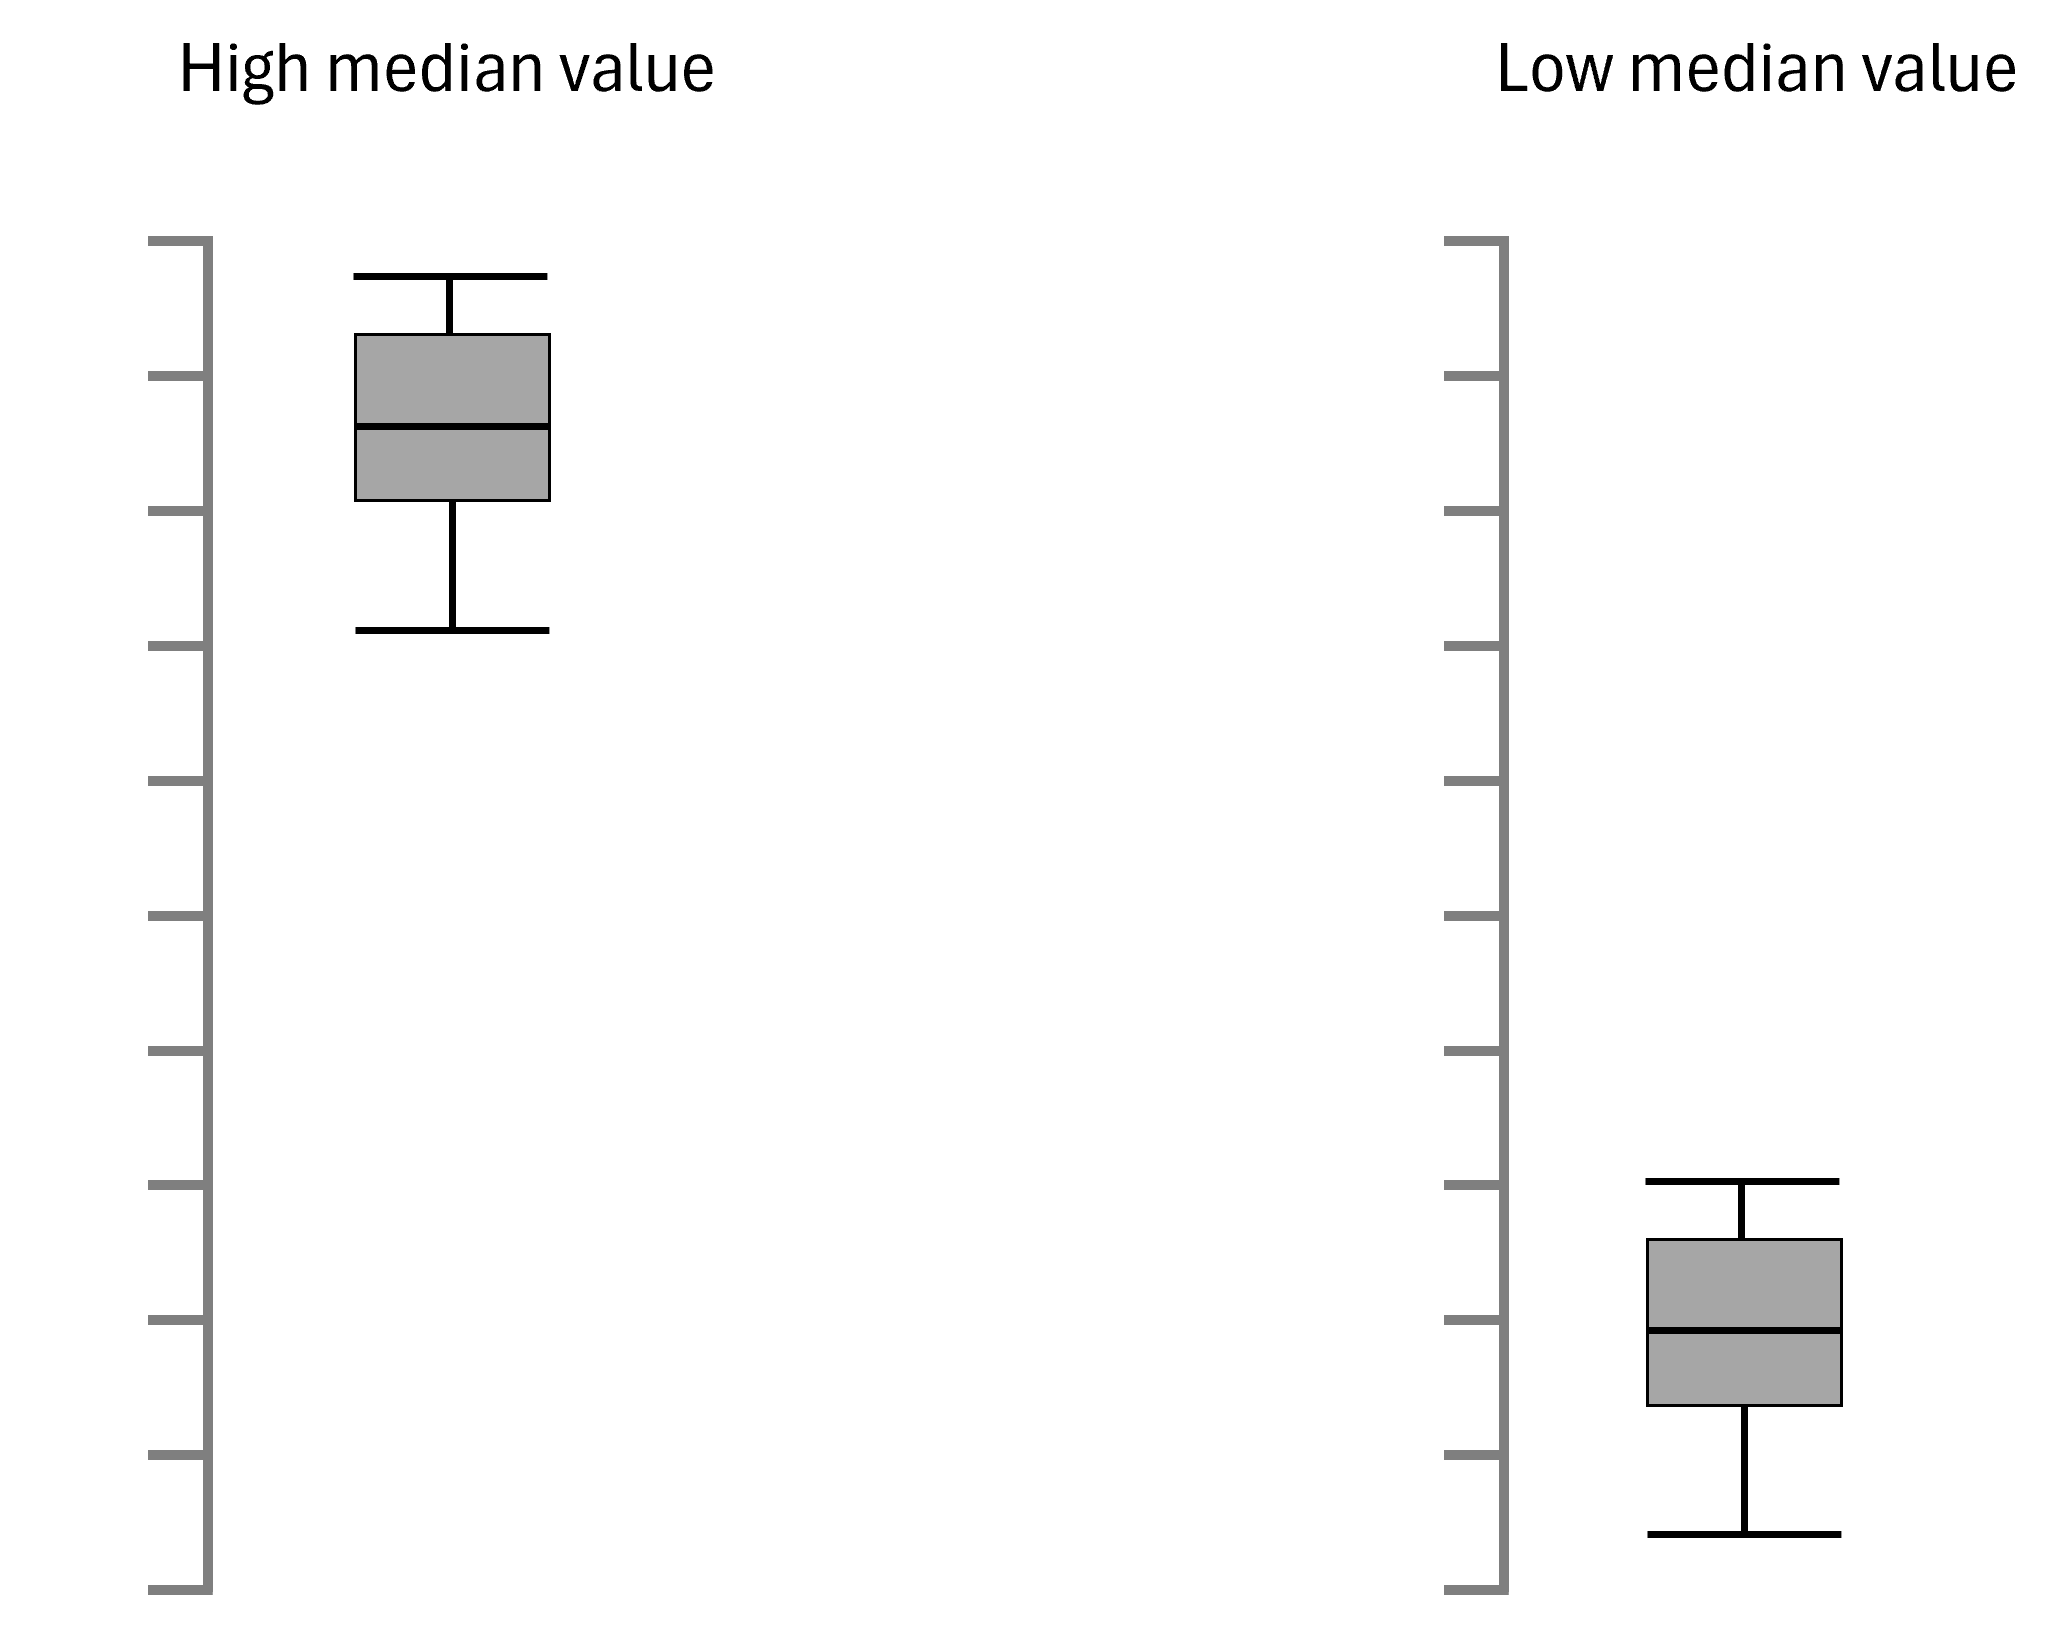
Understanding the locality of data using box plots involves interpreting the position of the box and the median within the plot.
In the example provided, the left box plot's high median value suggests that most values lie toward the upper range. In contrast, the right box plot's low median indicates relatively low values. These visual cues allow for quick comparisons across datasets, offering clear insights into the predominant data trends
Box plots offer a high-level overview and facilitate the comparison of multiple series by providing a visual summary of key statistical measures. Analysts can compare multiple box plots side by side to identify differences in central tendency, spread, and variability between datasets. The box plot's simplicity and clarity make it easy to compare distributions, detect outliers, and understand the overall shape of the data.
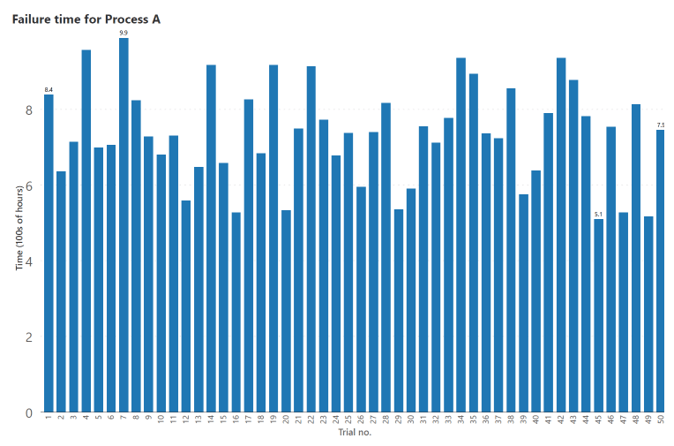
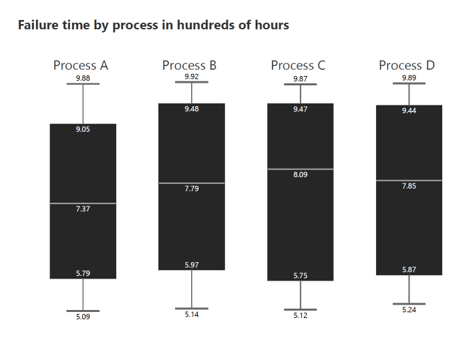
By contrast, box plots summarize this data for easy insights and comparisons as seen below. By examining multiple box plots simultaneously, analysts can gain valuable insights into the similarities and differences among datasets, enabling them to make data-driven decisions and draw meaningful conclusions based on the visual representation of the data.
Box plots come in various forms to suit different data analysis needs. Here are some common types:
The classic box plot displays the median, quartiles, and whiskers, which extend to the minimum and maximum values, excluding outliers. This is the most common version for a quick data overview.
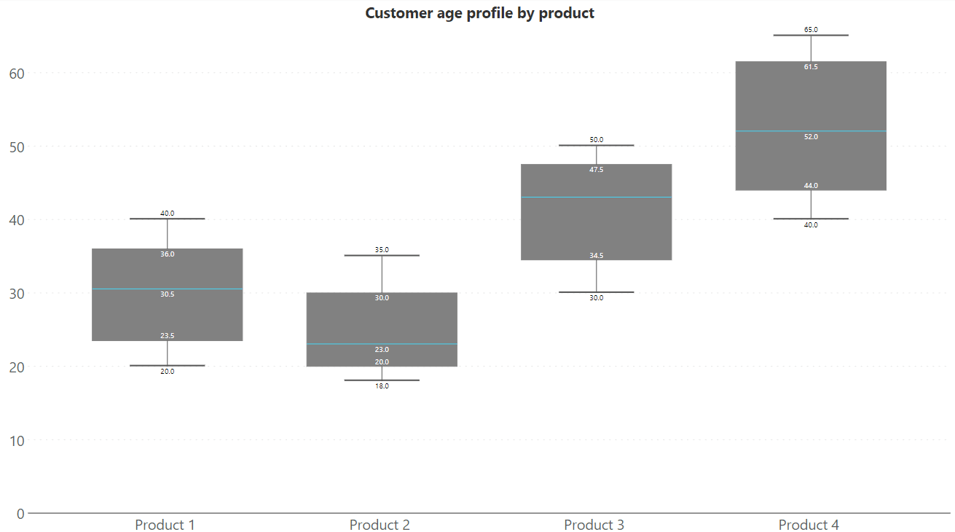
In the example shown, we observe the customer age profile by product, where the x-axis categorizes products, and the y-axis represents customer age. This arrangement offers immediate insights: for instance, product 2 appeals to the youngest customer demographic, while product 4 is favored by the oldest demographic.
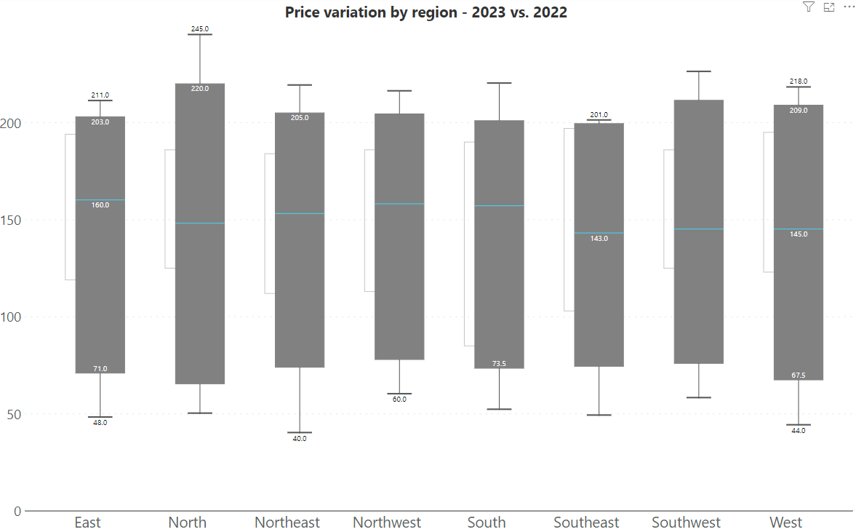
The overlapped box plot variation is used when it's necessary to compare two related sets of data. The example provided illustrates an overlapped box plot, where the data for 2023 is layered on top of the data for 2022. If you want to compare the price variation by region for two different years, overlapped box plots allow for direct comparison within the same visual space.
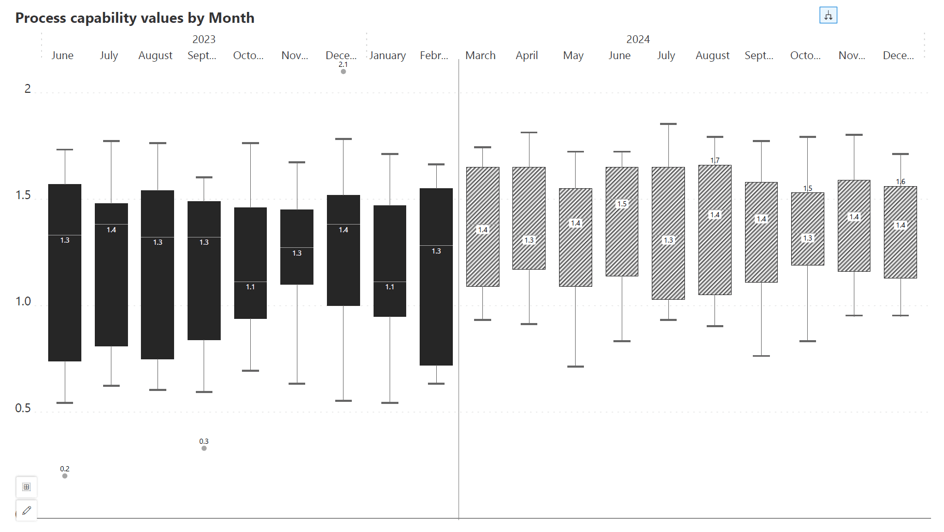
The forecast box plot is designed for predictive insights, depicting future trends with hatched bars to differentiate forecasts from actual past data. The example below displays process capability values by month, with the solid bars representing actual values of 2023 and the hatched bars showing predicted values for 2024.
A dividing line often separates the historical data from the forecasted data, providing a clear visual distinction between what is known and what is anticipated. This type of box plot is particularly useful for planning and resource allocation in business settings.
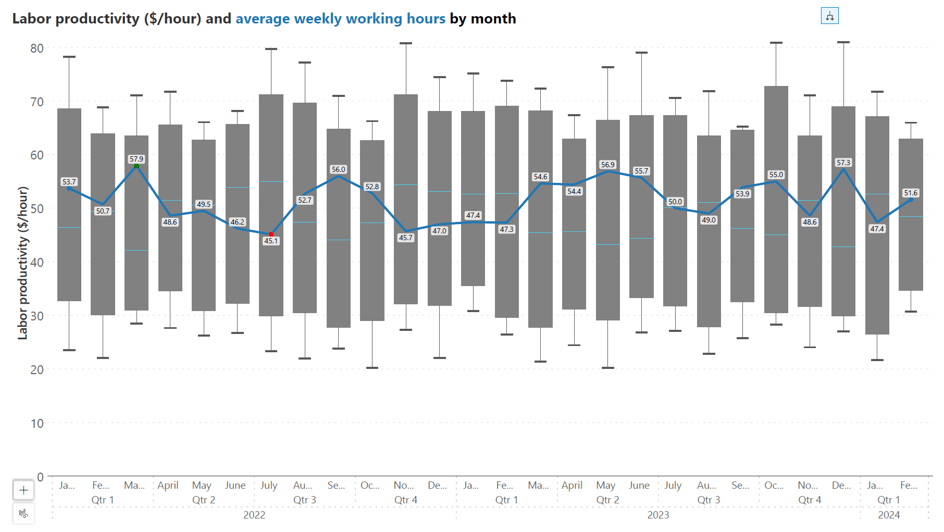
A combination chart that merges a box plot with a line chart is apt for tracking multiple metrics simultaneously and examining the relationships between them. In the example below, we see labor productivity measured in dollars per hour alongside average weekly working hours by month.
The bar elements of the box plot show the variability and central tendency of labor productivity each month, while the overlaid line graph traces the average working hours.
This dual representation allows for a nuanced analysis of how changes in working hours might correlate with productivity, offering insights that could inform decisions on workforce management and optimization.
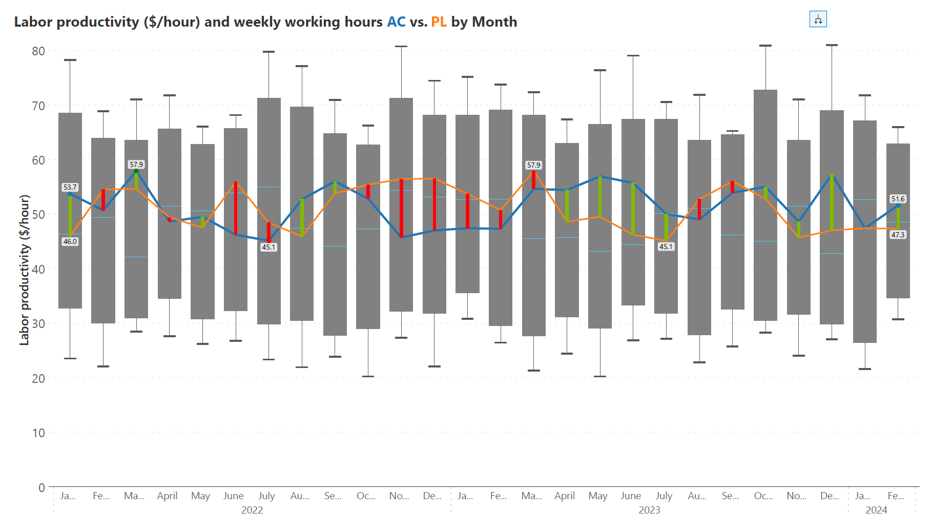
This combination chart integrates the box plot with variance bars, offering a dynamic way to visualize changes in data over time. The bars represent labor productivity, and the overlaid line charts display planned and actual weekly working hours, allowing for a comparison of these two metrics across months.
The variance bars are colored distinctly to highlight the variance between actual and planned working hours. They are useful for identifying trends, such as periods of high efficiency or times when productivity may dip, in relation to work hours.
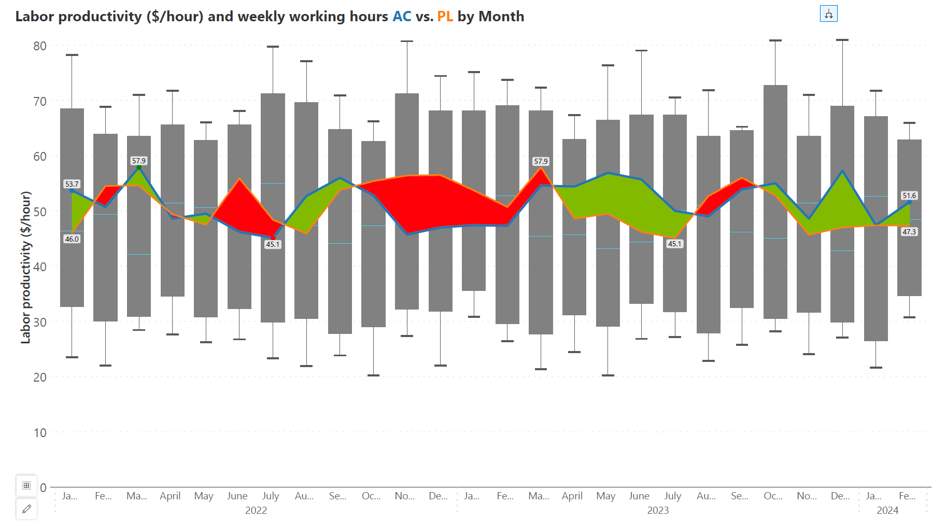
A variance area chart type enhances the visualization of labor productivity alongside weekly working hours, with the variance in productivity highlighted by the colored area between the lines.
This chart features a box plot for labor productivity and an overlaid variance area chart that indicates the fluctuation in weekly working hours (actual vs. planned) overtime. The colored area provides a visual measure of the variance between actual and planned values, helping to identify differences from the plan. This chart allows for an at-a-glance assessment of how productivity changes are correlated with work hours, offering a more nuanced perspective on labor efficiency across different months.
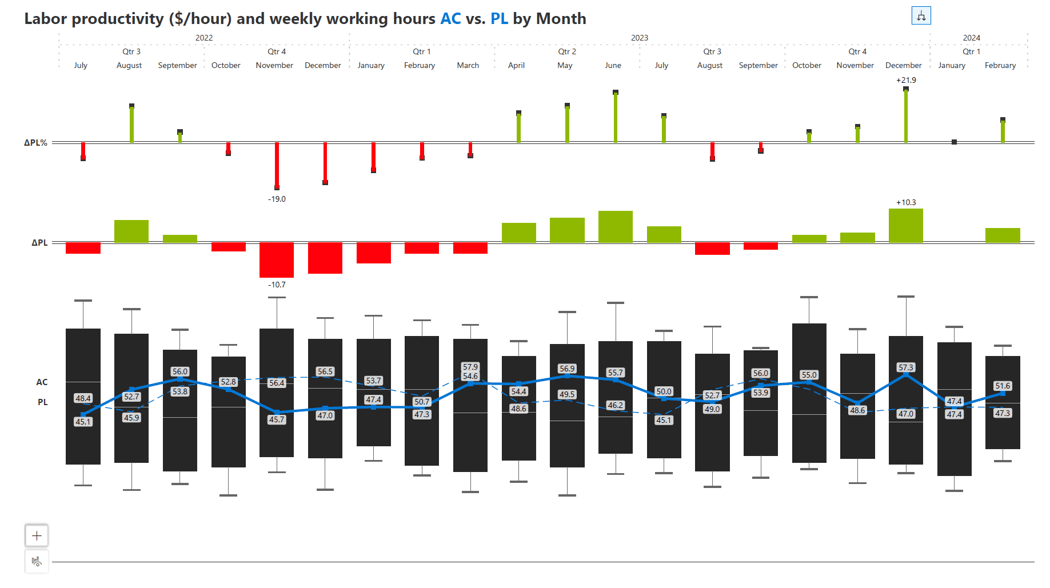
Here is another variation - in the visual example, we have a combination chart that presents labor productivity in relation to planned and actual weekly working hours.
The example displayed illustrates a detailed box plot, which captures the central tendencies and variances of productivity over time. Above this primary visual, variance and percentage variance values calculated between planned and actual weekly working hours are succinctly communicated through a bar and a lollipop chart respectively, providing a quick reference to relative changes.
This format is particularly useful for pinpointing specific periods of interest, such as those with substantial shifts in productivity, and understanding their proportional significance.
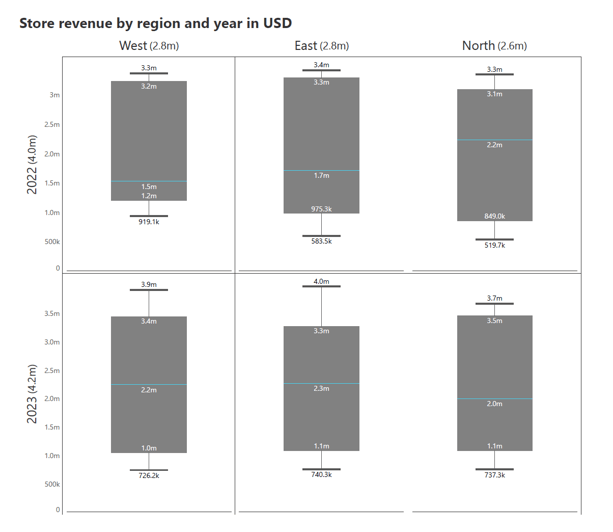
Small multiple box plots offer a way to segment and examine our data across multiple categories simultaneously. In the example provided, store revenue is analyzed by region and year.
By breaking the box plots down into smaller panels, each representing a different category, we can quickly compare the data's spread and central tendencies across various segments, such as geographical region or year. This layout provides an efficient comparison of distributions, making it easy to spot differences and similarities in revenue trends.
John Tukey's original box plot design, introduced in the 1970s, is a fundamental visualization tool for summarizing the distribution of data. It consists of a box representing the interquartile range (IQR) with a line inside denoting the median. Outliers are displayed as individual points beyond the whiskers, providing a clear overview of the data's central tendency and spread.

Edward Tufte's "boxless" box plot is a modification that aims to reduce non-data ink while retaining essential information. In this variation, the traditional box and whiskers are replaced by a dot representing the median and lines showing the whiskers. This design minimizes visual clutter, focusing solely on the key data points. Tufte's approach streamlines the box plot, making it cleaner and more direct.

Daniel Carr's variation of the box plot introduces a unique feature that distinguishes data points above and below the median. In this design, the box is split horizontally at the median, with different shading or patterns used for the upper and lower portions.

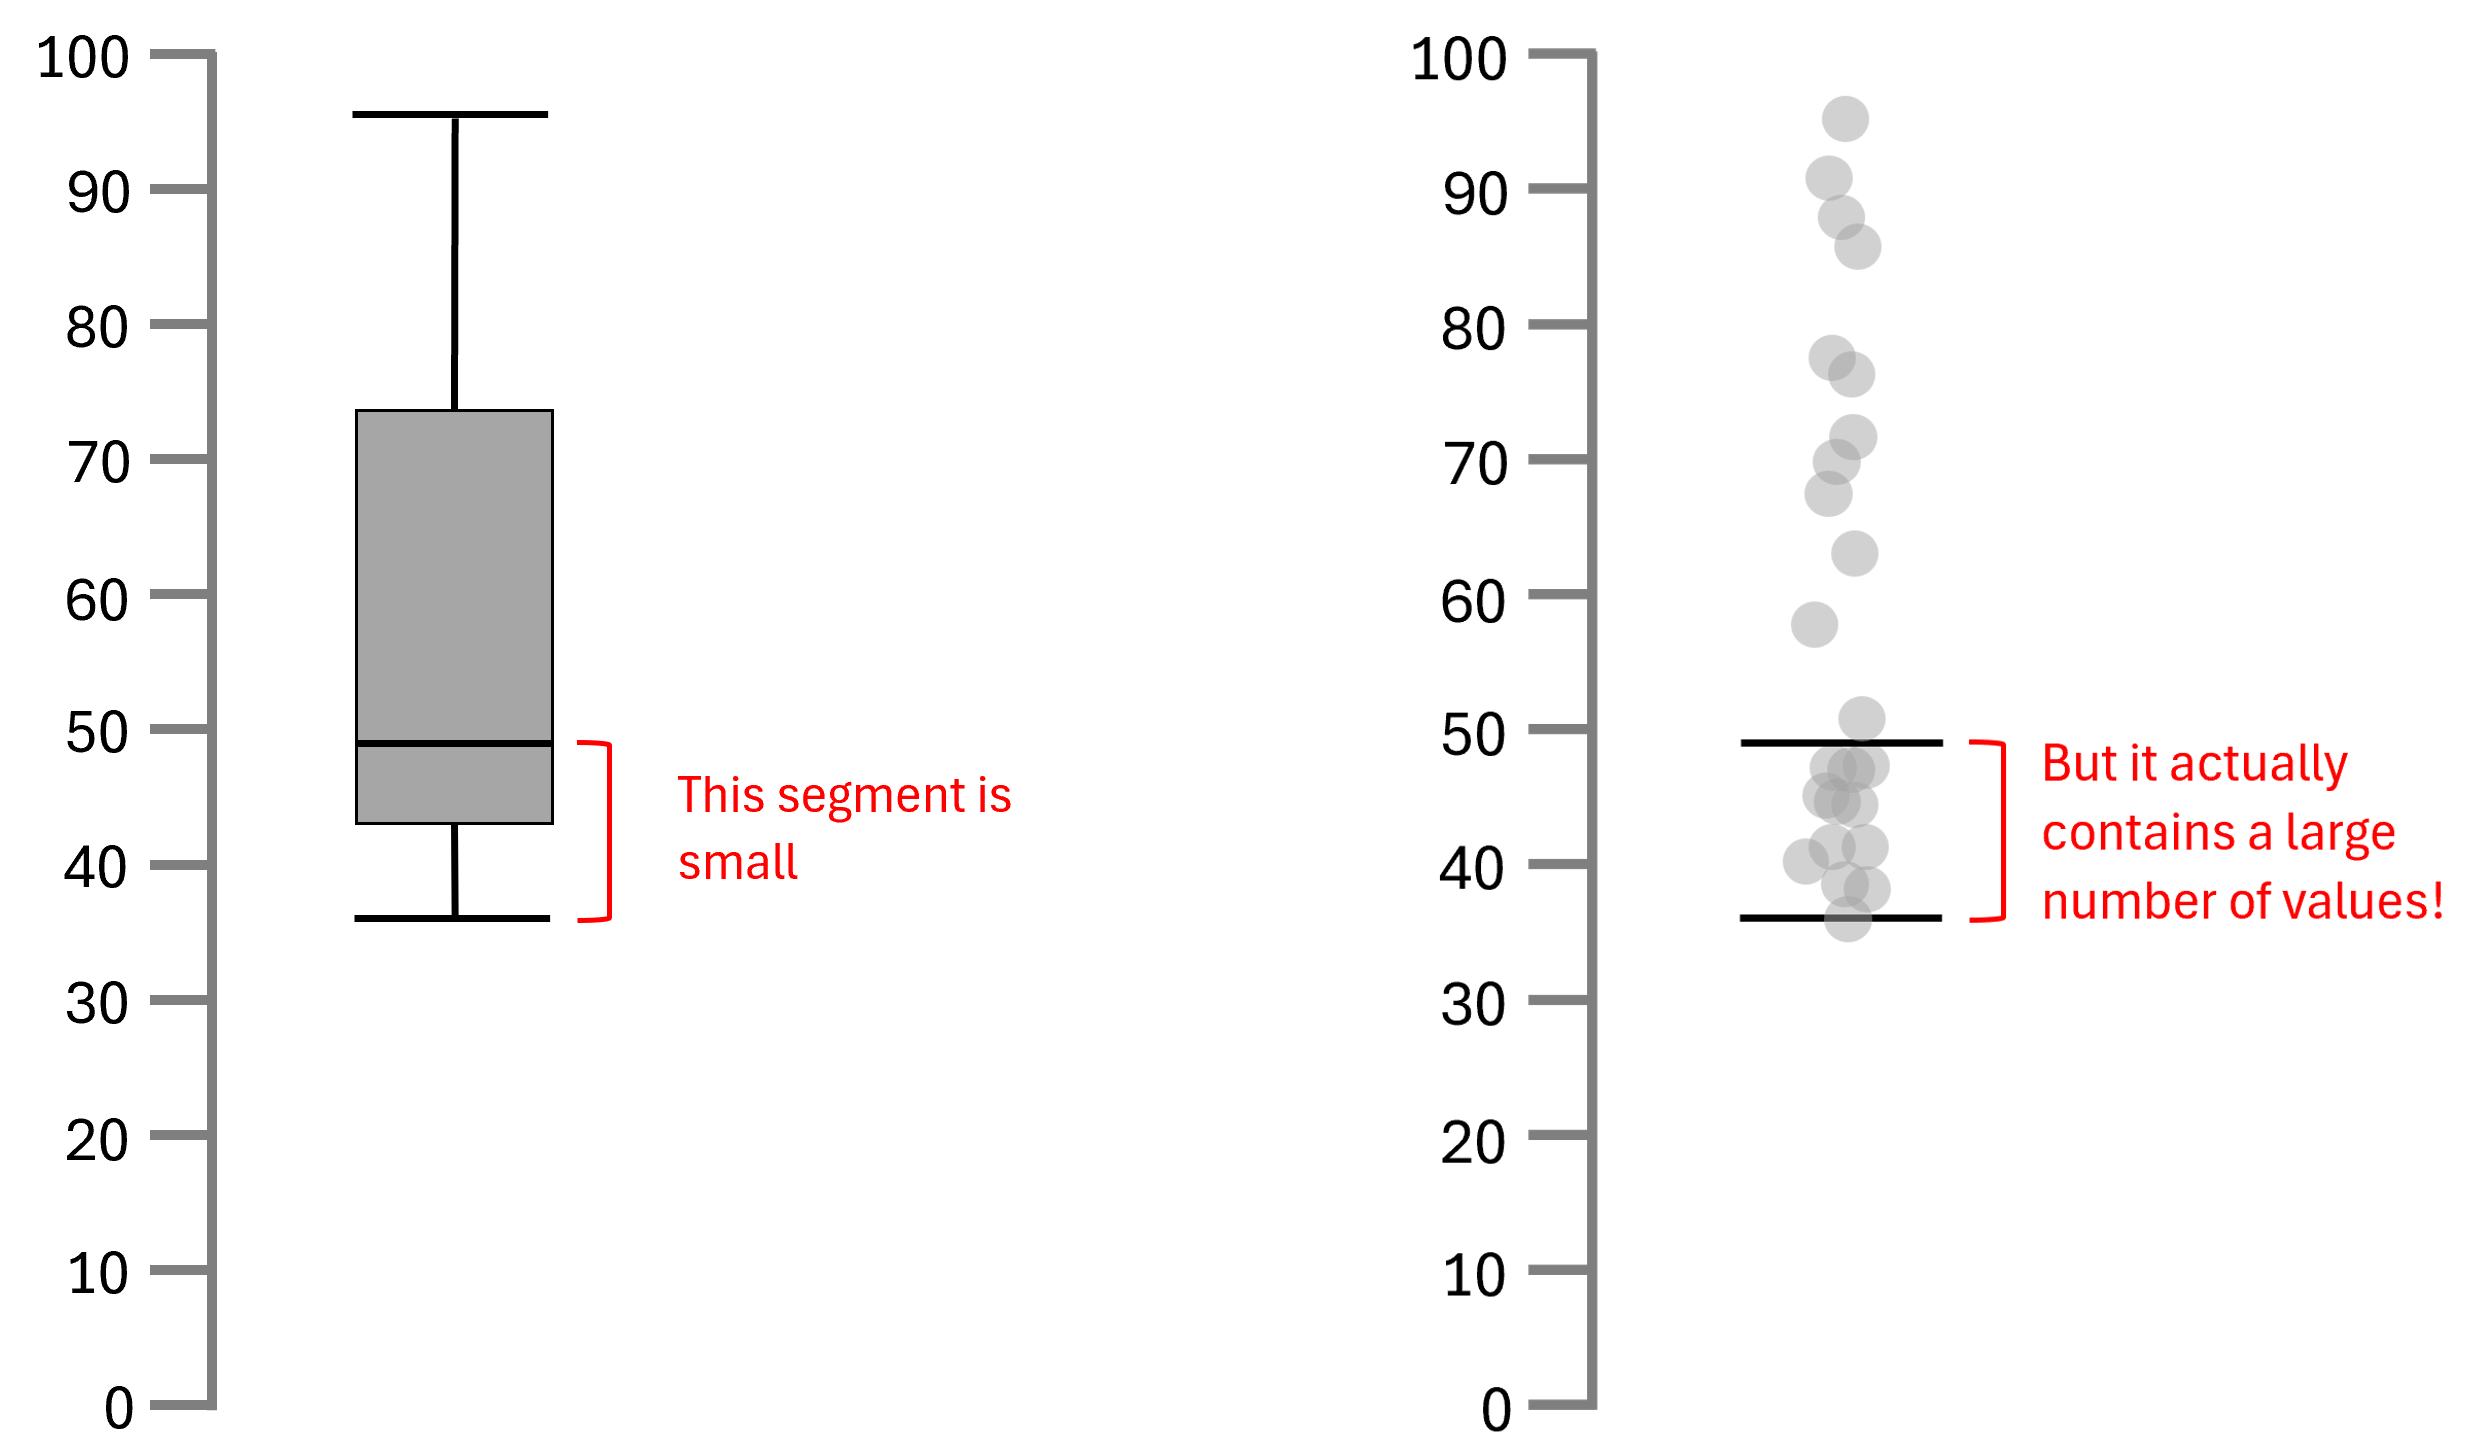
One common misinterpretation of box plots is associating shorter segments with fewer values. It's crucial to understand that the quartiles in a box plot divide the dataset into equal parts, so a shorter segment does not indicate fewer data points. Instead, it signifies that the data points within that segment are more tightly clustered or have less variability.
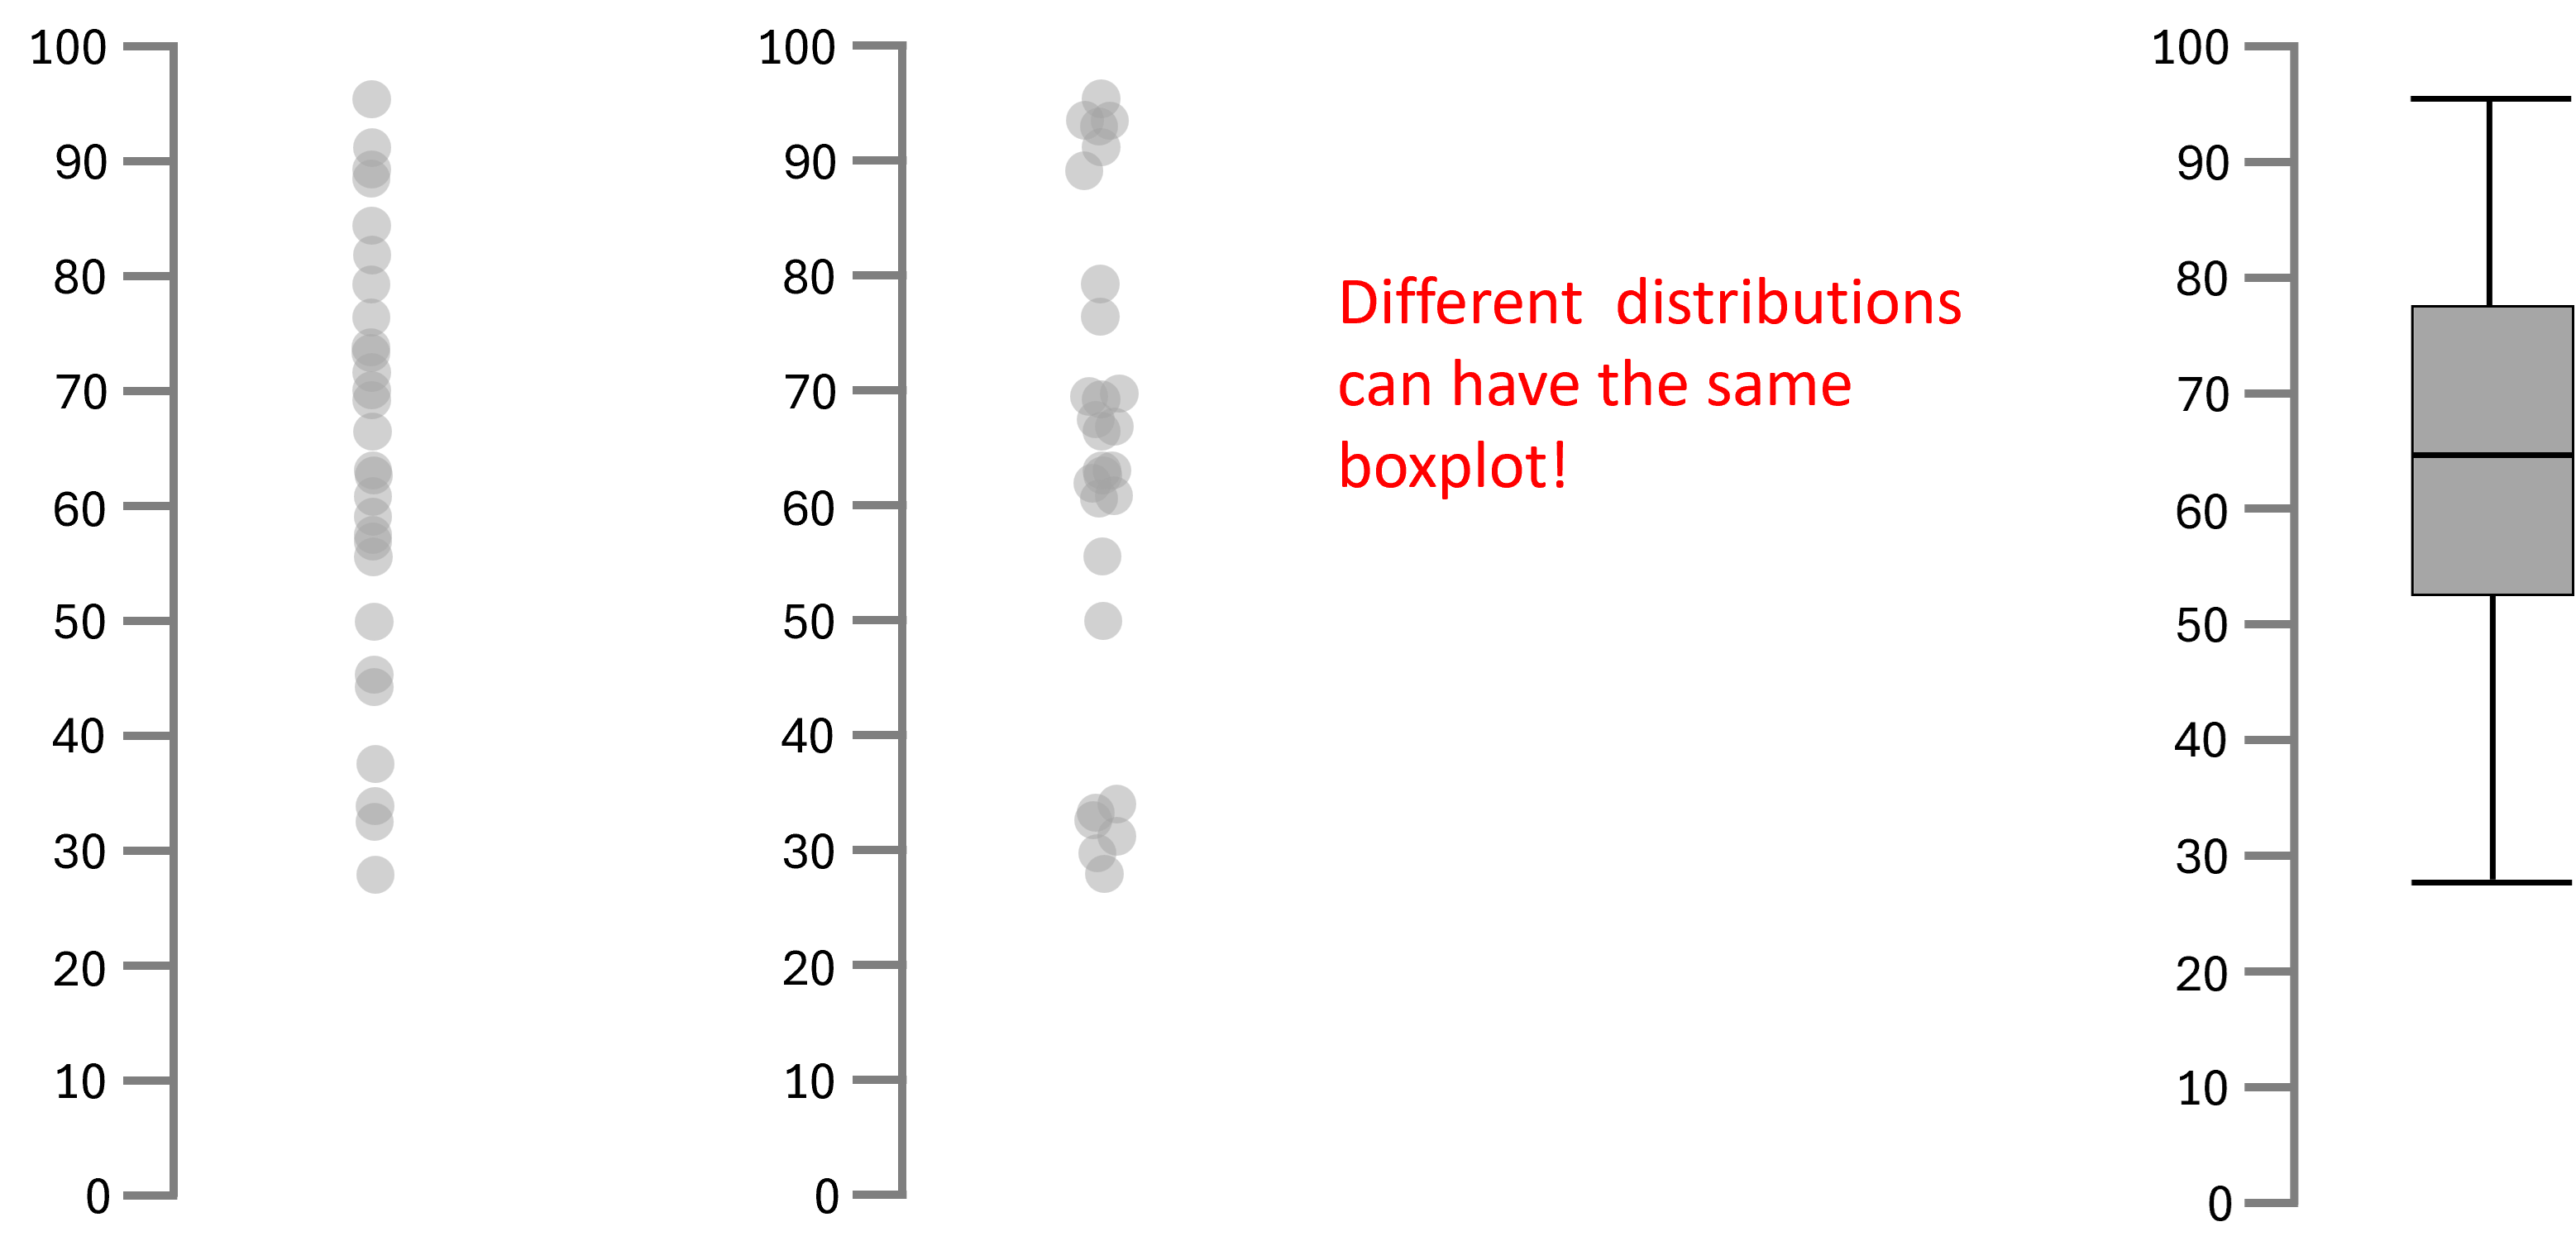
A common misinterpretation while reading a box plot is the assumption that identical box plots reflect identical distributions. It's important to note that very different datasets can yield box plots that look alike since box plots only show summary statistics.
Therefore, inferring the nature of a distribution based solely on the box plot can be deceptive, and one should always examine the underlying data to avoid erroneous conclusions.
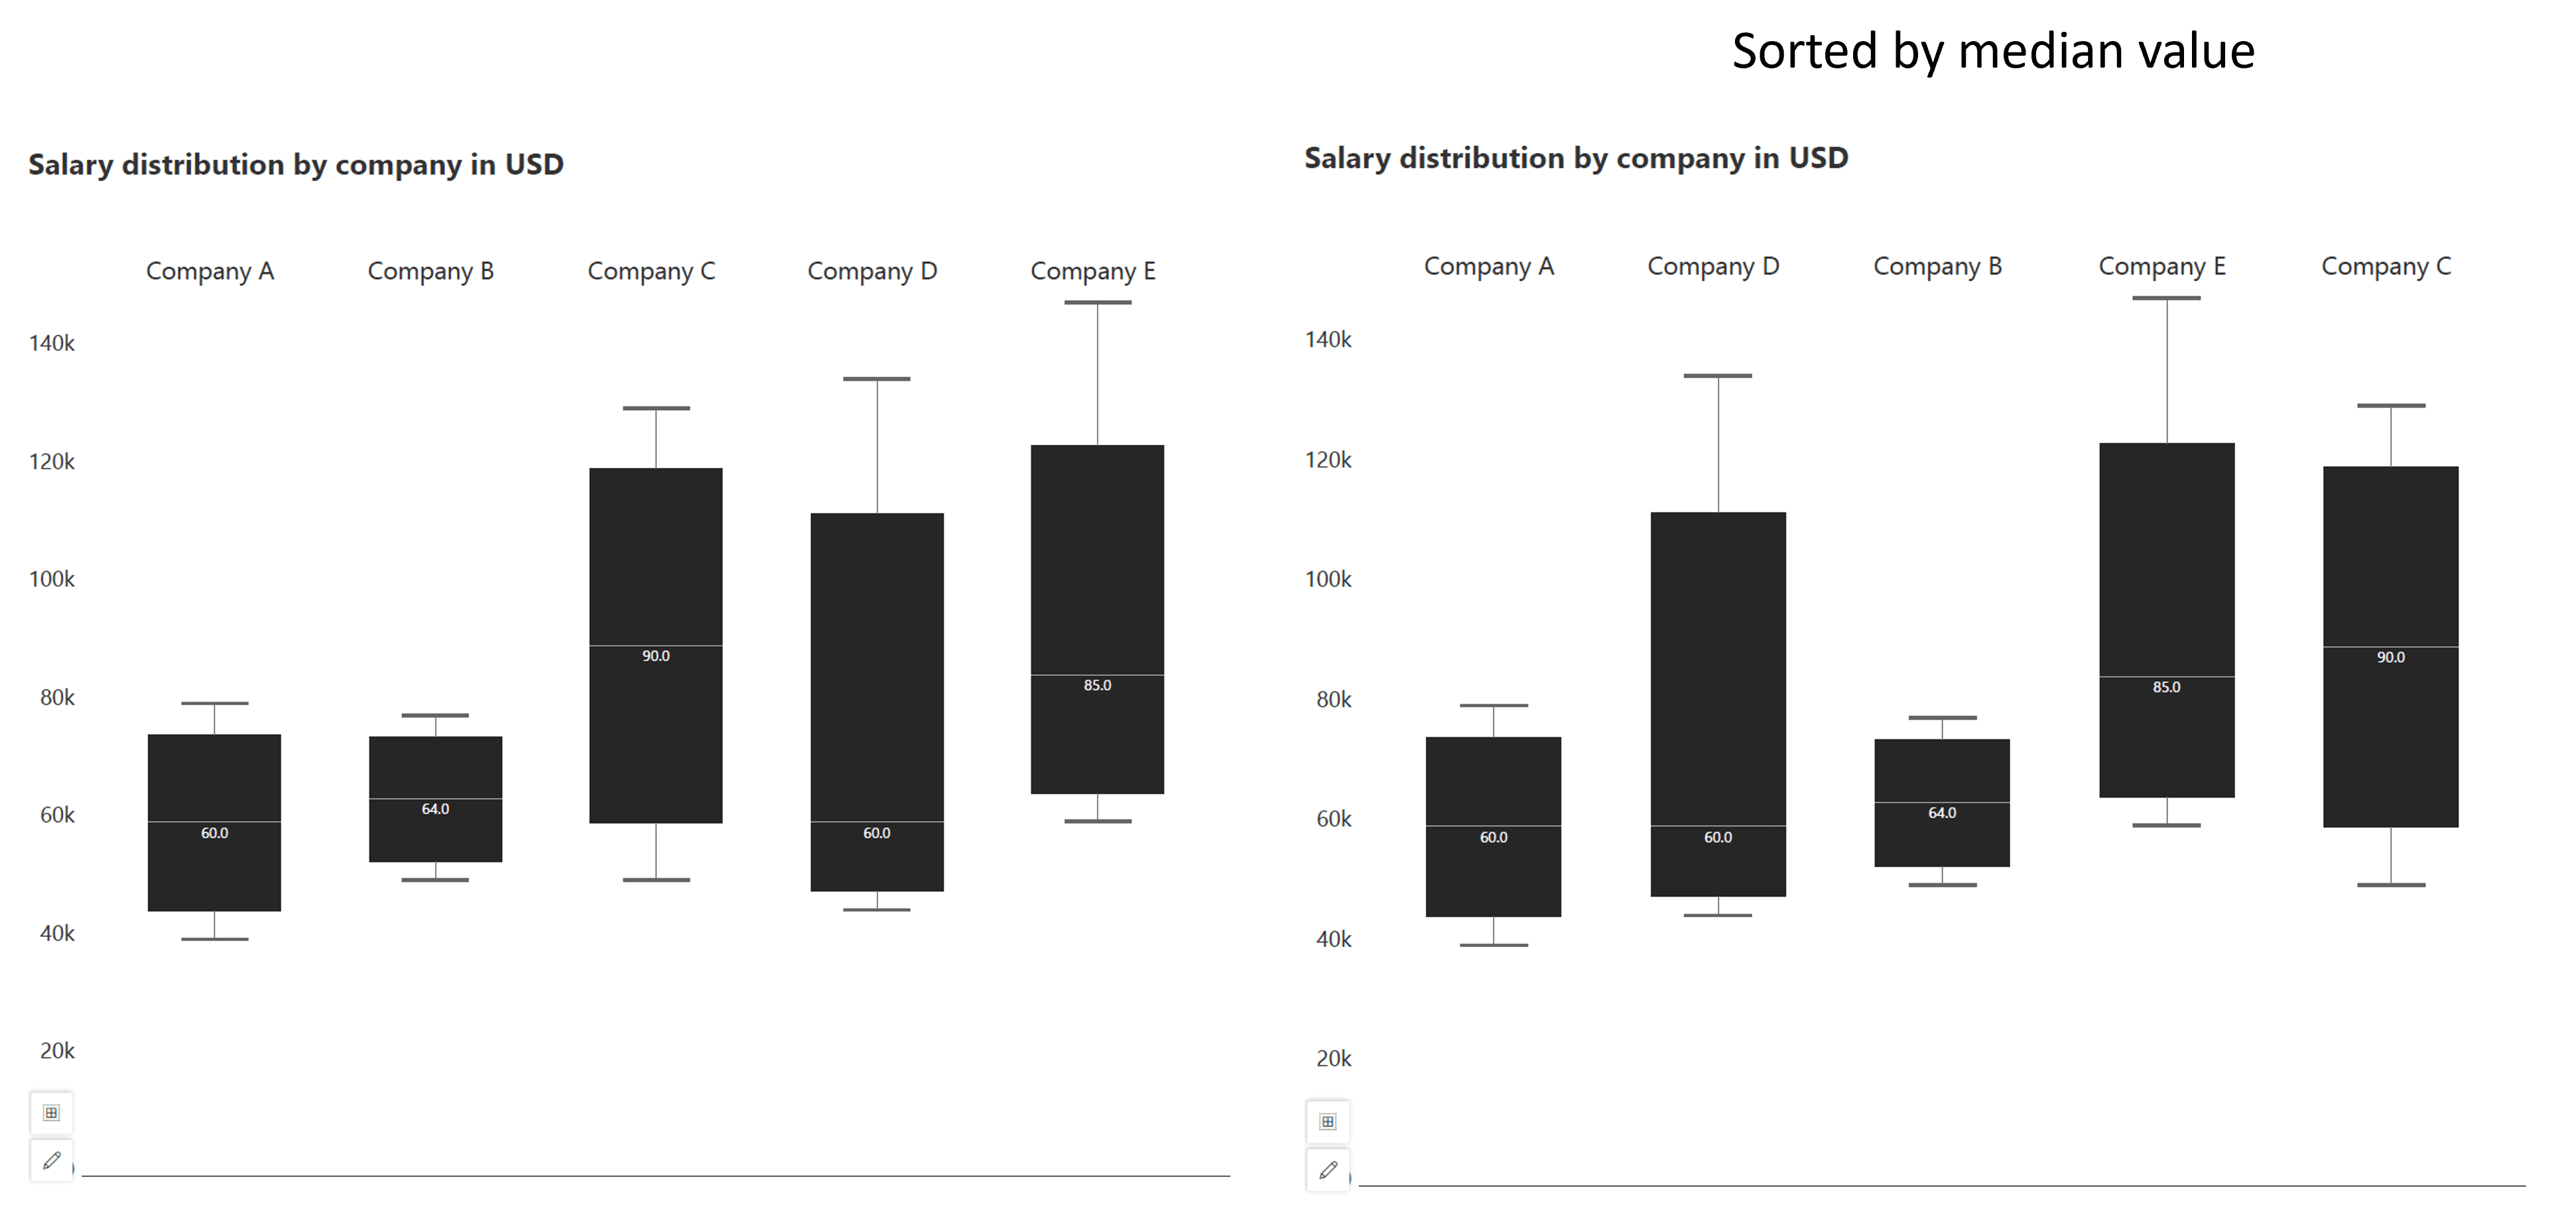
Sorting values in a box plot is crucial for enhancing audience comprehension. By sorting the values, the audience can more easily interpret the data and identify patterns. Sorting can be done based on an inherent logical order or according to quartile values, ensuring that the box plot effectively communicates the distribution of the data.
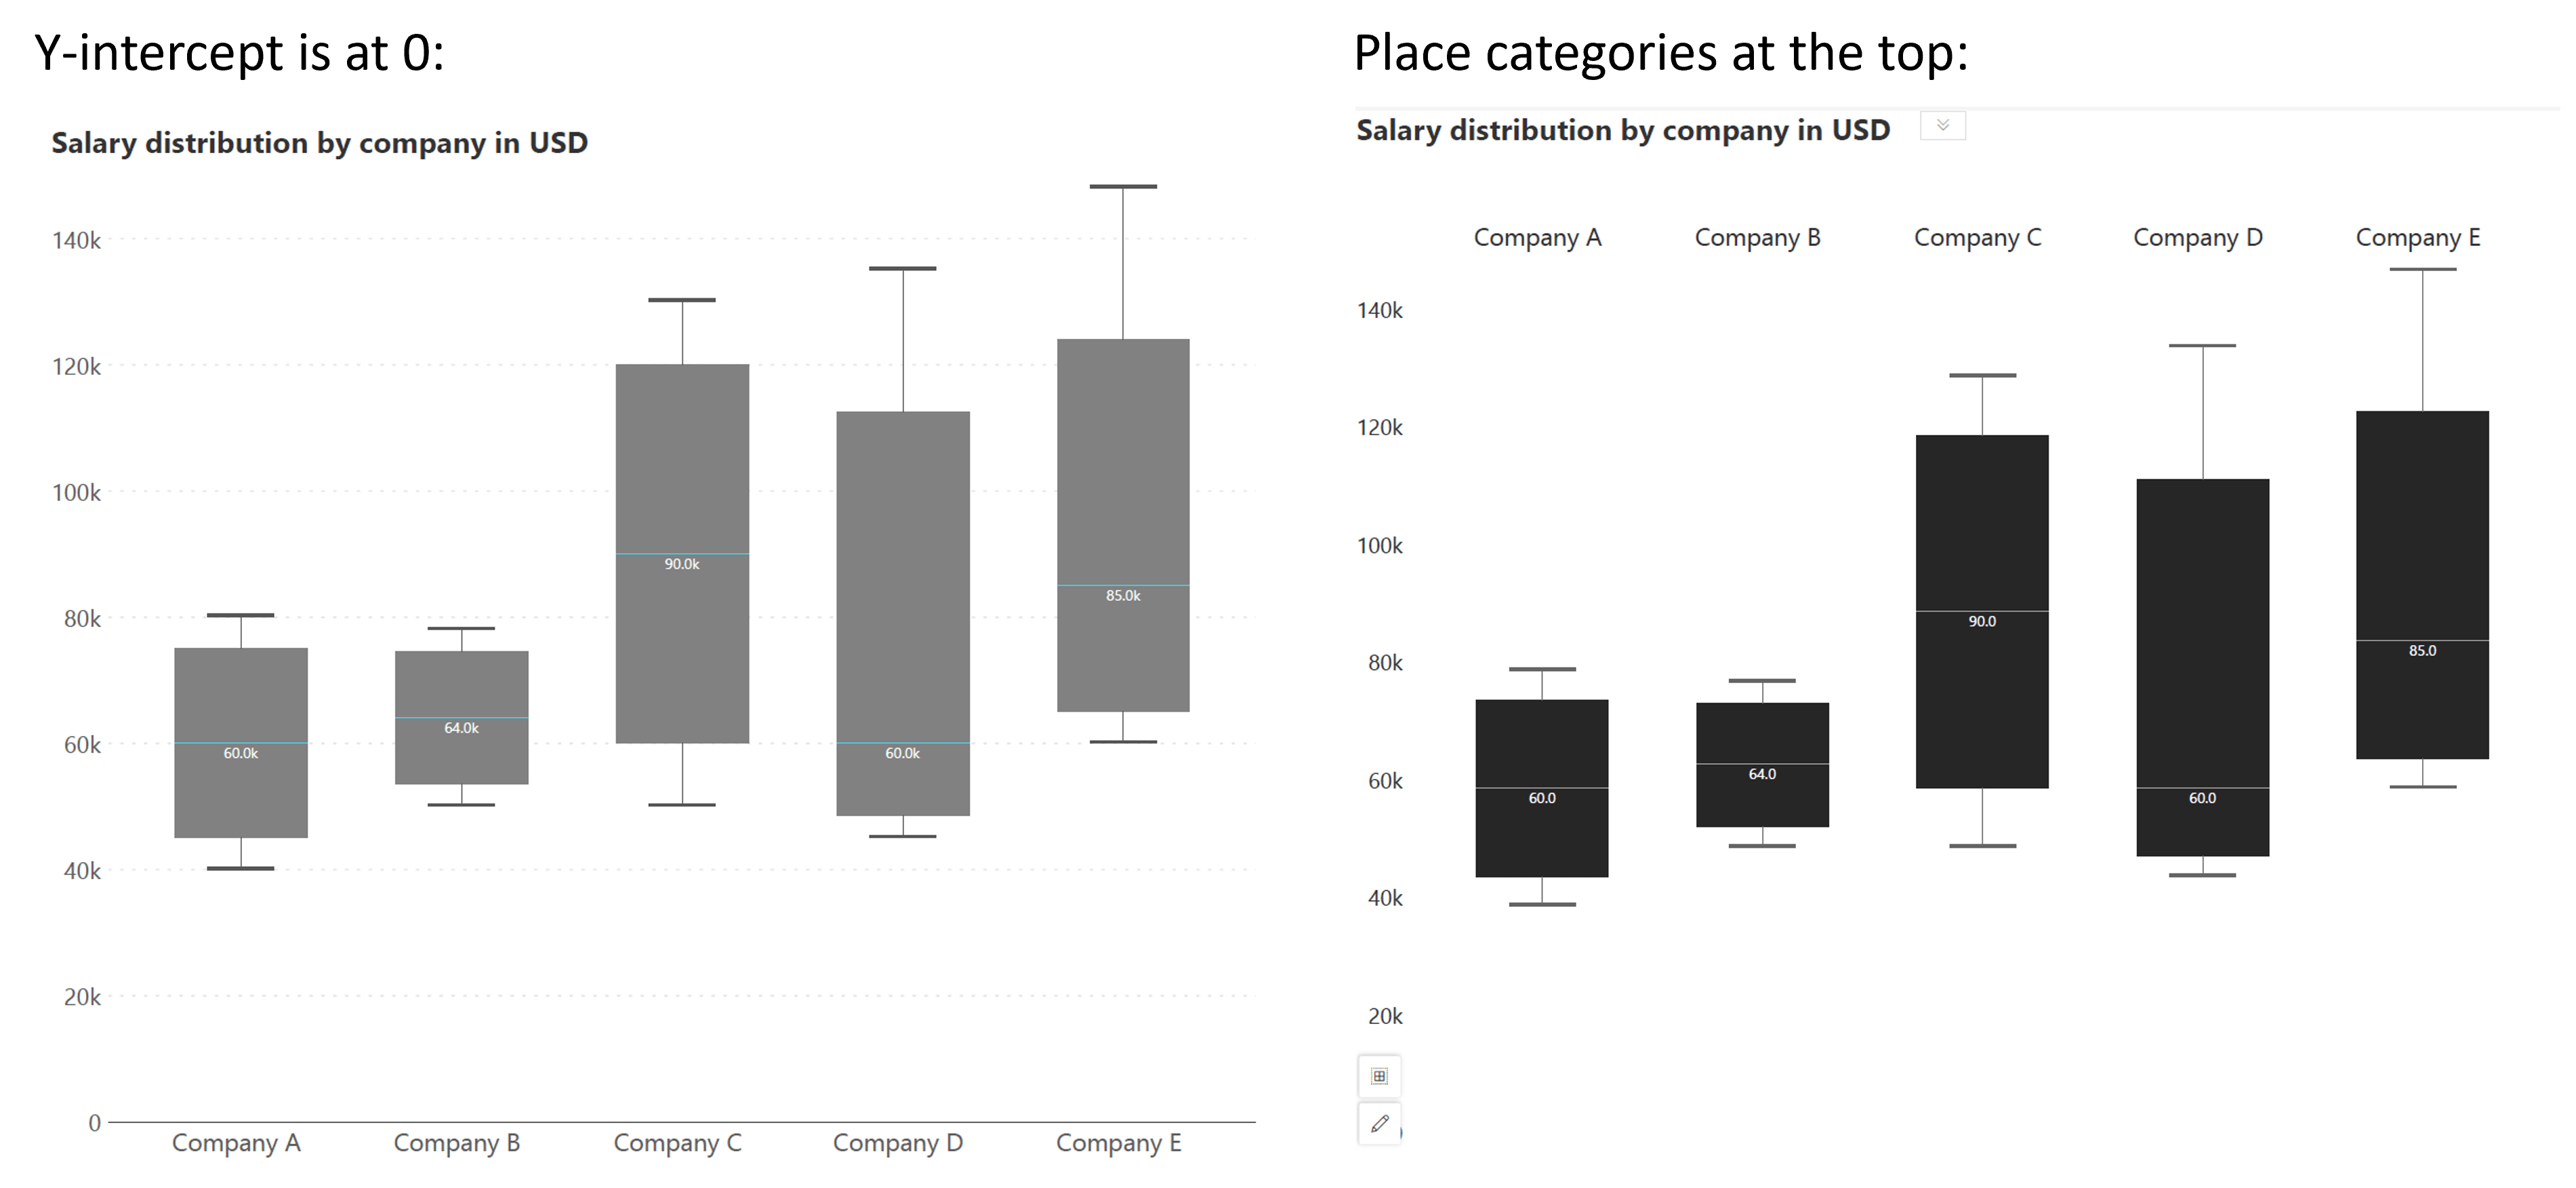
It is essential not to place the x-axis of a box plot at an arbitrary point. The x-axis should be positioned meaningfully to provide context and clarity to the data being presented. The x-axis can be placed where the y-intercept is zero, as seen on the left, or we may even simply place category labels at the top instead of showing the axis in cases when we do not wish to emphasize the zero value, as seen on the right below. Placing the x-axis thoughtfully enhances the interpretability of the box plot and helps viewers understand the relationships between different datasets or categories.
Box plots may not be suitable for very small datasets because the calculations of median and quartiles can lead to misleading representations when the sample size is not large enough to be statistically significant.
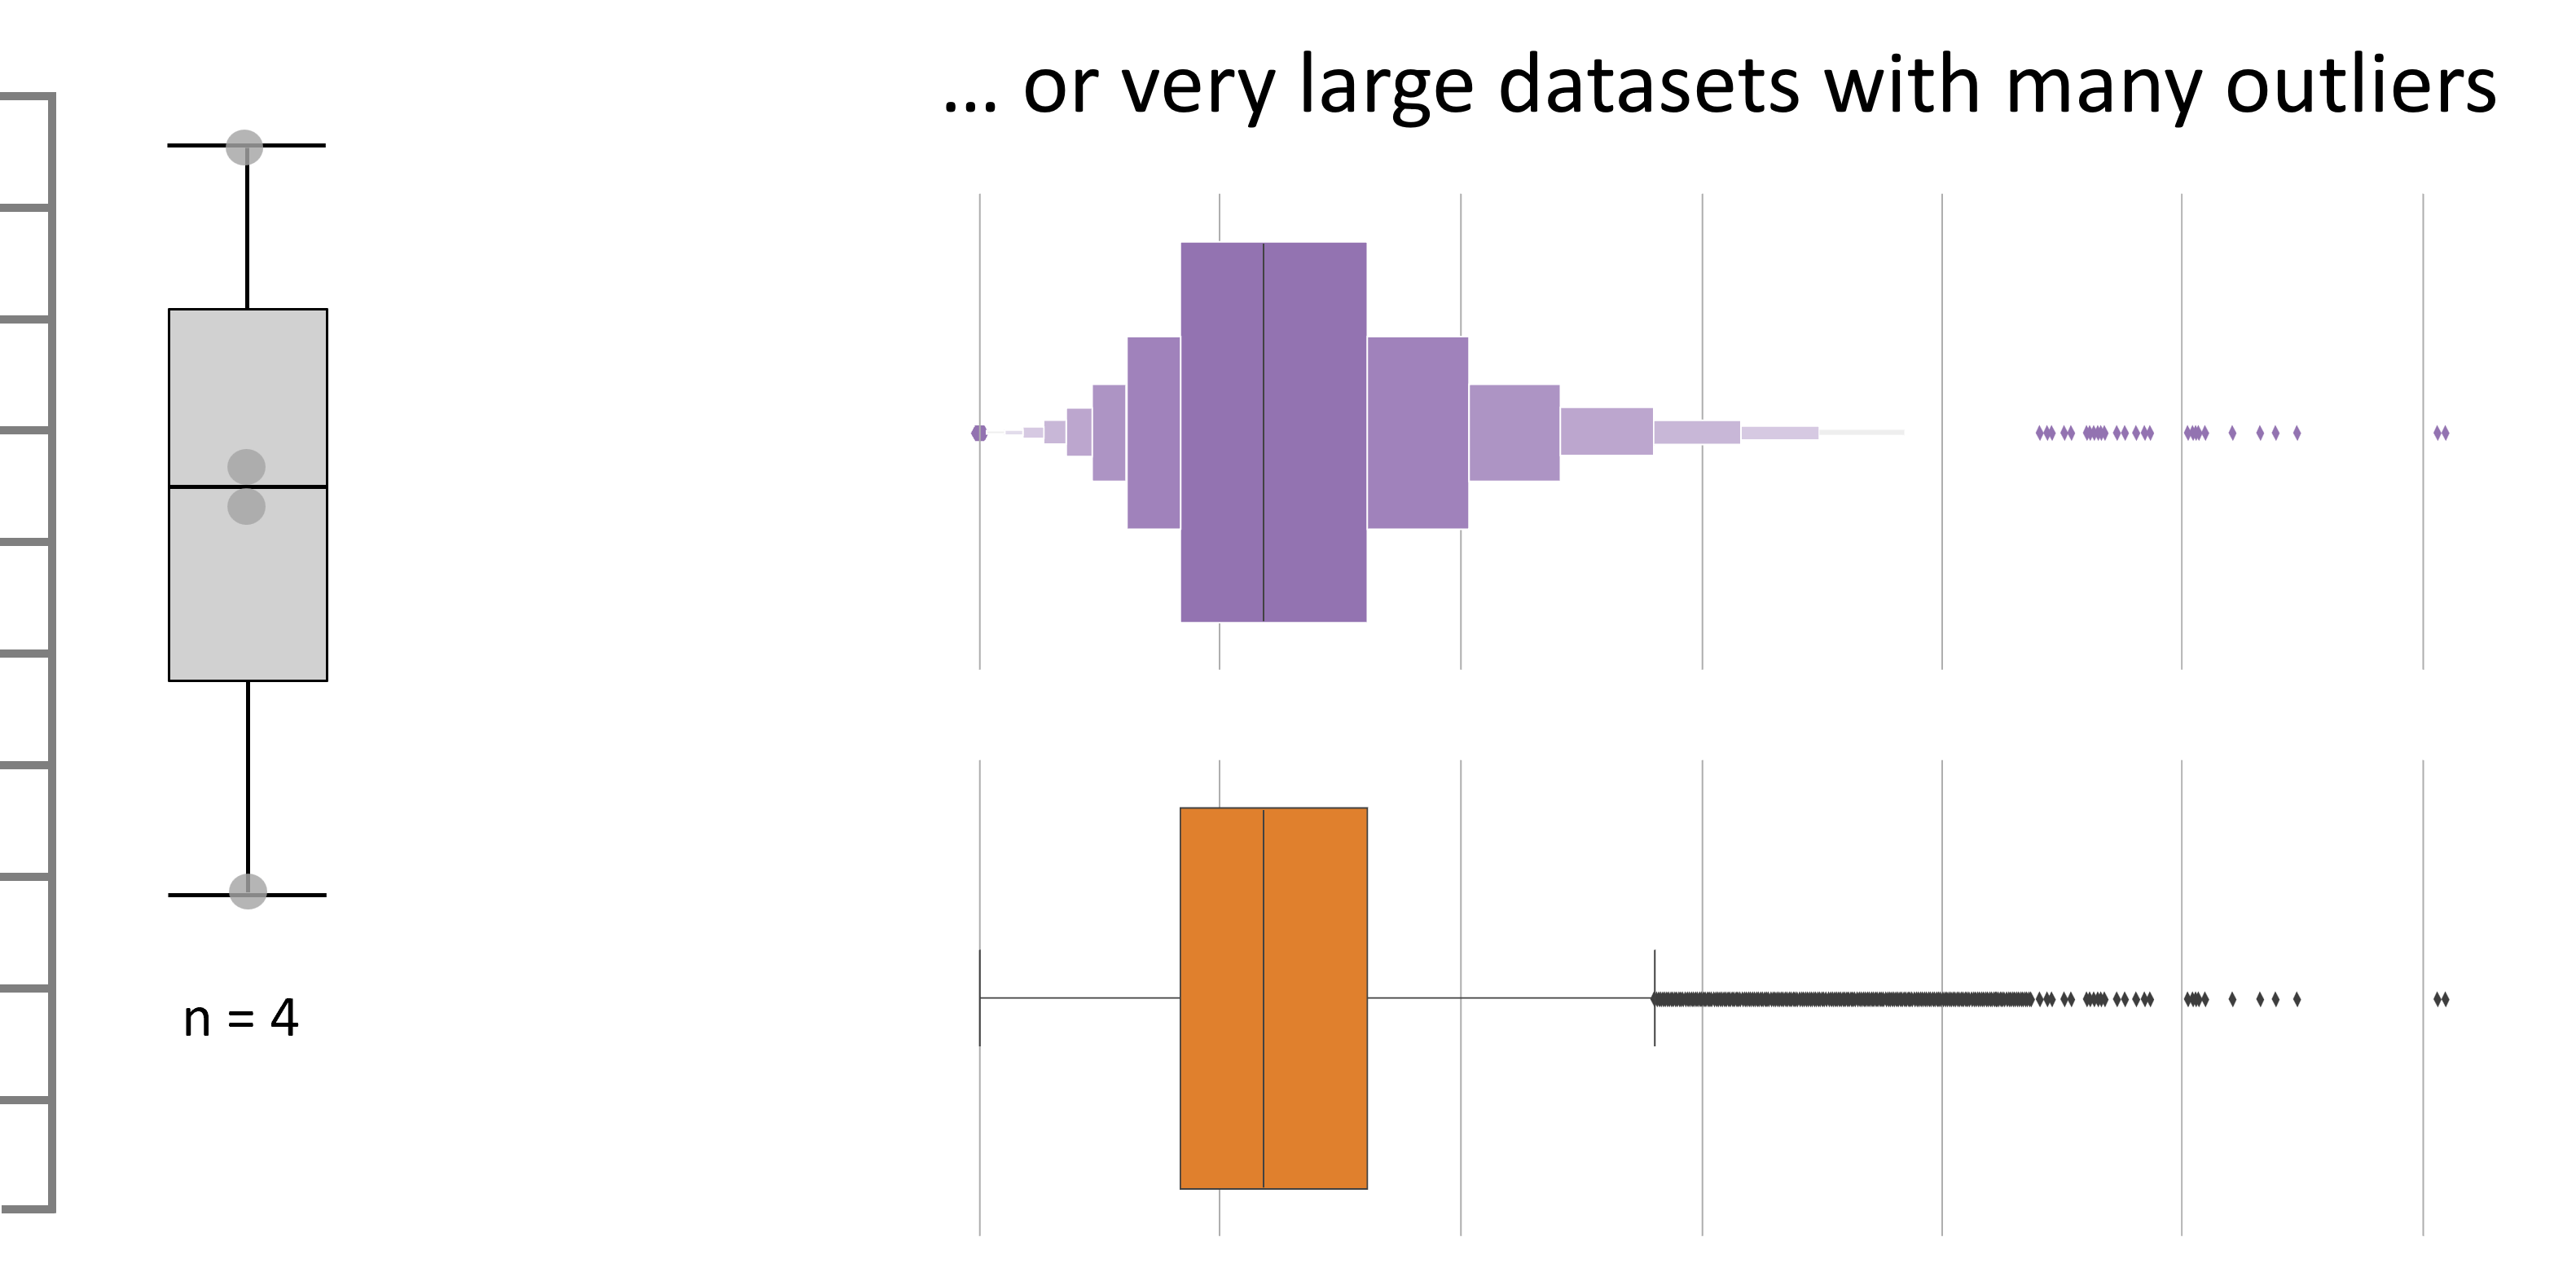
For large datasets, box plots can accurately reflect quartile summaries, yet a letter value plot might be preferable. It divides the data into finer increments such as eighths and sixteens, offering a more detailed view of the distribution, especially for understanding the higher values. This can be particularly useful when the dataset contains many outliers or is heavily skewed.
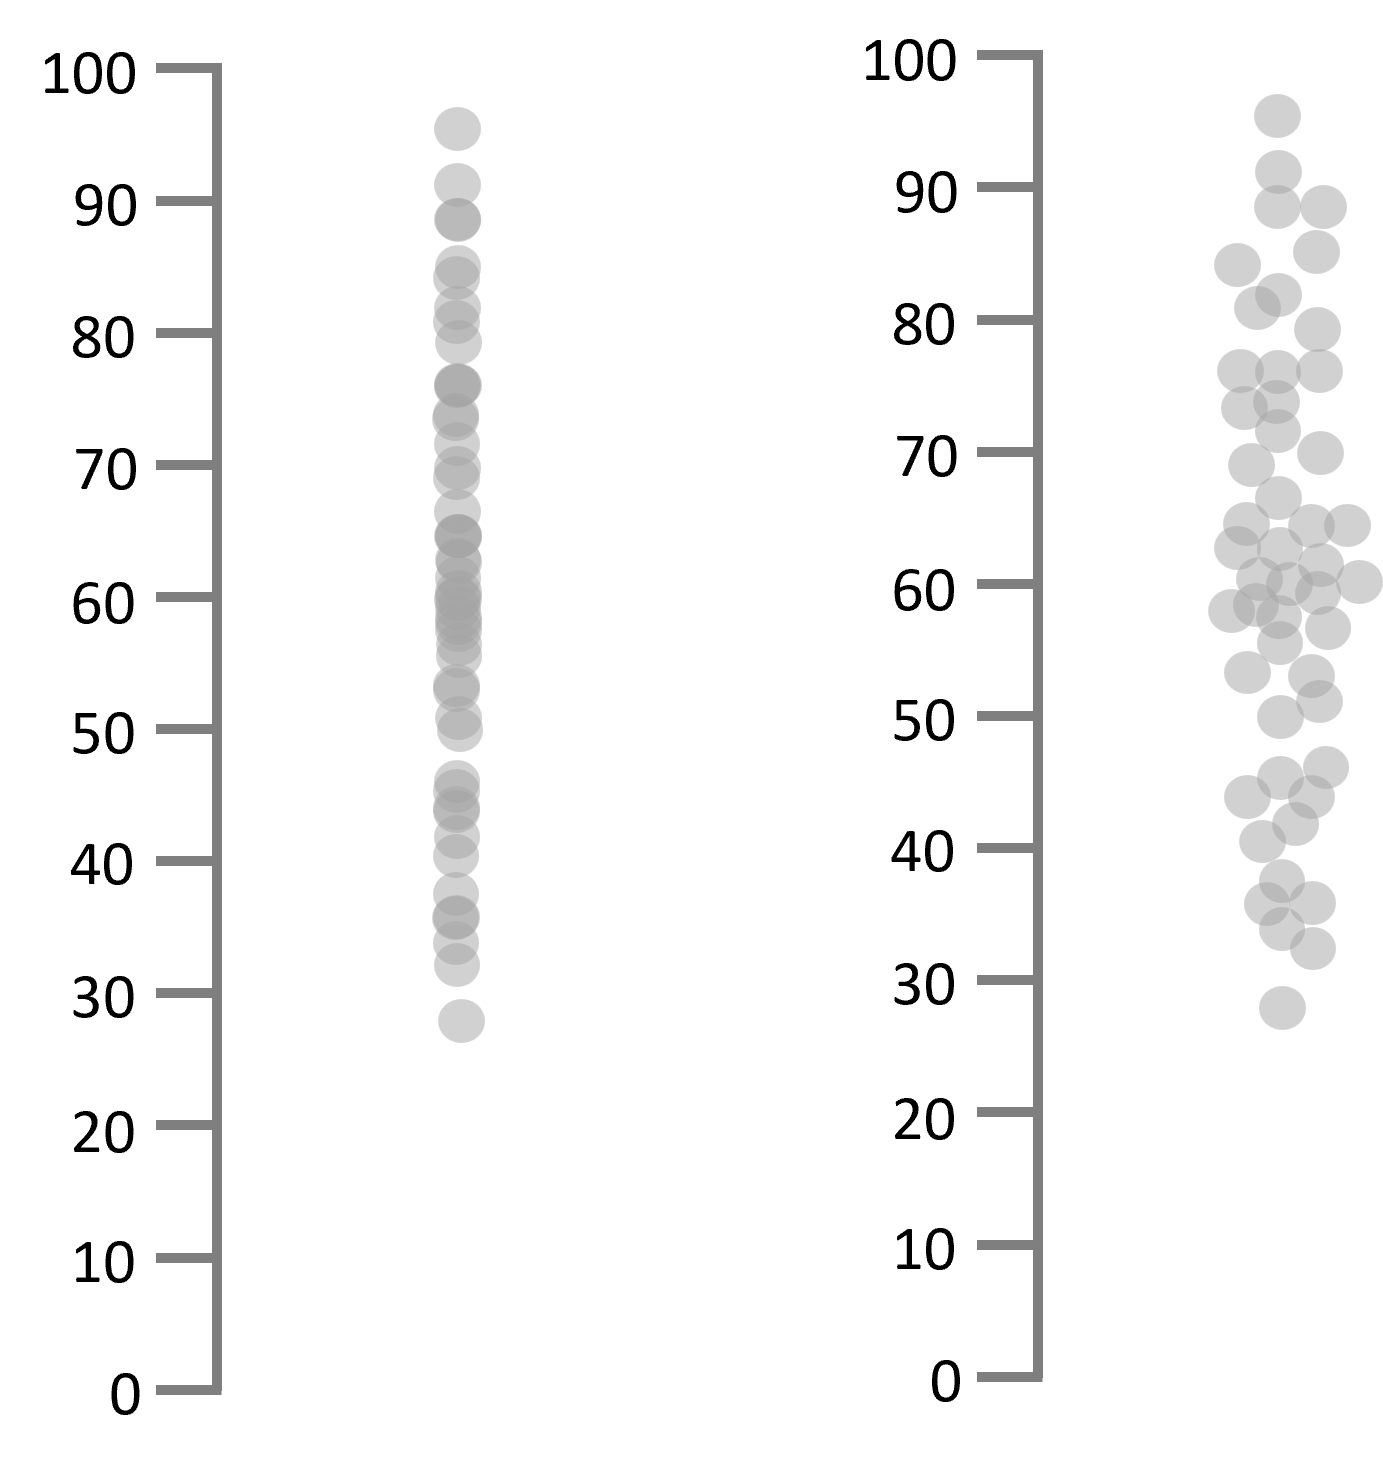
The strip plot and jittered strip plot, as shown in the example, provide a straightforward visualization of data distribution. The strip plot arranges data points along one axis, revealing clustering and potential gaps.
Its jittered variant adds a horizontal spread to each point to prevent overlap and offer a clearer view of the data's spread. While these plots highlight the distribution's shape, they don't specify central tendencies like median or quartiles, focusing instead on the overall distribution pattern.
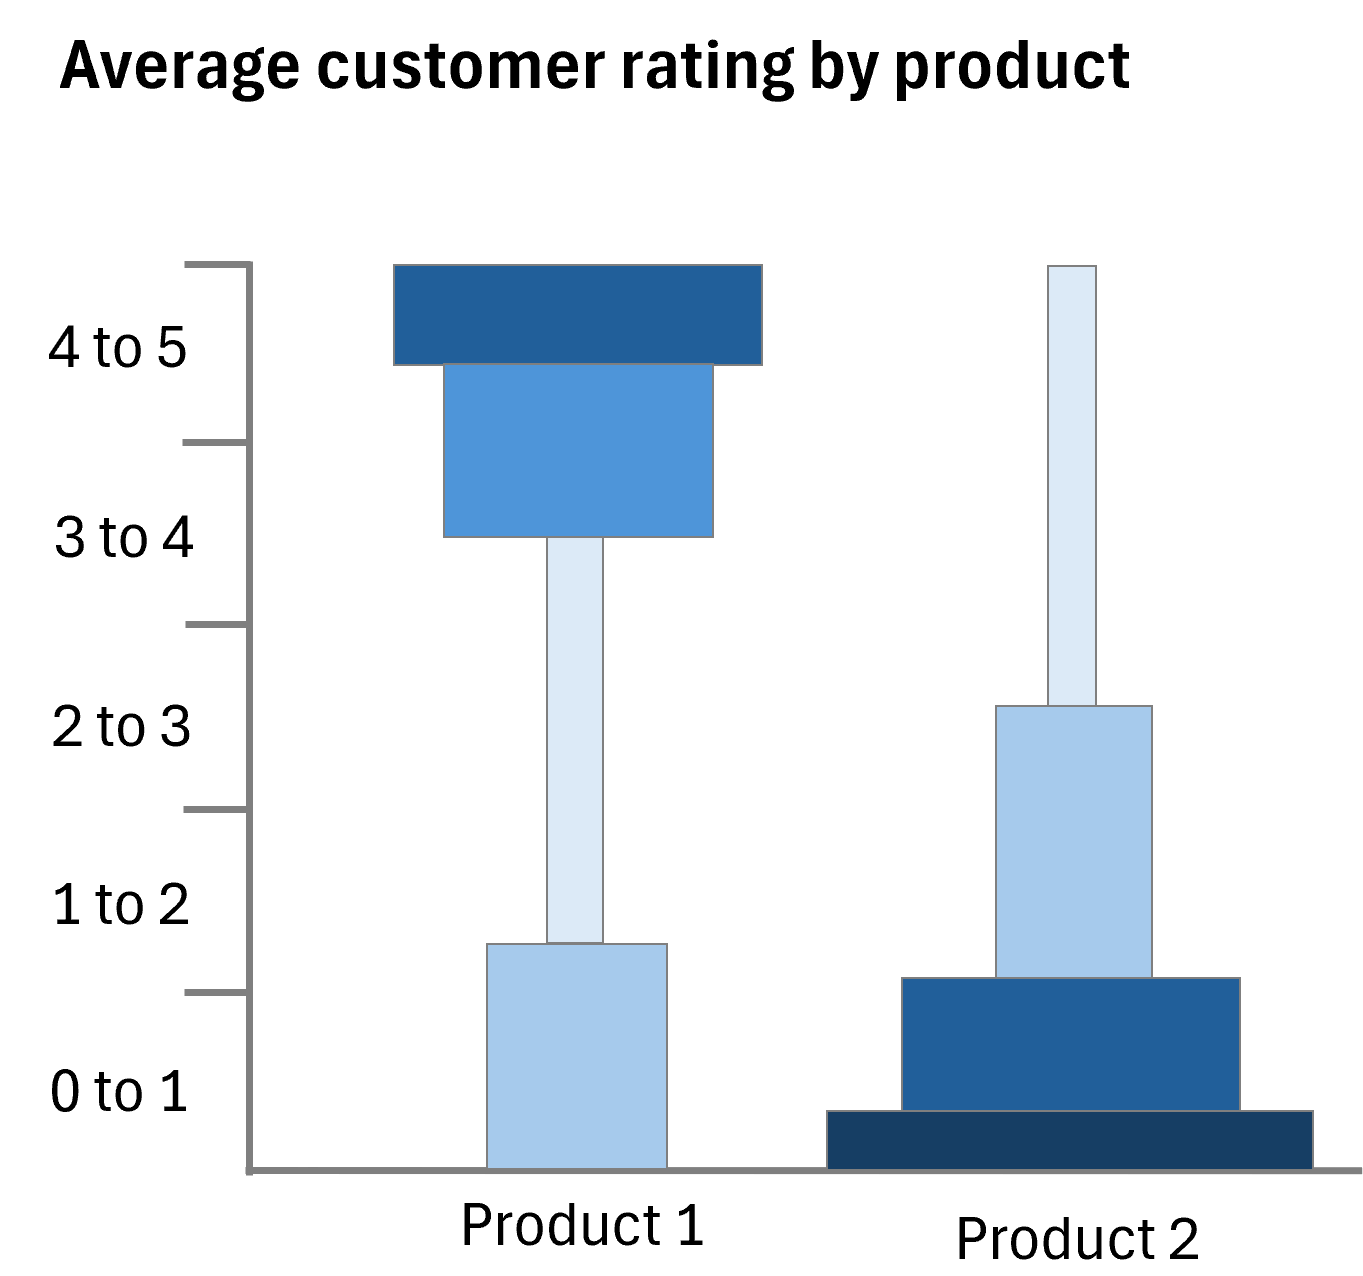
Distribution heatmaps offer a visual representation of data density by using color gradients to indicate the frequency of data points across different ranges.
In this graph, darker shades of blue indicate a higher frequency of customer ratings within a specific range. For Product 1, we see a concentration in the 4 to 5 rating brackets, while Product 2 has a lower rating score, with most ratings falling in the 0 to 1.
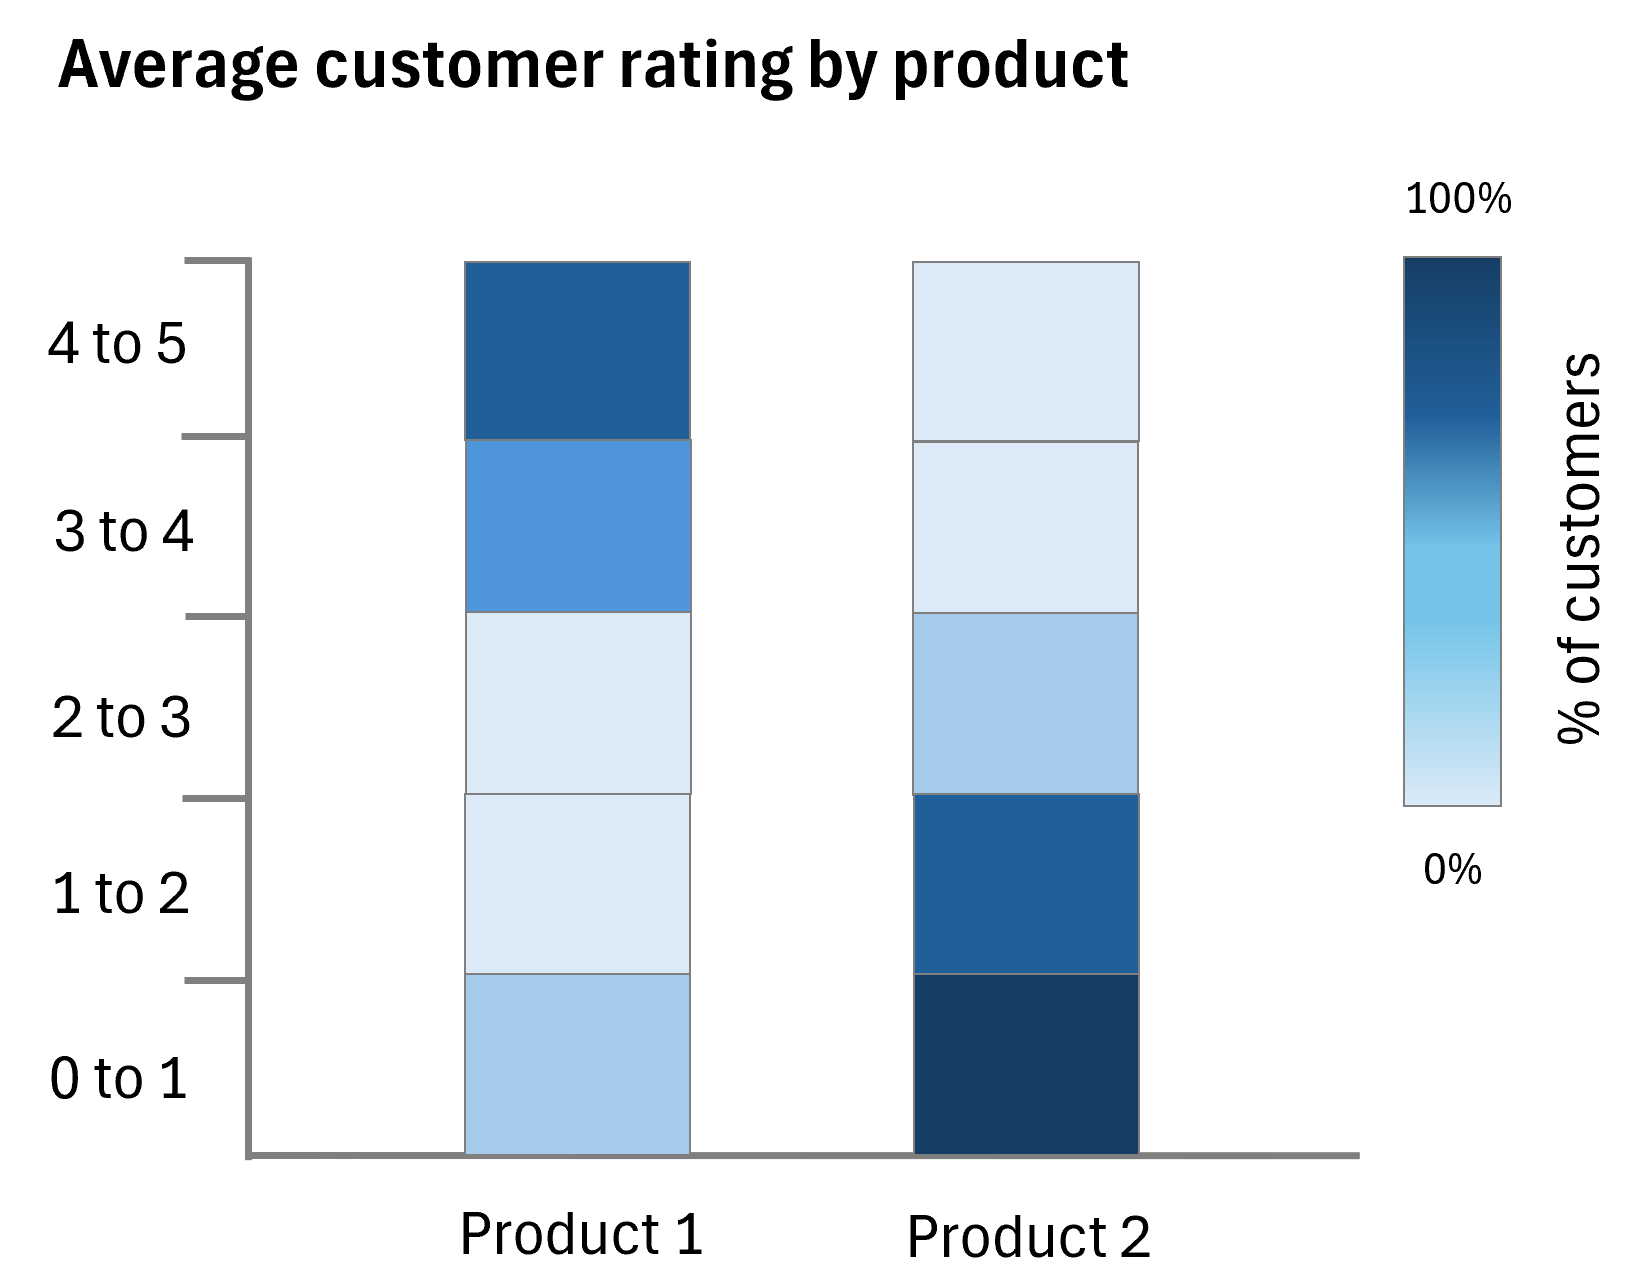
The chart below titled "Average customer rating by product" presents a comparison of customer satisfaction for two products using color gradients to denote the distribution of ratings. Product 1 shows a higher average rating, which indicates better customer satisfaction, while Product 2 has a lower score, suggesting less favorability.
The chart divides the range into quartiles and uses color gradients within each section to show the density of customer ratings within the quartile ranges for each product.
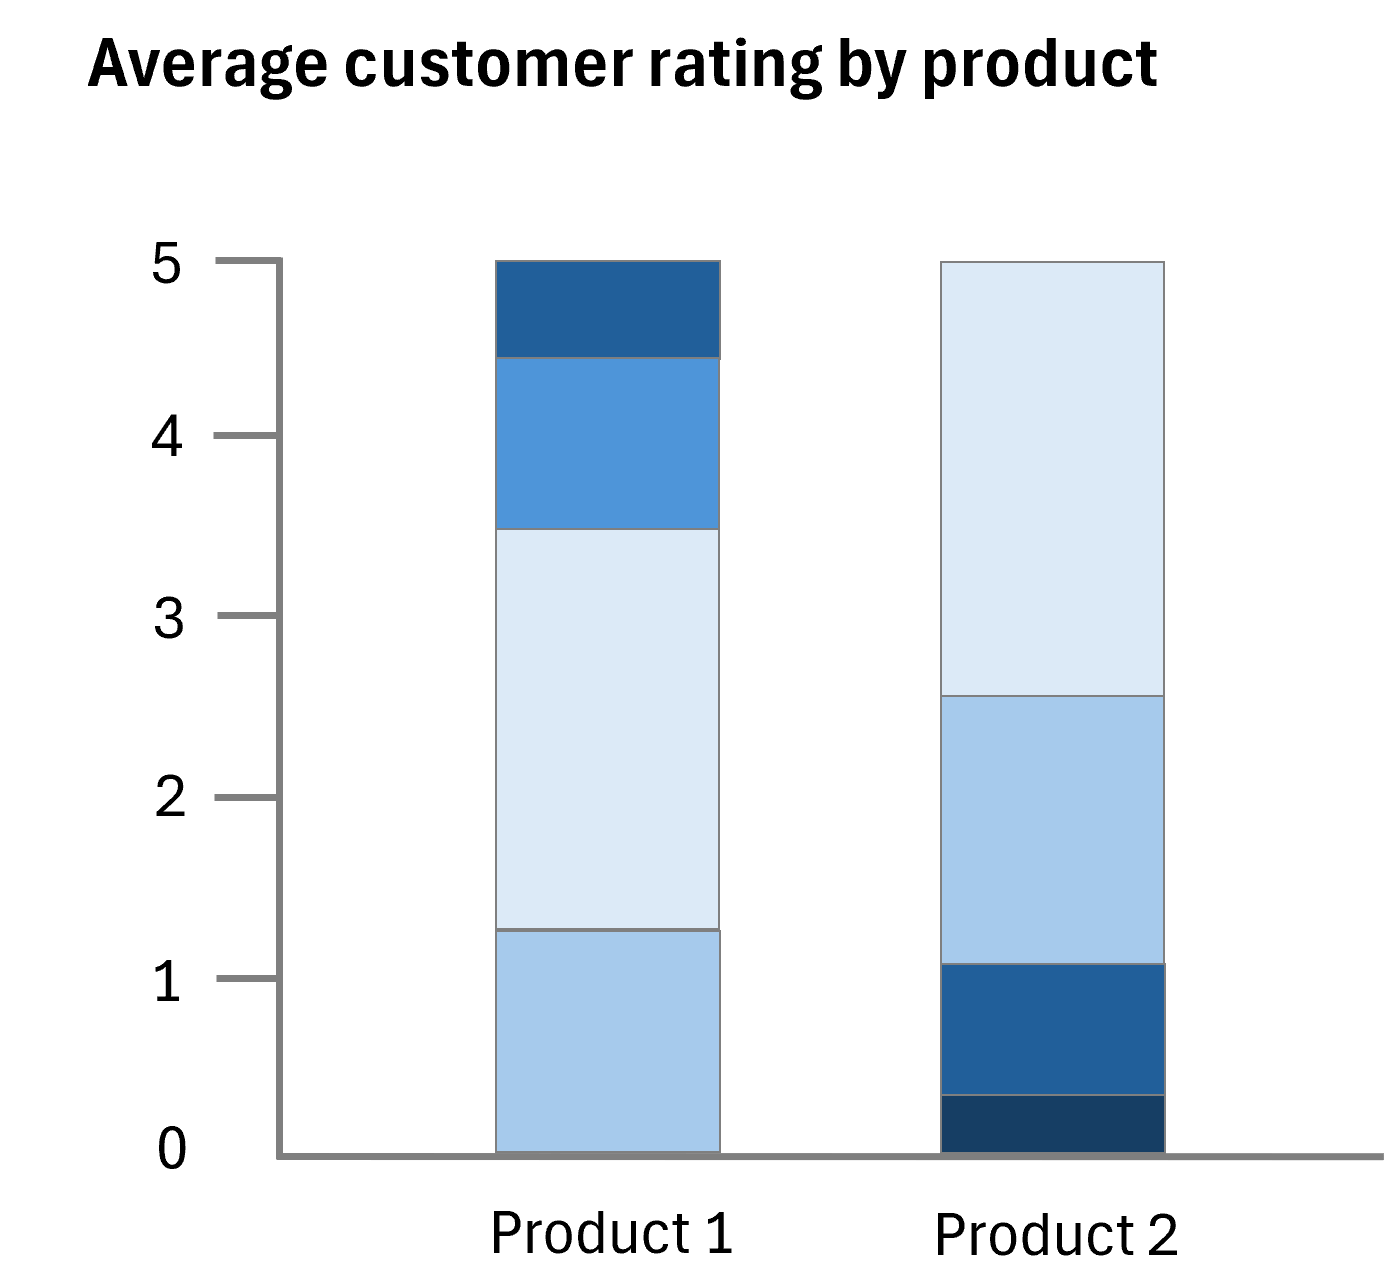
Histograms are a classic alternative to box plots, dividing data into intervals or bins and represent the count of data points within each bin using bars. They are effective for visualizing the shape and spread of data, showing the frequency distribution by dividing the axis into bins where points fall, allowing the observation of the distribution's shape and the number of modes present.
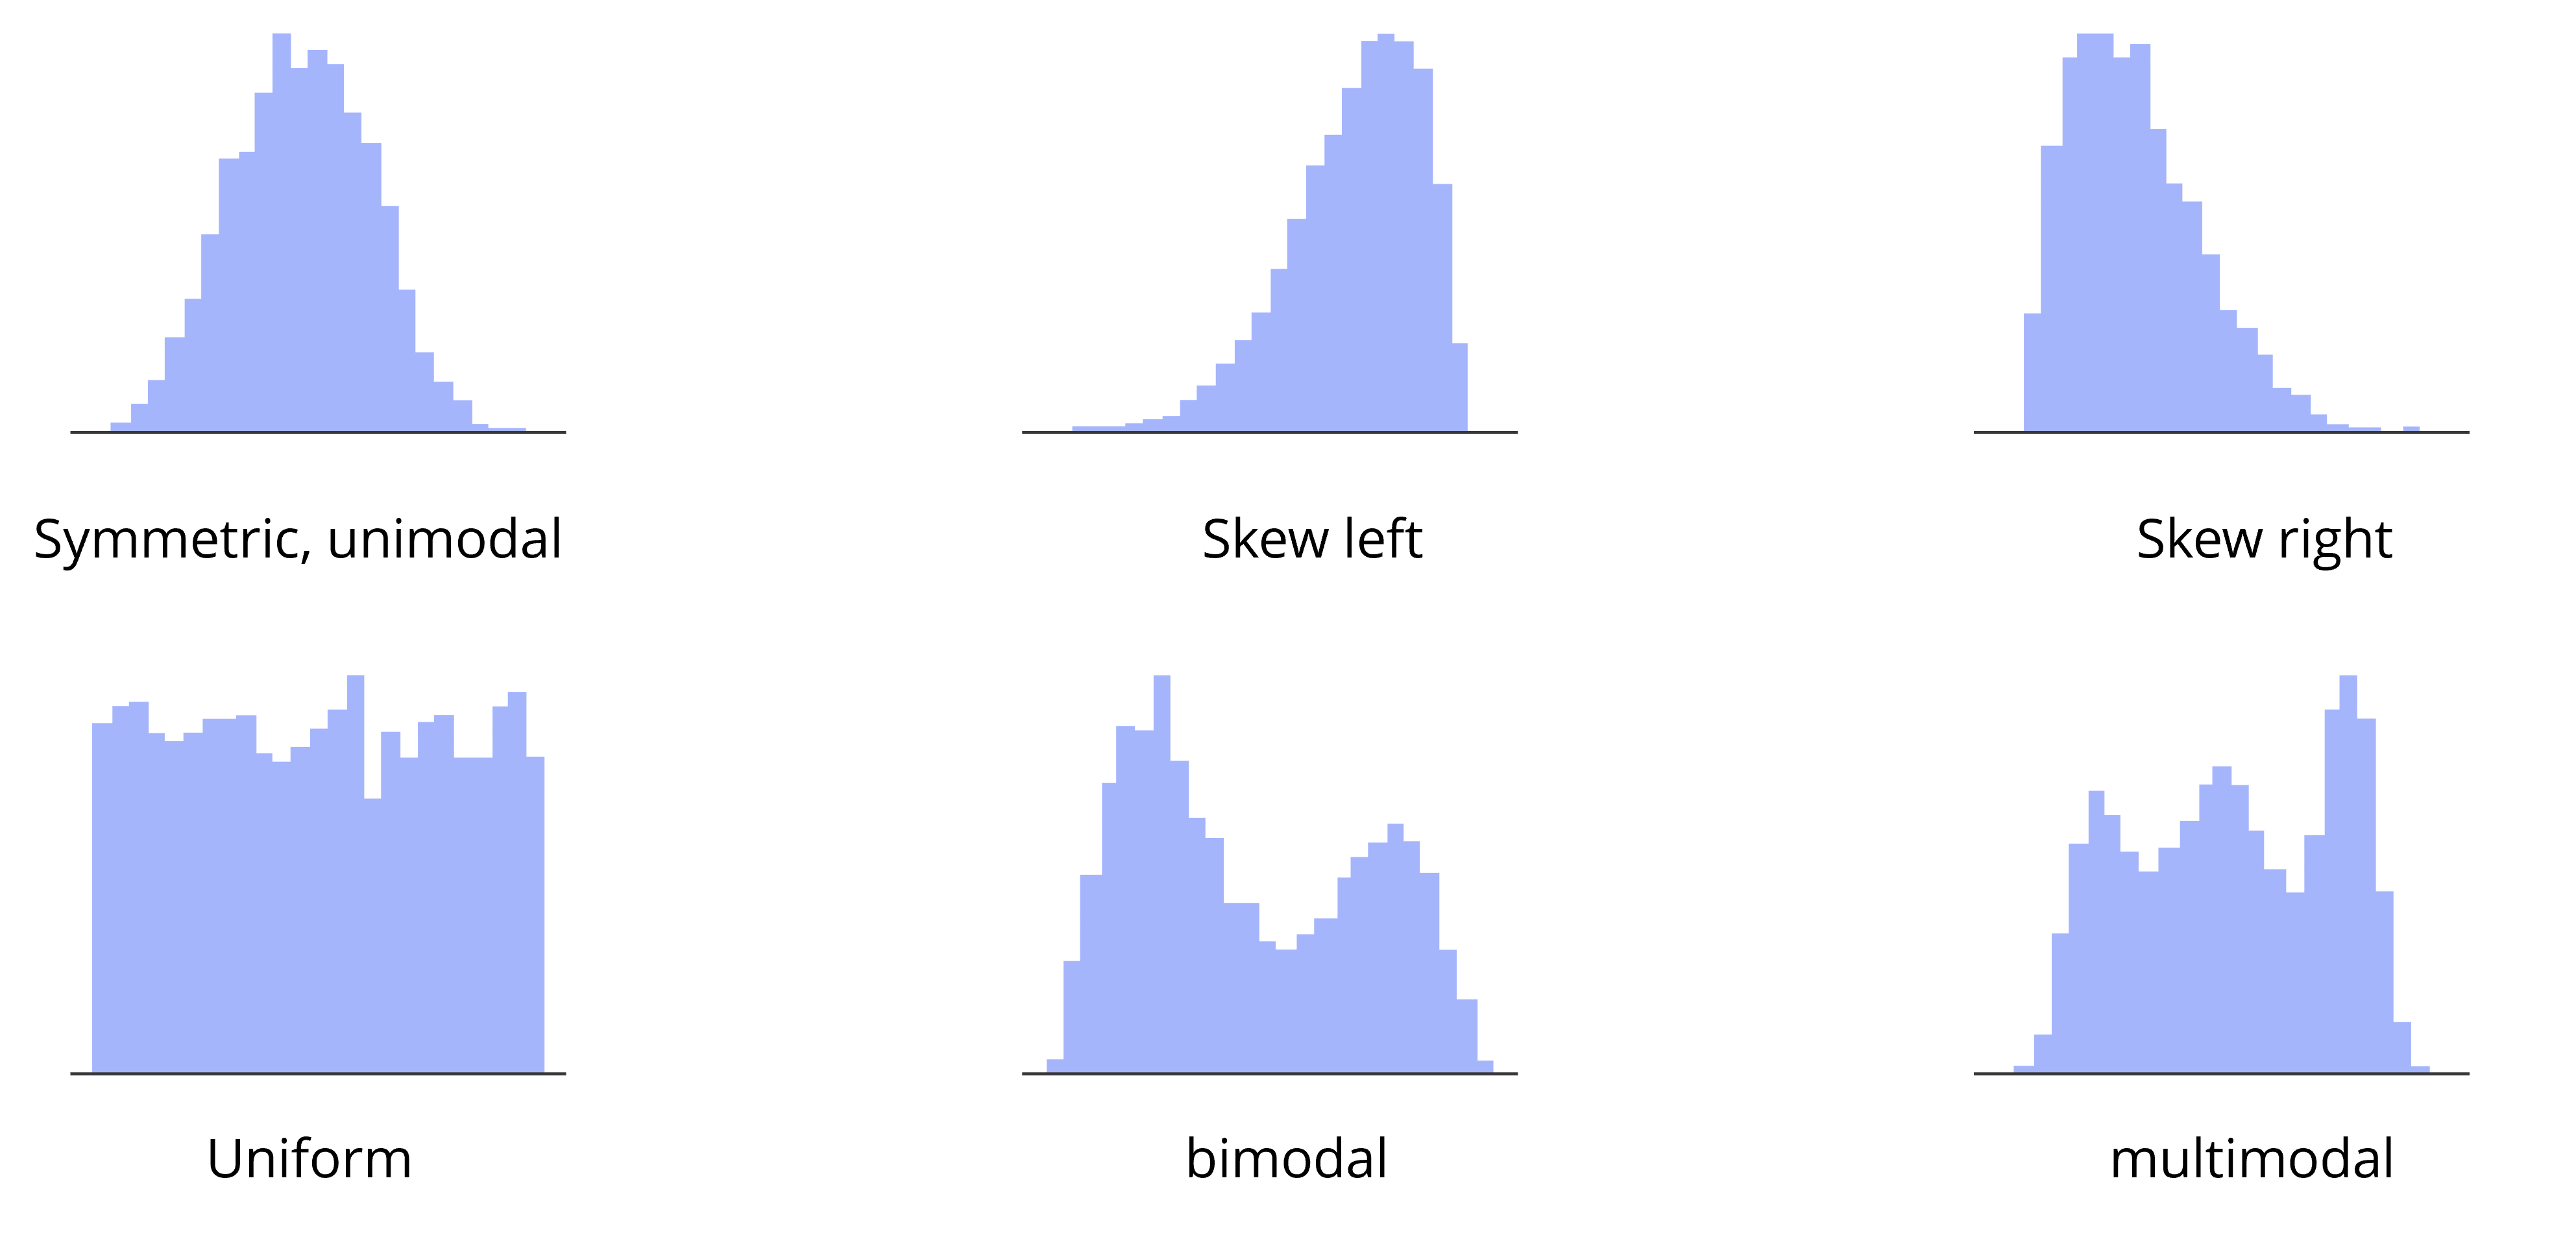
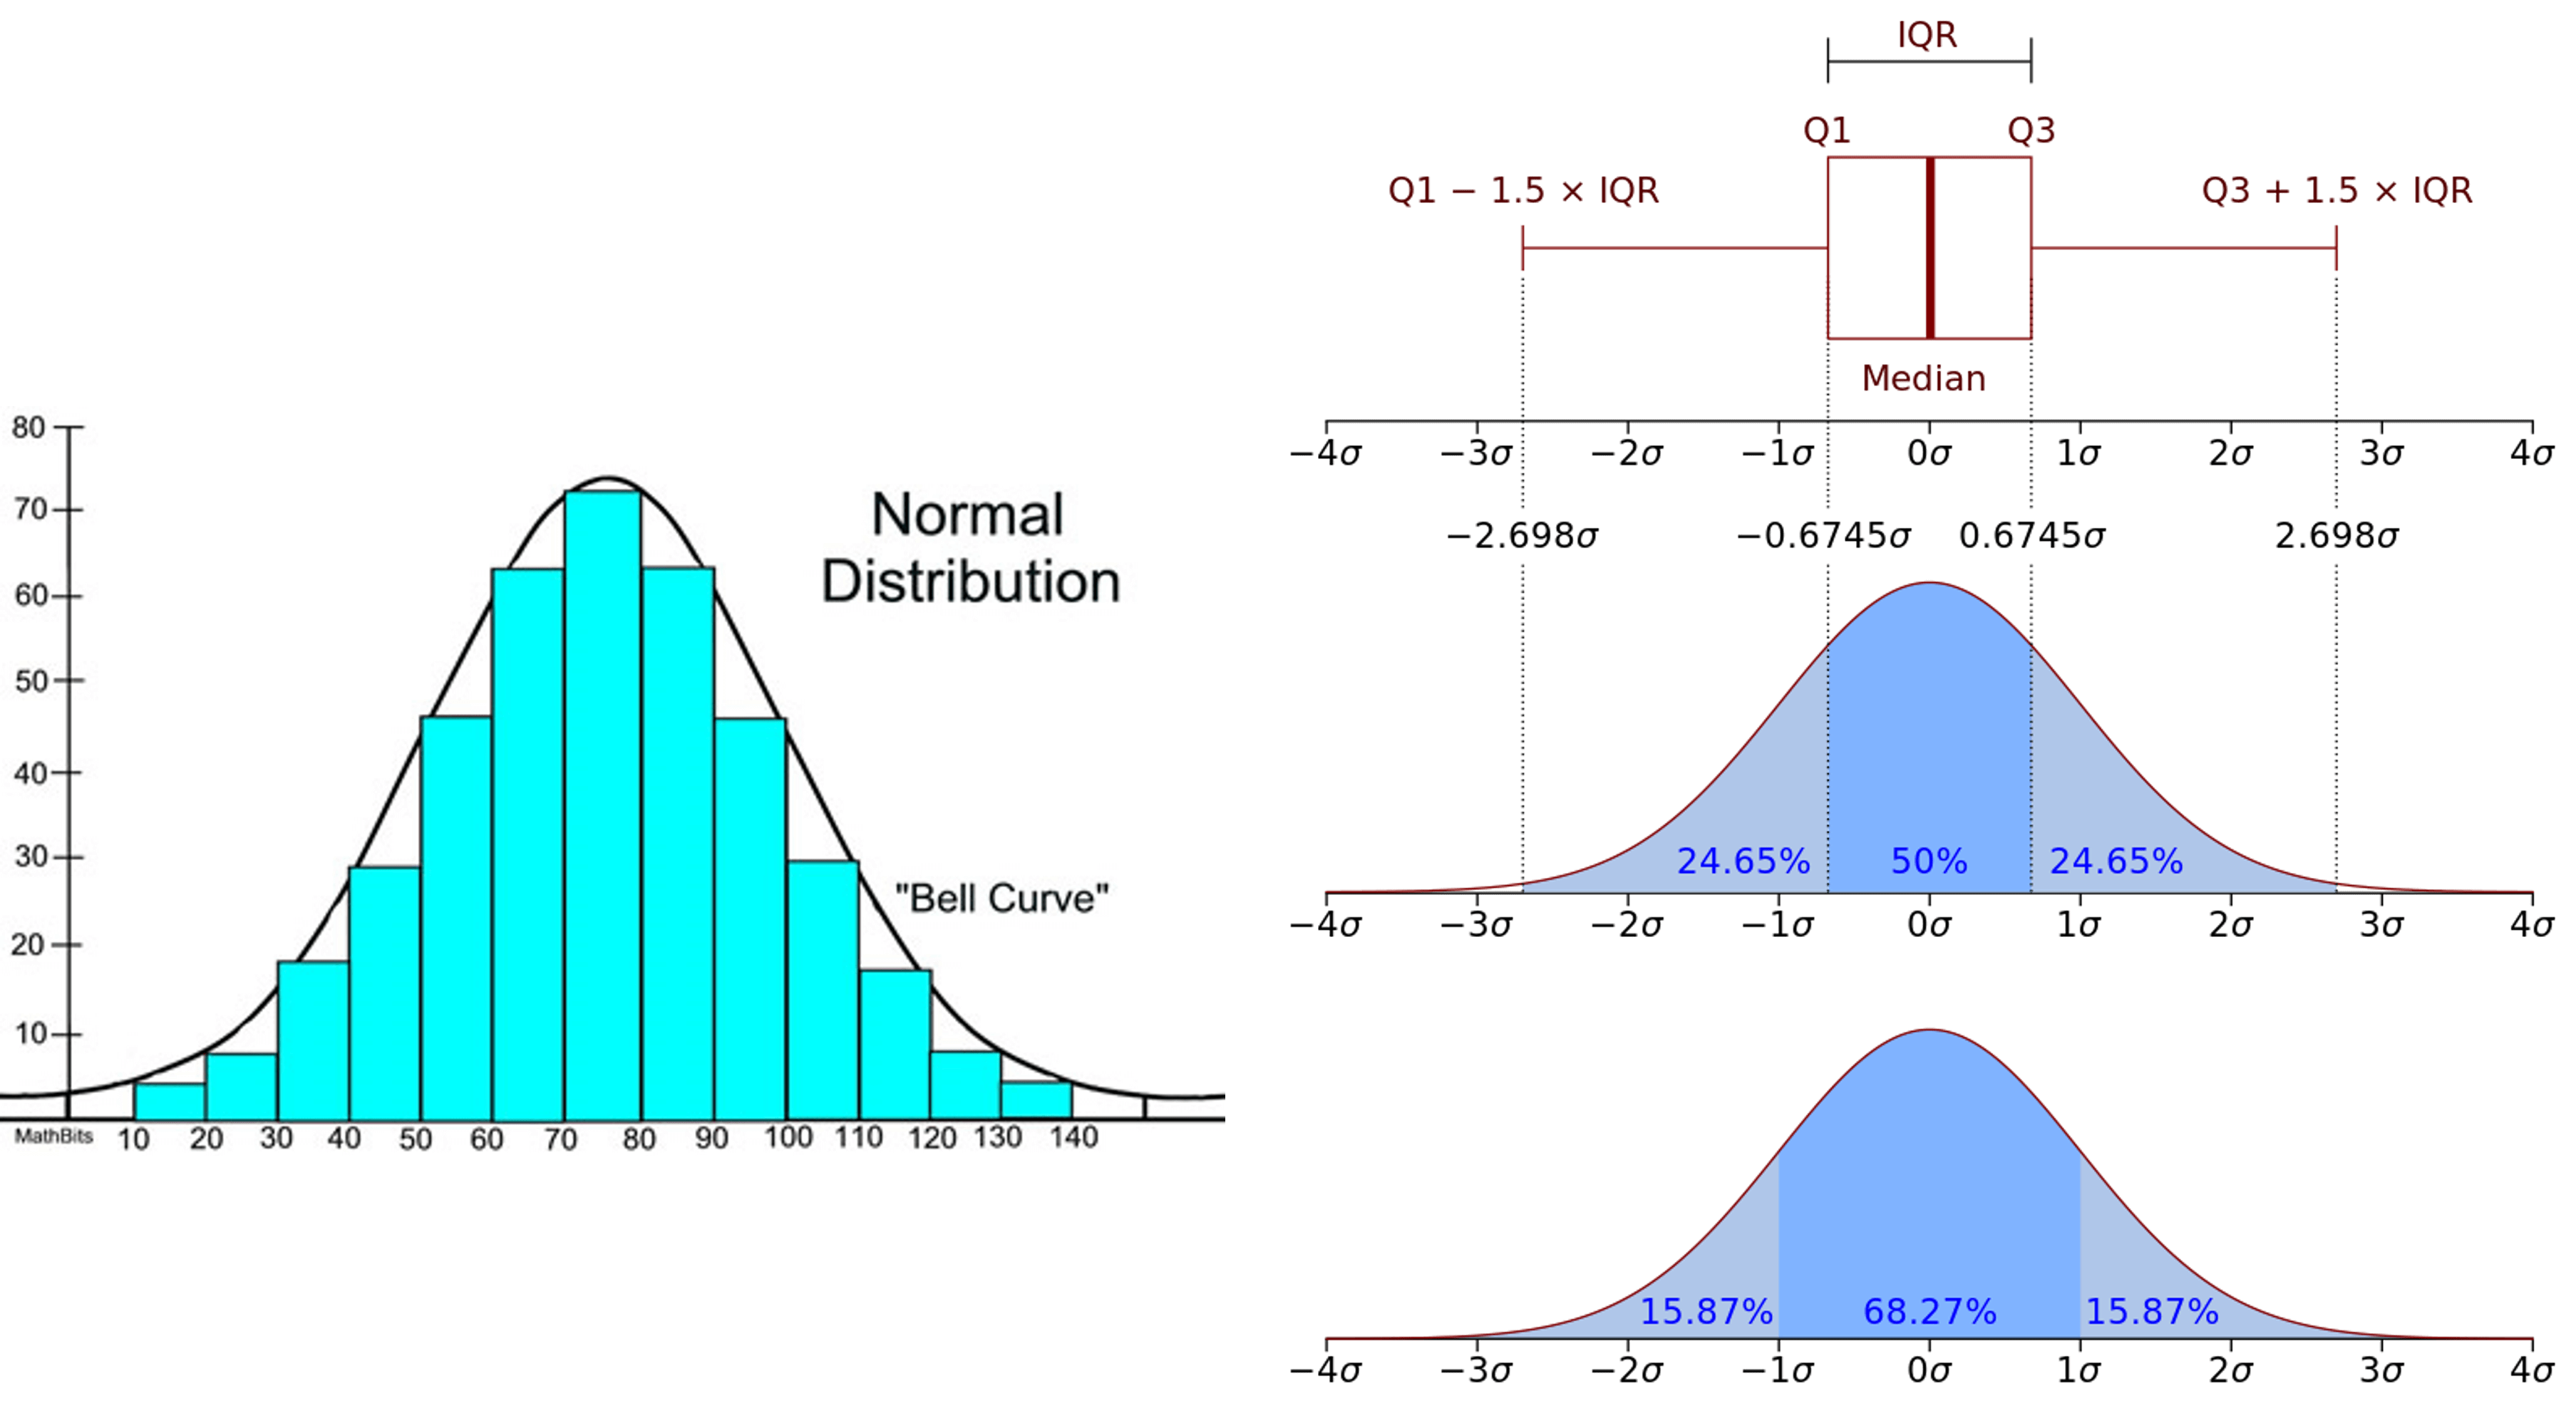
Distribution curves resemble frequency curves superimposed on a histogram, with the axes segmented into bins. They can also represent continuous data, providing a clear view of the distribution's shape.
There’s a clear link between these curves and the box plots, as the curves offer a smoothed perspective of data density, aiding in grasping the continuous data's underlying distribution.
Variable width plots adjust the bar width to reflect the density of points within each quartile, offering a visual emphasis on the data's distribution.
Meanwhile, letter-value plots go a step beyond, breaking down the data into more precise segments such as eighths, sixteenths etc. which can be particularly useful for large datasets with many outliers. Both these plot types present a refined analysis of the data, with letter-value plots showing more granularity and variable width plots emphasizing the distribution's density.
Box plots in Power BI are a valuable visual tool for understanding the distribution of data within a dataset. When using Inforiver Analytics+, users can create box plots with ease, allowing them to analyze and compare multiple measures in a single visual.
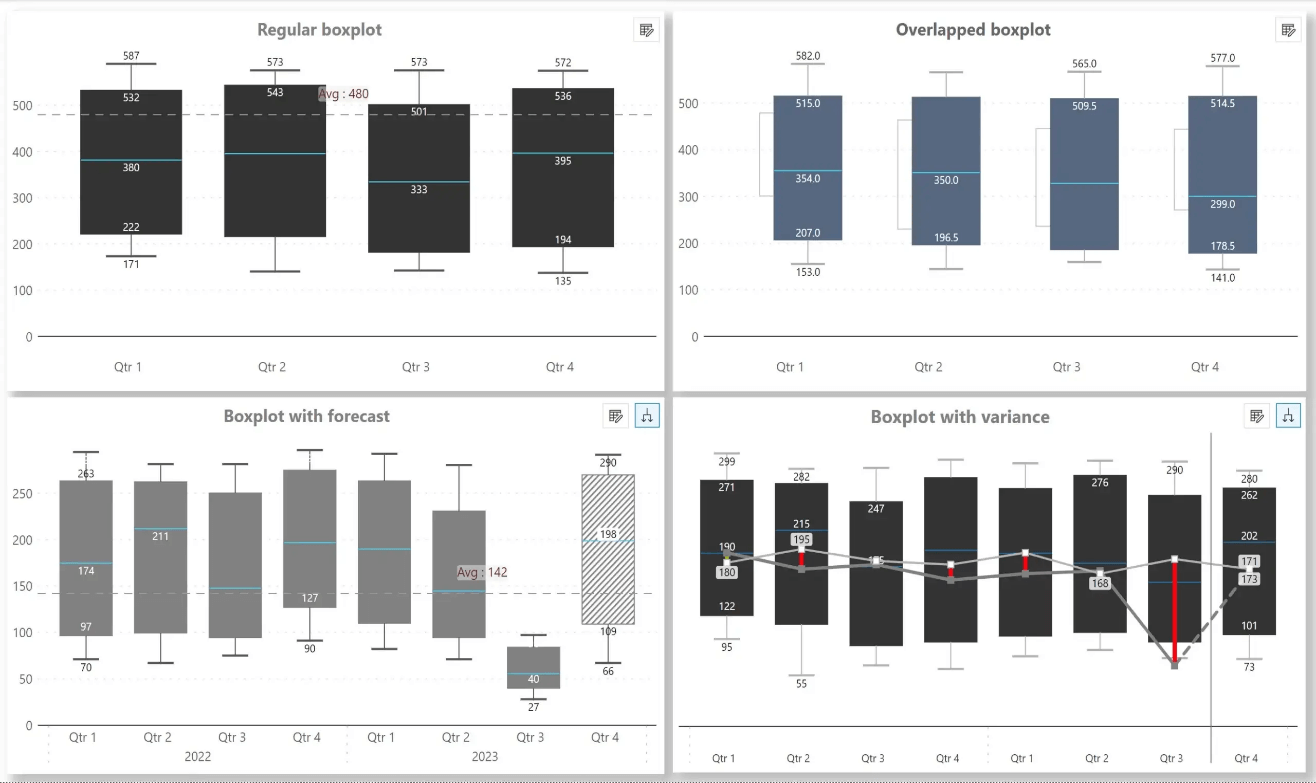
Inforiver Analytics+ offers various types of box plots, such as forecast box plots, small multiple box plots, and more, catering to different visualization requirements. In fact, the different box plot variations seen in this book have been created using Inforiver Analytics+.
Let us learn how to build a box plot in Power BI. Download your free copy of Inforiver Analytics+ from AppSource, and then follow these simple steps to create your box plot.
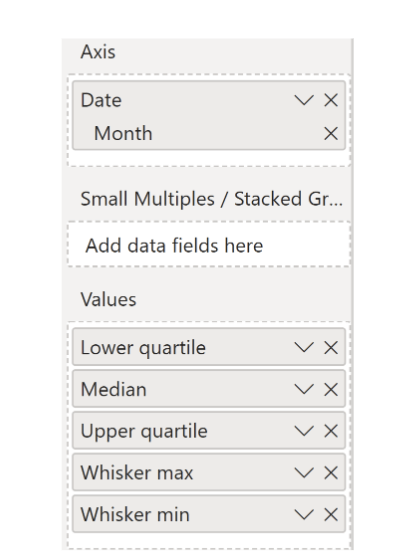
Step 1: To create a box plot, add your category under the Axis field and your pre-calculated quartile values under the Values field.
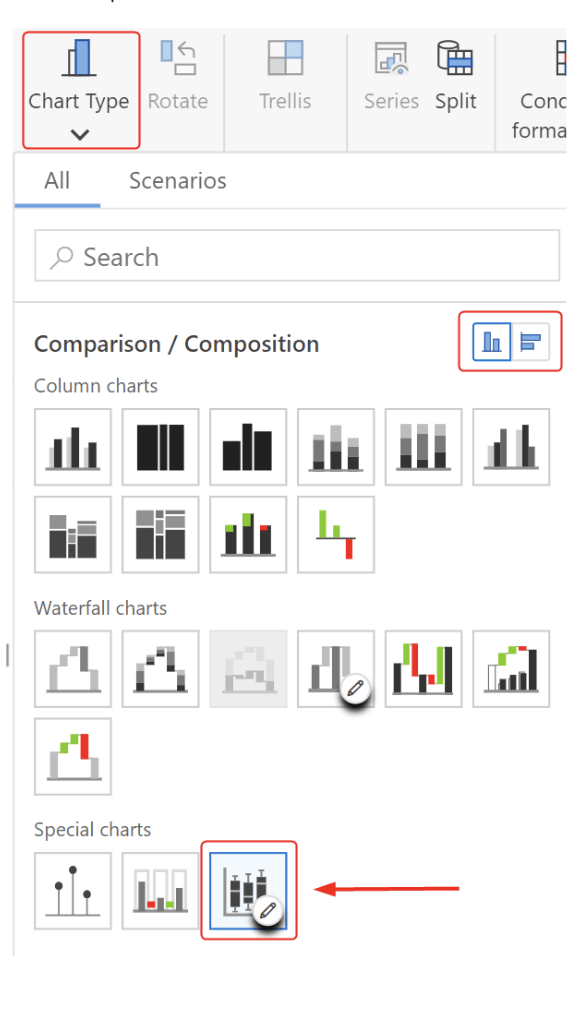
Step 2: In the chat type menu, select the vertical orientation and then the box plots chart type under the Special charts section.
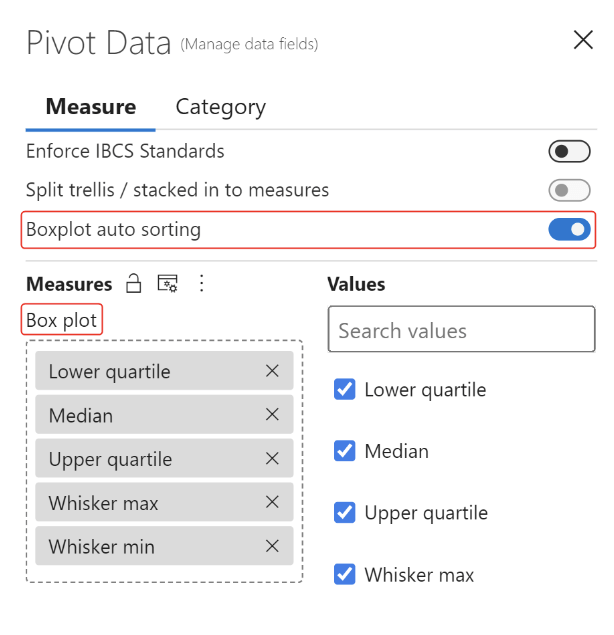
Step 3: Select the Pivot Data button at the top of the toolbar to manage your measures

Step 4: Add your measures under the Box plot section
A minimum of three measures (Lower quartile, Median, and Upper quartile) needs to be added under this section.
After assigning your measures, turn on the Box plot auto sorting toggle to automatically calculate box plot values.
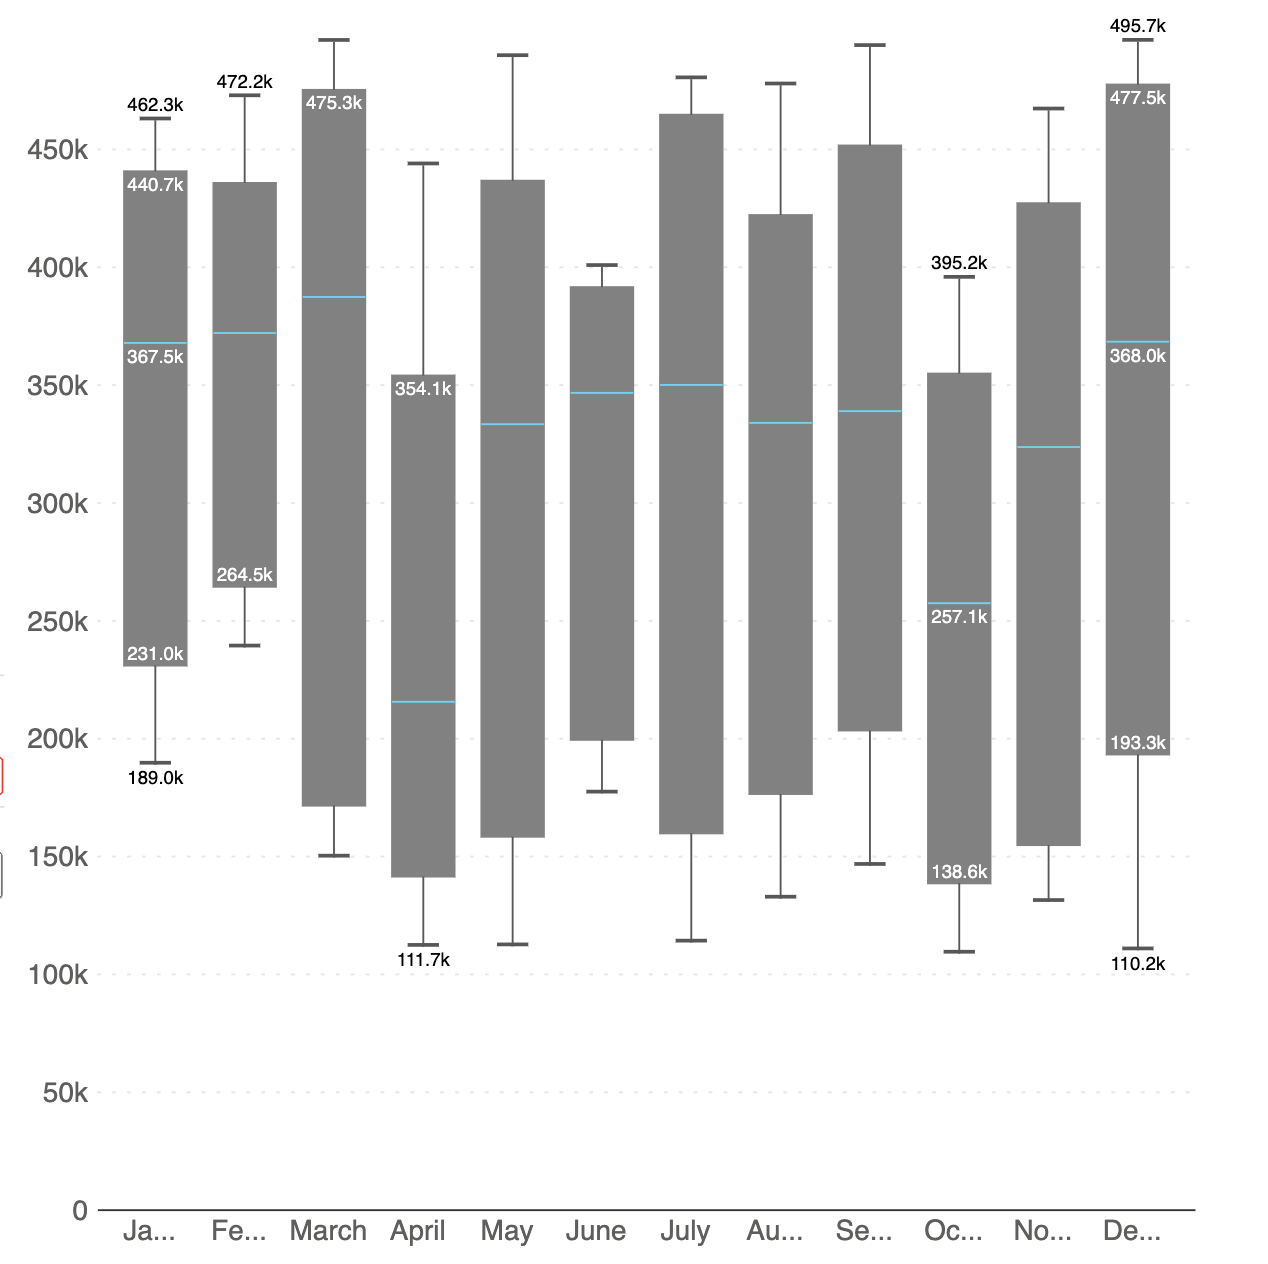
Your box plot is ready!
Check out this demo to explore variations of Inforiver box plots for powerful sales and financial analysis, which you can deliver each variation in less than a minute without any coding or scripting.
Watch the webinar replay on box plots in Power BI here.
Elevate your data storytelling with visually stunning and informative charts by trying Inforiver Analytics+ here.