Upcoming webinar on 'Inforiver Charts : The fastest way to deliver stories in Power BI', Aug 29th , Monday, 10.30 AM CST. Register Now
Upcoming webinar on 'Inforiver Charts : The fastest way to deliver stories in Power BI', Aug 29th , Monday, 10.30 AM CST. Register Now
The power to dive into any level of analysis, live and on-demand is achievable with the combination of Inforiver and Power BI bookmarks.
Business reporting relies on analyzing complex multi-page reports that integrate data from diverse source systems. Effectively conveying key insights to stakeholders involves filtering, ranking, formatting, and sorting your data to capture multiple perspectives. Inforiver Matrix is a comprehensive solution for your business reporting requirements. It provides advanced data exploration and analytical capabilities like Top N, pivot, annotations, and hierarchical navigation.
Discover how to leverage Power BI bookmarks in your Inforiver Writeback Matrix and Reporting Matrix reports to save and instantly retrieve your data interactions and observations. This feature is available from:
Explore version-specific features and enhancements here.
How to enable Power BI bookmarks in the Reading view
Report users can save their analysis with Power BI bookmarks. Remember to turn on the Enable Read View Bookmarking toggle from the APS Settings > Format visual > Miscellaneous section. When this option is disabled, report users can still create Power BI bookmarks, but the changes won’t be saved.
Let’s dive into some popular Inforiver Matrix analysis use cases perfect for bookmarking.
Present your multivariate analysis by saving filters and custom sorting. In this report, we’ve filtered the row categories based on regions, sorted data by profit, and displayed only profitability-related metrics (Sales, COGS, and Profit). Finally, the changes are stored with bookmarks.
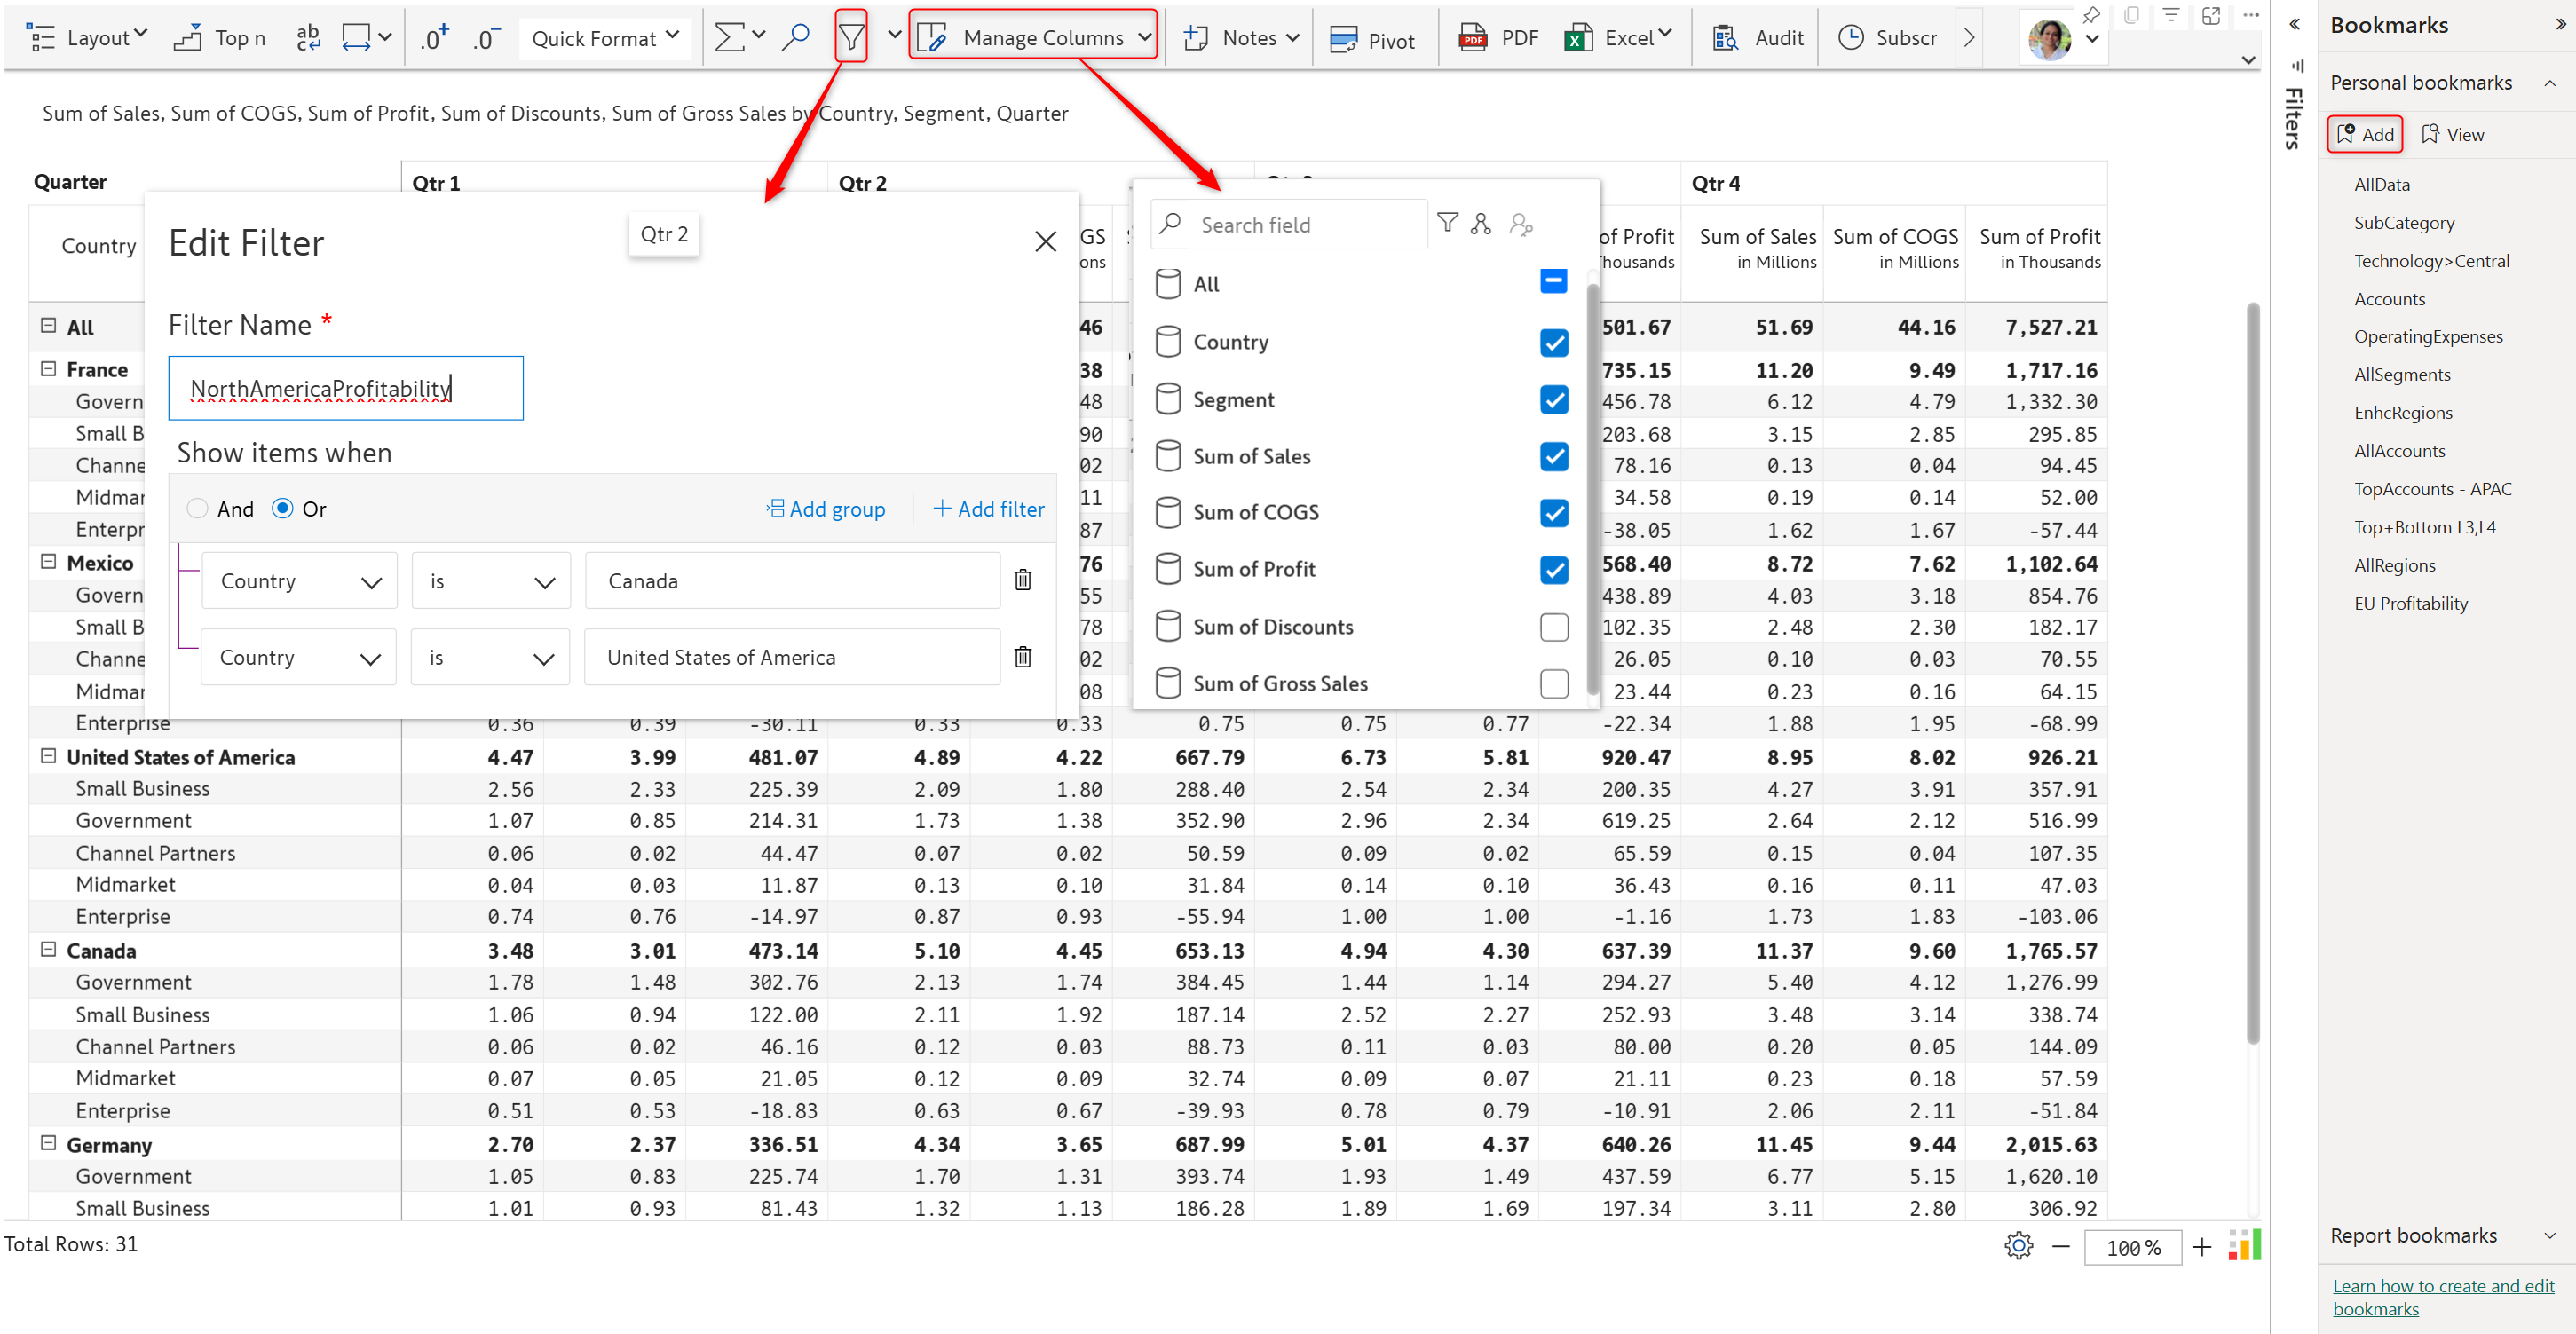
Notice how the measures, sort order, and row dimensions change based on the bookmark selected.
Tailor your reports to specific audiences by changing the layout. You can bookmark layouts like Hierarchy, Stepped, or Drilldown and display your measures as rows or columns.
Bookmarks are a key tool for navigating hierarchical dimensions and presenting insights at different granularities. Using bookmarks preserves analysis and details while expanding and collapsing the hierarchy. Notice how the formatting is retained when we switch between bookmarks.
Ranking data enables businesses to prioritize and identify focus areas.
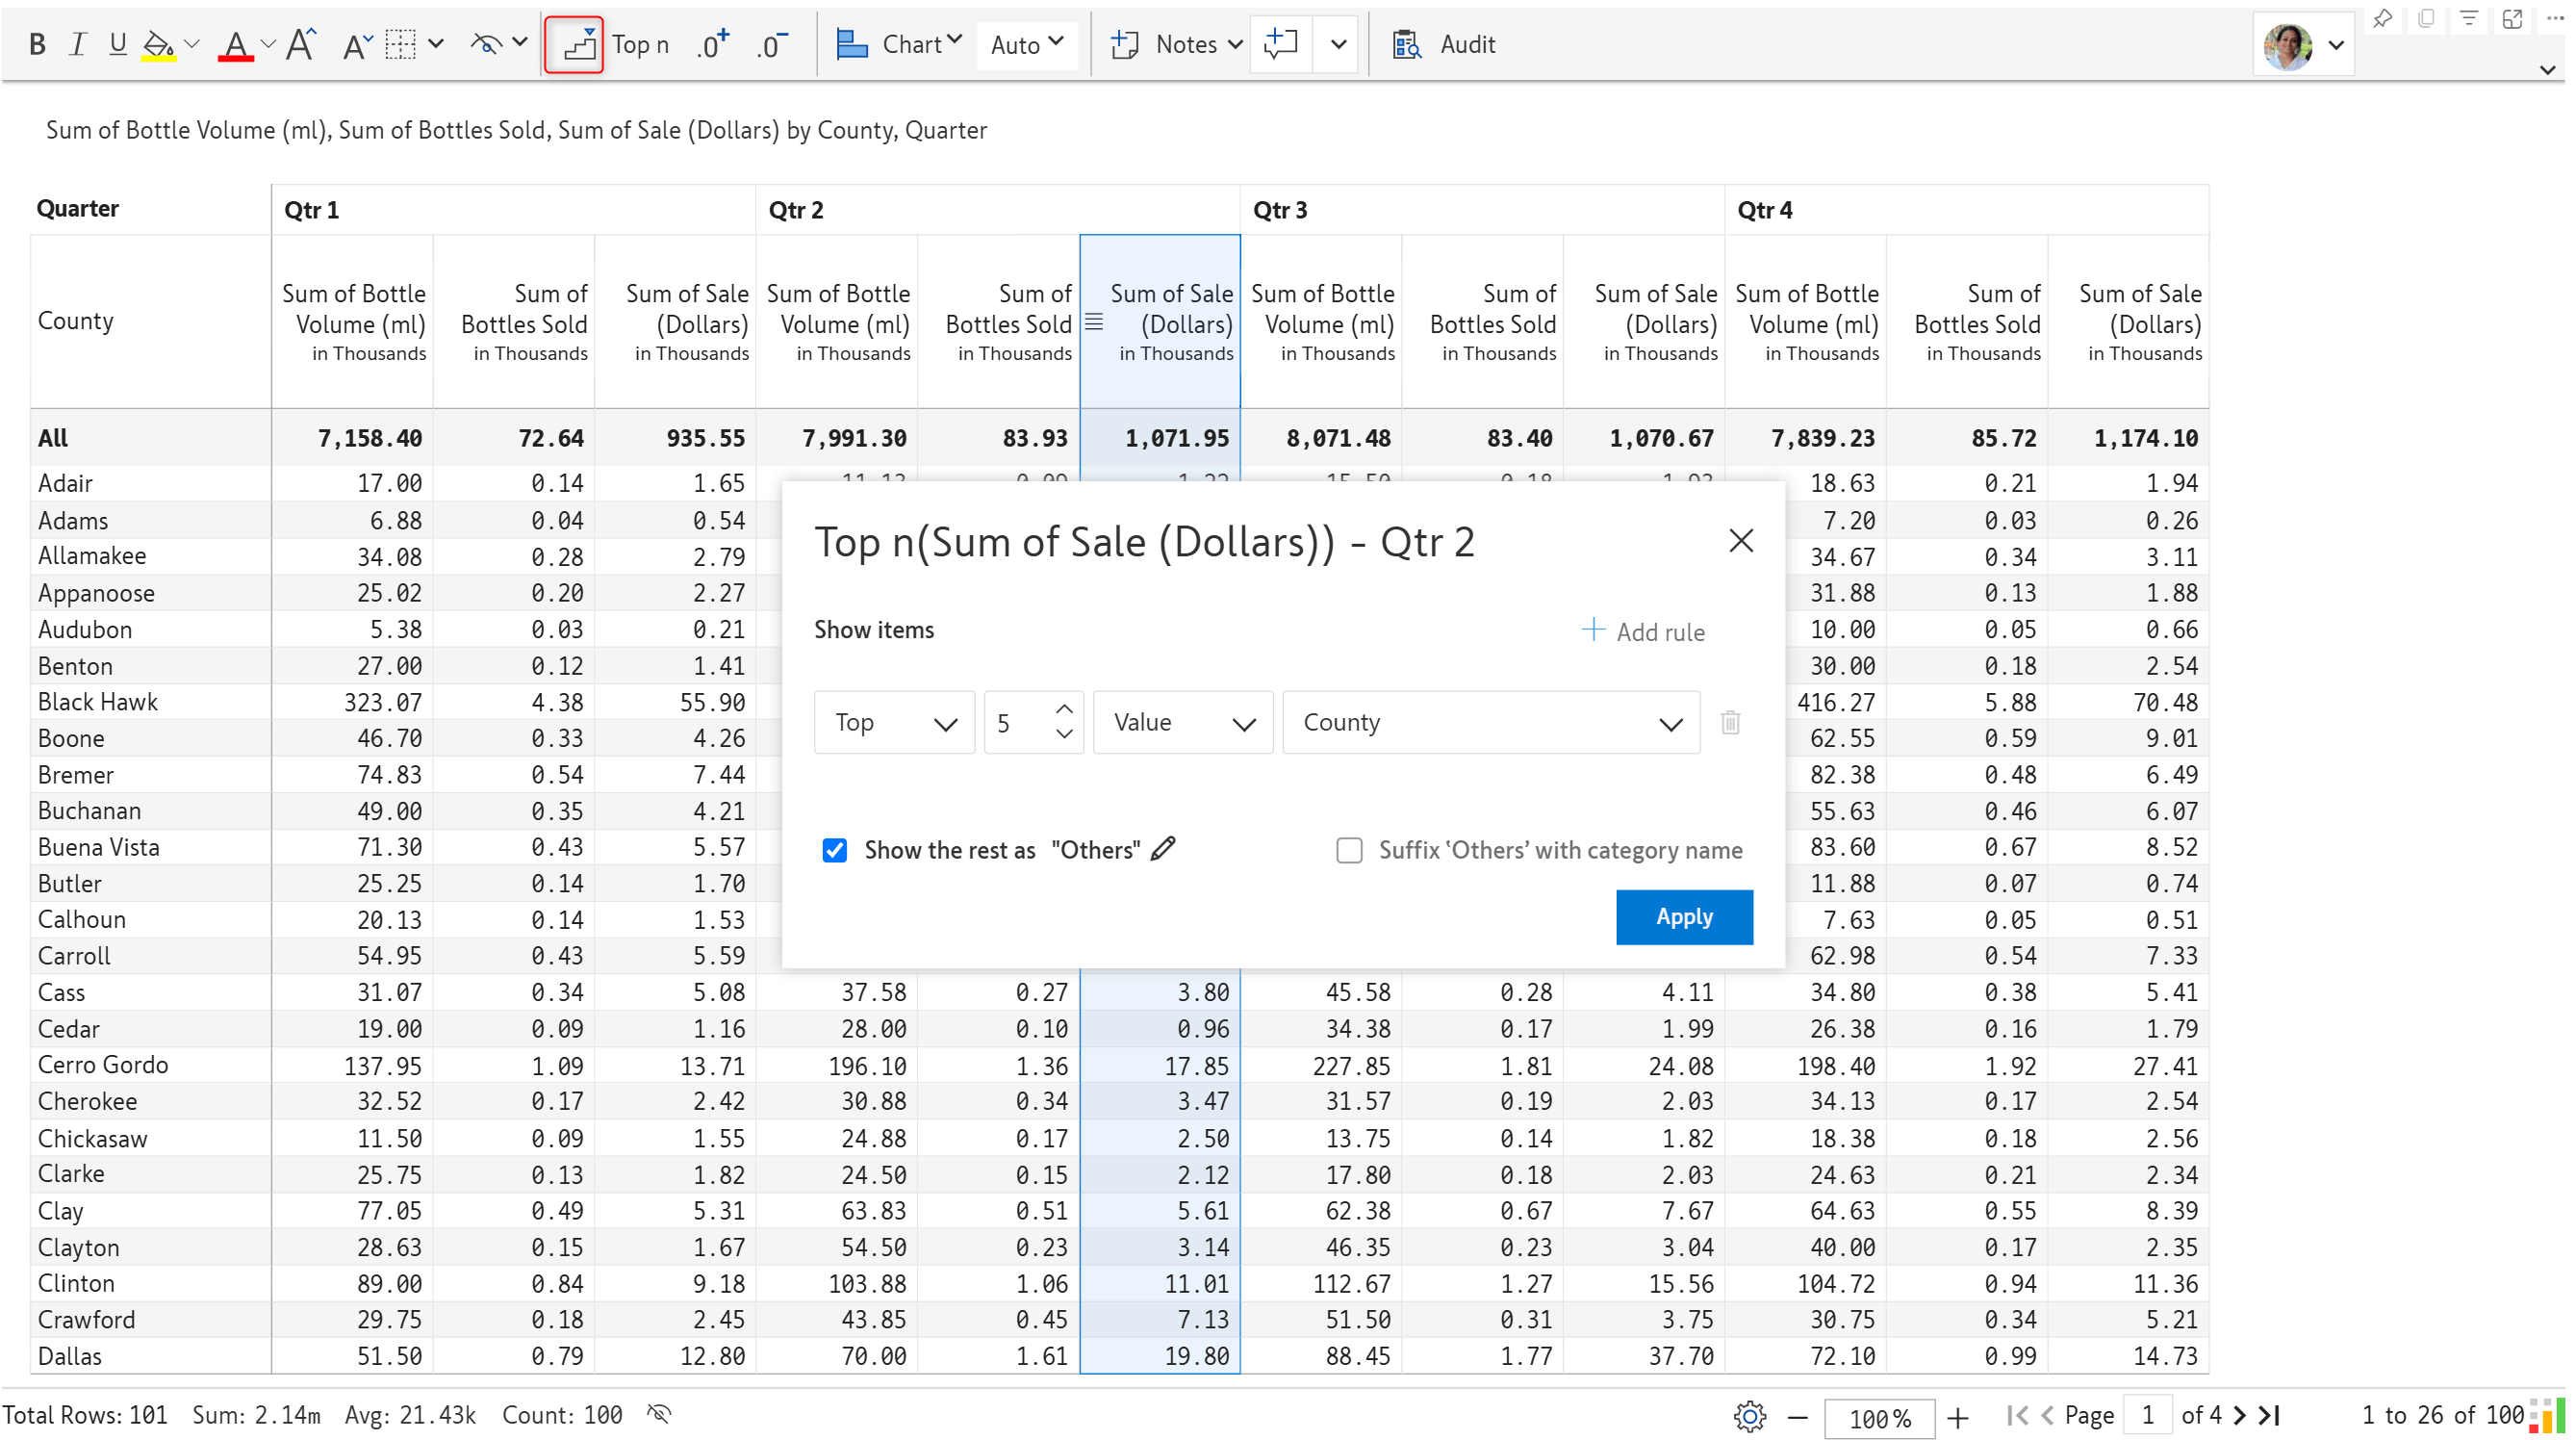
With Inforiver, you can bookmark top-performing or underperforming entities and instantly switch between them. Compared to presenting the global performance across all regions, ranking the top and bottom five performing regions would help stakeholders with faster decision-making, risk mitigation, and benchmarking.
The Pivot option allows you to create aggregated tables or views within the Inforiver visual with different combinations of row dimensions. When enabled, the Pivot Explorer retains all your pivot views so you can easily switch between them for analysis.
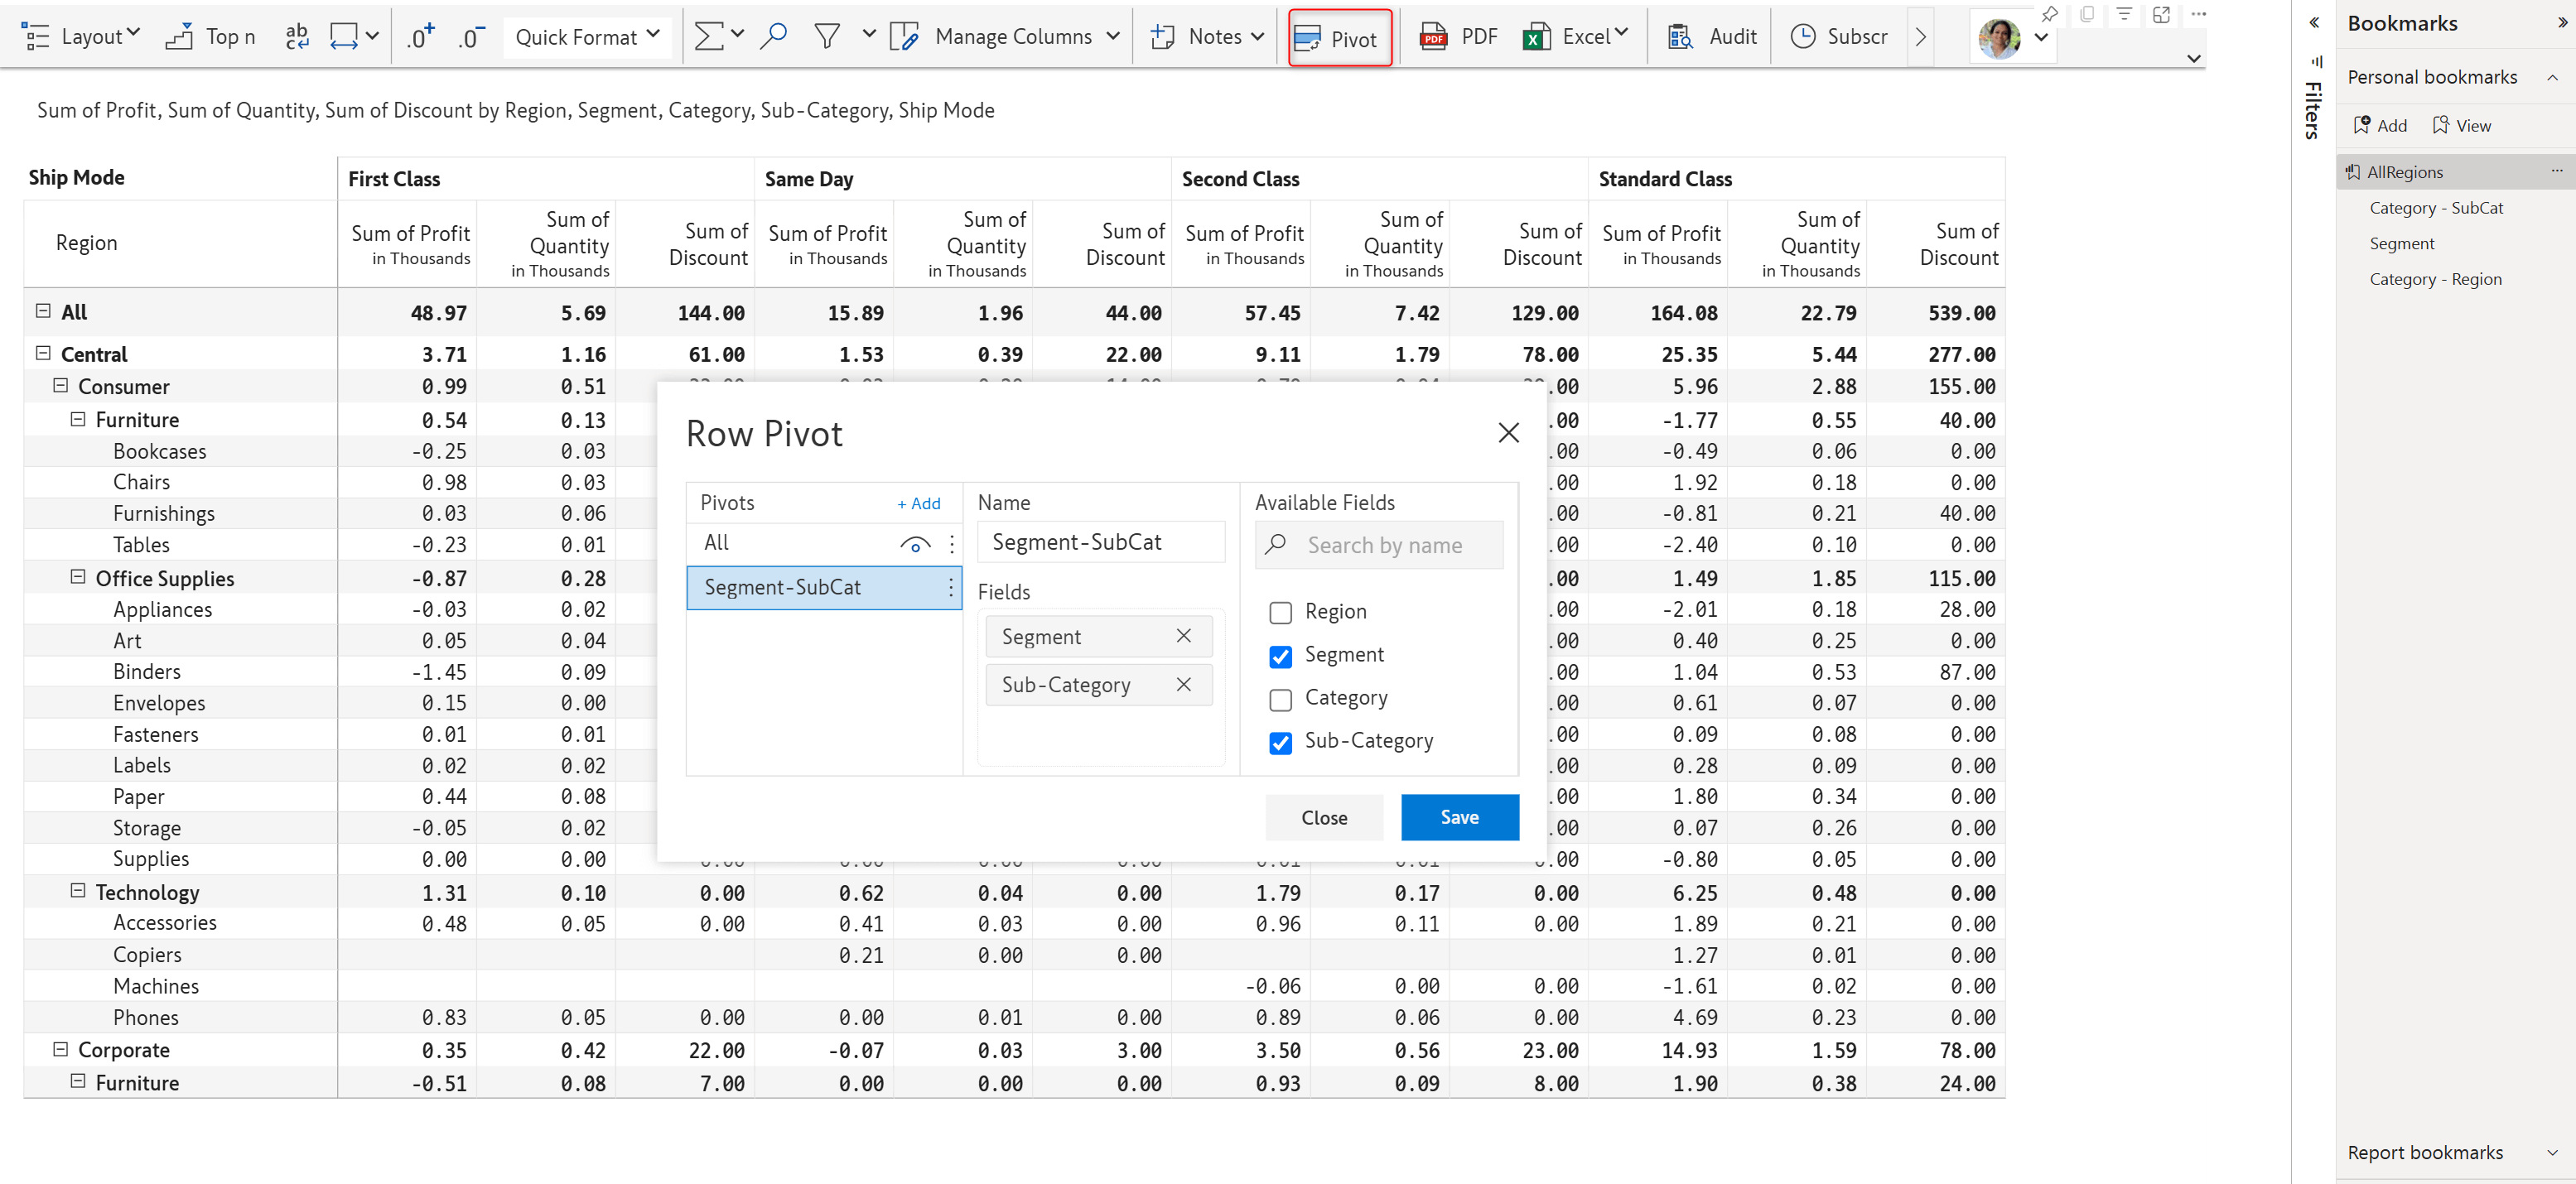
Pivoting data allows users to switch perspectives dynamically within the same report. You can persist pivoted reports in Inforiver with Power BI bookmarks.
Inforiver provides options to adjust the decimal precision and apply scaling (thousands, millions, billions, etc.) based on your data and target audience.
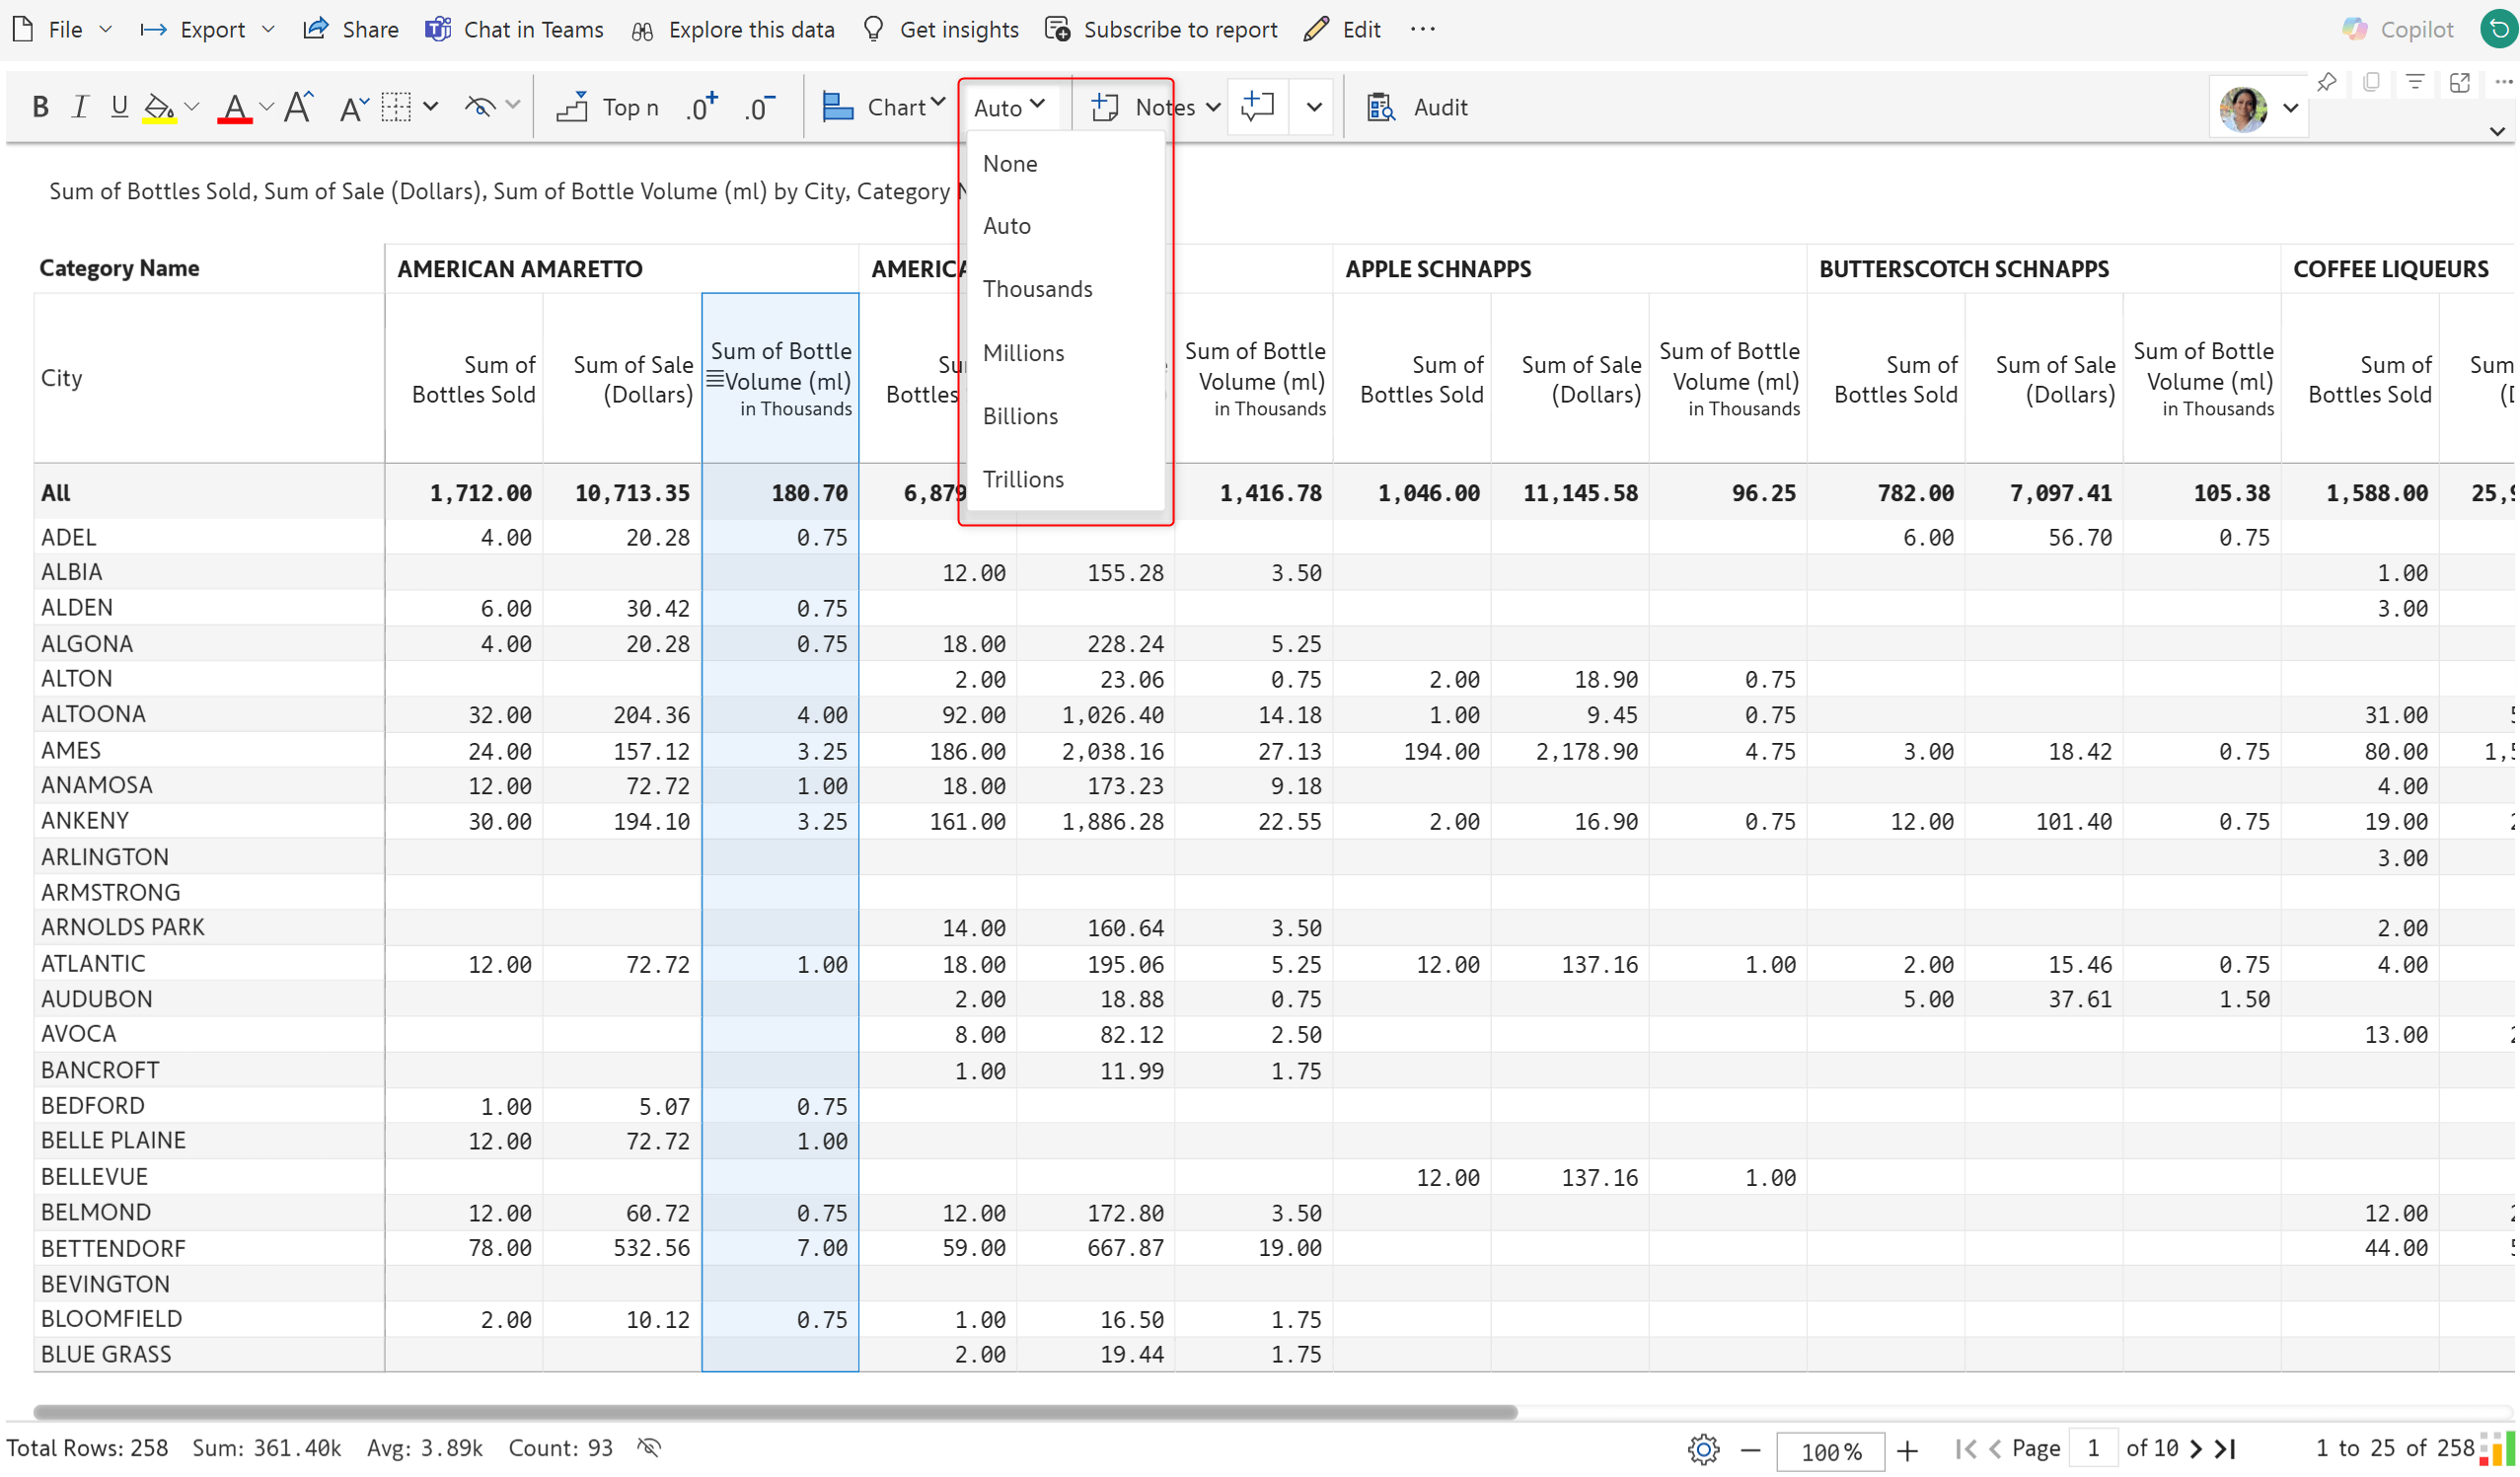
You can apply number formats that cater to specific audiences and bookmark them. For instance, marketing and sales teams prefer using rounded number formats. On the other hand, financial analysts require high precision for accurate analysis.
Inforiver Matrix is the best solution for collaborative planning and reporting in Power BI. Approvals are essential for maintaining data integrity when multiple people update the same report. You can set up custom approval workflows in Inforiver with built-in scripts or leverage the intuitive user interface. Learn more about approval workflows.
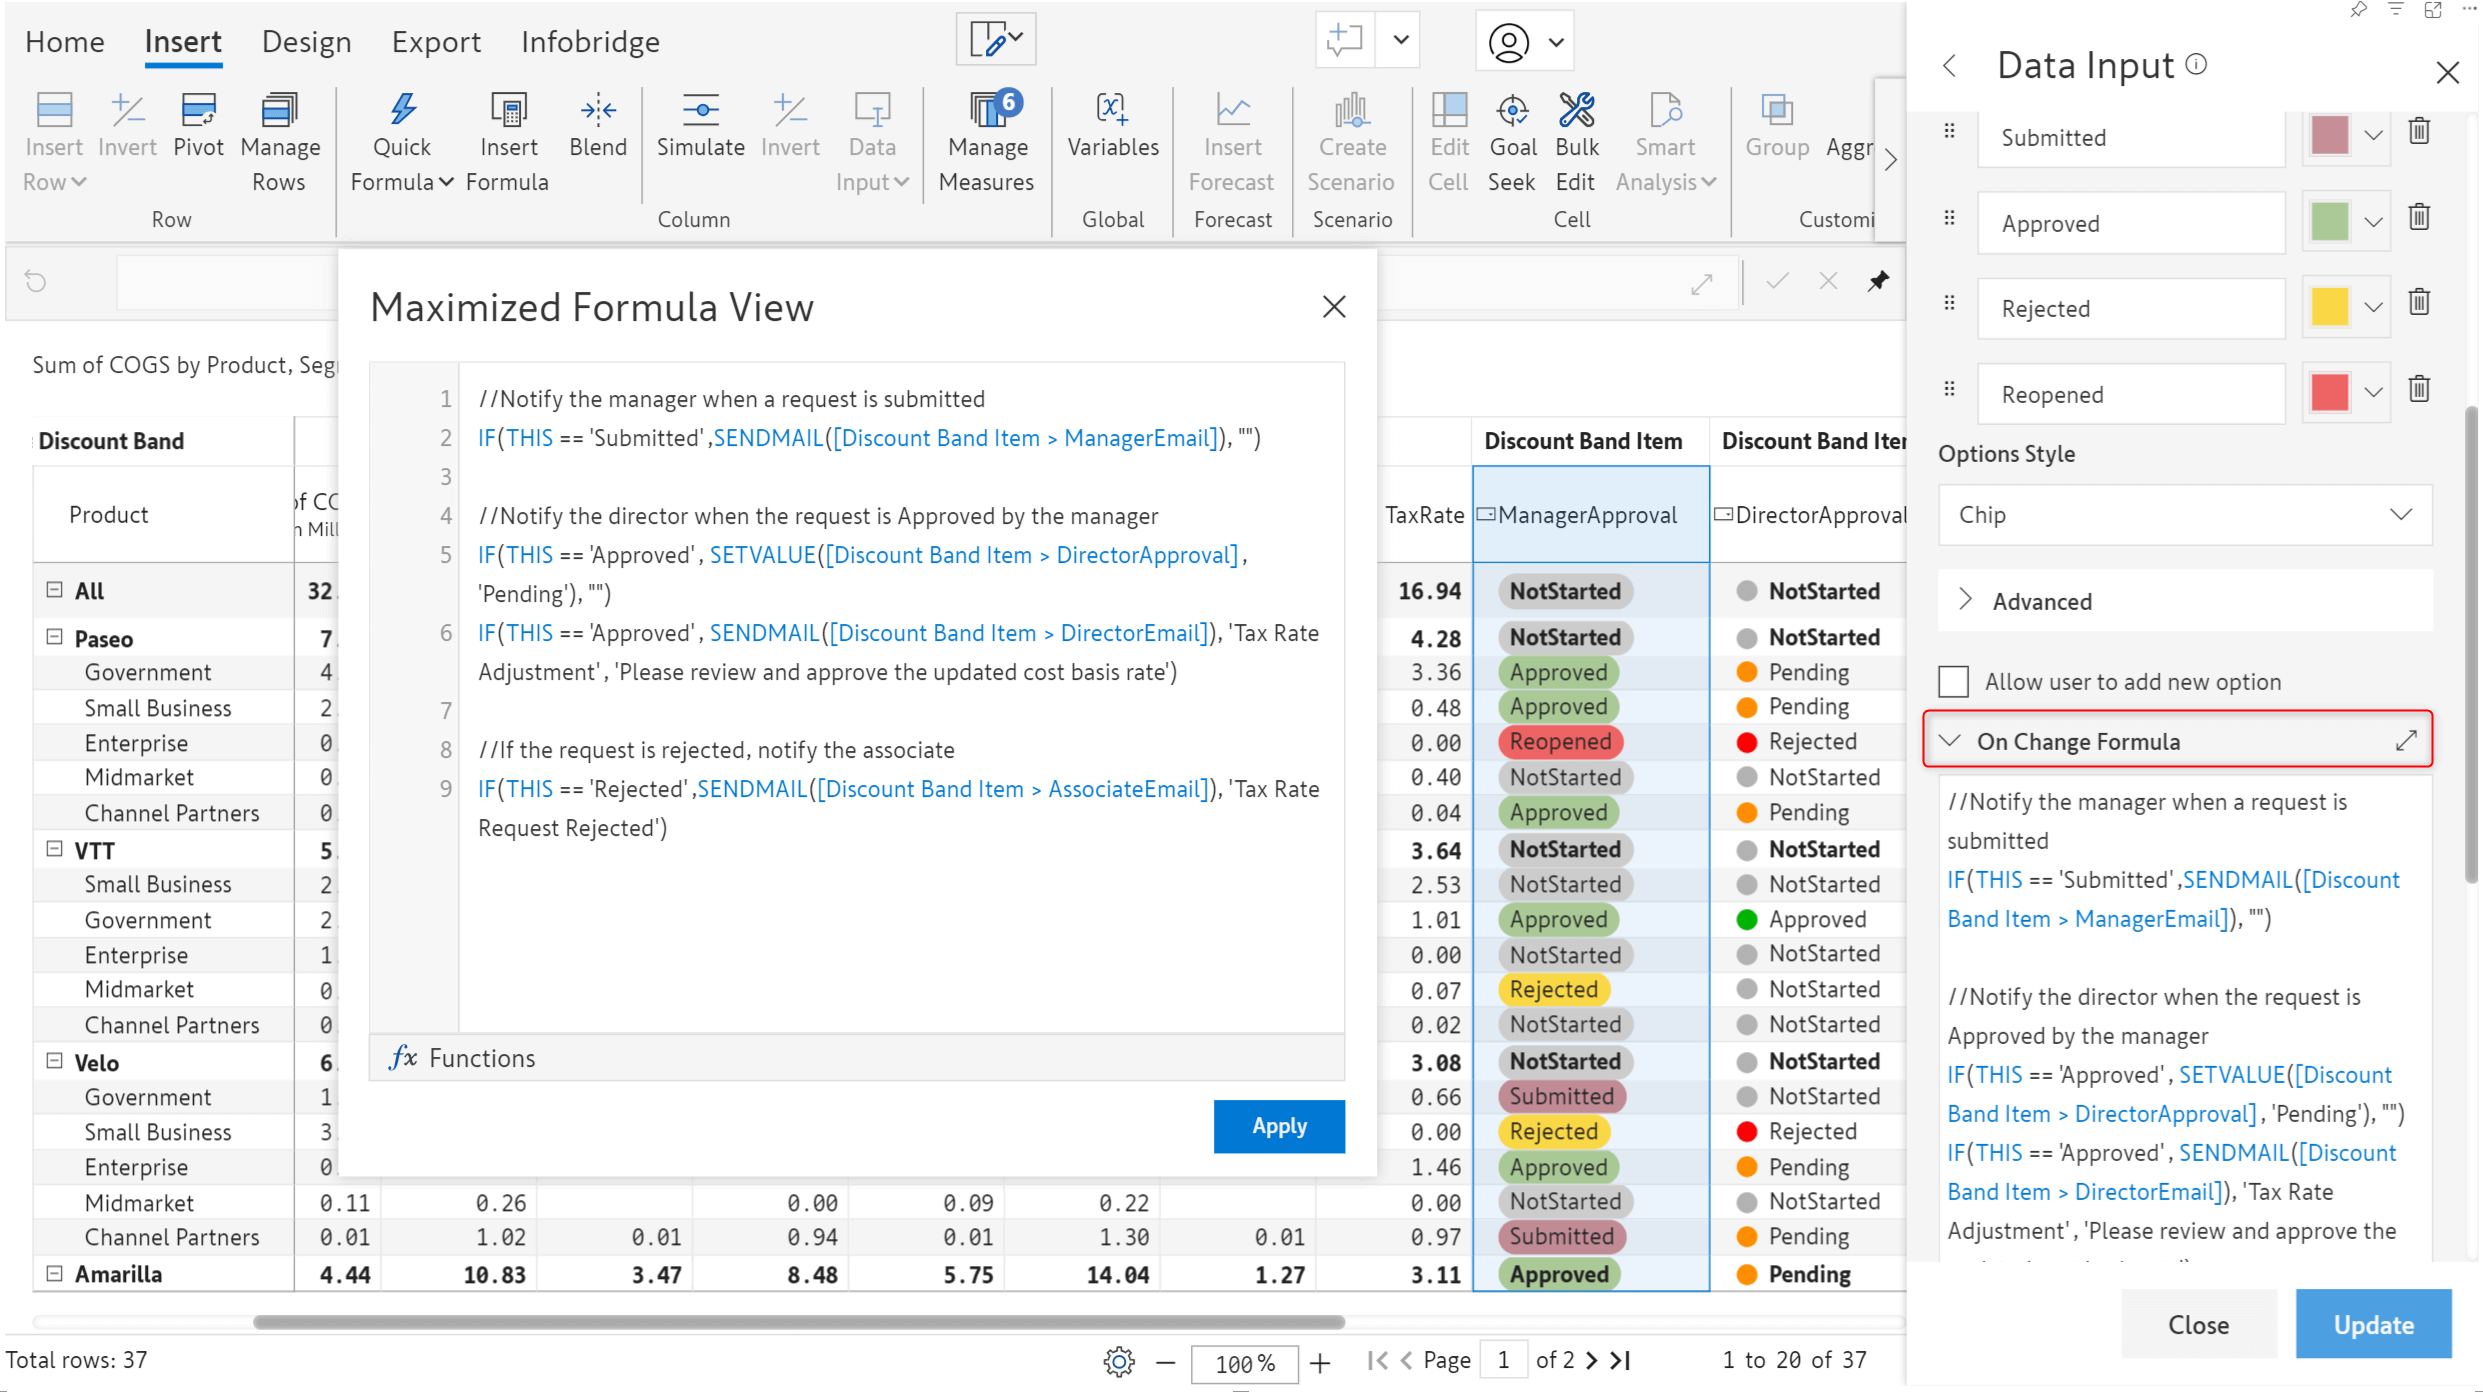
You can filter approval status fields and bookmark them for quick access, eliminating the need to reapply filters each time you check the status.
With Inforiver, you can apply a formula on cells – e.g., calculate the value increase based on an interest rate.
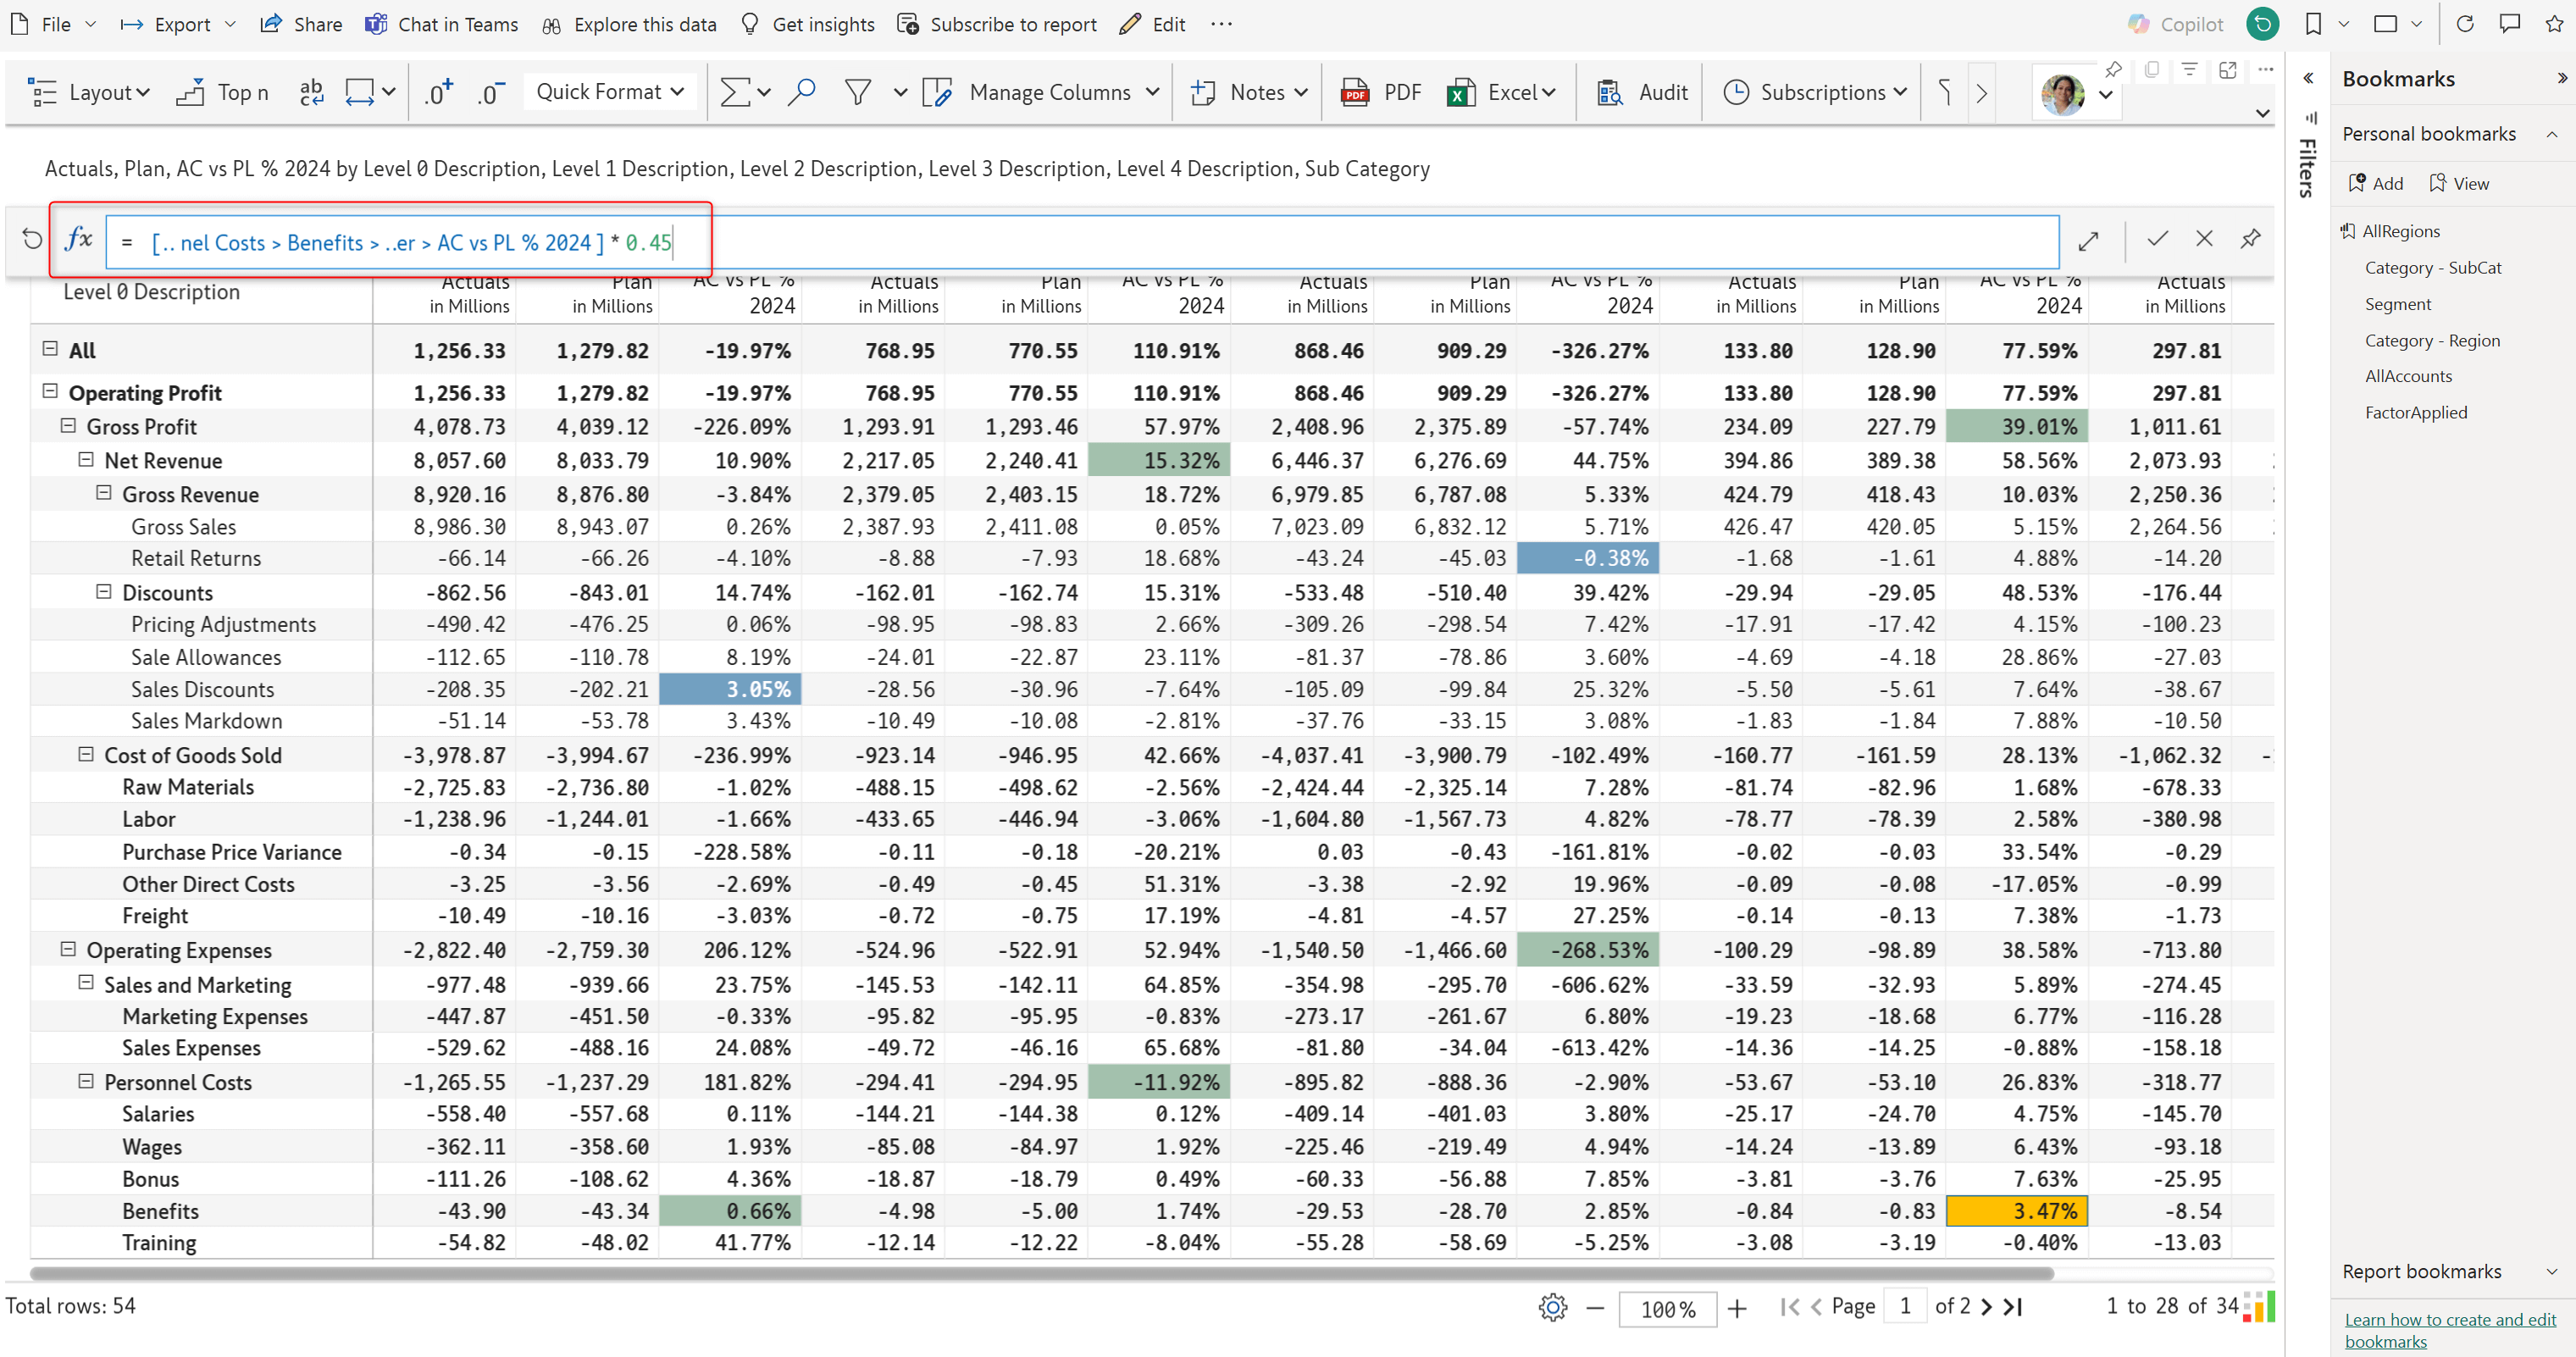
Bookmarks are instrumental in saving calculated values, enabling you to compare your data across different benchmarks or rates. In this report, the values change based on a formula used on the highlighted cells within the FactorApplied bookmark.
Inforiver provides extended support for handling hierarchical data. One key feature is aggregating row and column hierarchies to capture the subtotals and grand totals at each level.
Depending on whether you want to present your data at a higher level or more detailed level, use bookmarks to save aggregation changes like enabling or disabling row and column totals.
To learn more about the latest from Inforiver and why we are garnering recognition from industry experts, check out our newest brochure.
Inforiver and all our planning and analytics products continue to be updated to provide a diverse range of users with optimal performance. With continual improvements and innovations planned, we welcome your feedback.
If you’re ready to level up your planning, reporting, and analytics, try it for free today.

Inforiver helps enterprises consolidate planning, reporting & analytics on a single platform (Power BI). The no-code, self-service award-winning platform has been recognized as the industry’s best and is adopted by many Fortune 100 firms.
Inforiver is a product of Lumel, the #1 Power BI AppSource Partner. The firm serves over 3,000 customers worldwide through its portfolio of products offered under the brands Inforiver, EDITable, ValQ, and xViz.