Upcoming webinar on 'Inforiver Charts : The fastest way to deliver stories in Power BI', Aug 29th , Monday, 10.30 AM CST. Register Now
Upcoming webinar on 'Inforiver Charts : The fastest way to deliver stories in Power BI', Aug 29th , Monday, 10.30 AM CST. Register Now
In Power BI, large datasets demand more than visualization—they require clarity on how many rows are shown, both overall and after filters or logic.
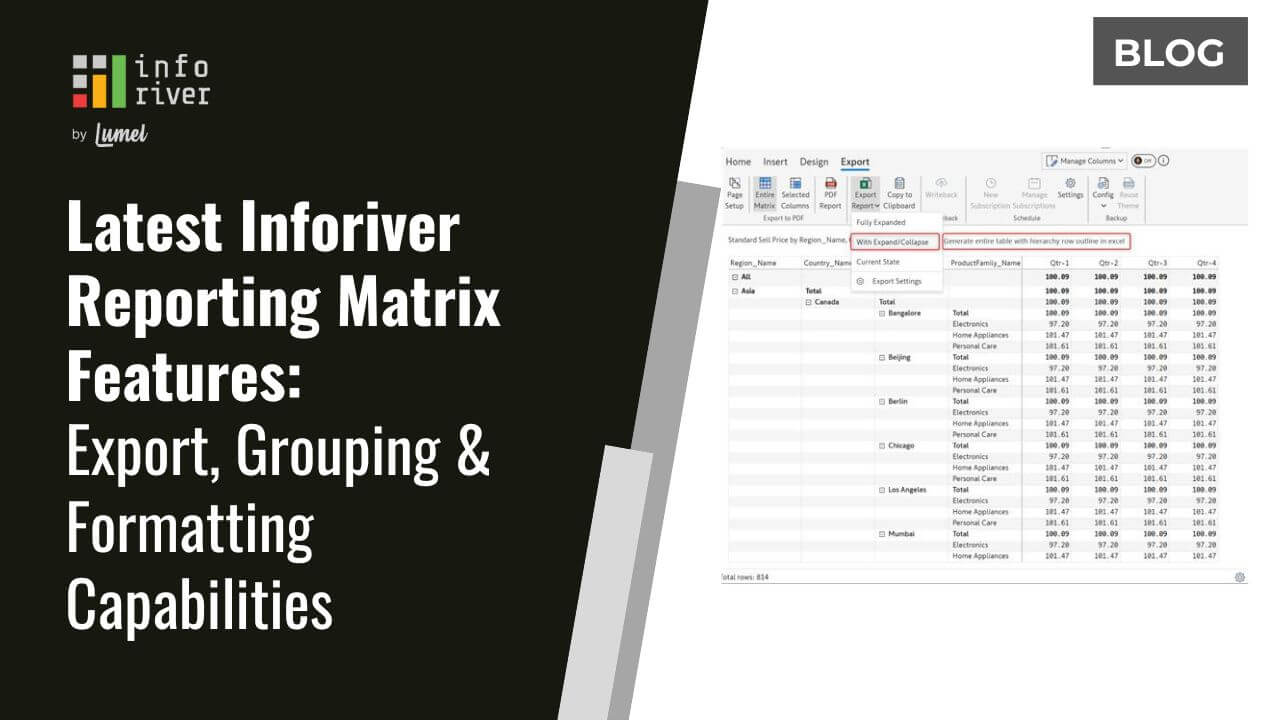
Learn how to show total and visible row counts in Power BI using Inforiver Reporting Matrix—no DAX required for clearer, more transparent reports.
A Power BI row count shows the number of records in a matrix visual. Total row count displays all underlying data, while visible row count reflects only filtered or displayed rows.
Row counts serve multiple purposes:
Inforiver offers two types of row counts — each serving a specific analytical purpose.
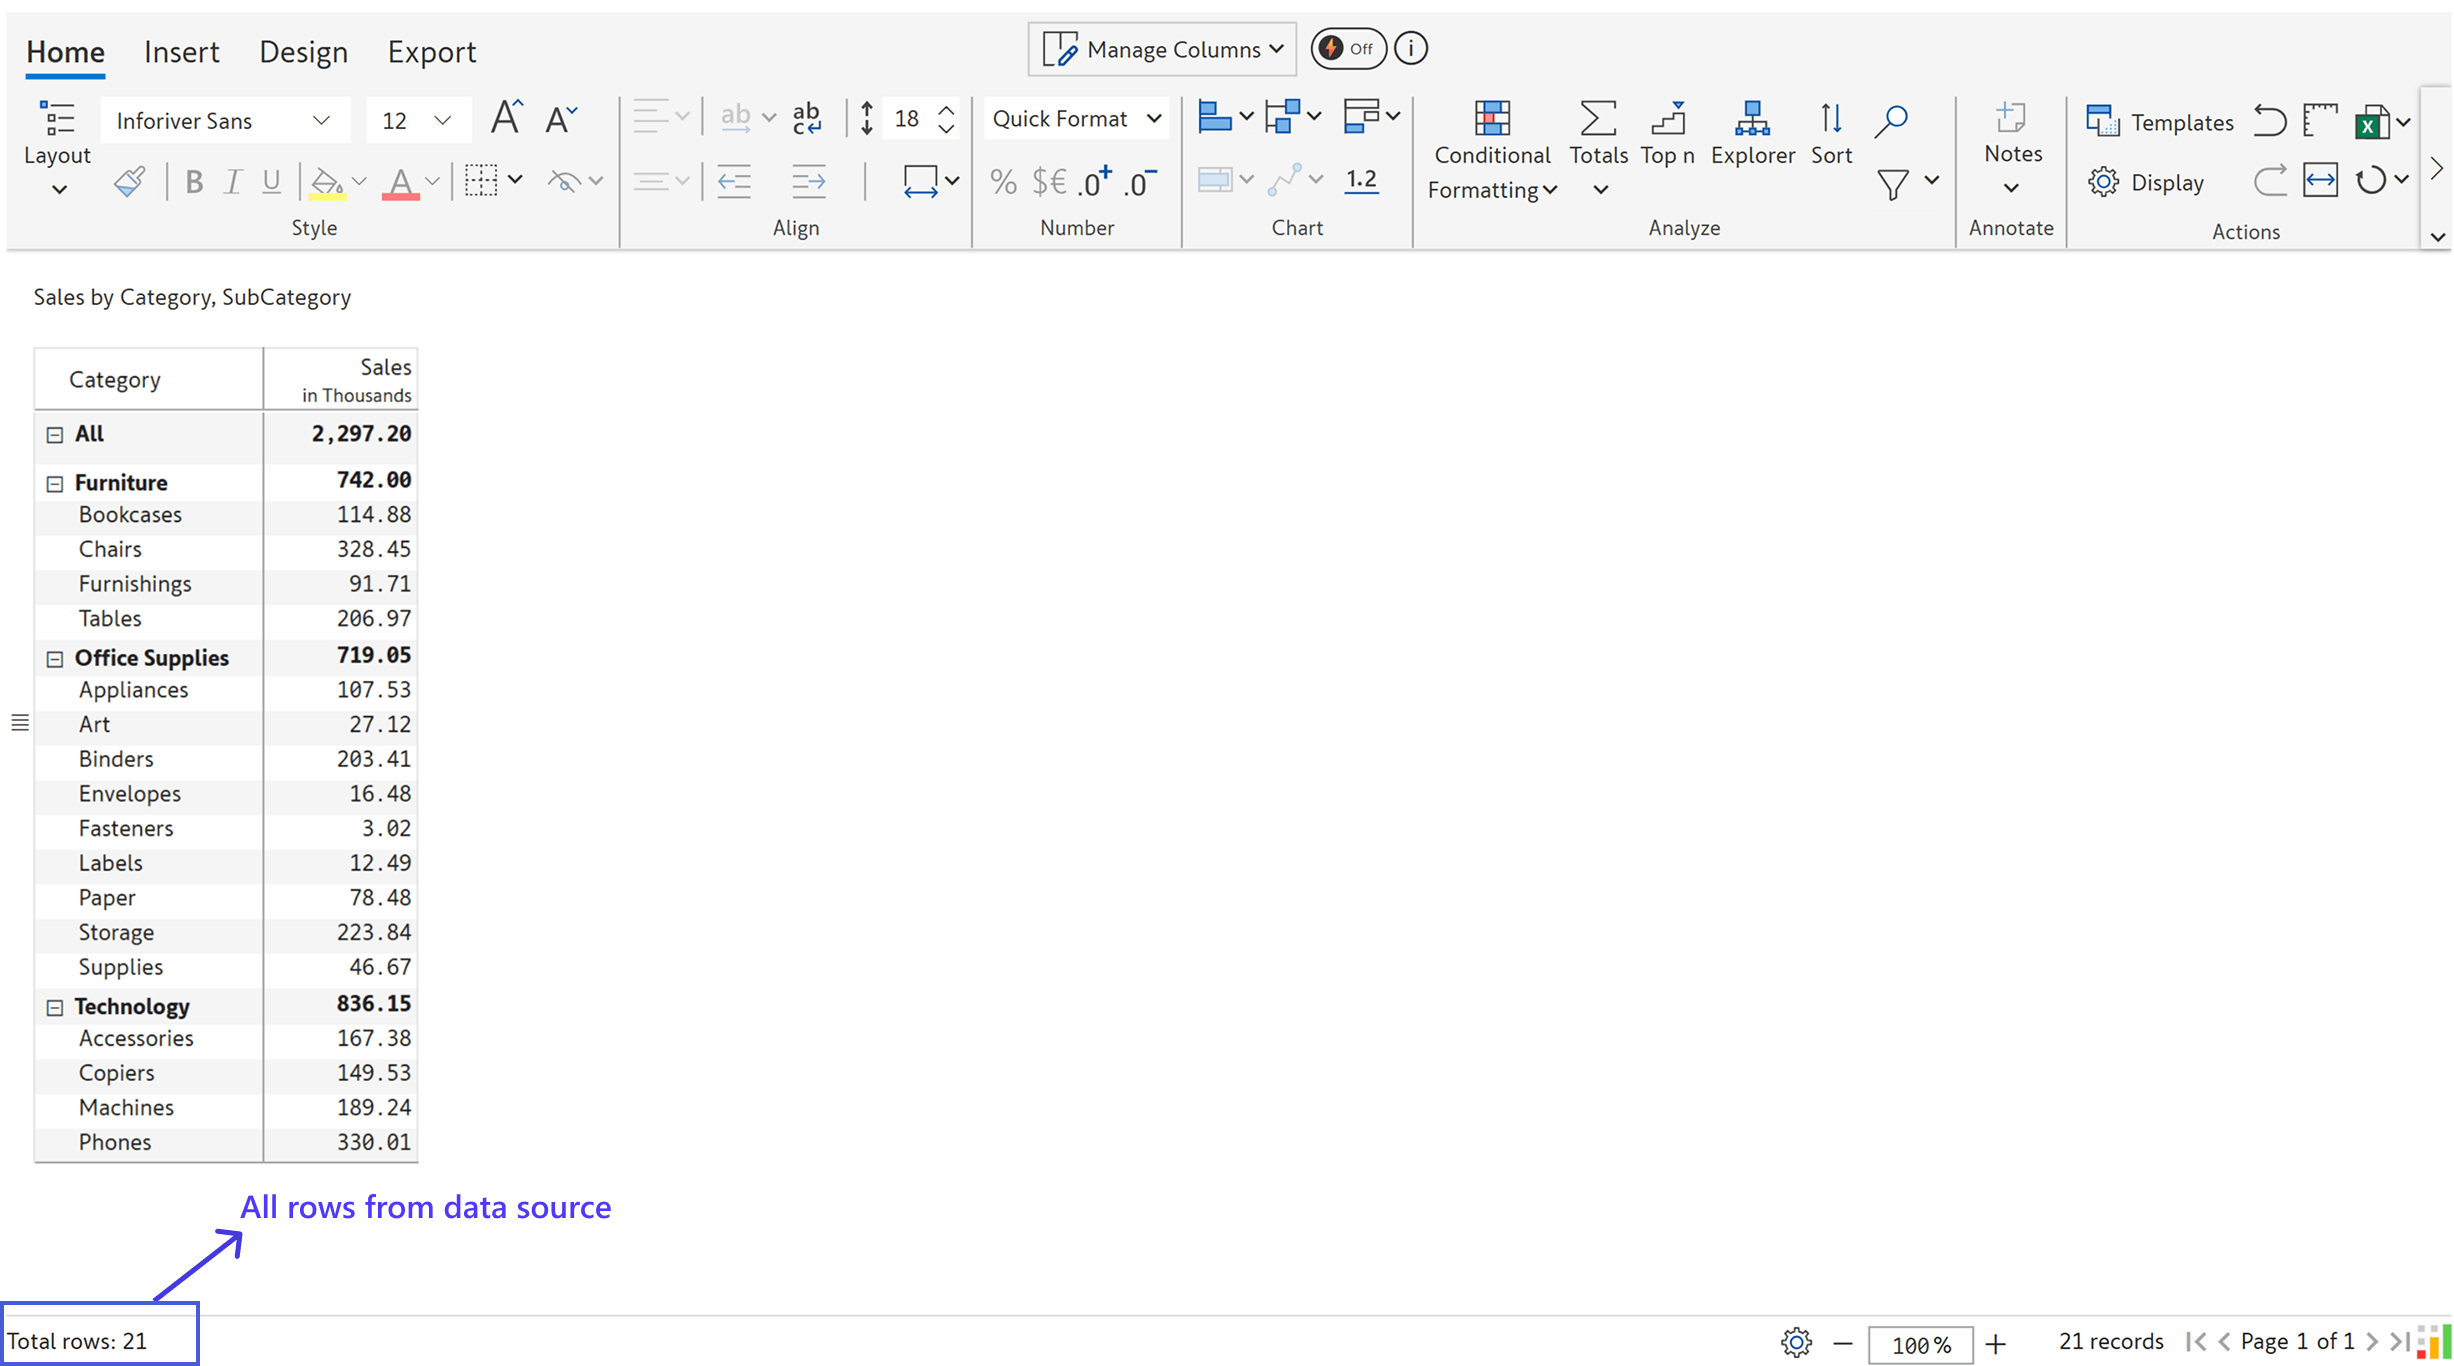
This option displays the total number of records passed to the visual from the data source, regardless of whether they are visible in the matrix.
Use Case:
Ideal for developers and data stewards who want to ensure the full dataset is being loaded and that no rows are excluded unintentionally.
⚙️ How to Enable:
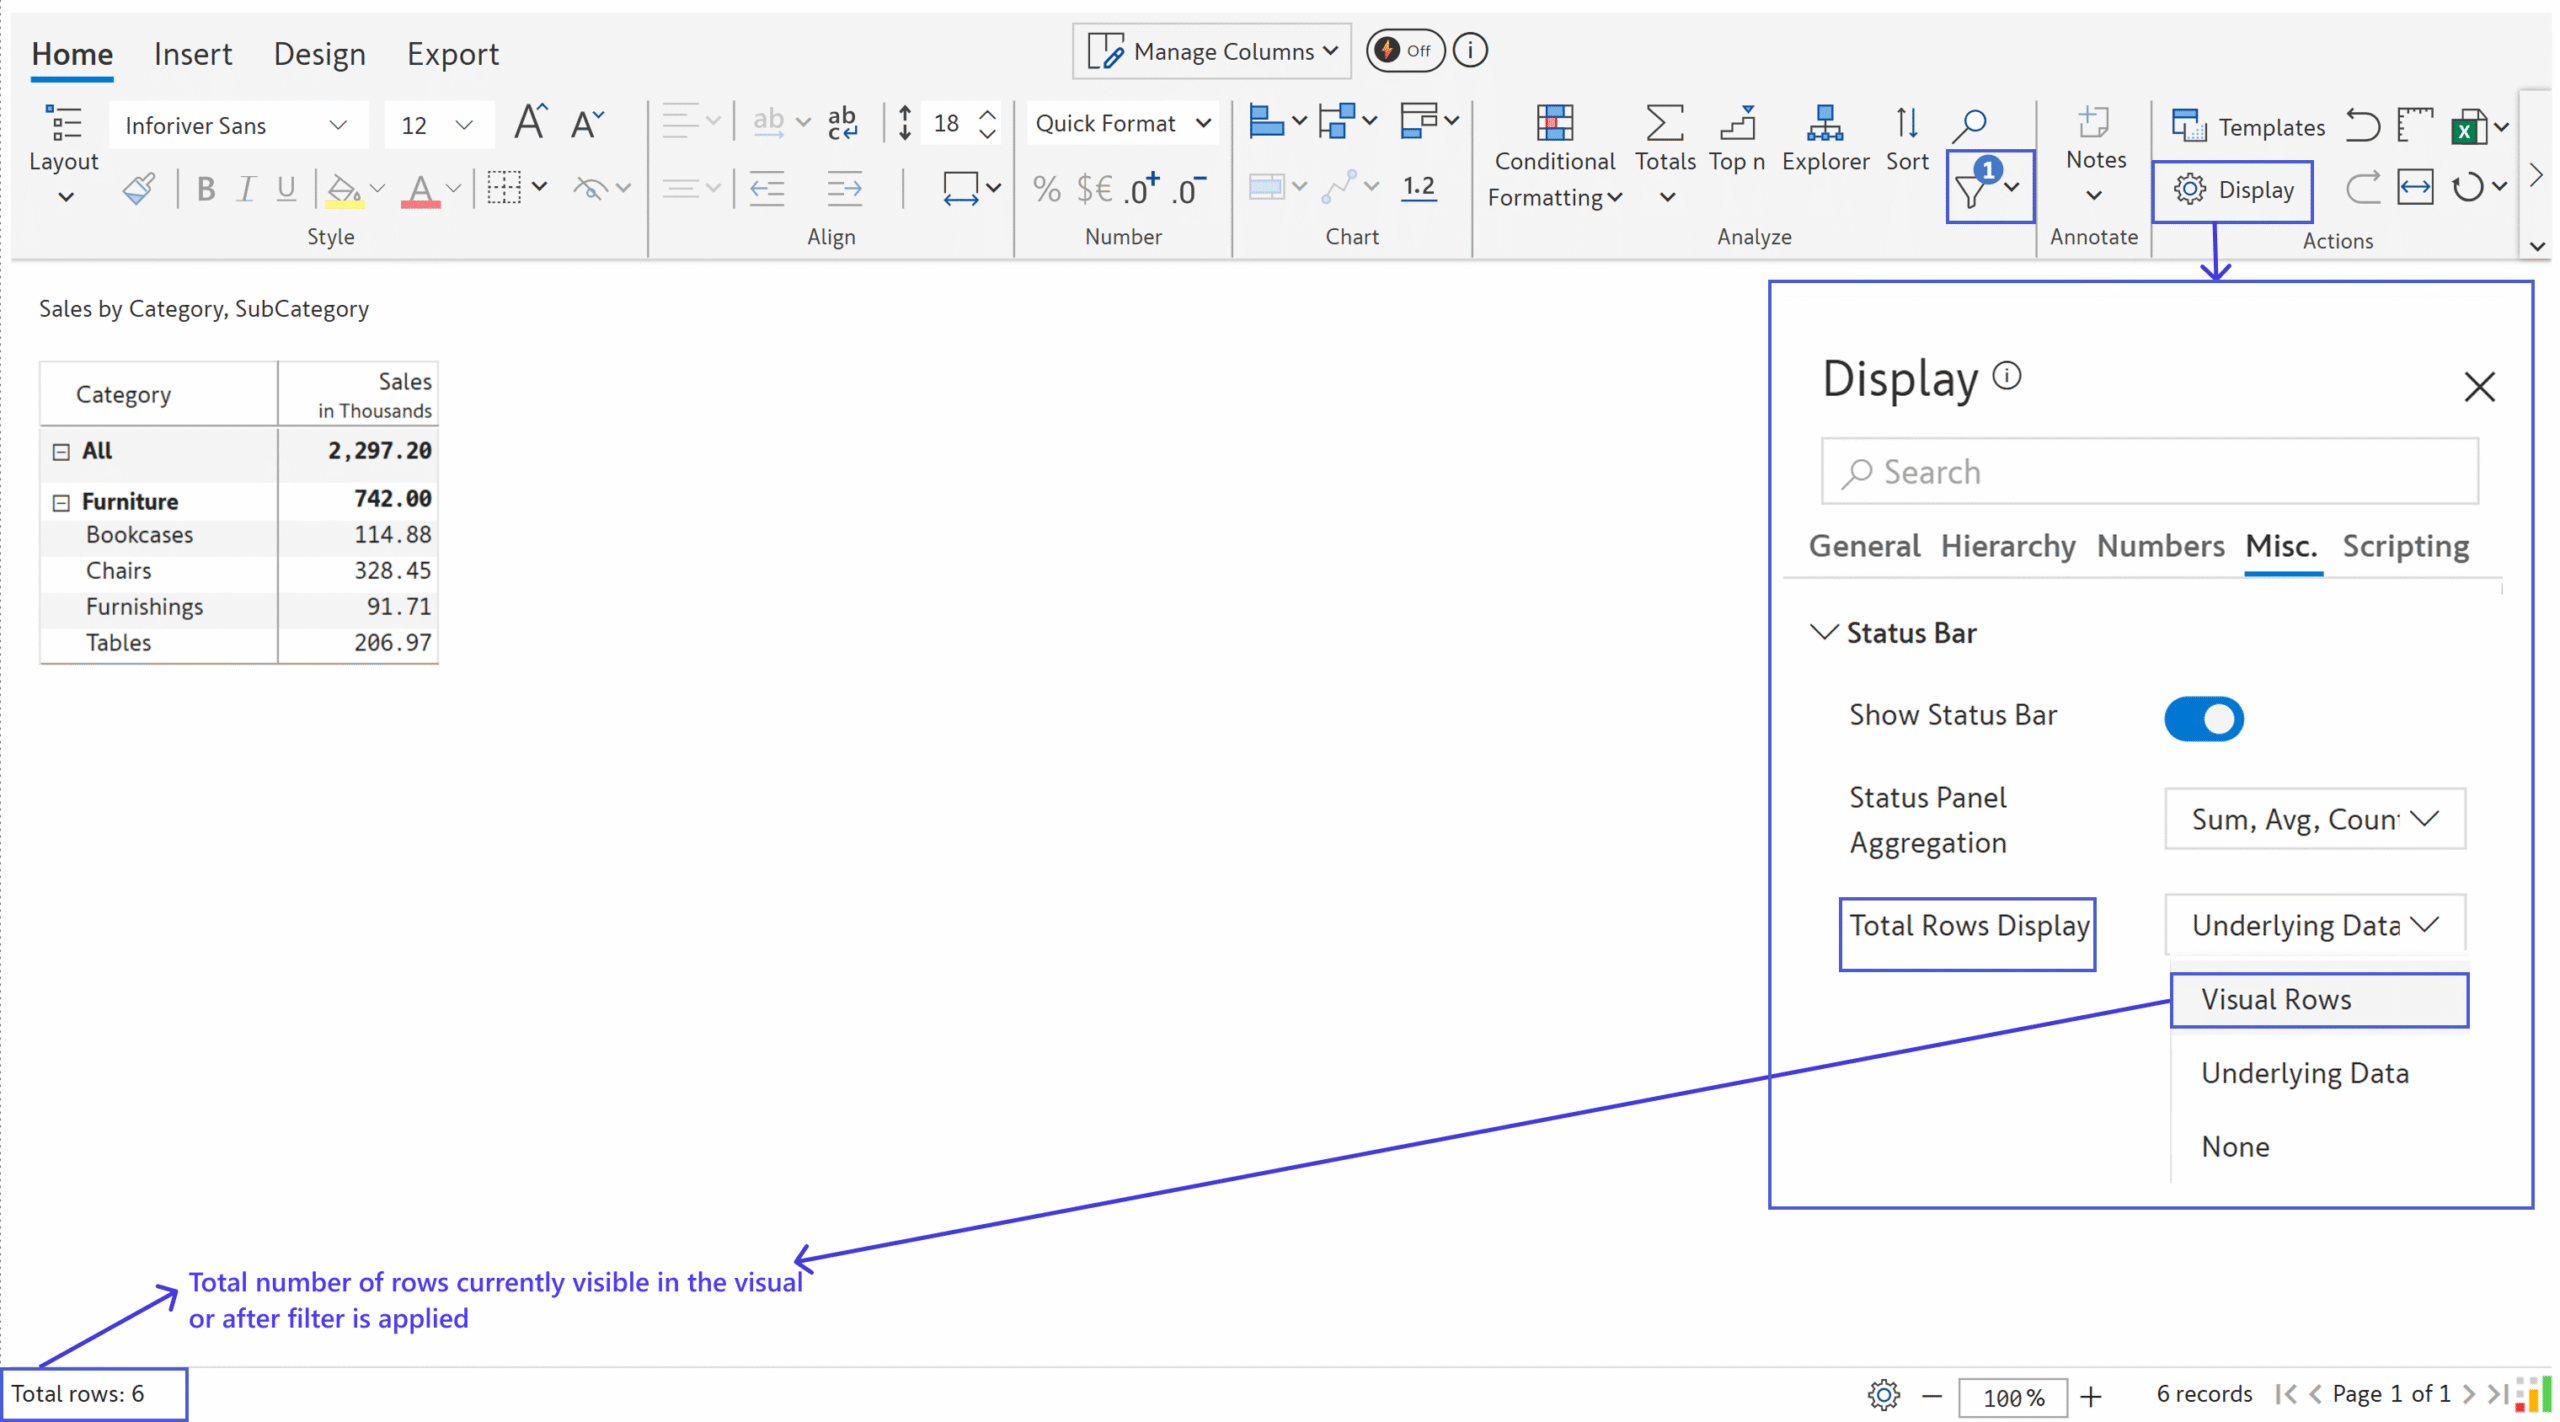
Go to: Display > Misc > Status Bar > Total Rows Display > Underlying Data (data source)
📝 Example:
If your data has 21 rows and you’ve applied a Inforiver filter, this count still shows 21.
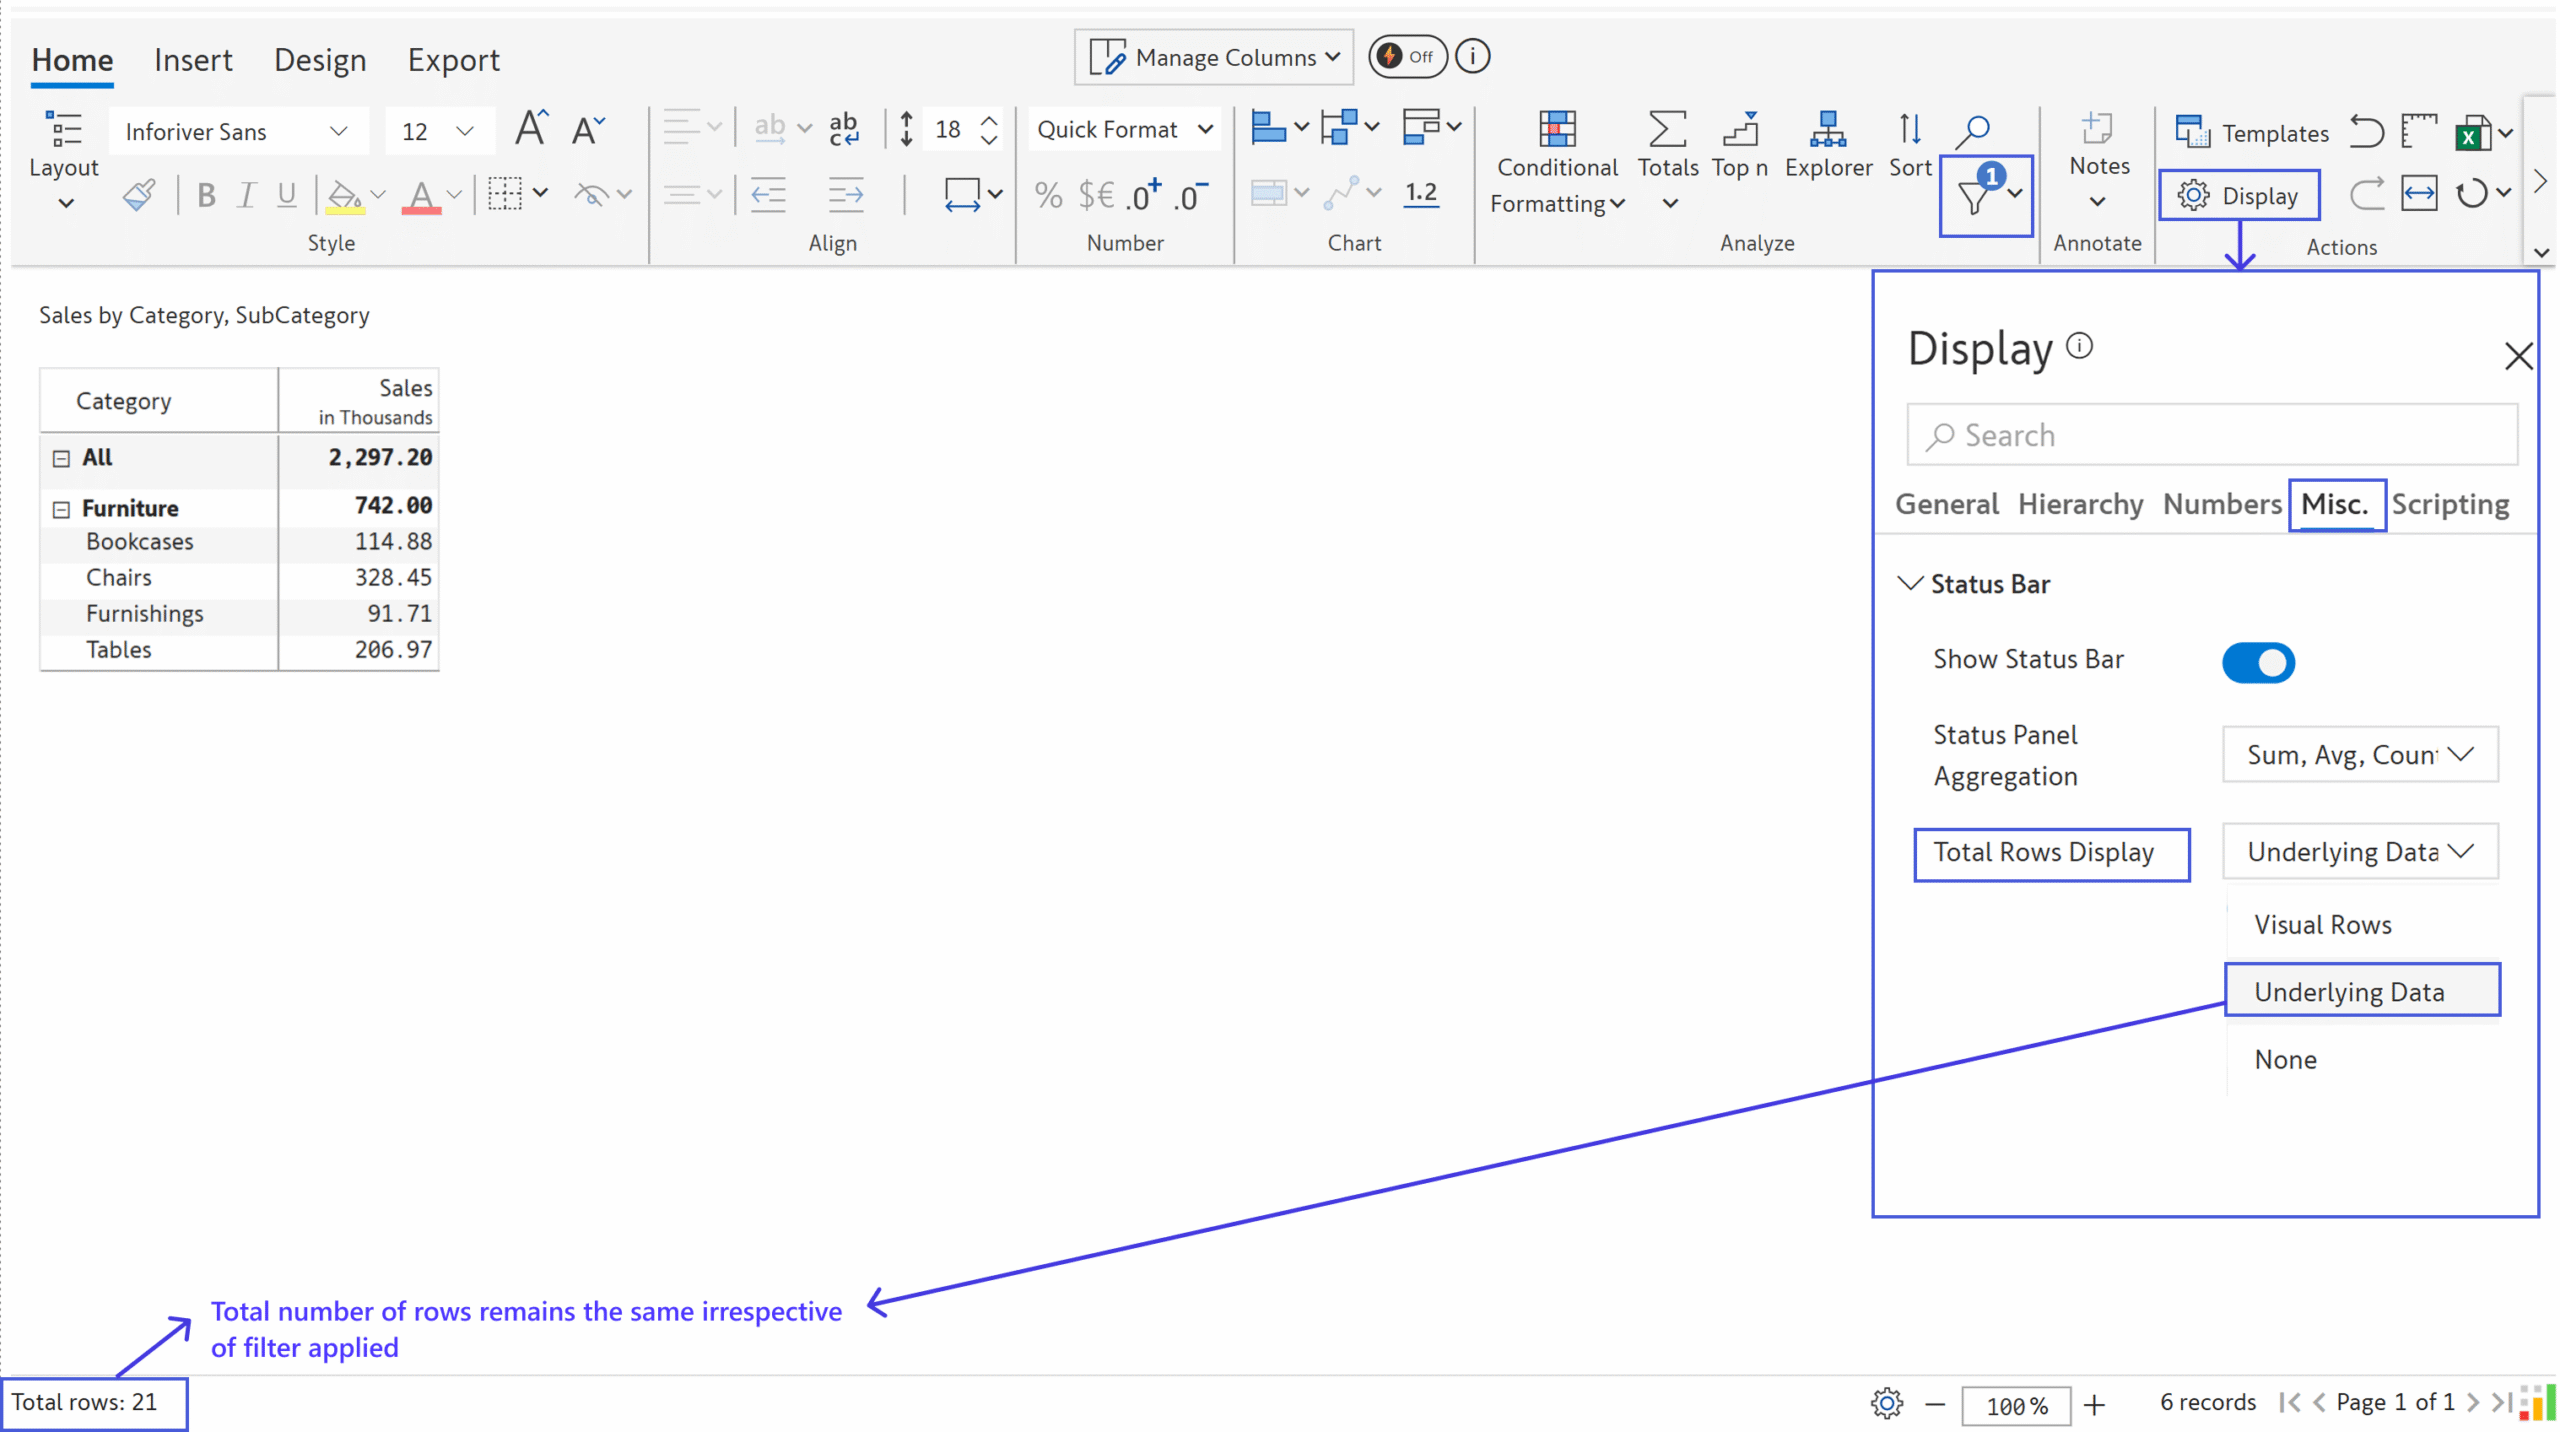
This count reflects the actual number of rows currently displayed in the matrix — after applying filters, slicers, Top N logic, or manual row hiding.
Use Case:
Perfect for end users who need to know exactly how many items they’re currently viewing on screen.
How to Enable:
Go to: Display > Misc > Status Bar > Total Rows Display > Visible Rows
📝 Example:
You may apply a filter and this count will dynamically update to reflect just those visible entries (e.g., 6 rows).
Inforiver Reporting Matrix is available on Microsoft AppSource and can be added to your Power BI reports in just a few clicks.
Learn more about Inforiver Reporting Matrix for enterprise Power BI reporting and explore the Inforiver BI Bundle to take your Power BI reporting further.

Inforiver helps enterprises consolidate planning, reporting & analytics on a single platform (Power BI). The no-code, self-service award-winning platform has been recognized as the industry’s best and is adopted by many Fortune 100 firms.
Inforiver is a product of Lumel, the #1 Power BI AppSource Partner. The firm serves over 3,000 customers worldwide through its portfolio of products offered under the brands Inforiver, EDITable, ValQ, and xViz.